My Conferecence Publication
17
Experimental Performance Analysis of Sound Source Detection with SRP PHAT-β Anand Ramamurthy, Harikrishnan Unnikrishnan, Kevin. D. Donohue UNIVERSITY OF KENTUCKY College of Engineering Department of Electrical and Computer Engineering Center For Visualization & Virtual Environments Funded in part by NSF EPSCoR Program
-
Upload
harikrishu -
Category
Technology
-
view
278 -
download
3
Transcript of My Conferecence Publication
Experimental Performance Analysis of Sound Source Detection with
SRP PHAT-β Anand Ramamurthy,
Harikrishnan Unnikrishnan, Kevin. D. Donohue
UNIVERSITY OF
KENTUCKY College of Engineering
Department of Electrical and Computer EngineeringCenter For Visualization & Virtual Environments
Funded in part by NSF EPSCoR Program
Sound Source Detection
• Objective :– To detect and locate a sound source within a
space of interest.
• Approach– Using spatially distributed microphone array.
• Application– Speech recognition – Teleconferencing
– Security surveillance

Objective
• Detection analysis with experimental data to compare the impact of various implementations of whitening process to enhance sound source detection.

Steered Response Power
• Robust algorithm
• Especially in the presence of multiple interfering sources
• Each point defined by a unique set of delays to the microphone array
z

• Signals received at each microphone aligned together by adding appropriate delay.
• Coherent power is computed
• Power estimate used for detection and localization.
Steered Response Coherent Power

SRCP
∑Compute
Coherent Power
(x,y,z)
1τ
2τ
mτ
1τ 2τ mτUniquely defines (x,y,z)

SRCP …
• Power estimates get corrupted by noises– Interfering sources and ambient noise
(Uncorrelated)
– Reverberations (Highly Correlated)
Coherent Summation
Incoherent Summation

PHAT
• Phase Transform – Spectral whitening
• Lower frequencies have higher contribution to signal power.
• Higher frequencies also contains significant information (phase).
• SRCP- PHAT is a measure of coherence and not the signal magnitude.
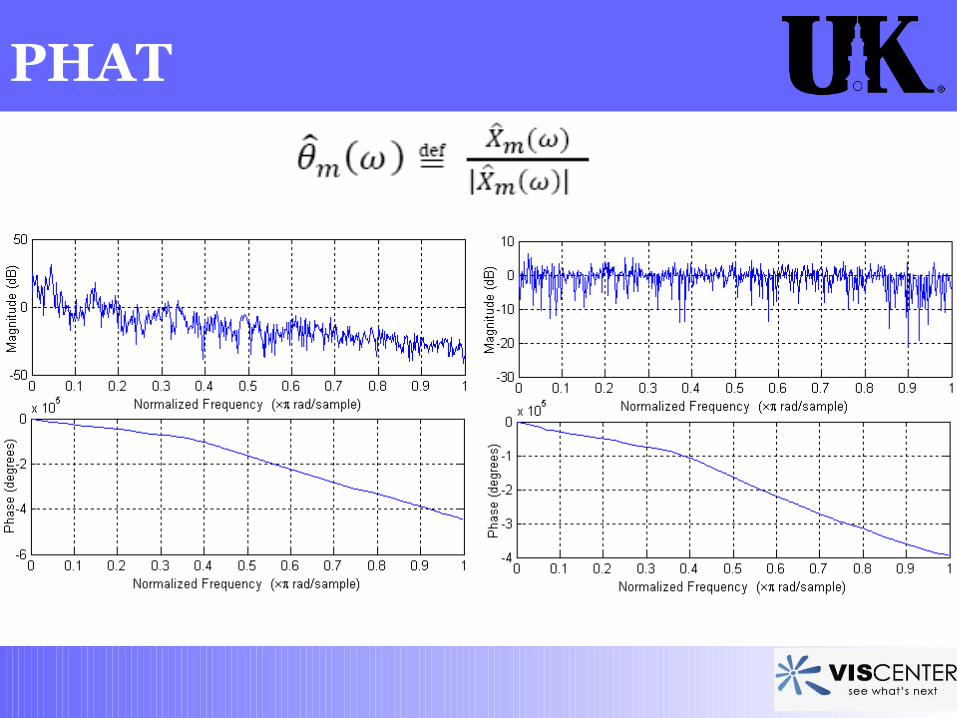
PHAT
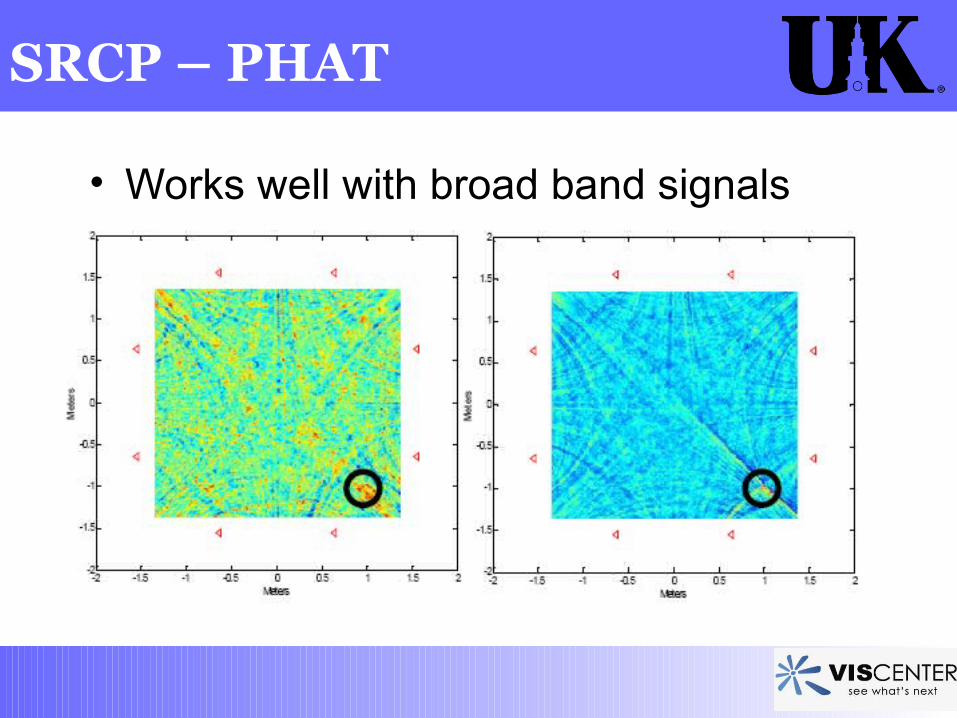
SRCP – PHAT
• Works well with broad band signals
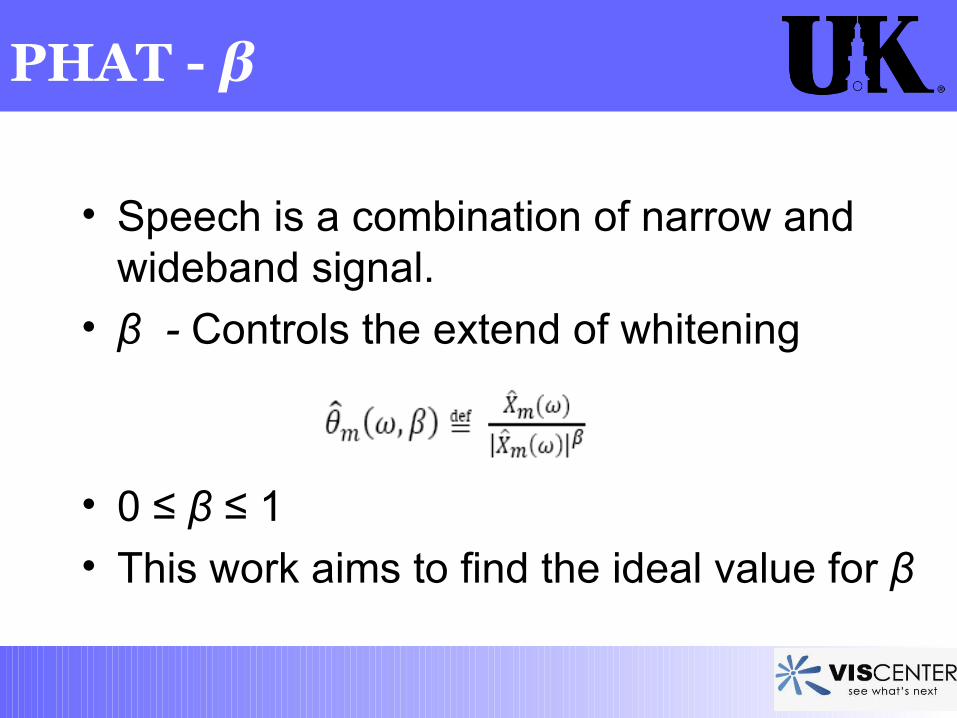
PHAT - β
• Speech is a combination of narrow and wideband signal.
• β - Controls the extend of whitening
• 0 ≤ β ≤ 1
• This work aims to find the ideal value for β

Experimental Setup
Speakers (sound source)
Off
ice
Wa
ll
Microphones
Field of View

Test Signals Used
• Broad band : 400Hz – 5600 Hz colored noise
• Narrowband : 400Hz – 600 Hz colored noise
• Sampling frequency of 16 kHz

Results
ROC
• Receiver Operation Characteristics
• True Detection vs False Alarm
• Area under the curve gives an Indication of decision making capability
• Used in Biomedical, RADAR applications

Narrow band Broad band
Low
reverb.
High
reverb.

Conclusion
• PHAT – β out performs conventional PHAT in
varied operating conditions
•β ranging from 0.65 – 0.7 would give superior performance for speech signal
•The results are in close agreement with the previous simulation studies.
- Done by Kevin D. Donhue, J. Hannemann and H.G. Dietz
Signal type Low reverb. High Reverb.
Narrow band 0.4 – 0.75 0.2 – 0.7
Broadband 0.65 – 0.9 0.6 – 1