Multi-Spectral Image Analysis and NURBS-based 3D ... · PDF fileMulti-Spectral Image Analysis...
5
Multi-Spectral Image Analysis and NURBS-based 3D Visualization of Land Maps Dilshan Jayathilaka and Ravinda G.N. Meegama Centre for Computer Studies Sabaragamuwa University P.O. Box 2, Belihuloya SRI LANKA http://www.sab.ac.lk/ccs Abstract: - This paper presents a novel technique to visualize in 3D objects extracted from multi-spectral satellite images. At the beginning, a thematic map of the original image is obtained by assessing the quality and correcting geometric errors. This map is then classified to identify the features of interest. A Non-Uniform Rational B-Spline (NURBS) surface is generated from this extracted feature in order to visualize the object in 3D. The results indicate an overall classification accuracy of eighty percent. Key-Words: - Land maps, NURBS, classification, satellite images, thematic maps, multi-spectral images 1 Introduction Remote sensing is a technique to obtain information about the earth, land and water surfaces without any form of direct physical contact. Using the images acquired from multi-spectral sensors placed at several locations on the earth, satellites could observe electromagnetic radiation in one or more regions of the electromagnetic spectrum, reflected or emitted from the surface of the earth. These sensors separately measure different parts of the electromagnetic spectrum within these reflections at a given time. A sensor may consist of a few bands such as blue, green, red and infrared; the number of bands in the spectrum specifies the spectral resolution of a sensor [1] Image data, however, are subjected to changes before they are transmitted to the user because electromagnetic energy could change through the atmosphere or in the satellite system. These effects could be catheterized as systematic errors, nonsystematic errors, radiometric errors and geometric errors. The correction of these errors is necessary before extracting the required features and therefore, this phase is usually referred to as pre- processing. The reflection or omitted intensity depends on the local characteristics of the surface of the earth. This relationship is used to extract information from satellite images as the image is formed according to the intensity of the reflected electromagnetic radiation from the surface. This will enable us to make a decision about classification of land cover based on the satellite images [2]. The process of multi-spectral image classification plays a major role in producing thematic maps from satellite images due to its higher accuracy with the use of increased number of bands. Hence, we select the maximum likelihood classification to analyze IRS 1c image to produce a thematic map of a region in the Puttalam District in Sri Lanka (Table 1 gives geographic locations of this region). Although this approach has been used widely for the analysis of all kinds of remotely sensed images with varying degrees of success, extracting an object of interest from a region and displaying it as an affine invariant 3D surface model is a difficult task. We have addressed this issue by proposing a NURBS surface to visualize such an object in 3D. 2 Material When gathering information, it is impossible to study the whole mapping area by data collection. Hence, we selected a path to visit the field covering almost all the land classes that are identified using the map. Figure 1 shows the study area and the route visited while Figure 2 shows the input image. The reason to select a region in the Puttalam District was due to the fact that it includes a distinct collection of land classes, which could not be seen in other areas of the island. These special classes were identified as lagoon, tank, ground and sea. 2.1 Remotely-sensed data Some remotely sensed data are represented in digital form so that the pattern of image brightness could be added, subtracted, multiplied, divided and in general, subjected to statistical manipulations that are not possible, if an image is presented only as a Proceedings of the 5th WSEAS International Conference on Applied Computer Science, Hangzhou, China, April 16-18, 2006 (pp947-951)
Transcript of Multi-Spectral Image Analysis and NURBS-based 3D ... · PDF fileMulti-Spectral Image Analysis...
Multi-Spectral Image Analysis and NURBS-based 3D Visualization of Land Maps
Dilshan Jayathilaka and Ravinda G.N. Meegama
Centre for Computer Studies Sabaragamuwa University
P.O. Box 2, Belihuloya SRI LANKA
http://www.sab.ac.lk/ccs
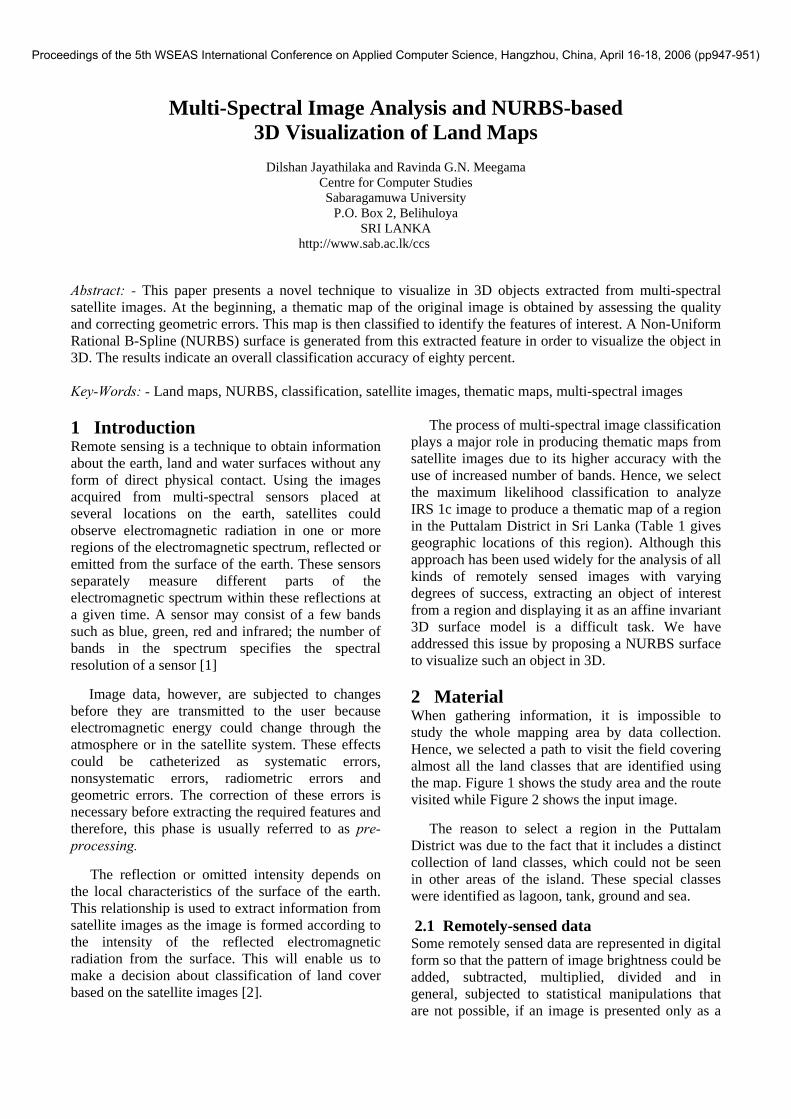
Abstract: - This paper presents a novel technique to visualize in 3D objects extracted from multi-spectral satellite images. At the beginning, a thematic map of the original image is obtained by assessing the quality and correcting geometric errors. This map is then classified to identify the features of interest. A Non-Uniform Rational B-Spline (NURBS) surface is generated from this extracted feature in order to visualize the object in 3D. The results indicate an overall classification accuracy of eighty percent. Key-Words: - Land maps, NURBS, classification, satellite images, thematic maps, multi-spectral images 1 Introduction Remote sensing is a technique to obtain information about the earth, land and water surfaces without any form of direct physical contact. Using the images acquired from multi-spectral sensors placed at several locations on the earth, satellites could observe electromagnetic radiation in one or more regions of the electromagnetic spectrum, reflected or emitted from the surface of the earth. These sensors separately measure different parts of the electromagnetic spectrum within these reflections at a given time. A sensor may consist of a few bands such as blue, green, red and infrared; the number of bands in the spectrum specifies the spectral resolution of a sensor [1] Image data, however, are subjected to changes before they are transmitted to the user because electromagnetic energy could change through the atmosphere or in the satellite system. These effects could be catheterized as systematic errors, nonsystematic errors, radiometric errors and geometric errors. The correction of these errors is necessary before extracting the required features and therefore, this phase is usually referred to as pre-processing. The reflection or omitted intensity depends on the local characteristics of the surface of the earth. This relationship is used to extract information from satellite images as the image is formed according to the intensity of the reflected electromagnetic radiation from the surface. This will enable us to make a decision about classification of land cover based on the satellite images [2].
The process of multi-spectral image classification plays a major role in producing thematic maps from satellite images due to its higher accuracy with the use of increased number of bands. Hence, we select the maximum likelihood classification to analyze IRS 1c image to produce a thematic map of a region in the Puttalam District in Sri Lanka (Table 1 gives geographic locations of this region). Although this approach has been used widely for the analysis of all kinds of remotely sensed images with varying degrees of success, extracting an object of interest from a region and displaying it as an affine invariant 3D surface model is a difficult task. We have addressed this issue by proposing a NURBS surface to visualize such an object in 3D. 2 Material When gathering information, it is impossible to study the whole mapping area by data collection. Hence, we selected a path to visit the field covering almost all the land classes that are identified using the map. Figure 1 shows the study area and the route visited while Figure 2 shows the input image. The reason to select a region in the Puttalam District was due to the fact that it includes a distinct collection of land classes, which could not be seen in other areas of the island. These special classes were identified as lagoon, tank, ground and sea.
2.1 Remotely-sensed data Some remotely sensed data are represented in digital form so that the pattern of image brightness could be added, subtracted, multiplied, divided and in general, subjected to statistical manipulations that are not possible, if an image is presented only as a
Proceedings of the 5th WSEAS International Conference on Applied Computer Science, Hangzhou, China, April 16-18, 2006 (pp947-951)
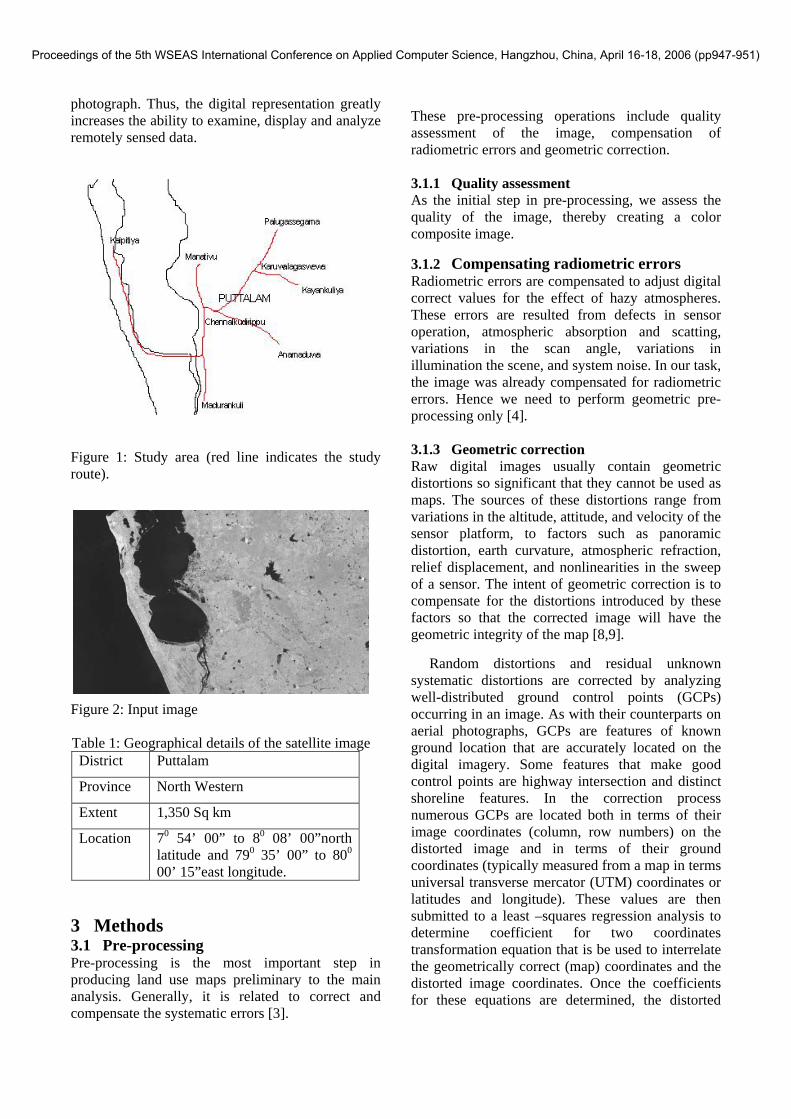
photograph. Thus, the digital representation greatly increases the ability to examine, display and analyze remotely sensed data.
Figure 1: Study area (red line indicates the study route).
Figure 2: Input image Table 1: Geographical details of the satellite image
District Puttalam
Province North Western
Extent 1,350 Sq km
Location 70 54’ 00” to 80 08’ 00”north latitude and 790 35’ 00” to 800 00’ 15”east longitude.
3 Methods 3.1 Pre-processing Pre-processing is the most important step in producing land use maps preliminary to the main analysis. Generally, it is related to correct and compensate the systematic errors [3].
These pre-processing operations include quality assessment of the image, compensation of radiometric errors and geometric correction. 3.1.1 Quality assessment As the initial step in pre-processing, we assess the quality of the image, thereby creating a color composite image. 3.1.2 Compensating radiometric errors Radiometric errors are compensated to adjust digital correct values for the effect of hazy atmospheres. These errors are resulted from defects in sensor operation, atmospheric absorption and scatting, variations in the scan angle, variations in illumination the scene, and system noise. In our task, the image was already compensated for radiometric errors. Hence we need to perform geometric pre-processing only [4]. 3.1.3 Geometric correction Raw digital images usually contain geometric distortions so significant that they cannot be used as maps. The sources of these distortions range from variations in the altitude, attitude, and velocity of the sensor platform, to factors such as panoramic distortion, earth curvature, atmospheric refraction, relief displacement, and nonlinearities in the sweep of a sensor. The intent of geometric correction is to compensate for the distortions introduced by these factors so that the corrected image will have the geometric integrity of the map [8,9]. Random distortions and residual unknown systematic distortions are corrected by analyzing well-distributed ground control points (GCPs) occurring in an image. As with their counterparts on aerial photographs, GCPs are features of known ground location that are accurately located on the digital imagery. Some features that make good control points are highway intersection and distinct shoreline features. In the correction process numerous GCPs are located both in terms of their image coordinates (column, row numbers) on the distorted image and in terms of their ground coordinates (typically measured from a map in terms universal transverse mercator (UTM) coordinates or latitudes and longitude). These values are then submitted to a least –squares regression analysis to determine coefficient for two coordinates transformation equation that is be used to interrelate the geometrically correct (map) coordinates and the distorted image coordinates. Once the coefficients for these equations are determined, the distorted
Proceedings of the 5th WSEAS International Conference on Applied Computer Science, Hangzhou, China, April 16-18, 2006 (pp947-951)
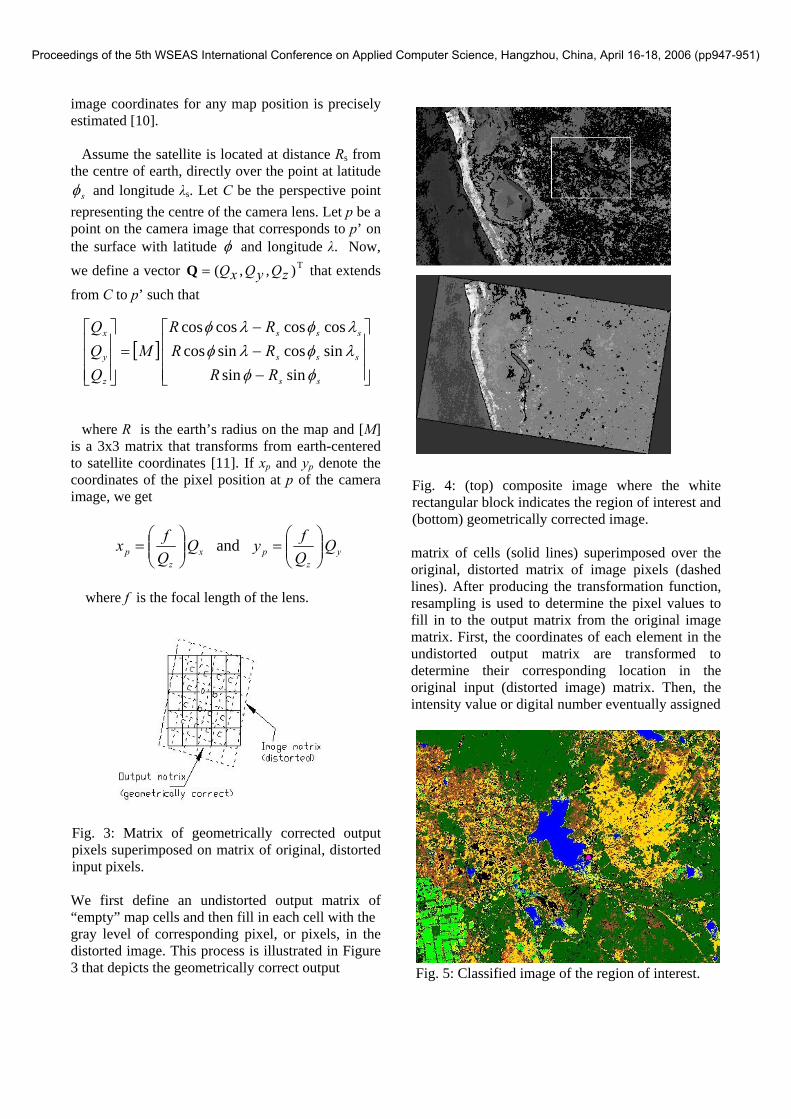
image coordinates for any map position is precisely estimated [10]. Assume the satellite is located at distance Rs from the centre of earth, directly over the point at latitude
sφ and longitude λs. Let C be the perspective point representing the centre of the camera lens. Let p be a point on the camera image that corresponds to p’ on the surface with latitude φ and longitude λ. Now, we define a vector T),,( zQyQxQ=Q that extends
from C to p’ such that
where R is the earth’s radius on the map and [M] is a 3x3 matrix that transforms from earth-centered to satellite coordinates [11]. If xp and yp denote the coordinates of the pixel position at p of the camera image, we get
where f is the focal length of the lens.
Fig. 3: Matrix of geometrically corrected output pixels superimposed on matrix of original, distorted input pixels. We first define an undistorted output matrix of “empty” map cells and then fill in each cell with the gray level of corresponding pixel, or pixels, in the distorted image. This process is illustrated in Figure 3 that depicts the geometrically correct output
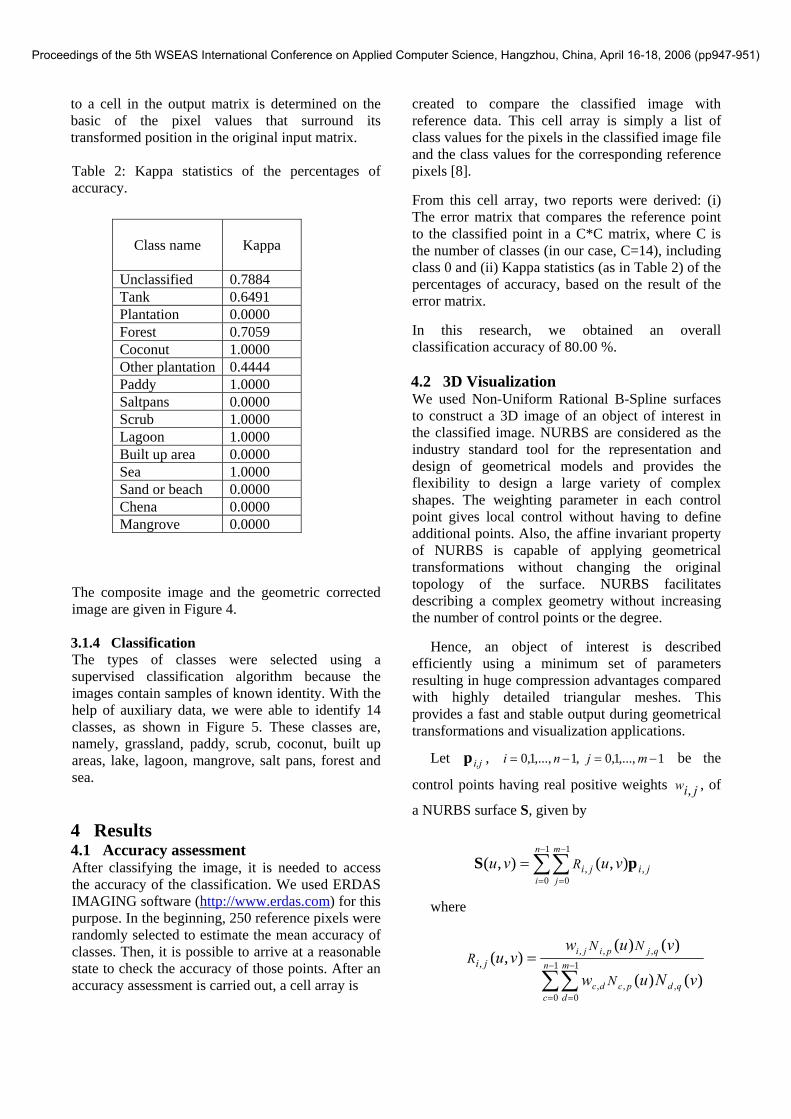
Fig. 4: (top) composite image where the white rectangular block indicates the region of interest and (bottom) geometrically corrected image. matrix of cells (solid lines) superimposed over the original, distorted matrix of image pixels (dashed lines). After producing the transformation function, resampling is used to determine the pixel values to fill in to the output matrix from the original image matrix. First, the coordinates of each element in the undistorted output matrix are transformed to determine their corresponding location in the original input (distorted image) matrix. Then, the intensity value or digital number eventually assigned Fig. 5: Classified image of the region of interest.
[ ]⎥⎥⎥
⎦
⎤
⎢⎢⎢
⎣
⎡
−−−
=⎥⎥⎥
⎦
⎤
⎢⎢⎢
⎣
⎡
ss
sss
sss
z
y
x
RRRRRR
MQQQ
φφλφλφλφλφ
sinsinsincossincoscoscoscoscos
yz
pxz
p QQfyQ
Qfx and ⎟⎟
⎠
⎞⎜⎜⎝
⎛=⎟⎟
⎠
⎞⎜⎜⎝
⎛=
Proceedings of the 5th WSEAS International Conference on Applied Computer Science, Hangzhou, China, April 16-18, 2006 (pp947-951)
to a cell in the output matrix is determined on the basic of the pixel values that surround its transformed position in the original input matrix. Table 2: Kappa statistics of the percentages of accuracy.
The composite image and the geometric corrected image are given in Figure 4.
3.1.4 Classification The types of classes were selected using a supervised classification algorithm because the images contain samples of known identity. With the help of auxiliary data, we were able to identify 14 classes, as shown in Figure 5. These classes are, namely, grassland, paddy, scrub, coconut, built up areas, lake, lagoon, mangrove, salt pans, forest and sea. 4 Results 4.1 Accuracy assessment After classifying the image, it is needed to access the accuracy of the classification. We used ERDAS IMAGING software (http://www.erdas.com) for this purpose. In the beginning, 250 reference pixels were randomly selected to estimate the mean accuracy of classes. Then, it is possible to arrive at a reasonable state to check the accuracy of those points. After an accuracy assessment is carried out, a cell array is
created to compare the classified image with reference data. This cell array is simply a list of class values for the pixels in the classified image file and the class values for the corresponding reference pixels [8]. From this cell array, two reports were derived: (i) The error matrix that compares the reference point to the classified point in a C*C matrix, where C is the number of classes (in our case, C=14), including class 0 and (ii) Kappa statistics (as in Table 2) of the percentages of accuracy, based on the result of the error matrix. In this research, we obtained an overall classification accuracy of 80.00 %. 4.2 3D Visualization We used Non-Uniform Rational B-Spline surfaces to construct a 3D image of an object of interest in the classified image. NURBS are considered as the industry standard tool for the representation and design of geometrical models and provides the flexibility to design a large variety of complex shapes. The weighting parameter in each control point gives local control without having to define additional points. Also, the affine invariant property of NURBS is capable of applying geometrical transformations without changing the original topology of the surface. NURBS facilitates describing a complex geometry without increasing the number of control points or the degree. Hence, an object of interest is described efficiently using a minimum set of parameters resulting in huge compression advantages compared with highly detailed triangular meshes. This provides a fast and stable output during geometrical transformations and visualization applications.
Let i,jp , ,1,...,1,0 −= ni 1,...,1,0 −= mj be the
control points having real positive weights jiw , , of
a NURBS surface S, given by
where
Class name
Kappa
Unclassified 0.7884 Tank 0.6491 Plantation 0.0000 Forest 0.7059 Coconut 1.0000 Other plantation 0.4444 Paddy 1.0000 Saltpans 0.0000 Scrub 1.0000 Lagoon 1.0000 Built up area 0.0000 Sea 1.0000 Sand or beach 0.0000 Chena 0.0000 Mangrove 0.0000
∑∑−
=
−
=
=1
0
1
0,, ),(),(
n
i
m
jjiji vuvu R pS
∑∑−
=
−
=
= 1
0
1
0,,,
,,,
)()(
)()(),(, n
c
m
dqdpcdc
qjpiji
vNuw
vuwvu
N
NNR ji
Proceedings of the 5th WSEAS International Conference on Applied Computer Science, Hangzhou, China, April 16-18, 2006 (pp947-951)
are the rational basis functions in which klN , gives the thl B-Spline basis function of degree +Ζ∈k [6].
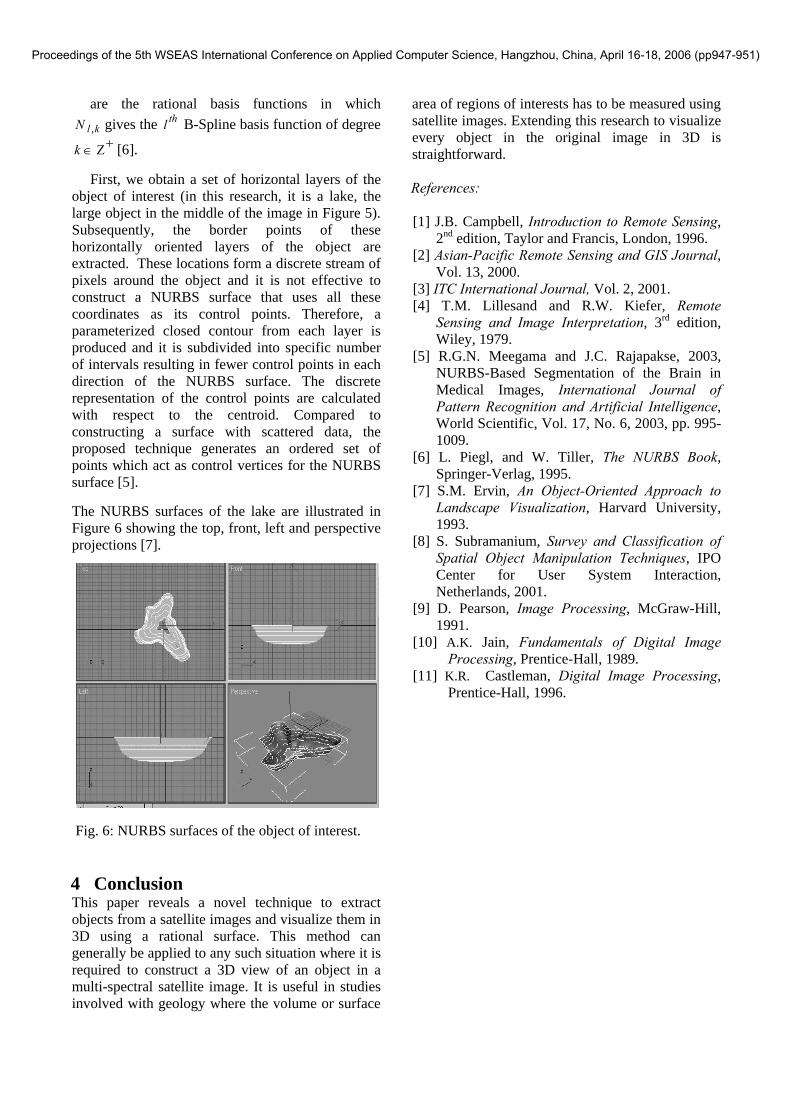
First, we obtain a set of horizontal layers of the object of interest (in this research, it is a lake, the large object in the middle of the image in Figure 5). Subsequently, the border points of these horizontally oriented layers of the object are extracted. These locations form a discrete stream of pixels around the object and it is not effective to construct a NURBS surface that uses all these coordinates as its control points. Therefore, a parameterized closed contour from each layer is produced and it is subdivided into specific number of intervals resulting in fewer control points in each direction of the NURBS surface. The discrete representation of the control points are calculated with respect to the centroid. Compared to constructing a surface with scattered data, the proposed technique generates an ordered set of points which act as control vertices for the NURBS surface [5]. The NURBS surfaces of the lake are illustrated in Figure 6 showing the top, front, left and perspective projections [7].
Fig. 6: NURBS surfaces of the object of interest.
4 Conclusion This paper reveals a novel technique to extract objects from a satellite images and visualize them in 3D using a rational surface. This method can generally be applied to any such situation where it is required to construct a 3D view of an object in a multi-spectral satellite image. It is useful in studies involved with geology where the volume or surface
area of regions of interests has to be measured using satellite images. Extending this research to visualize every object in the original image in 3D is straightforward. References: [1] J.B. Campbell, Introduction to Remote Sensing,
2nd edition, Taylor and Francis, London, 1996. [2] Asian-Pacific Remote Sensing and GIS Journal,
Vol. 13, 2000. [3] ITC International Journal, Vol. 2, 2001. [4] T.M. Lillesand and R.W. Kiefer, Remote
Sensing and Image Interpretation, 3rd edition, Wiley, 1979.
[5] R.G.N. Meegama and J.C. Rajapakse, 2003, NURBS-Based Segmentation of the Brain in Medical Images, International Journal of Pattern Recognition and Artificial Intelligence, World Scientific, Vol. 17, No. 6, 2003, pp. 995-1009.
[6] L. Piegl, and W. Tiller, The NURBS Book, Springer-Verlag, 1995.
[7] S.M. Ervin, An Object-Oriented Approach to Landscape Visualization, Harvard University, 1993.
[8] S. Subramanium, Survey and Classification of Spatial Object Manipulation Techniques, IPO Center for User System Interaction, Netherlands, 2001.
[9] D. Pearson, Image Processing, McGraw-Hill, 1991.
[10] A.K. Jain, Fundamentals of Digital Image Processing, Prentice-Hall, 1989.
[11] K.R. Castleman, Digital Image Processing, Prentice-Hall, 1996.
Proceedings of the 5th WSEAS International Conference on Applied Computer Science, Hangzhou, China, April 16-18, 2006 (pp947-951)