Methods For Improving Turbocharger Simulation Accuracy in GT-Power as presented.ppt ·...
22
M th d F I i Methods For Improving Turbocharger Turbocharger Simulation Accuracy in GT P GT-Power Owen Ryder Ganesan Subramanian
Transcript of Methods For Improving Turbocharger Simulation Accuracy in GT-Power as presented.ppt ·...
M th d F I i Methods For Improving Turbocharger Turbocharger Simulation Accuracy in GT PGT-PowerOwen RyderGanesan Subramanian
ContentsContents
Basic Errors – Pressure Drops
Turbocharger Shaft PropertiesTurbocharger Shaft Properties
Adjacent Objects To Turbo Maps
T bi MTurbine Maps
Compressor Map Efficiency Extrapolation
2
Basic Errors
⎞⎛⎞⎛ ×=vol PND
m&η
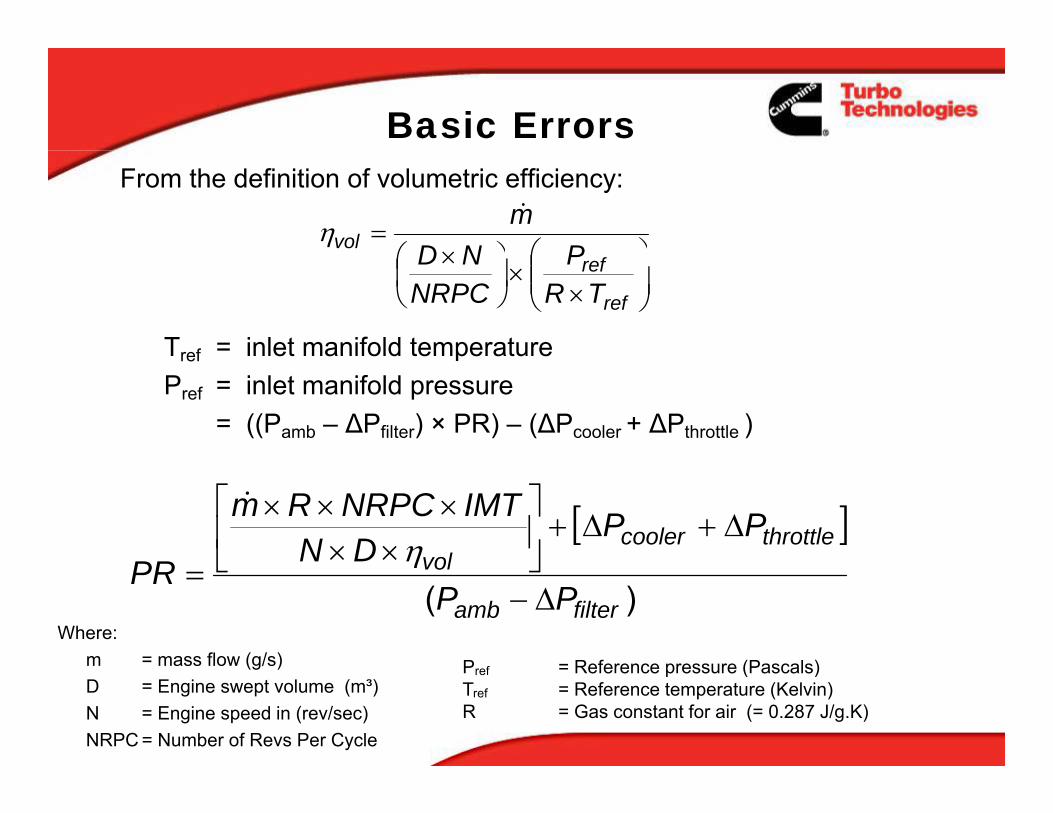
From the definition of volumetric efficiency:
⎟⎟⎠
⎞⎜⎜⎝
⎛×
×⎟⎠⎞
⎜⎝⎛ ×
ref
refTR
PNRPC
ND
Tref = inlet manifold temperatureTref inlet manifold temperaturePref = inlet manifold pressure
= ((Pamb – ∆Pfilter) × PR) – (∆Pcooler + ∆Pthrottle )
[ ]throttlecoolervol
PPDN
IMTNRPCRm
PRΔ+Δ+⎥
⎦
⎤⎢⎣
⎡××
×××η
&
Where:m = mass flow (g/s)
)( filteramb
vol
PPDN
PRΔ−⎦⎣=
η
P R f (P l )
3
m mass flow (g/s)D = Engine swept volume (m³)N = Engine speed in (rev/sec)NRPC = Number of Revs Per Cycle
Pref = Reference pressure (Pascals)Tref = Reference temperature (Kelvin)R = Gas constant for air (= 0.287 J/g.K)
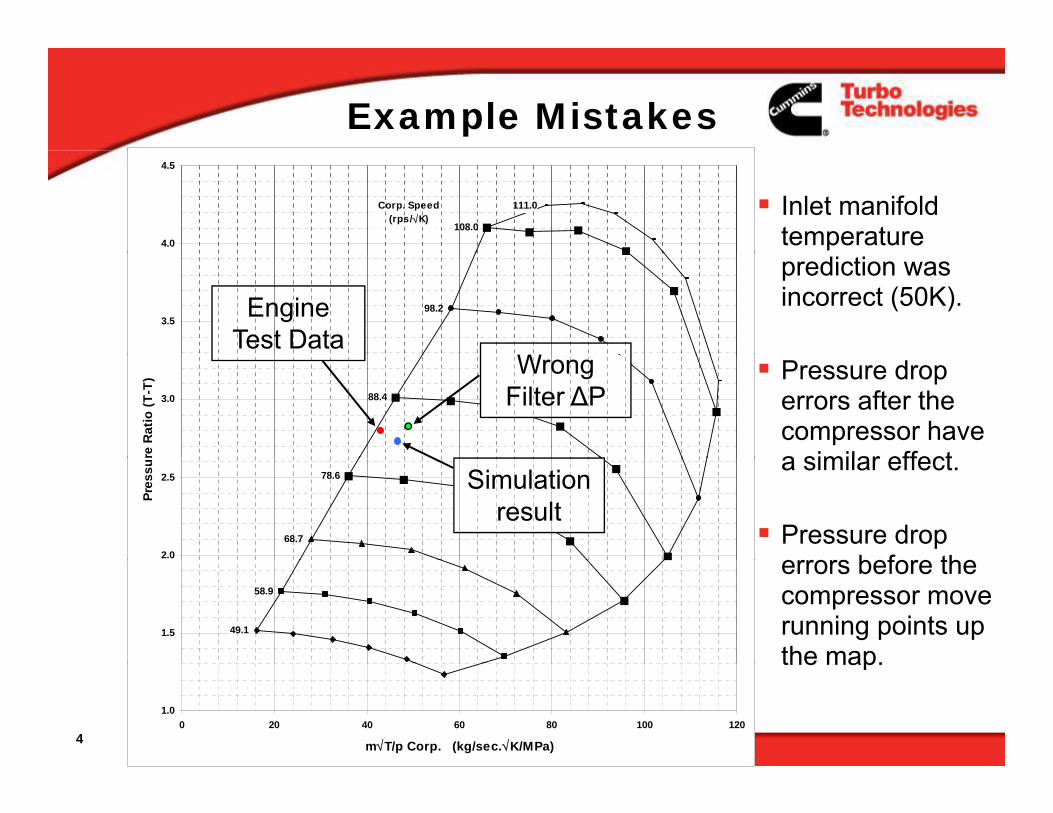
Example Mistakes
Inlet manifold temperature 108.0
111.0
4.0
4.5
Corp. Speed(rps/√K)
prediction was incorrect (50K).98.2
3.5Engine
Test DataW Pressure drop
errors after the compressor have a similar effect
88.43.0
re R
atio
(T-T
) Wrong Filter ∆P
a similar effect.
Pressure drop errors before the
68.7
78.6
2.0
2.5
Pres
su Simulation result
errors before the compressor move running points up the map.
49.1
58.9
1.5
4
the map.
1.00 20 40 60 80 100 120
m√T/p Corp. (kg/sec.√K/MPa)
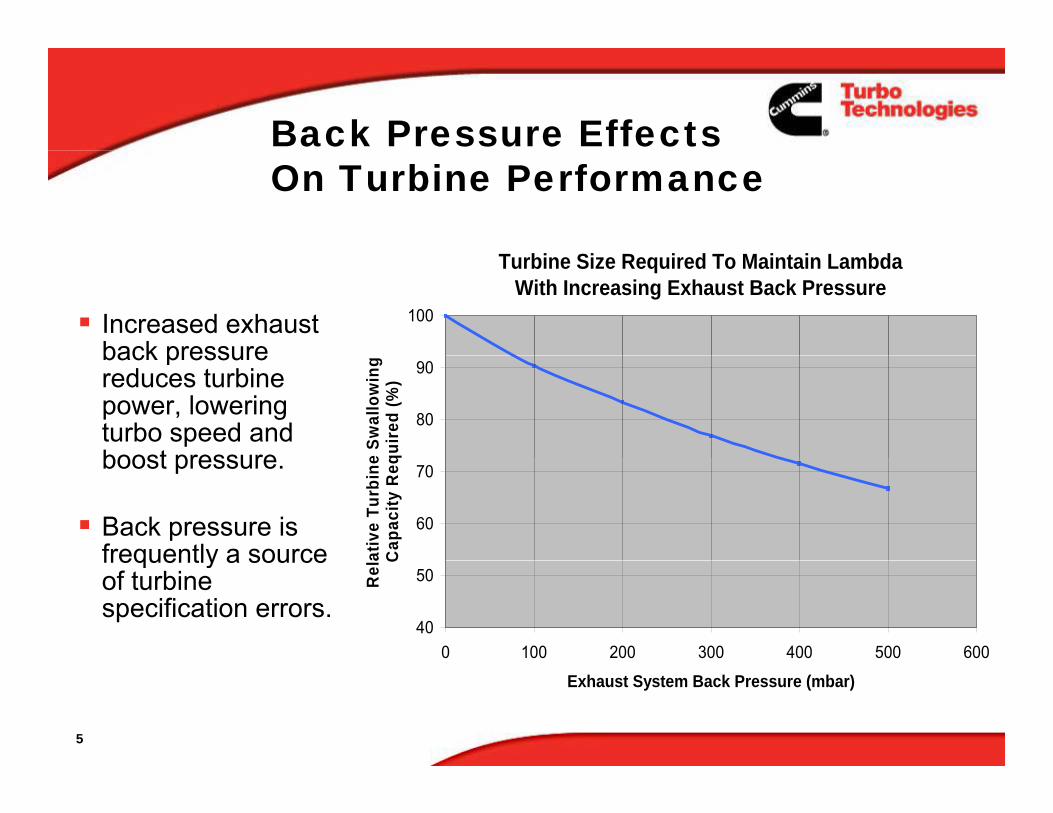
Back Pressure EffectsOn Turbine Performance
Turbine Size Required To Maintain Lambda With Increasing Exhaust Back Pressure
100Increased exhaust back pressure
80
90e
Swal
low
ing
quire
d (%
)
back pressure reduces turbine power, lowering turbo speed and boost pressure
60
70
ativ
e Tu
rbin
eC
apac
ity R
eqboost pressure.
Back pressure is frequently a source
40
50
0 100 200 300 400 500 600
Rel
a Cfrequently a source of turbine specification errors.
5
Exhaust System Back Pressure (mbar)
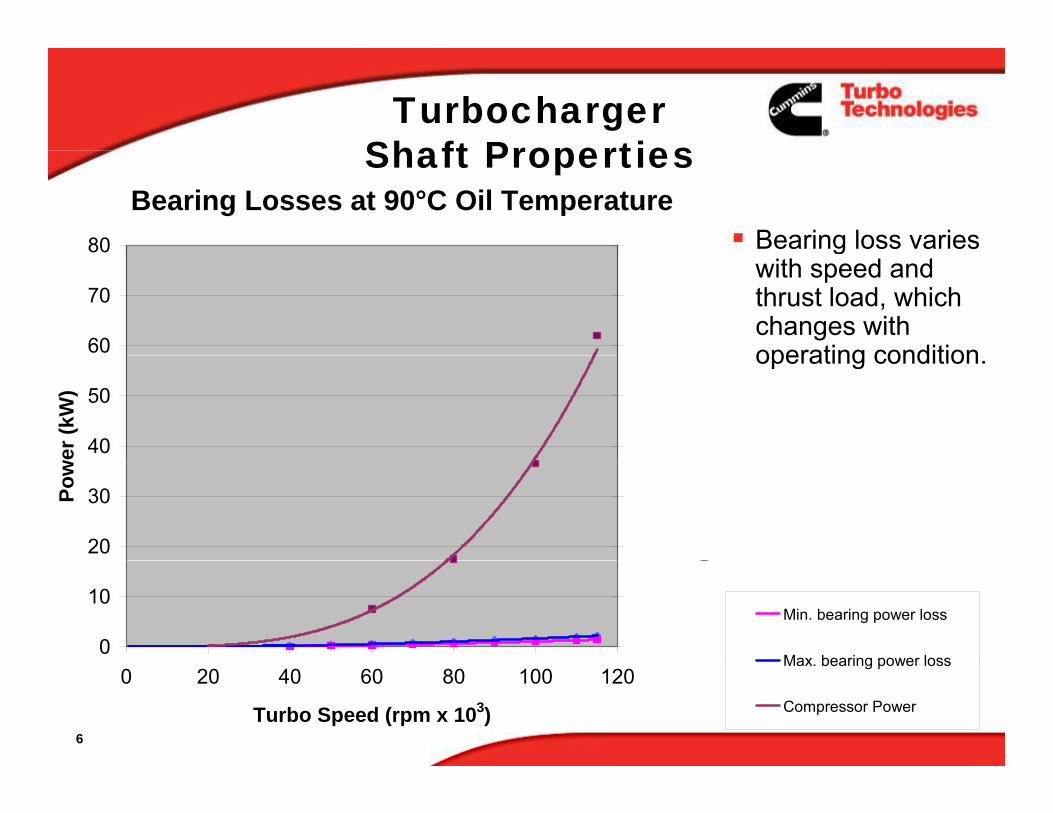
Turbocharger Shaft Properties
Bearing Losses at 90°C Oil Temperature80 100% Bearing loss varies
Shaft Properties
60
70
96%
98%
(%)
gwith speed and thrust load, which changes with operating condition
40
50
er (k
W)
92%
94%
Effic
ienc
y operating condition.
20
30Pow
e
88%
90%
Mec
hani
cal
0
10
84%
86%
M
Min. bearing power loss
Max bearing power loss
6
0 20 40 60 80 100 120
Turbo Speed (rpm x 103)
Max. bearing power loss
Compressor Power
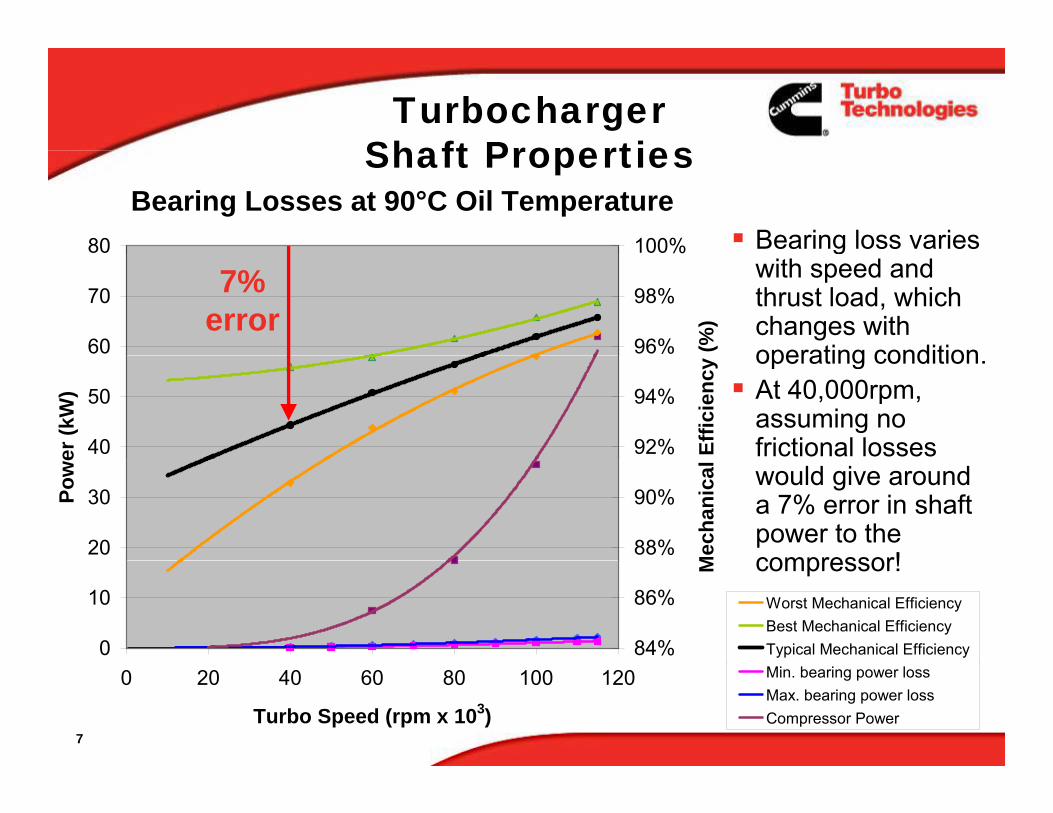
Turbocharger Shaft Properties
Bearing Losses at 90°C Oil Temperature80 100% Bearing loss varies
Shaft Properties
60
70
80
96%
98%
00%
(%)
gwith speed and thrust load, which changes with operating condition
7% error
40
50
er (k
W)
92%
94%
Effic
ienc
y operating condition.At 40,000rpm, assuming no frictional losses
20
30Pow
e
88%
90%
Mec
hani
cal
would give around a 7% error in shaft power to the compressor!
0
10
84%
86%
M
Worst Mechanical EfficiencyBest Mechanical EfficiencyTypical Mechanical Efficiency
compressor!
7
0 20 40 60 80 100 120
Turbo Speed (rpm x 103)
Min. bearing power lossMax. bearing power lossCompressor Power
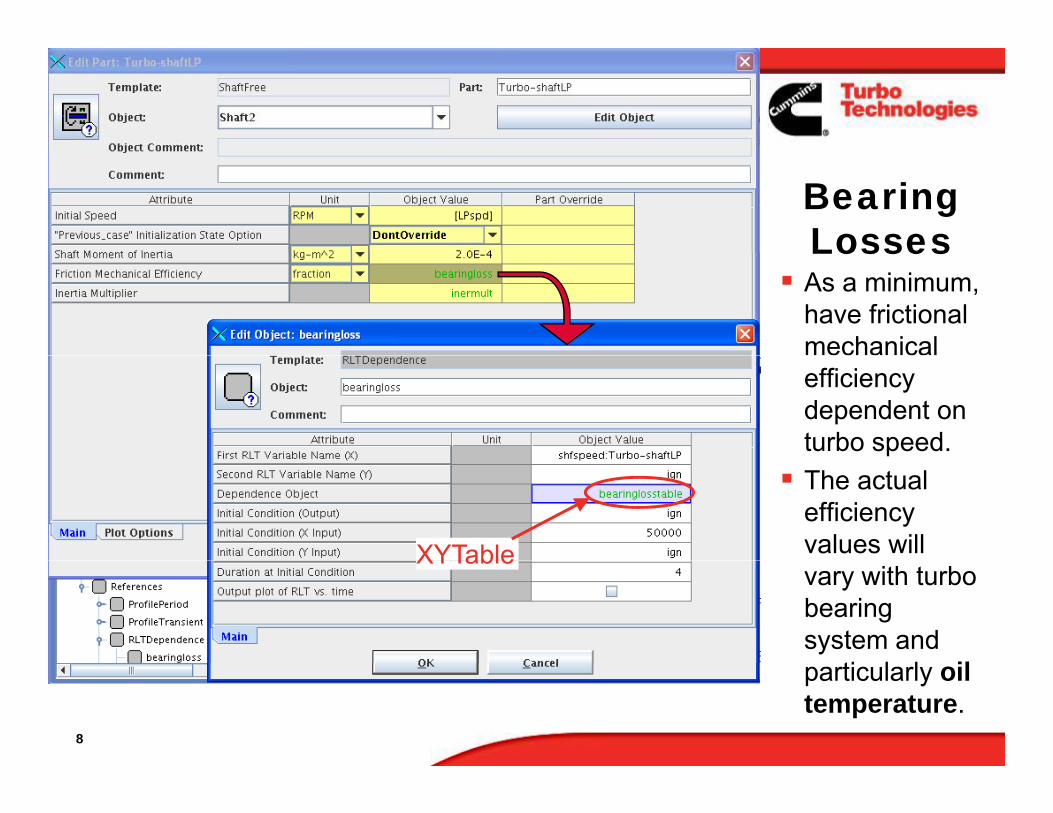
Bearing LossesLossesAs a minimum, have frictional mechanical efficiency dependent on turbo speed.The actual efficiency values will XYTablevary with turbo bearing system and
ti l l il
XYTable
8
particularly oil temperature.
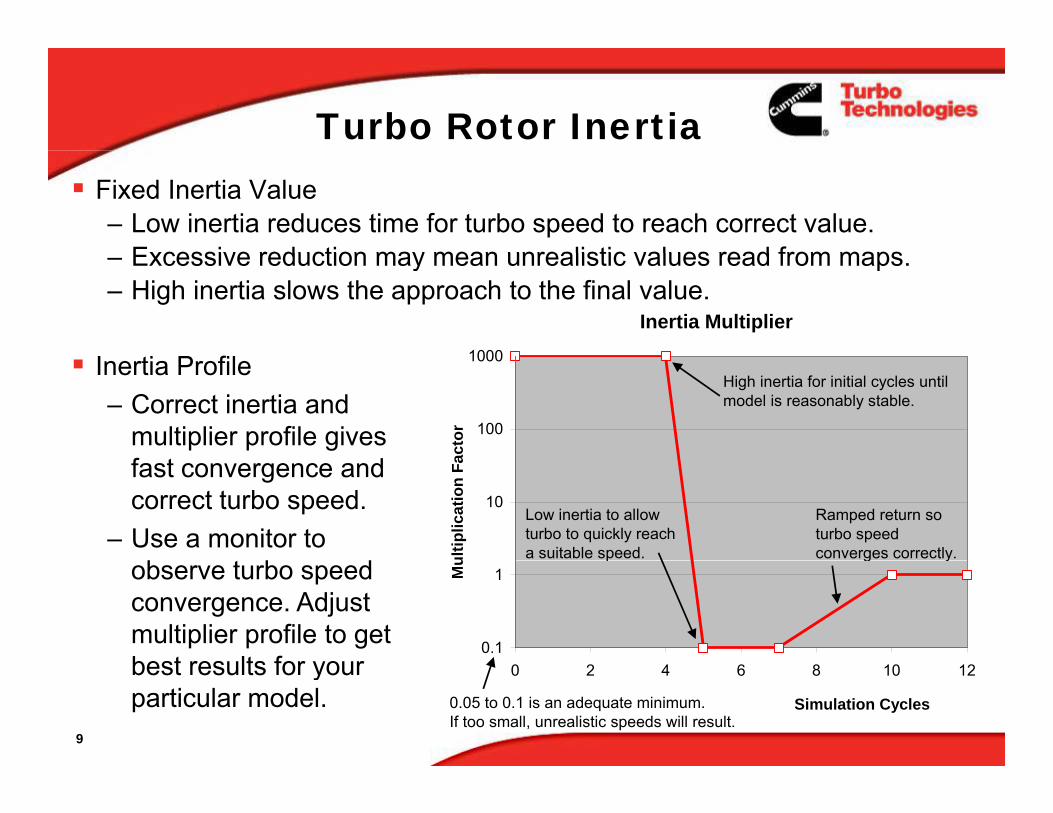
Turbo Rotor InertiaFixed Inertia Value– Low inertia reduces time for turbo speed to reach correct value.
Excessive reduction may mean unrealistic values read from maps
Inertia Multiplier1000
– Excessive reduction may mean unrealistic values read from maps.– High inertia slows the approach to the final value.
100
1000
acto
r
High inertia for initial cycles until model is reasonably stable.
Inertia Profile– Correct inertia and
multiplier profile gives f
10
ultip
licat
ion
Fa
Low inertia to allow turbo to quickly reach a suitable speed.
Ramped return so turbo speed converges correctly.
fast convergence and correct turbo speed.
– Use a monitor to b b d
0.1
1Mu p g y
observe turbo speed convergence. Adjust multiplier profile to get best results for your
9
0 2 4 6 8 10 12
Simulation Cycles0.05 to 0.1 is an adequate minimum.If too small, unrealistic speeds will result.
best results for your particular model.
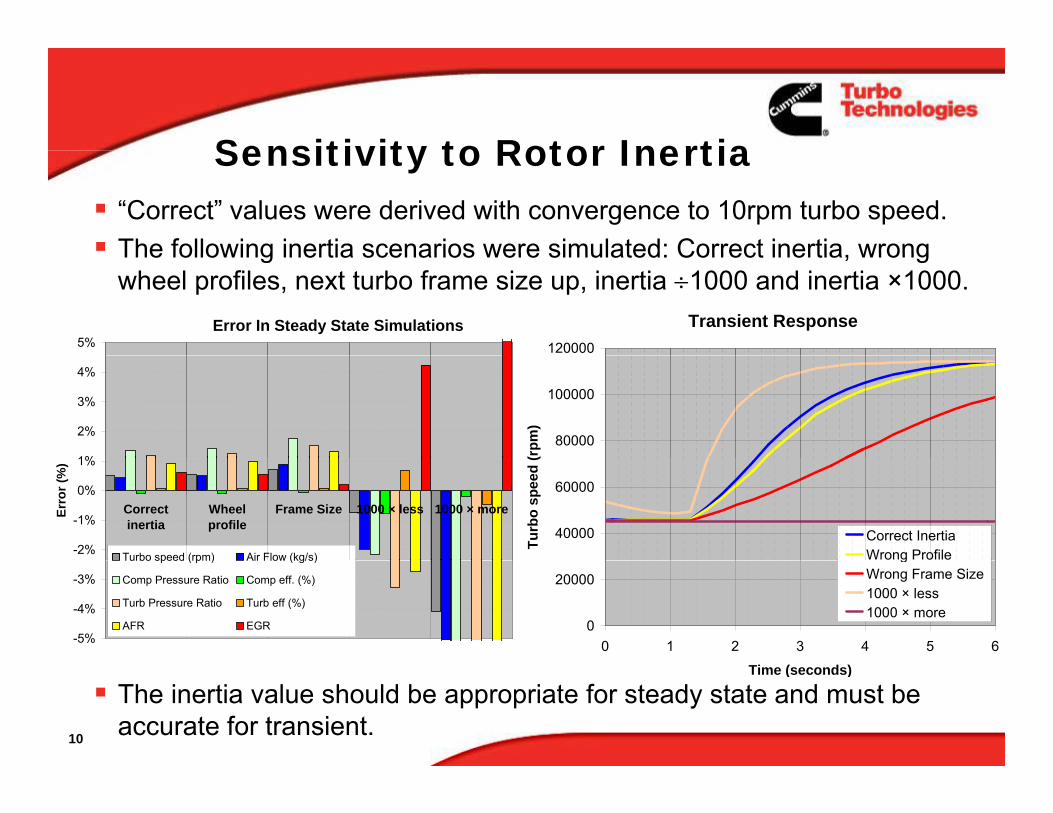
Sensitivity to Rotor InertiaSensitivity to Rotor Inertia“Correct” values were derived with convergence to 10rpm turbo speed.The following inertia scenarios were simulated: Correct inertia wrongThe following inertia scenarios were simulated: Correct inertia, wrong wheel profiles, next turbo frame size up, inertia ÷1000 and inertia ×1000.
Transient Response120000
Error In Steady State Simulations5%
80000
100000
(rpm
)
1%
2%
3%
4%
40000
60000
Turb
o sp
eed
(Correct InertiaWrong Profile-2%
-1%
0%
1%
Correctinertia
Wheelprofile
Frame Size 1000 × less 1000 × moreErro
r (%
)
Turbo speed (rpm) Air Flow (kg/s)
0
20000
0 1 2 3 4 5 6
gWrong Frame Size1000 × less1000 × more
-5%
-4%
-3%
Turbo speed (rpm) Air Flow (kg/s)
Comp Pressure Ratio Comp eff. (%)
Turb Pressure Ratio Turb eff (%)
AFR EGR
10
The inertia value should be appropriate for steady state and must be accurate for transient.
Time (seconds)
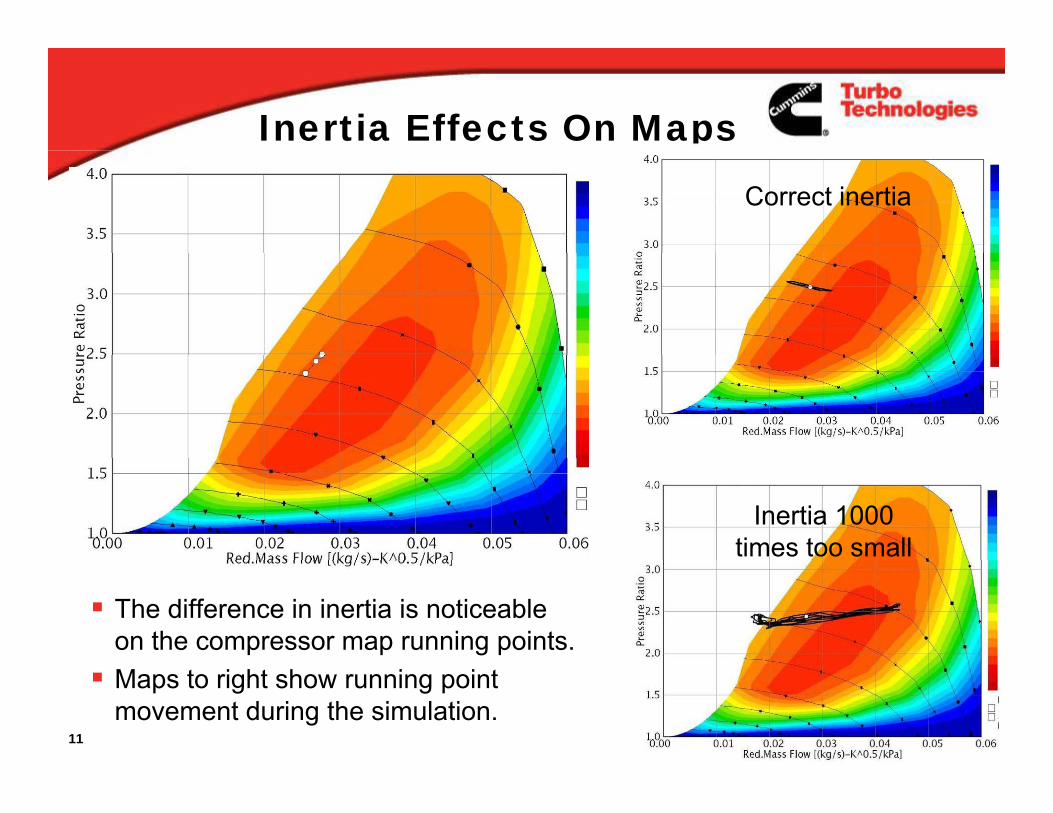
Inertia Effects On Maps
Correct inertia
Inertia 1000 times too small
The difference in inertia is noticeable on the compressor map running points.
11
Maps to right show running point movement during the simulation.
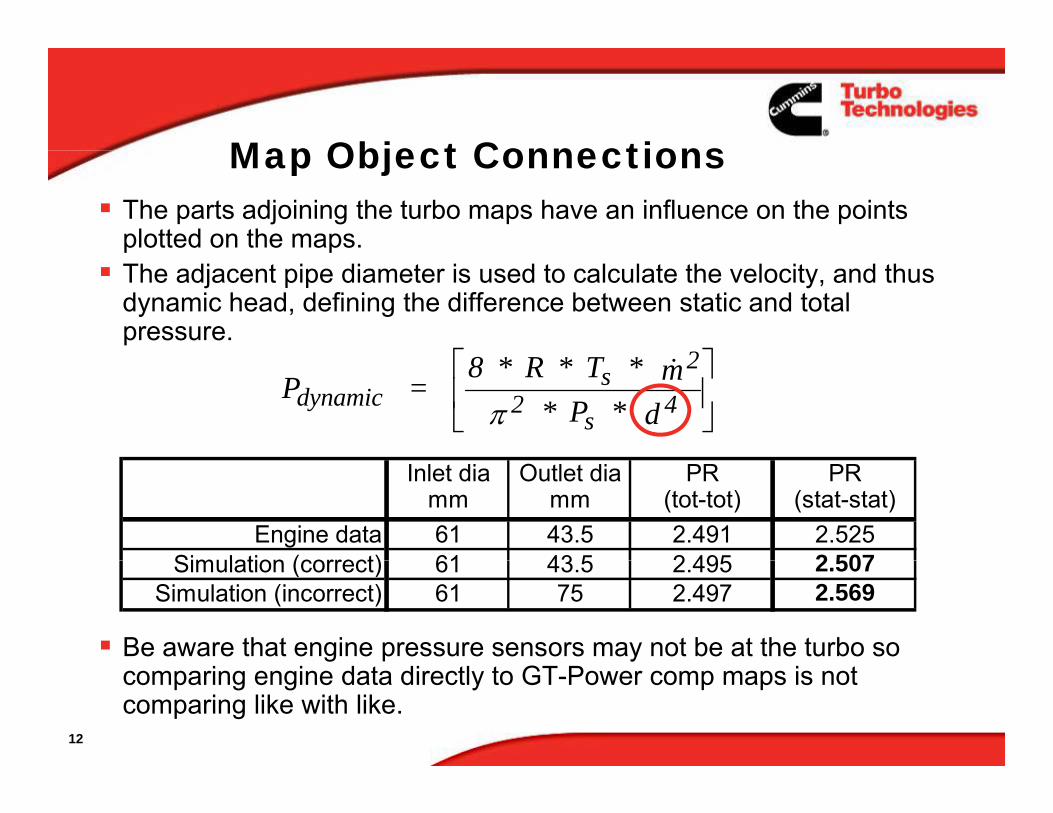
Map Object ConnectionsMap Object ConnectionsThe parts adjoining the turbo maps have an influence on the points plotted on the maps. The adjacent pipe diameter is used to calculate the velocity, and thus dynamic head, defining the difference between static and total pressure.
2⎡ ⎤P =
8 * R * T * m * P * ddynamic
s 2
2 s 4&
π⎡
⎣⎢
⎤
⎦⎥
Inlet dia Outlet dia PR PRmm mm (tot-tot) (stat-stat)
Engine data 61 43.5 2.491 2.525Simulation (correct) 61 43 5 2 495 2 507
Be aware that engine pressure sensors may not be at the turbo so
Simulation (correct) 61 43.5 2.495 2.507Simulation (incorrect) 61 75 2.497 2.569
12
comparing engine data directly to GT-Power comp maps is not comparing like with like.
Missing Turbo I t l V lInternal Volumes
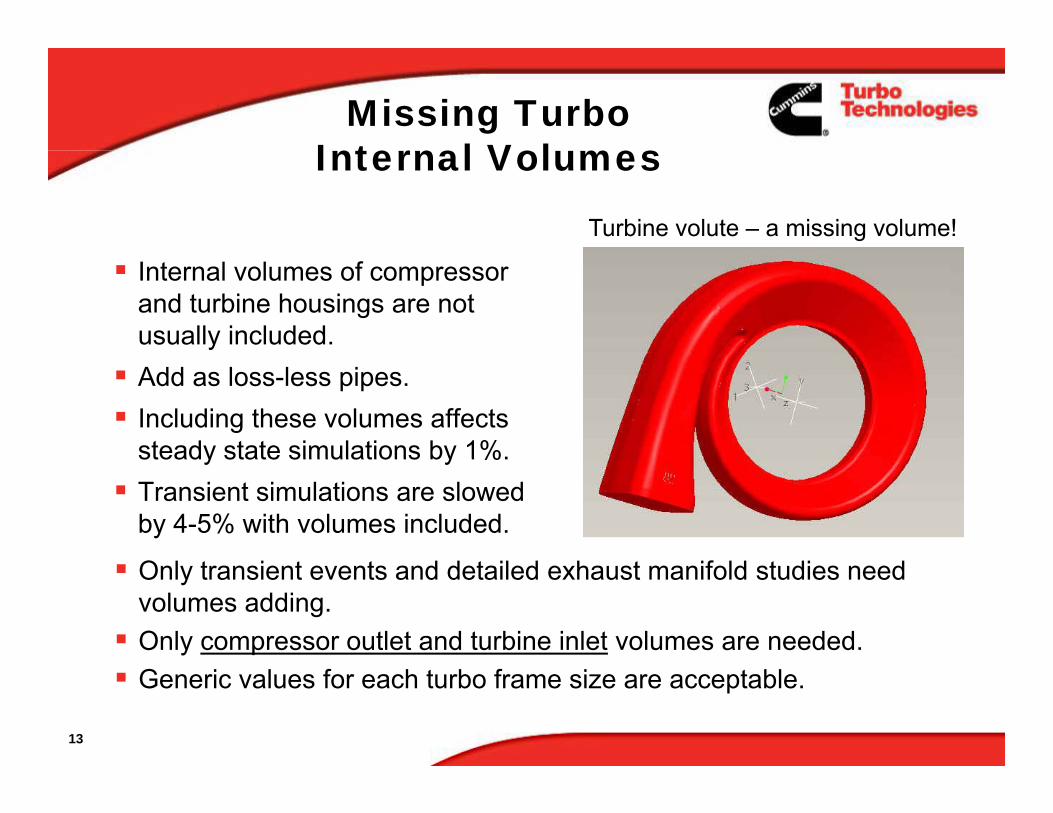
Turbine volute – a missing volume!
Internal volumes of compressor and turbine housings are not usually included.Add as loss-less pipes. Including these volumes affects steady state simulations by 1%.steady state simulations by 1%.Transient simulations are slowed by 4-5% with volumes included.
O fOnly transient events and detailed exhaust manifold studies need volumes adding.Only compressor outlet and turbine inlet volumes are needed.
13
Generic values for each turbo frame size are acceptable.
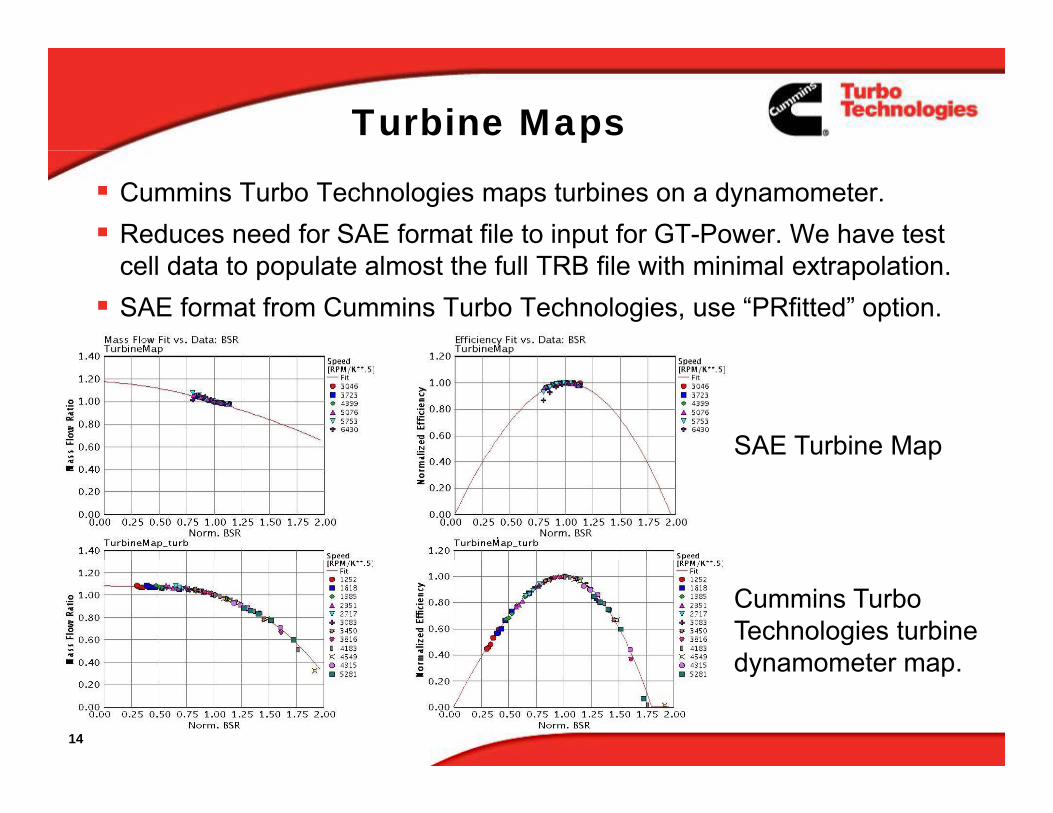
Turbine Maps
Cummins Turbo Technologies maps turbines on a dynamometer.Reduces need for SAE format file to input for GT-Power. We have test cell data to populate almost the full TRB file with minimal extrapolation. SAE format from Cummins Turbo Technologies, use “PRfitted” option.
SAE Turbine Mapp
Cummins Turbo Technologies turbine dynamometer map
14
dynamometer map.
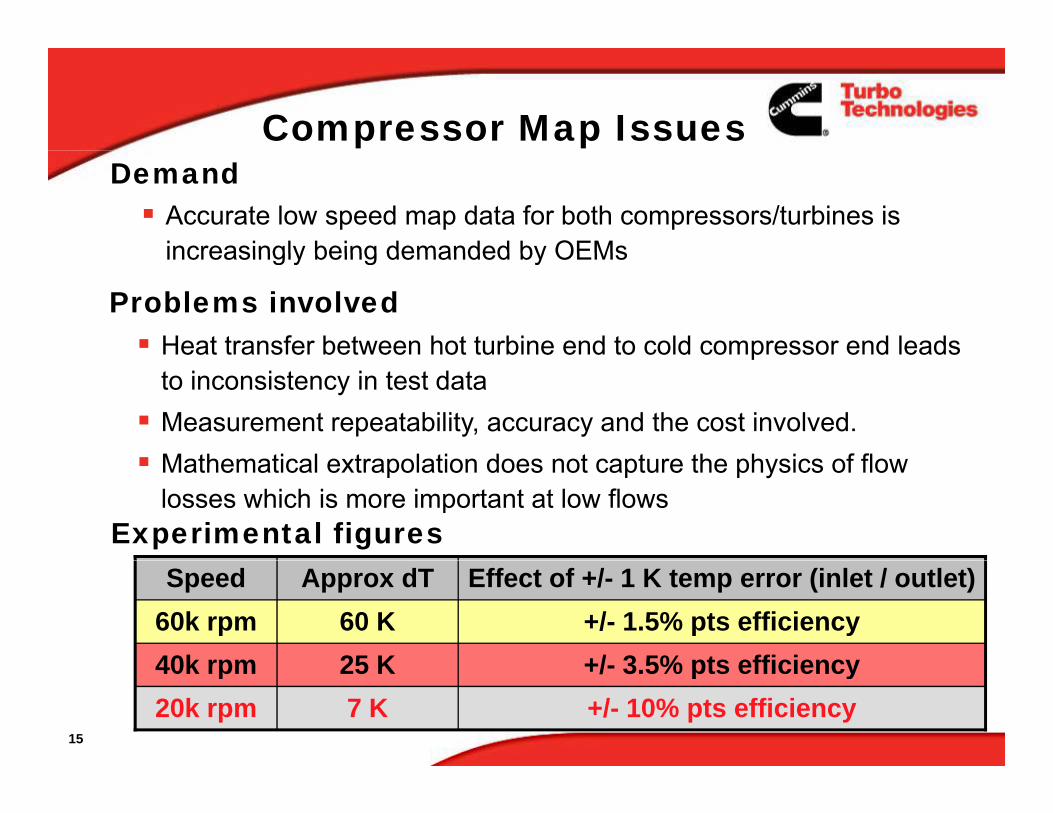
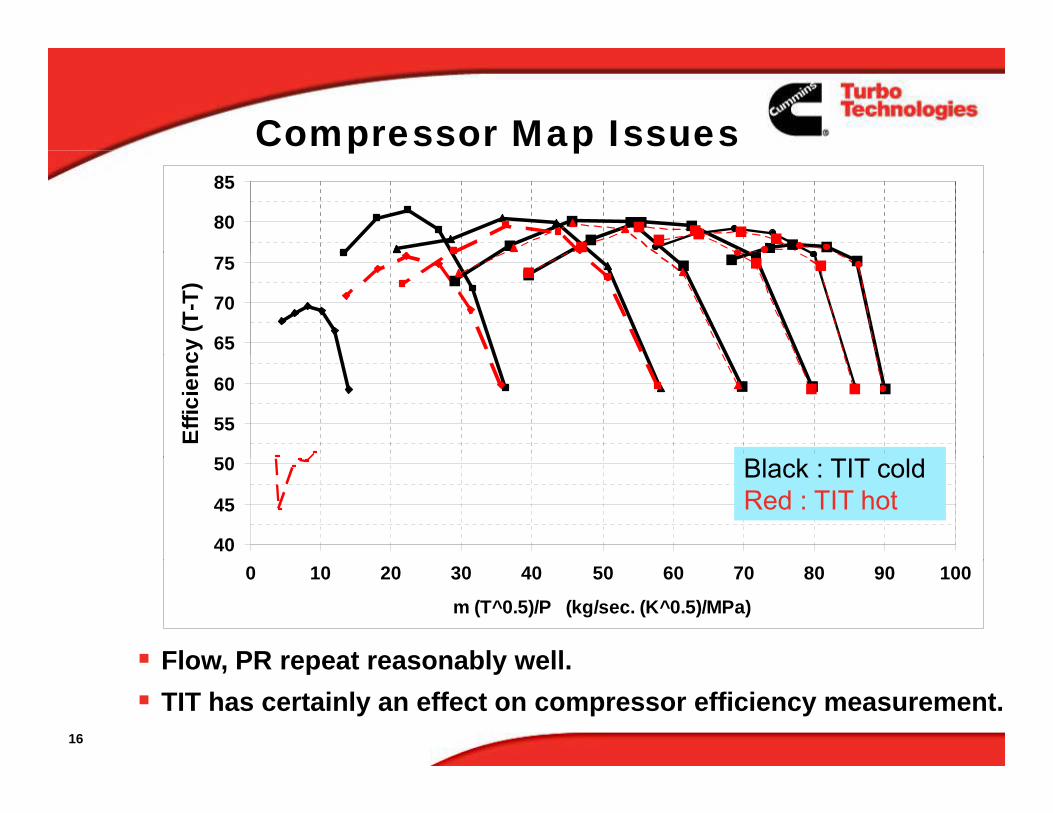
Compressor Map Issues
Accurate low speed map data for both compressors/turbines is increasingly being demanded by OEMs
Demand
increasingly being demanded by OEMs
Problems involvedHeat transfer between hot turbine end to cold compressor end leads pto inconsistency in test dataMeasurement repeatability, accuracy and the cost involved.M th ti l t l ti d t t th h i f flMathematical extrapolation does not capture the physics of flow losses which is more important at low flows
Experimental figures
+/ 3 5% pts efficiency25 K40k rpm+/- 1.5% pts efficiency60 K60k rpm
Effect of +/- 1 K temp error (inlet / outlet)Approx dTSpeed
15
+/- 10% pts efficiency7 K20k rpm+/- 3.5% pts efficiency25 K40k rpm
Compressor Map Issues p p
80
85
65
70
75
cy (T
-T)
50
55
60
Effic
ienc
40
45
50 Black : TIT coldRed : TIT hot
Flow PR repeat reasonably well
0 10 20 30 40 50 60 70 80 90 100
m (T^0.5)/P (kg/sec. (K^0.5)/MPa)
16
Flow, PR repeat reasonably well.TIT has certainly an effect on compressor efficiency measurement.
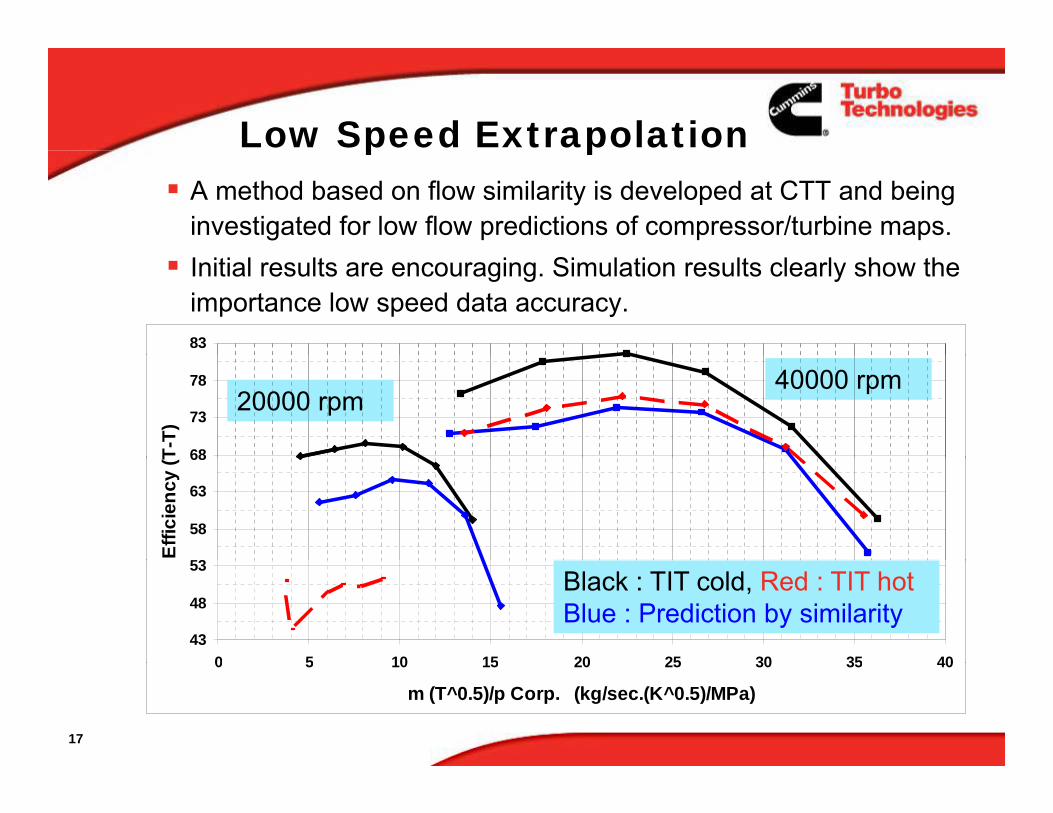
Low Speed Extrapolation p pA method based on flow similarity is developed at CTT and being investigated for low flow predictions of compressor/turbine maps.Initial results are encouraging. Simulation results clearly show the importance low speed data accuracy.83
68
73
78
T-T)
20000 rpm40000 rpm
53
58
63
68
Effic
ienc
y (T
43
48
53
0 5 10 15 20 25 30 35 40
Black : TIT cold, Red : TIT hotBlue : Prediction by similarity
17
0 5 10 15 20 25 30 35 40
m (T^0.5)/p Corp. (kg/sec.(K^0.5)/MPa)
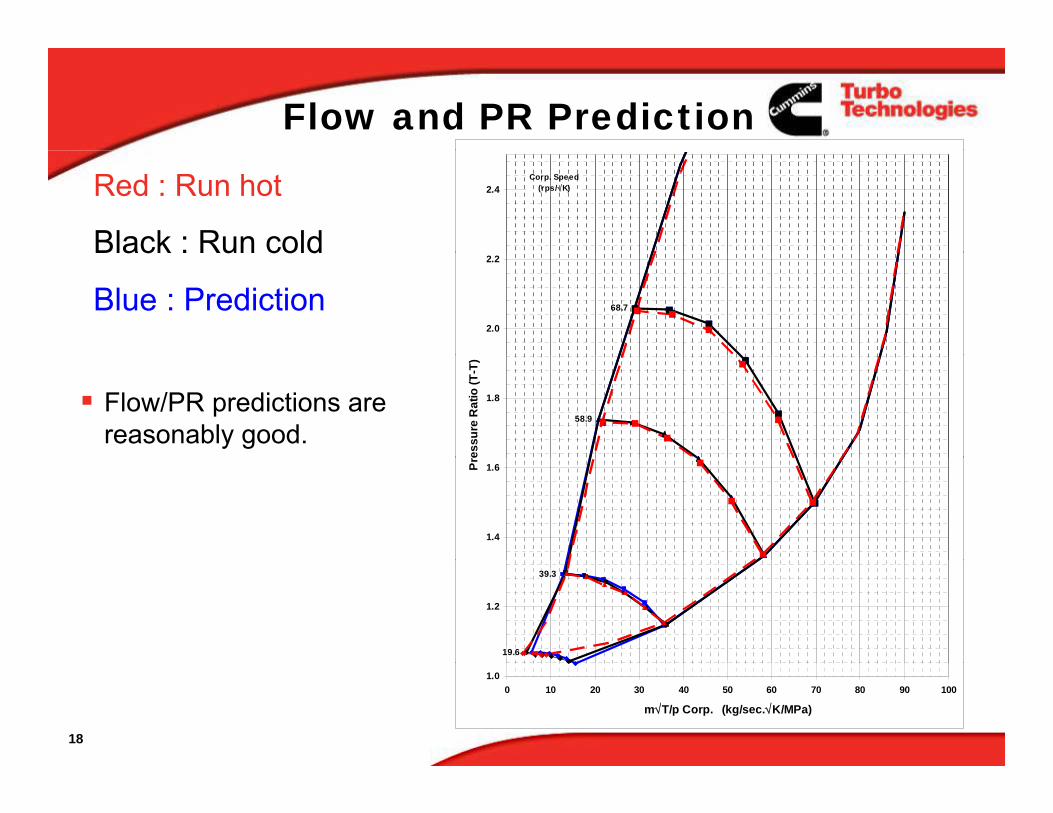
Flow and PR Prediction2.4
Corp. Speed(rps/√K)Red : Run hot
Black : Run cold
68.7
2.0
2.2Black : Run cold
Blue : Prediction
58.9
1.8
ress
ure
Rat
io (T
-T)
Flow/PR predictions are reasonably good.
1.4
1.6Pr
39.3
19.6
1.2
18
1.00 10 20 30 40 50 60 70 80 90 100
m√T/p Corp. (kg/sec.√K/MPa)
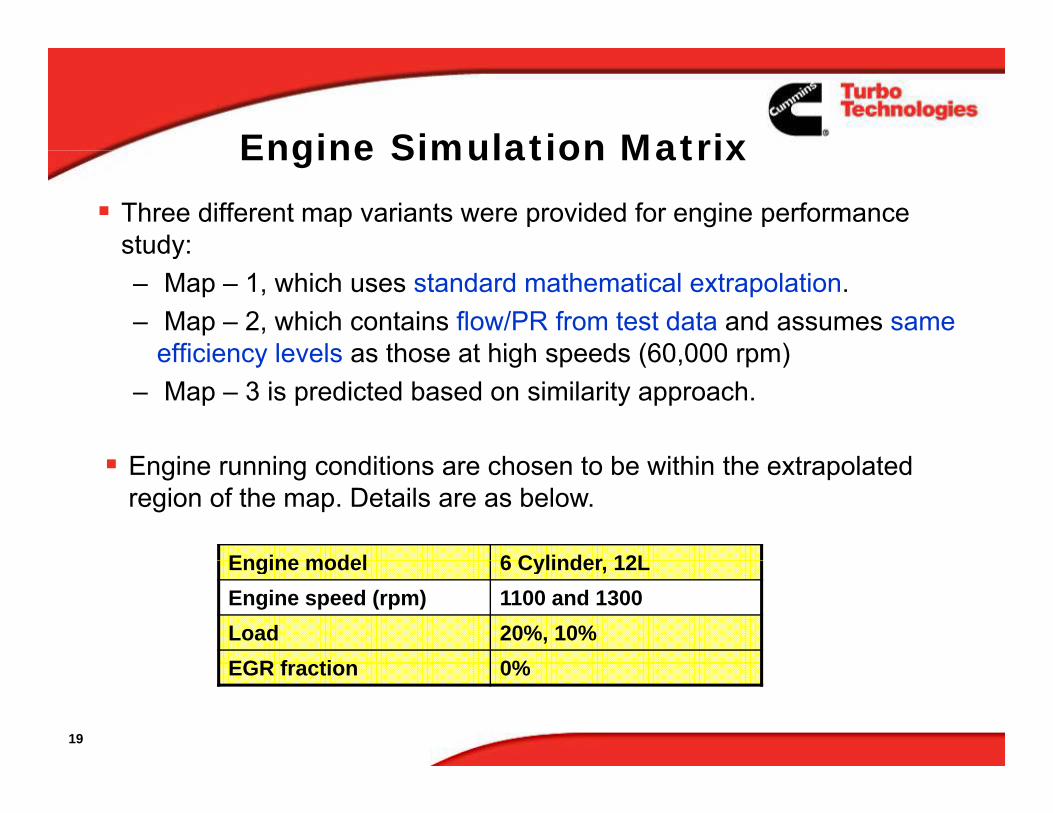
Engine Simulation MatrixEngine Simulation MatrixThree different map variants were provided for engine performance study:study:– Map – 1, which uses standard mathematical extrapolation.– Map – 2, which contains flow/PR from test data and assumes same
efficiency levels as those at high speeds (60 000 rpm)efficiency levels as those at high speeds (60,000 rpm)– Map – 3 is predicted based on similarity approach.
E i i diti h t b ithi th t l t dEngine running conditions are chosen to be within the extrapolated region of the map. Details are as below.
Engine model 6 Cylinder 12LEngine model 6 Cylinder, 12LEngine speed (rpm) 1100 and 1300Load 20%, 10%EGR f ti 0%
19
EGR fraction 0%
Engine Performance
Compressor PR and Efficiency Vs CA
Engine Performance
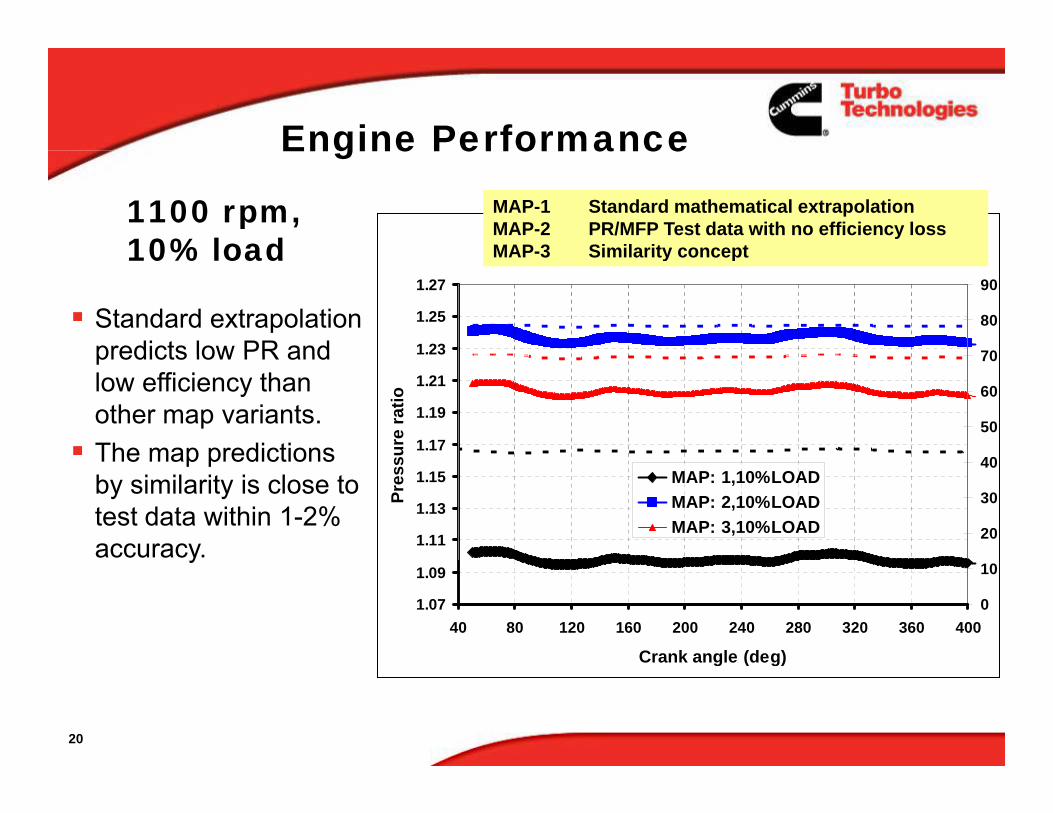
1100 rpm, 10% load
MAP-1 Standard mathematical extrapolationMAP-2 PR/MFP Test data with no efficiency lossMAP-3 Similarity concept
1.23
1.25
1.27
70
80
90
10% load MAP-3 Similarity concept
Standard extrapolation predicts low PR and
1.17
1.19
1.21su
re ra
tio
40
50
60
70predicts low PR and low efficiency than other map variants.The map predictions
1.11
1.13
1.15
Pres
s
20
30
40MAP: 1,10%LOADMAP: 2,10%LOADMAP: 3,10%LOAD
The map predictions by similarity is close to test data within 1-2% accuracy.
1.07
1.09
40 80 120 160 200 240 280 320 360 400
Crank angle (deg)
0
10y
20
g ( g)
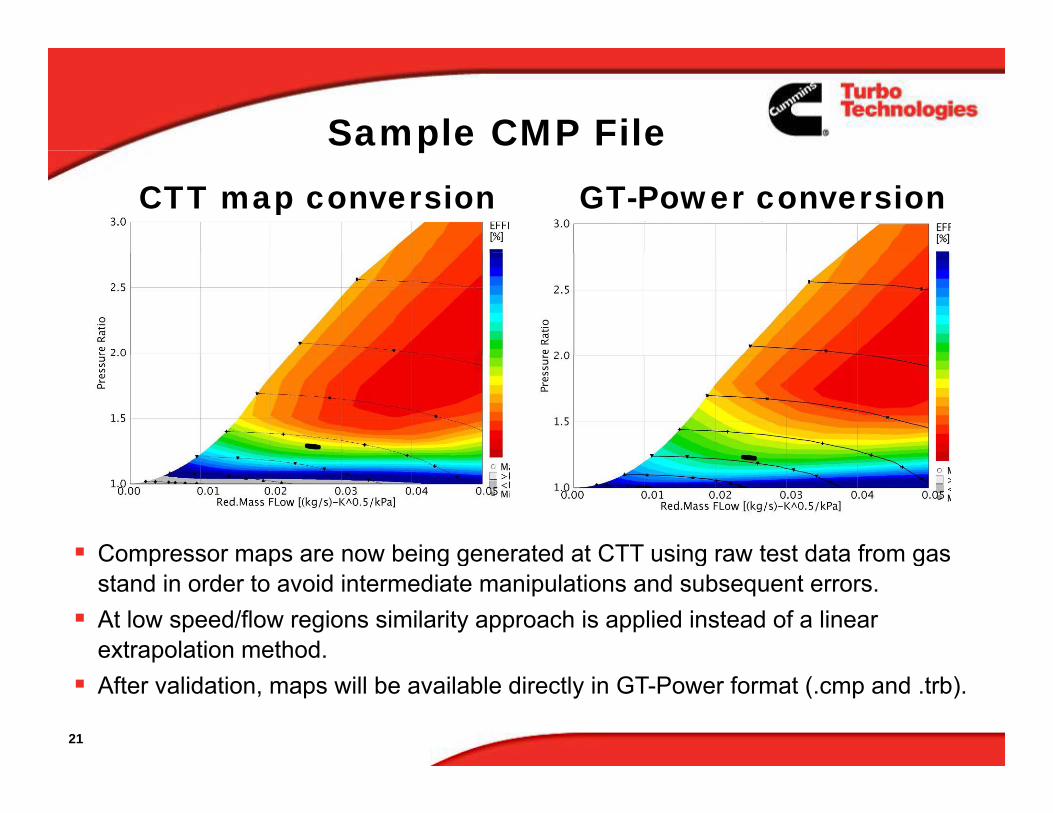
Sample CMP FilepCTT map conversion GT-Power conversion
Compressor maps are now being generated at CTT using raw test data from gasCompressor maps are now being generated at CTT using raw test data from gas stand in order to avoid intermediate manipulations and subsequent errors. At low speed/flow regions similarity approach is applied instead of a linear extrapolation method.
21
After validation, maps will be available directly in GT-Power format (.cmp and .trb).

The EndThe End
Thank you for your attention!Thank you for your attention!
Owen RyderOwen Ryder Ganesan Subramanian
Cummins Turbo TechnologiesCummins Turbo TechnologiesSt Andrew’s RoadHuddersfieldW t Y k hiWest YorkshireHD1 6RAEngland
/
22
www.cummins.com/turbos