Mercury nonstoichiometry of the Hg Ba CuO superconductor...
34
1 Mercury nonstoichiometry of the Hg 1-x Ba 2 CuO 4+δ superconductor and the P(Hg)-P(O 2 )-T phase diagram of the Hg-Ba-Cu-O system. V.A.Alyoshin * , D.A.Mikhailova, E.B.Rudnyi, E.V.Antipov. Department of Chemistry, Moscow State University, 119899, Moscow, Russia. Abstract The P(Hg)-P(O 2 )-T phase diagram of the Hg-Ba-Cu-O system for the Ba: Cu=2: 1 ratio was experimentally studied and followed by means of the thermodynamic modeling. It was shown that the Hg 1-x Ba 2 CuO 4+δ (Hg-1201) superconductor possesses a significant range of Hg-nonstoichiometry and exists in a certain P(Hg), P(O 2 ) and T range. Mercury nonstoichiometry of Hg-1201 was investigated in the 923 ≤ T ≤ 1095 K; 2.0 ≤ P(Hg) ≤ 8.4 atm; 0.09 ≤ P(O 2 ) ≤ 0.86 atm ranges. It was found that the mercury content varies in the range of 0.80-0.94 under these conditions. The Gibbs energy of the Hg-1201 phase was estimated as a function of temperature and mercury concentration. The obtained results allow optimizing the synthesis conditions of Hg-1201 with a given Hg-content including preparation of the Hg- stoichiometric phase. PACS: 74.72-h Keywords: HgBa 2 CuO 4+δ superconductor, Hg-Ba-Cu-O system, Hg-nonstoichiometry, thermodynamic assessment. 1. Introduction The HgBa 2 CuO 4+δ (Hg-1201) superconductor with T c = 97 K, the first member of the HgBa 2 Ca n-1 Cu n O 2n+2+δ homologous series (n = 1), discovered in 1993 [1], still attracts * Corresponding author: E-mail: [email protected]
Transcript of Mercury nonstoichiometry of the Hg Ba CuO superconductor...
1
Mercury nonstoichiometry of the Hg1-xBa2CuO4+δ superconductor and
the P(Hg)-P(O2)-T phase diagram of the Hg-Ba-Cu-O system.
V.A.Alyoshin*, D.A.Mikhailova, E.B.Rudnyi, E.V.Antipov.
Department of Chemistry, Moscow State University, 119899, Moscow, Russia.
Abstract
The P(Hg)-P(O2)-T phase diagram of the Hg-Ba-Cu-O system for the Ba: Cu=2: 1 ratio
was experimentally studied and followed by means of the thermodynamic modeling. It was
shown that the Hg1-xBa2CuO4+δ (Hg-1201) superconductor possesses a significant range of
Hg-nonstoichiometry and exists in a certain P(Hg), P(O2) and T range. Mercury
nonstoichiometry of Hg-1201 was investigated in the 923 ≤ T ≤ 1095 K; 2.0 ≤ P(Hg) ≤ 8.4
atm; 0.09 ≤ P(O2) ≤ 0.86 atm ranges. It was found that the mercury content varies in the range
of 0.80-0.94 under these conditions. The Gibbs energy of the Hg-1201 phase was estimated as
a function of temperature and mercury concentration. The obtained results allow optimizing
the synthesis conditions of Hg-1201 with a given Hg-content including preparation of the Hg-
stoichiometric phase.
PACS: 74.72-h
Keywords: HgBa2CuO4+δ superconductor, Hg-Ba-Cu-O system, Hg-nonstoichiometry,
thermodynamic assessment.
1. Introduction
The HgBa2CuO4+δ (Hg-1201) superconductor with Tc = 97 K, the first member of the
HgBa2Can-1CunO2n+2+δ homologous series (n = 1), discovered in 1993 [1], still attracts
* Corresponding author: E-mail: [email protected]
2
attention due to its relatively simple crystal structure and high Tc. The Hg-containing family
exhibits the record values of Tc up to 138 K for the third member of the series. The Hg-1201
superconductor is considered as a model phase to study the relationship between the crystal
structure and superconducting properties.
The high Tc values are supposed to be due to a perfect structure arrangement of the
superconducting CuO2 layers in these compounds. The extra oxygen atoms related to
nonstoichiometric index δ occupy the oxygen positions in the center of squares in the HgOδ
planes, and changing δ results in variation of a copper valence (VCu) and, consequently, Tc.
For these reasons, the main efforts were directed to study the oxygen nonstoichiometry and its
influence on superconducting properties [2 - 5]. The cupola-shaped dependence of Tc vs.
formal copper valence (VCu) or hole concentration (p) correlates with those for other known
copper-oxide superconductors. The maximum Tc corresponds to VCu = 2.16, determined from
iodometric titration data [2, 5], and p = 0.16 per Cu atom indirectly derived from the results of
thermoelectric power study [6, 7].
For the Hg-1201 phase with the stoichiometric cation composition HgBa2CuO4+δ, the
extra oxygen content has to be equal to δ = ½(VCu – 2), but numerous Neutron Powder
Diffraction (NPD) studies did not confirm this fact. These NPD results are in contradiction
with each other, as it was shown in Refs. [5, 8]. For instance, the δ values for the Hg-1201
phase exhibiting maximal Tc values were found to be 0.06 [9], 0.07 [8], 0.12 [5], 0.18 [10]
and even 0.22 [6]. Moreover, the authors of Refs. [11, 12] found that Tc close to optimal value
is practically constant in the wide δ range (0.06 - 0.17). We can conclude that the relationship
between δ, VCu and Tc in Hg-1201 may be more complicated than for the ideal model.
These discrepancies might be caused, for instance, by an uncontrolled disturbance of the
cation stoichiometry, more likely, the mercury one. Mercury can partly escape from the solid
phase to the free volume of an ampoule in the course of the synthesis. Wagner et al [13] were
3
the first who pointed out that the mercury content in Hg-1201 can be less than the
stoichiometric one. At present time, there is a number of papers where mercury deficiency
was revealed on powder samples [4, 5, 8, 14] and even on single crystals [15]. One can
suppose that the mercury deficiency is accompanied by the removal of the [HgO2]2– dumbbell
from the Hg-1201 structure with the formation of mercury point defects in HgOδ layers and
oxygen in BaO layers. This supposition may be indirectly confirmed by unusual high thermal
parameters of mercury and respective oxygen atoms found in numerous diffraction studies of
Hg-1201. In this case, in order to preserve the formal copper valence close to the optimal
carrier concentration, the oxygen content in the HgOδ layers is to increase. For instance, the
removal of 5% [HgO2]2– dumbbells would lead to an increase of the oxygen content in the
HgOδ layers by 0.05, in total it would be δ = 0.05 + ½(VCu – 2). It should be noted that such a
difference between the δ-values determined from the NPD and iodometric data on the same
Hg-1201 samples was found in [5].
Up to now there are some experimental data that the mercury content in Hg-1201
depends on the synthesis conditions. The EDS analysis revealed its variation in the range
0.92(4) – 1.02(5) (Ba/Cu=2/1), depending on the way of sample synthesis [14]. The samples
quenched from 800oC into cold water contained 0.92(4) mercury, but the slowly cooled
samples showed mercury content near the stoichiometric, 1.02(5). It was shown also that slow
cooling down to 600°C under partial oxygen and mercury pressures being constant is
favorable for obtaining the mercury stoichiometric sample [16].
Thus, we can conclude that the Hg-1201 phase has a certain Hg-homogeneity range, and
the mercury concentration depends on temperature and partial oxygen and mercury pressures.
Synthesis at relatively low temperature (600 - 650°C) [17, 18] or/and synthesis with an excess
of HgO (about 10% at 800°C [19]) can lead to the synthesis of practically stoichiometric Hg-
1201. In order to obtain Hg-1201 samples with the required cation composition we have to
4
know the boundary of the Hg-1201 homogeneity region in the P(Hg)-P(O2)-T coordinates and
dependences of the Hg-concentration in Hg-1201 vs. temperature, P(Hg), and P(O2). Up to
now, there are no data describing the influence of these parameters on the Hg-content in the
Hg-1201 phase. The phase diagram of the Hg-Ba-Cu-O system for the Ba/Cu = 2/1 ratio was
computed in Ref [20] on the base of thermodynamic data without taking into account this
problem.
The goals of the present work are to determine the dependences of the Hg-concentration
in the Hg-1201 phase upon T, P(Hg) and P(O2); to construct the P(Hg)-P(O2)-T phase
diagram of the Hg-Ba-Cu-O system for the Ba/Cu = 2/1 ratio from the result of simultaneous
thermodynamic assesment; and finally, to optimize synthesis of Hg-1201 with the required
cation stoichiometry.
2. Experimental
2.1. Sample preparation and characterization.
The synthesis of HgBa2CuO4+δ was carried out in a sealed silica tube from Ba2CuO3+y
and mercury oxide. The initial reactions in sealed tubes occur mainly via vapor (v)/solid (s)
interactions according to the following equilibria:
HgO (s) ↔ Hg (v) + ½ O2
Ba2CuO3+x (s) + Hg (v) + (1-x+δ)/2 O2 ↔ HgBa2CuO4+δ (s) (2.1)
Pure HgO (99.9%), BaO2 (99.99%), and CuO (99.99%) were taken as starting oxides.
The Ba2CuO3+y precursor was obtained by annealing the fine mixture of BaO2 and CuO taken
in molar ratio 2/1 in oxygen flow at 900°C for 24h. The Hg-1201 phase was formed from
pelletized Ba2CuO3+x and HgO mixtures taken in appropriate ratios. The alumina crucibles
were used in order to prevent the interaction of precursor with silica tubes in which the
experiments were carried out.
5
The redox pairs based on transition metals were used to adjust the partial oxygen
pressure inside the closed silica tubes. The CoO/Co3O4 pair [21, 22] was used when P(O2) < 1
atm:
logP(O2)[atm] = –15600/T + 12.6 (1000-1240K), (2.2)
whereas the Mn2O3/MnO2 redox pair [21, 22] was used for higher pressures:
logP(O2)[atm] = –6890/T + 8.126 (800-1000K). (2.3)
The Hg-1201/Ba2CuO3+x pair was used to control the partial mercury pressure at fixed
P(O2).
The phase composition and lattice parameters were determined by X-ray powder
diffraction (XRD) using Guinier-camera FR-552 (Cu-Kα1 radiation, λ = 1.5406Å) with
germanium as an internal standard. The titration by ammonium rhodanide was used for
mercury content determination.
2.2. Static weight technique.
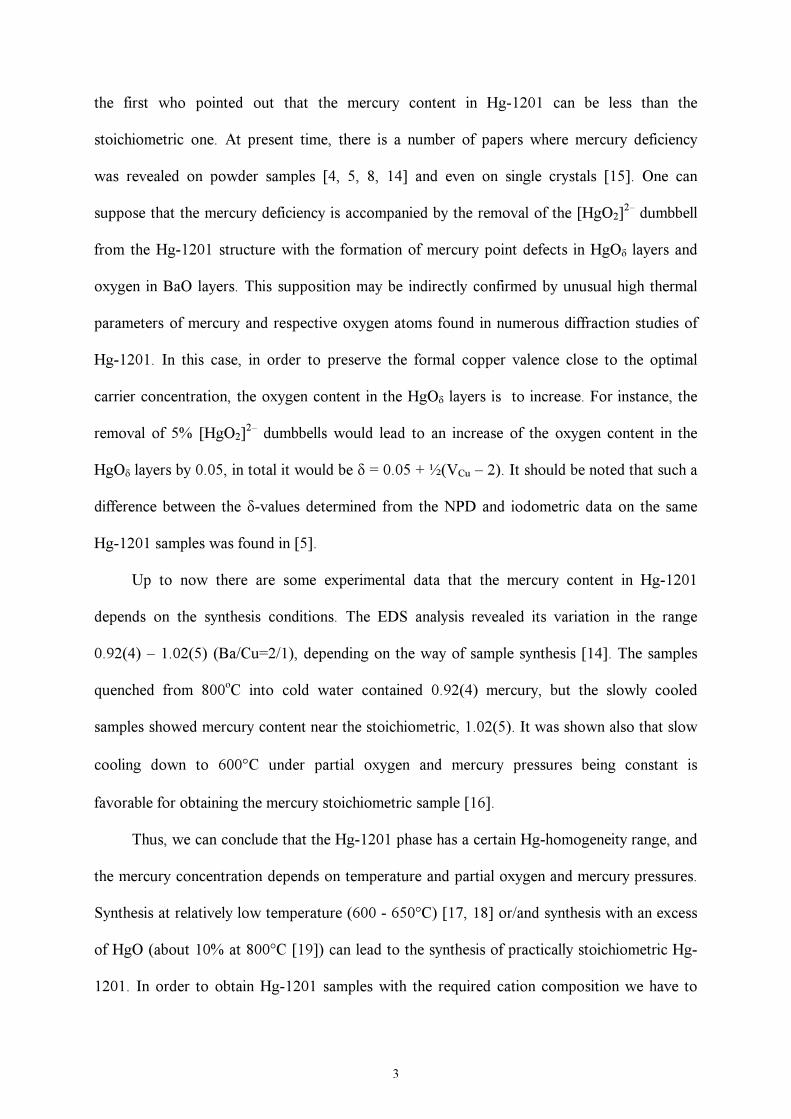
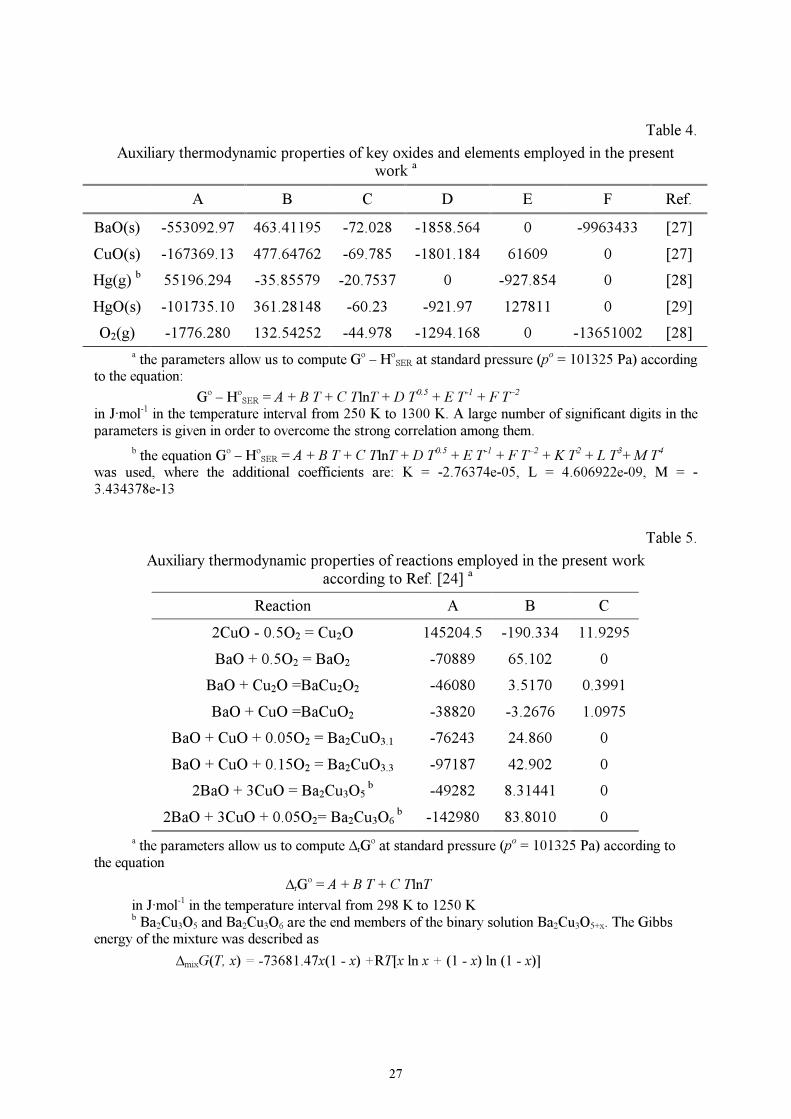
Two-temperature (Fig.1) and three-temperature (Fig.2) variations of the Static Weight
Technique (SWT) were used in our investigations. The evacuated (10-2 Torr) silica tubes of
19 cm length and 10 mm inner diameter loaded with substances were placed into a
temperature-gradient furnace and suspended to an analytical balance. The accuracy of the ∆F
(this value corresponds to the balance indication change) measurement was ±0.0005 g; the
temperature inside the furnace was controlled with accuracy of ±2°C.
The two-temperature SWT was used by us earlier to study the three-phase S(Hg-1201)-
S(Ba2CuO3+x)-V equilibrium in the Hg-Ba-Cu-O system [16], while the three-temperature
variation was applied in the present work. The two-temperature technique allows us to
determine the mercury content in Hg-1201 and to calculate the mercury pressure over Hg-
6
1201 at fixed P(O2), while the three-temperature SWT allows us to determine the Hg-
concentration in Hg-1201 at given P(O2) and P(Hg).
For the calculation of partial pressures in these experiments, it was supposed that the
silica tube is divided into two or three isothermal parts of known length (dashed lines in
Figs.1, 2) with constant P(Hg), P(O2), P(HgO) inside each volume. The mass measurements
after temperature change were done when balance indicator had stopped. This corresponds to
achievement of steady state inside the ampoule volume, and the quasi-equilibrium states
inside each isothermal volume. The equal values of the balance indicator for the
measurements under heating and under cooling prove the achievements of these quasi-
equilibrium states. Below we shortly describe the main principles, which were taken into
account in the calculation.
2.2.1. Two-temperature static weight technique.
A mixture of known amounts of Ba2CuO3+x and HgO put at T2 reacts under heating
yielding Hg-1201 phase according to equation (2.1). Some amount of HgO evaporates into
the ampoule volume with decomposition to Hg(v) and O2. It was supposed in our calculations
that the extra oxygen index δ in Hg-1201 is equal to “x” in Ba2CuO3+x. A small amount of
HgO(v) in vapor phase is present because of existence of the following equilibrium [21, 22]:
Hg(v) + ½ O2 ↔ HgO(v) (lgKp(HgO) = 1048/T – 2.069). (2.4)
A part of oxygen is absorbed by CoO at T1 (Fig.1) when P(O2) exceeds the oxygen
pressure over the redox pair CoO/Co3O4, or eliminated from Co3O4 in the opposite case.
Partial oxygen pressure at T1 is described by equation (2.2) for the CoO/Co3O4 redox pair or
by equation (2.3) for the Mn2O3/MnO2 pair. Thus, we can write the following mass balance
equation:
∆mo(HgO/Ba2CuO3+x) = mV1 + mV2 + ∆mg(O2) (2.5)
and mVi = mi(O2) + mi(Hg) + mi(HgO),
7
where mV1 and mV2 are vapor masses in volumes V1 and V2, respectively; mi(O2), mi(Hg),
mi(HgO) are masses of O2, Hg, HgO in vapor in each volume Vi; ∆mo(HgO/Ba2CuO3+x) is
mass loss of the starting mixture; ∆mg(O2) is mass change of the oxygen getter (positive for
absorption).
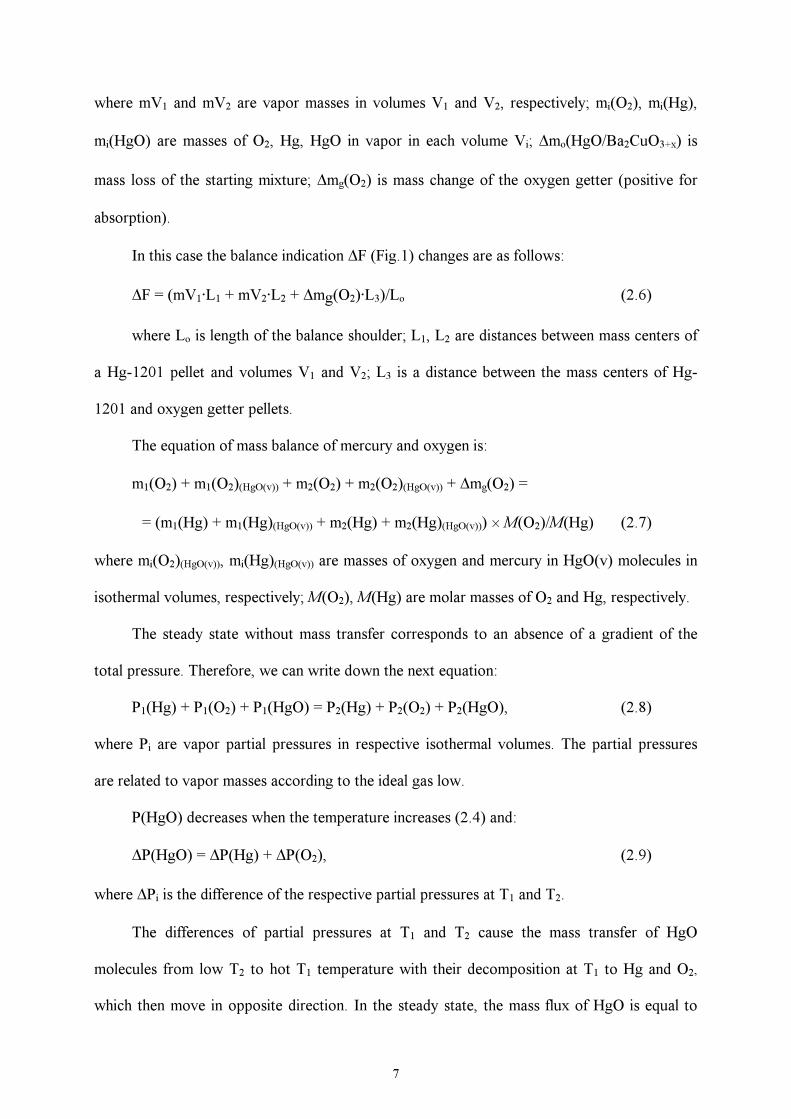
In this case the balance indication ∆F (Fig.1) changes are as follows:
∆F = (mV1·L1 + mV2·L2 + ∆mg(O2)·L3)/Lo (2.6)
where Lo is length of the balance shoulder; L1, L2 are distances between mass centers of
a Hg-1201 pellet and volumes V1 and V2; L3 is a distance between the mass centers of Hg-
1201 and oxygen getter pellets.
The equation of mass balance of mercury and oxygen is:
m1(O2) + m1(O2)(HgO(v)) + m2(O2) + m2(O2)(HgO(v)) + ∆mg(O2) =
= (m1(Hg) + m1(Hg)(HgO(v)) + m2(Hg) + m2(Hg)(HgO(v))) × M(O2)/M(Hg) (2.7)
where mi(O2)(HgO(v)), mi(Hg)(HgO(v)) are masses of oxygen and mercury in HgO(v) molecules in
isothermal volumes, respectively; M(O2), M(Hg) are molar masses of O2 and Hg, respectively.
The steady state without mass transfer corresponds to an absence of a gradient of the
total pressure. Therefore, we can write down the next equation:
P1(Hg) + P1(O2) + P1(HgO) = P2(Hg) + P2(O2) + P2(HgO), (2.8)
where Pi are vapor partial pressures in respective isothermal volumes. The partial pressures
are related to vapor masses according to the ideal gas low.
P(HgO) decreases when the temperature increases (2.4) and:
∆P(HgO) = ∆P(Hg) + ∆P(O2), (2.9)
where ∆Pi is the difference of the respective partial pressures at T1 and T2.
The differences of partial pressures at T1 and T2 cause the mass transfer of HgO
molecules from low T2 to hot T1 temperature with their decomposition at T1 to Hg and O2,
which then move in opposite direction. In the steady state, the mass flux of HgO is equal to
8
sum of the Hg and O2 mass fluxes. In the case of the molecular diffusion of Hg and O2 we can
write, supposing that coefficients of the Hg and O2 diffusion are equal, that:
∆P(Hg) = 2∆P(O2) (2.10)
since the O2 molar flux (JO2) is equal to one half of the Hg flux (JHg) in accordance with the
reaction (2.4).
The mercury concentration (1-x) in the single-phase Hg-1201 sample was calculated
from the following equation:
1-x = (mHg(HgO(start)) – mHg(v) – MHg(HgO(v)))/mHg(Hg-1201) (2.11)
where mHg(HgO(start)) is mercury mass in the starting HgO + Ba2CuO3+x mixture; mHg(v) is
mercury vapor mass; MHg(HgO(v)) is mercury mass in HgO(v); mHg(Hg-1201) is the calculated
mass in stoichiometric Hg-1201.
Solving the system of equations (2.2)-(2.11) allows us to calculate P(Hg), P(HgO),
P(O2) at T1 and T2, and the mercury concentration in Hg-1201. These equations are applied
for two-phase equilibrium S(Hg-1201)-V only.
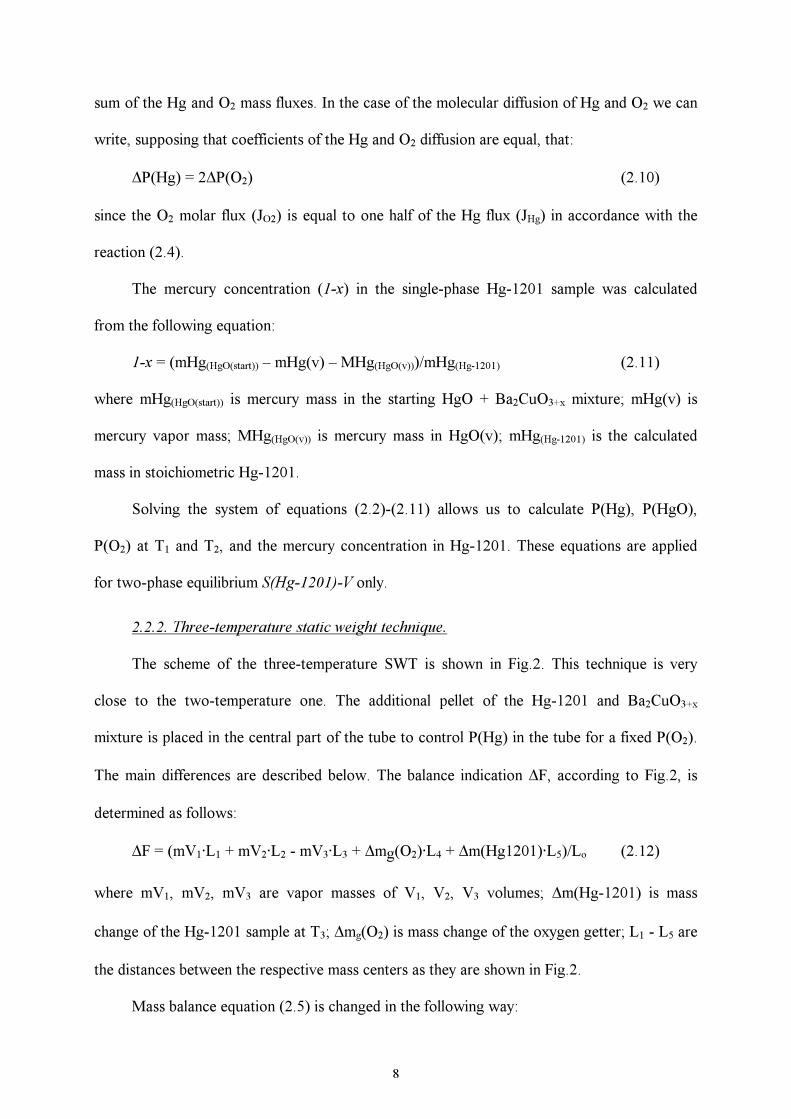
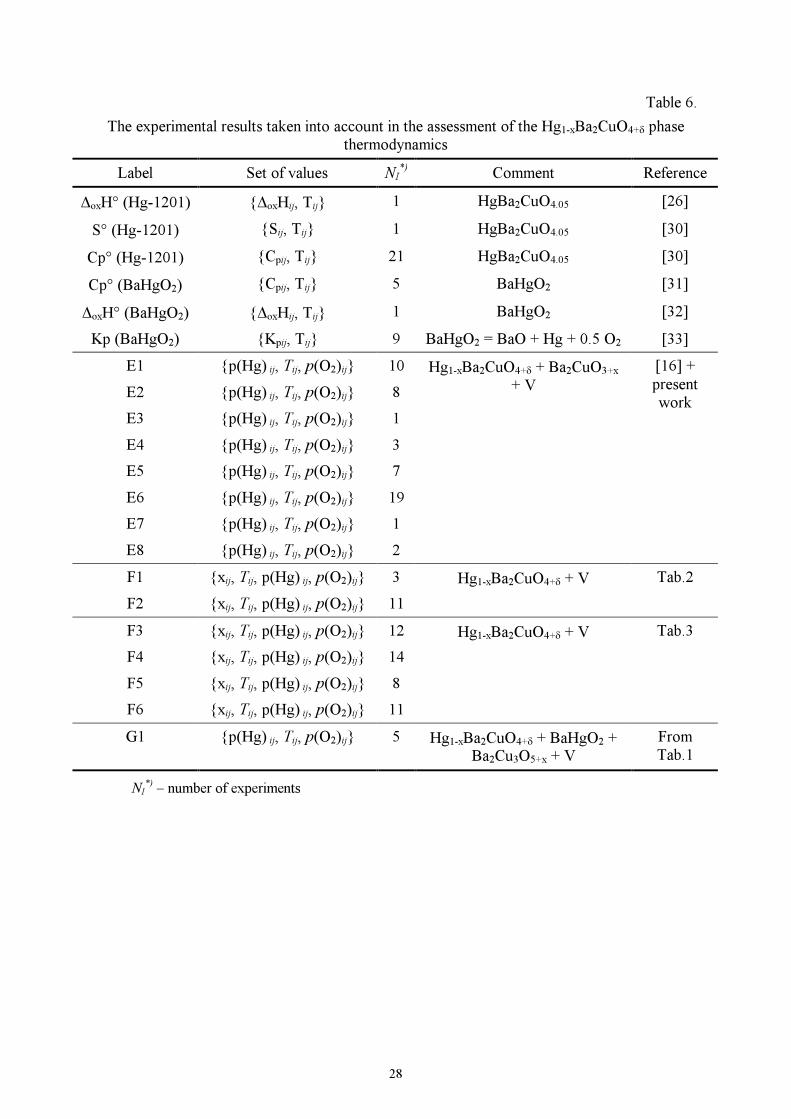
2.2.2. Three-temperature static weight technique.
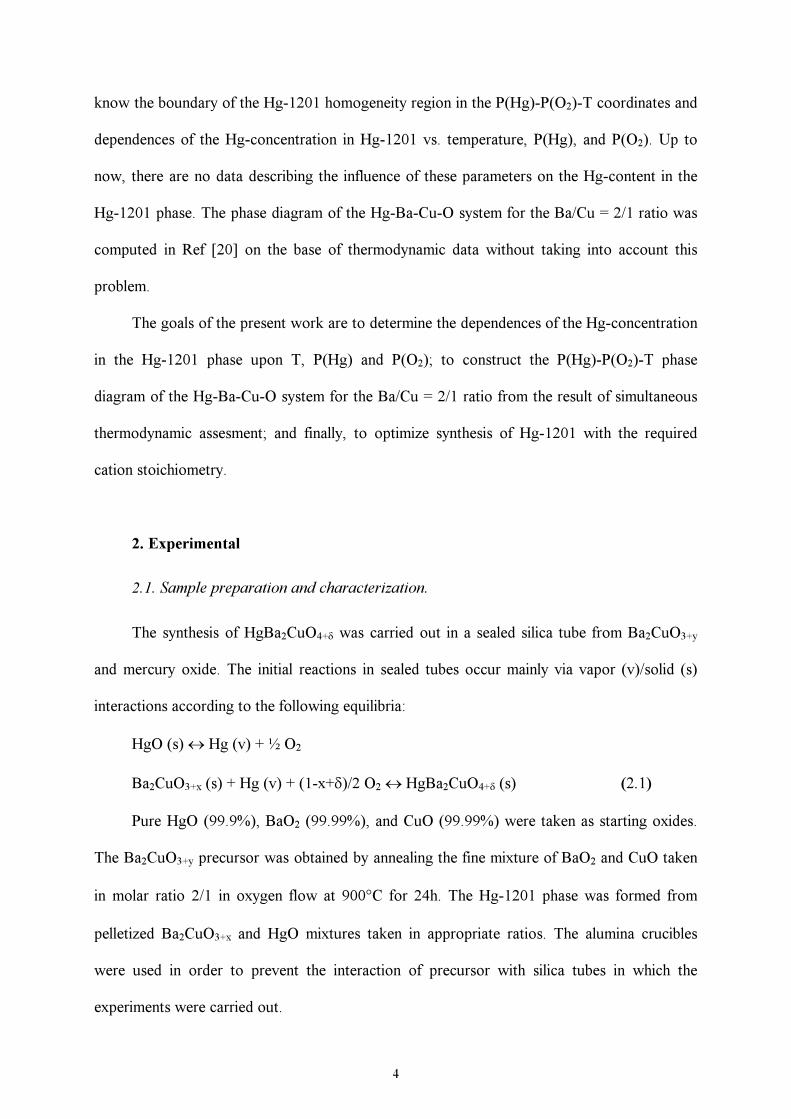
The scheme of the three-temperature SWT is shown in Fig.2. This technique is very
close to the two-temperature one. The additional pellet of the Hg-1201 and Ba2CuO3+x
mixture is placed in the central part of the tube to control P(Hg) in the tube for a fixed P(O2).
The main differences are described below. The balance indication ∆F, according to Fig.2, is
determined as follows:
∆F = (mV1·L1 + mV2·L2 - mV3·L3 + ∆mg(O2)·L4 + ∆m(Hg1201)·L5)/Lo (2.12)
where mV1, mV2, mV3 are vapor masses of V1, V2, V3 volumes; ∆m(Hg-1201) is mass
change of the Hg-1201 sample at T3; ∆mg(O2) is mass change of the oxygen getter; L1 - L5 are
the distances between the respective mass centers as they are shown in Fig.2.
Mass balance equation (2.5) is changed in the following way:
9
∆mo(Hg-1201/Ba2CuO3+x) = mV1 + mV2 + mV3 + ∆mg(O2) + ∆m(Hg-1201) (2.13)
where: ∆mo(Hg-1201/Ba2CuO3+x) - mass change of the Hg-1201/Ba2CuO3+x mixture at T2.
2.2.3. Testing of SWT.
In order to check the correctness of the models used for the vapor pressure calculation
from the SWT data and to estimate the precision of the results obtained, the following tests
were performed.
Mercury oxide (m(HgO) = 0.1121 g) was placed without oxygen getter in a silica tube
at T2 instead of Hg-1201 and heated, as in the two-temperature SWT (Fig.1). Temperatures T1
and T2 were varied independently in the 600-900°C (T1) and 650-800°C (T2) ranges for the
unsaturated vapor. Deviation of the vapor mass, calculated from SWT data, from the starting
m(HgO) did not exceed ± 2% in these ranges (the total vapor pressure was about 4-6 atm).
The same test with liquid mercury carried out in the temperature range 246-483°C (0.075 <
P(Hg) < 6.5 atm) showed that the difference between the measured saturated pressure and
literature data [23] did not exceed ± 2% also for P(Hg) ≥ 2 atm.
2.3. Annealing under controlled mercury and oxygen partial pressures.
Two variants of annealing under controlled mercury and oxygen pressures were used for
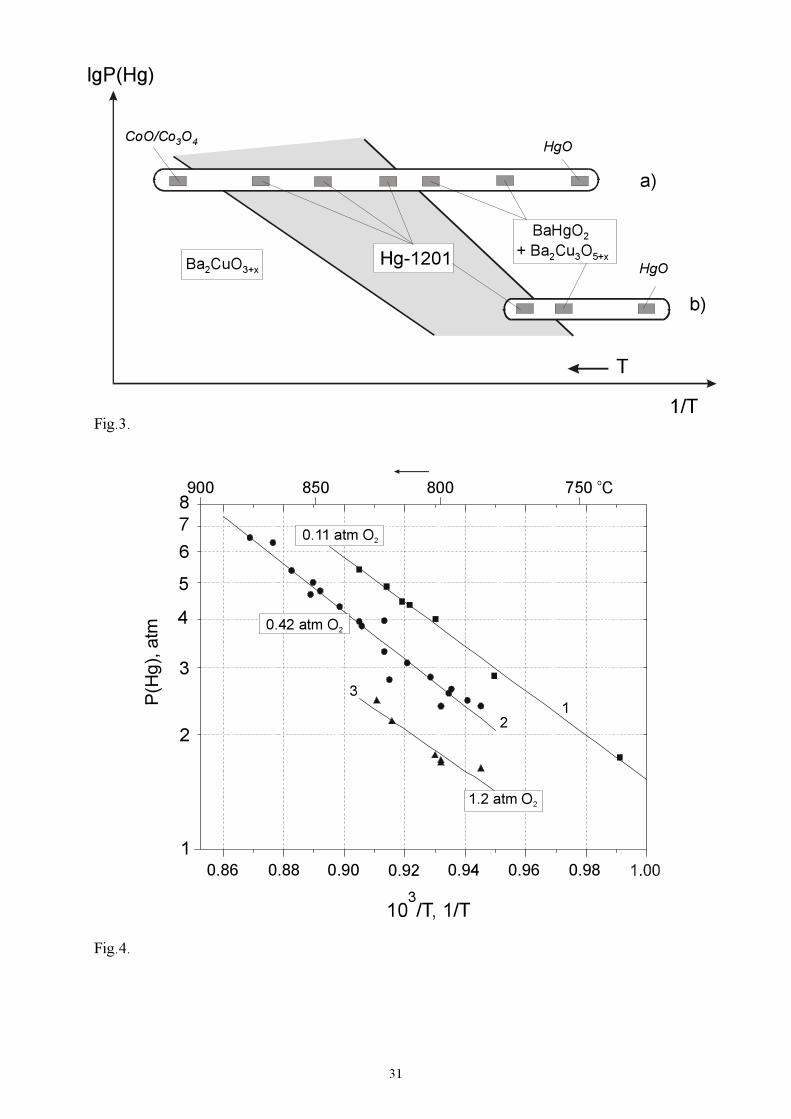
the study of the Hg-Ba-Cu-O system in addition to SWT: polythermal (Fig.3, position (a))
and two-temperature (Fig.3, position (b)). In polythermal annealing the transition metal oxide
mixture at highest temperature and pure HgO at lowest temperature are used to control P(O2)
and P(Hg) (at constant P(O2)), respectively. Up to five Hg-1201 samples heated at different
temperatures were used to determine the upper boundary of the Hg-1201 stability field.
In the two-temperature variant, pure HgO is used to control partial pressures of Hg and
O2, where their ratio 2/1 was suggested. We have neglected the difference in the oxygen
stoichiometry in Hg-1201 and Ba2CuO3+x, because the values of extra oxygen content are
10
close to each other and experiments are carried out in large ampoules with a small amount of
studied sample.
3. Results and discussion.
3.1. The P(Hg)-P(O2)-T phase diagram.
Two different phase equilibria of Hg-1201 with vapor and coexisting phases were
studied in the Hg-Ba-Cu-O system: the three-phase equilibrium S(Hg-1201)-S(Ba2CuO3+x)-V
and the four-phase equilibrium S(Hg-1201)-S(Ba2Cu3O5+x)-S(BaHgO2)-V.
3.1.1. The S(Hg-1201)-S(Ba2CuO3+x)-V equilibrium.
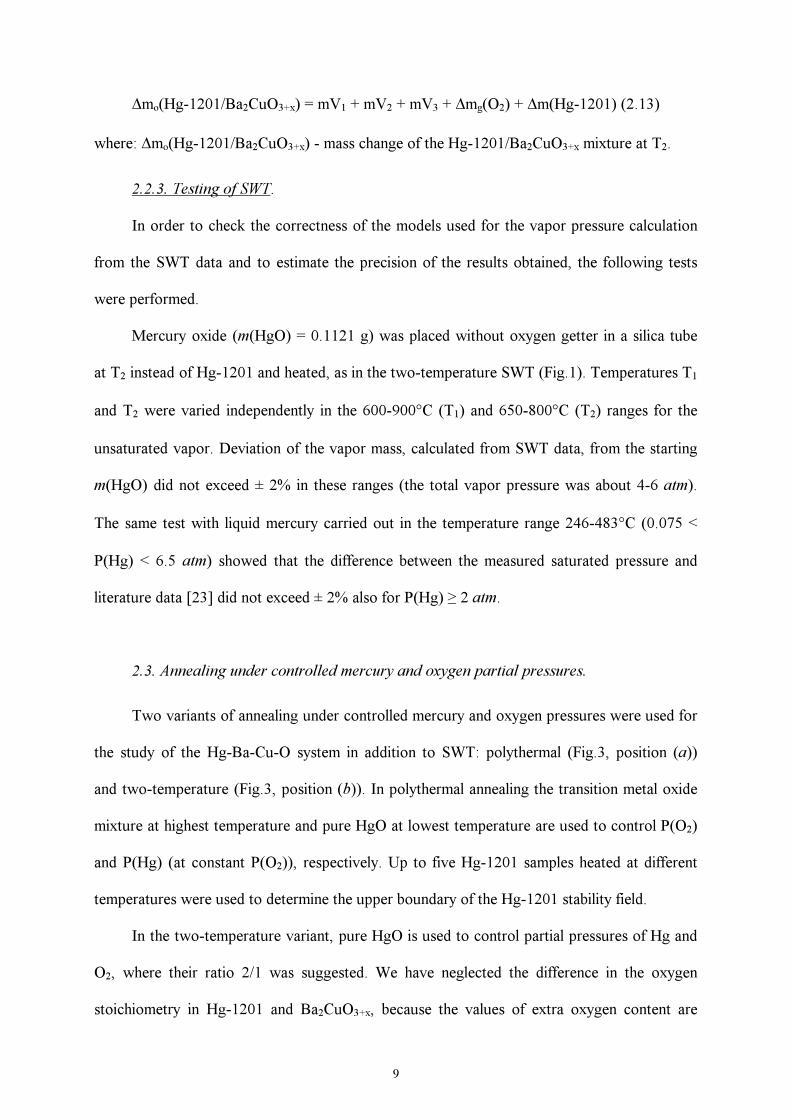
This equilibrium corresponding to the reaction (2.1) describes the lower boundary of the
Hg-1201 stability region. The dependence of the partial mercury pressure vs. P(O2) and T was
studied earlier [16] using the two-temperature SWT. The experimental pressure values
obtained in [20] agree well with this dependence. New experimental data were obtained for
the higher oxygen pressure. The Mn2O3/MnO2 getter was used to achieve the oxygen pressure
up to 2.6 atm. A part of the new results obtained at 1.2 atm and literature data are presented in
Fig.4 as temperature dependences of the mercury pressure at constant P(O2).
The following dependence was computed from all experimental data for 0.1<P(O2)<2.6
atm, 1.4<P(Hg)<6.5 atm and 1009<T<1151 K ranges:
logP(Hg)[atm] = – (6514±178)/T – (0.329±0.010)·log(PO2)[atm] +
+ (6.347±0.163), (3.1)
standard deviation (SD) = 0.024, number of points (N) = 50.
Therefore, the lower boundary of the Hg-1201 stability field as a function of P(Hg),
P(O2), and T in the above quoted ranges is described as follows:
log P(Hg) + 0.329log P(O2) + 6514/T > 6.347. (3.2.)
11
3.1.2. The S(Hg-1201)-S(Ba2Cu3O5+x)-S(BaHgO2)-V equilibrium.
The upper boundary of the Hg-1201 stability field was deduced from the results of two-
temperature and polythermal annealing of the samples heated at different P(O2) and P(Hg) for
about 20-24 h followed by XRD analysis (Fig.4), and from the SWT data. Selected
experimental results illustrating the influence of these parameters on the decomposition
reaction are listed in Table 1.
These experiments showed that Hg-1201 decomposed at certain experimental
conditions according to following reaction:
3HgBa2CuO4+δ + Hg(v) + (1-3δ+x)/2O2 → 4BaHgO2 + Ba2Cu3O5+x (3.3)
Therefore, we conclude that the four-phase equilibrium S(Hg-1201)-S(Ba2Cu3O5+x)-
S(BaHgO2)-V determines the upper boundary of the Hg-1201 stability field. Kp of the
decomposition reaction (3.3) is expressed by the following equation:
Kp = P(Hg) –1 × P(O2) – (1-3δ+x)/2.
We assumed that the oxygen coefficient (1-3δ+x)/2 is equal to 0.75, because the extra
oxygen content δ in Hg-1201 is close to 0.05, while x in Ba2Cu3O5+x is close to 0.65 [24] at
these experimental conditions.
We could use only 7 experimental points, marked by asterisks in Tab.1 for the
estimation of the numerical coefficients for the P(Hg) vs. P(O2) and T dependence. The
selected experimental data correspond to the four-phase equilibrium, or their parameters
(partial pressures and temperature) are close to the surface describing this equilibrium. The
following expression describes this four-phase equilibrium:
logP(Hg)[atm] = – 9851/T – 0.75·logP(O2)[atm] + 10.60 (3.4)
(0.43 ≤ P(O2) ≤4.7 atm, 3.0 ≤ P(Hg) ≤ 10.3 atm, 968 ≤ T ≤ 1073 K, N = 7).
Therefore, the upper boundary of the Hg-1201 stability field is expressed by the
equation:
12
logP(Hg) + 0.75·logP(O2) + 9851/T < 10.60 (3.5)
3.1.3. The P(Hg)-P(O2)-T phase diagram.
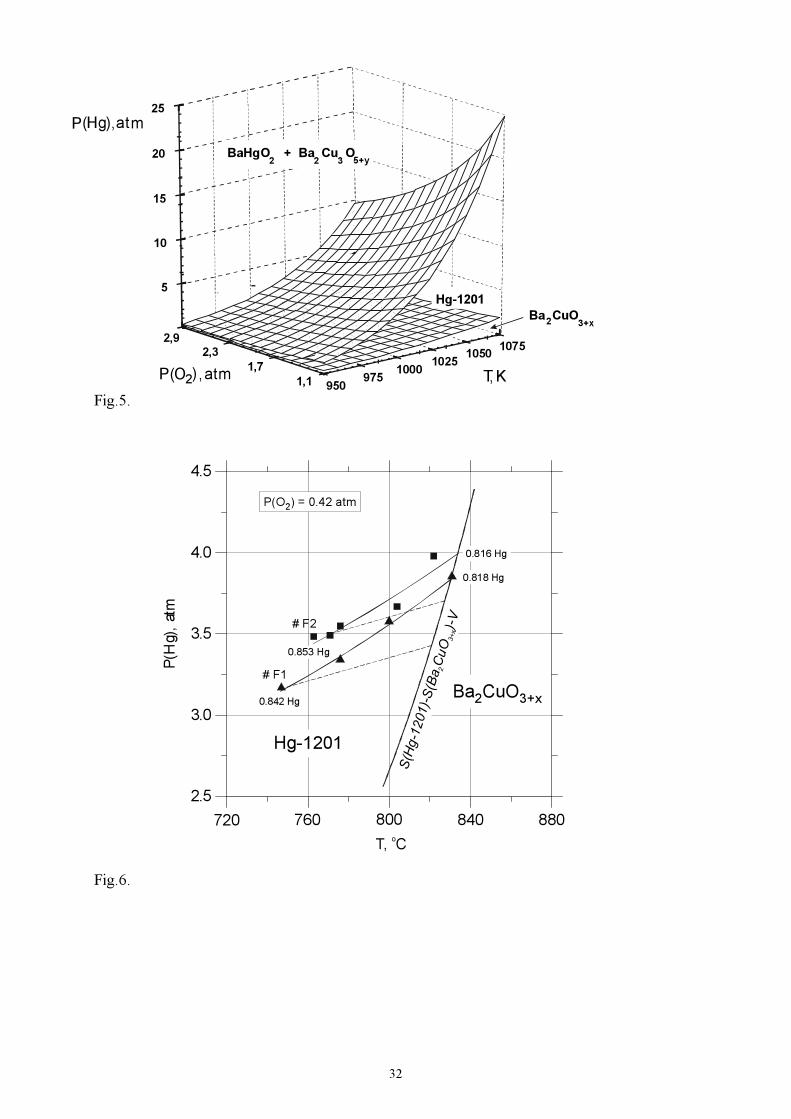
The part of the 3-D P(Hg)-P(O2)-T phase diagram of the Hg-Ba-Cu-O system for the
cation ratio Ba/Cu = 2/1 shown in Fig. 5 was constructed using the results described above.
The studied equilibria S(Hg-1201)-S(Ba2CuO3+x)-V and S(Hg-1201)-S(BaHgO2)-
S(Ba2Cu3O5+x)-V are shown in this diagram as the surfaces sandwiching the Hg-1201 stability
field. Ba2CuO3+x is stable below the lower surface, while BaHgO2 and Ba2Cu3O5+x are formed
above the upper surface. As one can see, the region of the Hg-1201 stability field becomes
larger with increasing T and decreasing P(O2). This might be explained by the
thermodynamical instability of Ba2Cu3O5+x at low oxygen pressure and high temperature [24].
3.2. Mercury nonstoichiometry of Hg-1201.
The variation of mercury concentration in Hg-1201 vs. P(Hg), P(O2), and T inside the
stability field of the Hg-1201 phase was studied by the two- and three-temperature variants of
SWT.
Two-temperature SWT study. The dependences of the mercury vapor pressure over Hg-
1201 vs. T at P(O2) = 0.4 atm for the experiments #F1 and #F2 are presented in Fig.6 and
Tab.2. One can see from these experiments that the Hg1-xBa2CuO4+δ phase loses mercury
under heating into the free volume of the ampoule with increasing the Hg-vapor pressure and
decreasing the mercury concentration in the Hg-1201 phase until the three-phase equilibrium
S(Hg-1201)-S(Ba2CuO3+x)-V is achieved. Then the slope of the curve becomes much larger in
according with this equilibrium. For comparison, we plotted by dashed lines the variation of
P(Hg) vs. T if the Hg-1201 phase did not change its Hg-concentration under heating. Thus,
we can conclude that the Hg-concentration in Hg-1201 changes inside the stability field of
this phase.
13
Three-temperature SWT study. This technique was used in a wide range of parameters
and Hg-concentration variation because the temperature of the sample and partial pressures,
P(Hg), P(O2), can be changed independently in these experiments. Four different samples
were used in these investigations, #F3 - #F6 (Tab.3). In all cases, except sample #F3, single-
phase Hg-1201 samples were found after finishing the experiments and quenching the
samples into cold water. The experiment #F3 differs from others because the last point lies
outside the stability field of Hg-1201. This point corresponds to existence of BaHgO2 and
Ba2Cu3O5+x according to expression (3.5) describing the upper stability field of Hg-1201.
The variation of Hg-concentration vs. experimental conditions is given in Tab.3
together with the results of the rhodanometric determination of the mercury content. The
discrepancies between the SWT data and the rhodanometric titration results of the single-
phase solid samples did not exceed 2 at.% Hg.
By simultaneous treatment of all experimental data (Tabs.2 and 3) we were able to
deduce the dependence of Hg-concentration (1-x) in the Hg-1201 phase vs. P(Hg), P(O2), and
T by the following expression:
log(1-x) = 336.9(±23.2)/T + 0.0657(±0.0090)×logP(Hg) +
+ 0.0329(±0.0045)×logP(O2) – 0.419(±0.023) (3.6)
in the 923 ≤ T ≤ 1095 K, 2.0 ≤ P(Hg) ≤ 8.4 atm, and 0.09 ≤ P(O2) ≤ 0.86 atm ranges,
SD = 0.0074, N = 59
3.3. Thermodynamic assessment.
The experimental results described above have been combined with thermodynamical
data available in literature to derive the Gibbs energies of all phases under equilibrium in the
Hg-Ba-Cu-O system. The ratio Ba/Cu=2/1 as in the Hg-1201 phase has been fixed in the
present modeling.
14
This computation was based on the thermodynamic properties of compounds listed in
Tab. 4. The molar Gibbs energy computed from the coefficients shown in Tab. 4 is related to
the "Standard Element Reference (SER)". The conception of the SER is discussed elsewhere,
for example in Ref. [25].
In order to describe the phase equilibria with the Hg1-xBa2CuO4+δ phase, it is necessary
to employ the Gibbs energies of the coexisting phases. The Gibbs energies of the phases in
the Ba-Cu-O system were used as given in Ref. [24] (see Tab. 5). The unknown Gibbs energy
of the Hg-1201 phase depending on the mercury and oxygen composition and temperature
was assessed from the experimental data and reference thermodynamical values (see Tab.6).
In order to compute the molar Gibbs energy of the Hg1-xBa2CuO4+δ phase, the extra
oxygen index δ was assumed to be constant and equal to 0.05. This is a rather rough
assumption, and the main reason behind it is the lack of a reliable experimental data set to
estimate the Gibbs energy dependence vs. δ and T. As a result of this assumption, a known
dependence of ∆fH°298 vs. δ, obtained from the calorimetric study [26], has not been used in
the present work.
The mercury non-stoichiometry was modeled by means of the simple point-defect
model where the molar Gibbs energy could be expressed as:
∆oxG(T, x) = x g1(T) +(1-x)g2(T) + x(1-x)ao(T) + RT[x ln x + (1-x) ln (1-x)] (3.7)
where gi(T) and ao(T) are the temperature functions to be determined; ∆oxG(T, x) – the Gibbs
energy of formation from the oxides, HgO, BaO, CuO, and oxygen i.e., the Gibbs energy of
the reaction:
(1-x)HgO(s) + 2BaO(s) + CuO(s) + 0.025 O2 ↔ Hg1-xBa2CuO4-x+0.05(s) (3.8)
Therefore, the assessment of Hg1-xBa2CuO4+δ thermodynamics is equivalent to
determining the unknown temperature functions, gi(T) and ao(T) Eq.(3.7). The latter
determination is possible if we choose a certain analytical function of temperature and put
15
unknown parameters within it. In this way, the temperature dependence of these coefficients
gi(T) and ao(T) and the Gibbs energy G(T) by the same function was chosen as follows
(G(T), gi(T), ao(T)) = A + B T + C TlnT + D T0.5 + E T
-1 (3.9)
The Gibbs energy of BaHgO2 was also considered as an unknown function and it was
determined in the present work simultaneously with the Gibbs energy of Hg1-xBa2CuO4+δ by
means of modeling the Gibbs energy of the reaction
HgO(s) + BaO(s) ↔ BaHgO2(s) (3.10)
by Eq. (3.9) with its own unknown parameters.
The enthalpies, entropies and the heat capacities of reactions (3.8) and (3.10) are found
from the Gibbs energies as
∆oxHcalc = -T2{[∂∆oxG/T]/∂T} (3.11)
∆oxScalc = -{∂∆oxG/∂T} (3.12)
∆oxCpcalc = -T{∂2∆oxG/∂T2} (3.13)
Table 6 lists the chosen experiments that have been used to determine the Gibbs
energies of Hg1-xBa2CuO4+δ and BaHgO2. A label was assigned to each experiment and all the
data displayed are referred to this label.
The main principles of thermodynamic assessment are presented, for instance, in Ref.
[24]. In the general form the relationship between the measured property and the controlled
variables can be expressed as
yij = yijcalc{xij; Θ} + εij (3.14)
where yijcalc is the value that is calculated by thermodynamical laws and differs from the
experimentally measured yij by the experimental error εij; Θ is the vector of unknown
16
parameters to be determined (the unknowns in the Gibbs energies of Hg1-xBa2CuO4+δ and
BaHgO2).
As such, the formal task of the thermodynamic assessment could be expressed as
follows. For the given experimental points {yij , xi}, it is necessary to determine such
parameters in the Gibbs energies, which give us the best description of the original
experimental values.
In order to achieve the goal set above, the total experimental error was modeled by the
linear error model [27], and the maximum likelihood method has been used to estimate
unknown parameters in the Gibbs energies. The procedure in more details is described in [27],
where there is also a comparison with the conventional least-squares method. The
computations have been performed with the TDLIB software, available on the Internet at the
address http://www.chem.msu.su/~rudnyi/tdlib/.
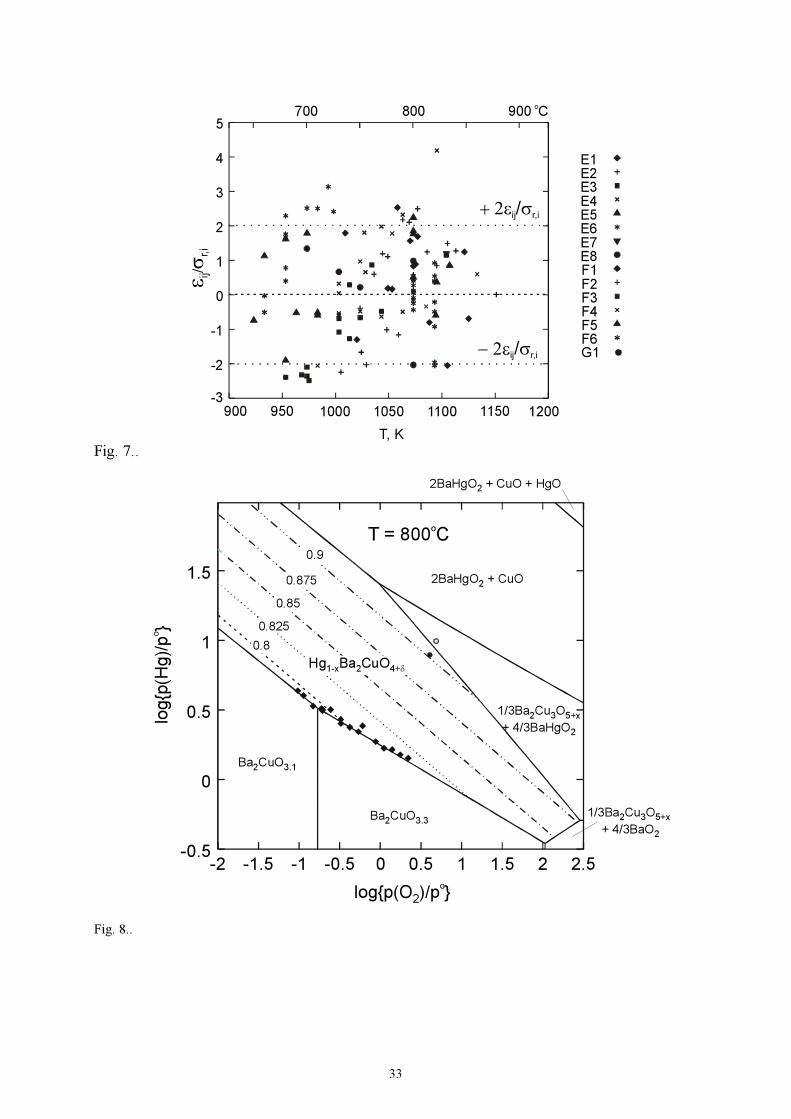
We were able to describe the results of the phase equilibria experiments within the three
standard deviations of the reproducibility (Fig.7). This supports our assumption that within
the working conditions the oxygen index in the Hg1-xBa2CuO4+δ phase was roughly constant.
The absolute standard deviations of calculated variable components are presented in Tab 7.
There is a good accordance of enthalpies of formation and specific heats of Hg1-
xBa2CuO4+0.05 and BaHgO2 with literature data. The discrepancy between the calculated and
reference standard entropies of Hg-1201 is within 13 J·K-1mol-1. We could note that the
reference entropy was estimated with high error.
The standard deviation in mercury pressure in the three-phase equilibrium S(Hg-1201)-
S(Ba2CuO3+x)-V did not exceed 0.175 atm, the accuracy of mercury content determination
was within 0.01. As for the four-phase equilibrium S(Hg-1201)-S(BaHgO2)-S(Ba2Cu3O5+x)-V,
the agreement with mercury pressure determination was found to be within 0.8 atm despite of
an interpolation method used for an estimation of the partial pressure of mercury. The reason
17
can be in limited number of experimental data for the determination of the Hg dependence in
this equilibrium.
The computed coefficients for the Hg1-xBa2CuO4-x+0.05 and BaHgO2 Gibbs energies are
given in Tables 8 and 9. For comparison, the Gibbs energy of BaHgO2 evaluated from Ref.
[33] is put in Tab.9, which practically coincides with one assessed in this work.
This kind of agreement could be considered as satisfactory in our case. The problem
here is that the simultaneous assessment of the Gibbs energies of Hg1-xBa2CuO4+δ and
BaHgO2 was performed in the present work while the Gibbs energies of barium cuprates from
Ref. [24] were fixed. Provided the Gibbs energies of barium cuprates were assessed seven
years ago from contradicting literature values, the overall agreement obtained in the present
assessment, actually, could be named as even remarkable. In a way, the results obtained in
present study confirm the reliability of the barium cuprates thermodynamics taken from Ref.
[24].
3.4. P(Hg)-P(O2) and P(Hg)-T cross-section of the P(Hg)-P(O2)-T phase diagram and
Hg-nonstoichiometry of Hg1-xBa2CuO4+δ
The obtained thermodynamic functions were used for the computation of the P(Hg)-
P(O2) at T = const (Fig.8) and P(Hg)-T at P(O2) = const (Fig.9) cross-sections of the P(Hg)-
P(O2)-T phase diagram of the Hg-Ba-Cu-O system. The available experimental results were
plotted in these cross-sections also. We can conclude from the comparison of the
experimental data and the results of calculation that the thermodynamic data presented in
Tabs.4 - 6 allow to perform the thermodynamic assessment in spite of the approximations,
which were made under calculation.
The P(Hg)-P(O2) cross-section at T = 800°C (Fig.8) is analogous in topology to the one
computed in Ref. [20]. However, there are significant quantitative differences. The main
18
reasons for that are: 1) the description of the Hg-1201 phase as the Hg-nonstoichiometric
compound with a variable Hg-concentration inside stability field was introduced, and 2)
different approaches and data were used for the computation.
For instance, the computed in Ref. [20] inclination tangent of the three-phase
equilibrium S(Hg-1201)-S(Ba2CuO3+x)-V line (logP(Hg)-logP(O2) coordinates) is larger than
the experimental one (0.33(1) from Eq.3.1). The large slope equal to 0.5 was used in Ref. [34]
also. According to the model discussed, the smaller slope of the experimental line is due to
changing mercury concentration in Hg-1201 and different extra oxygen content of Hg-1201
and Ba2CuO3+x. The appearance of Ba2Cu3O5+x and BaHgO2 at high mercury pressure was
computed in this work and confirmed experimentally in contrast to results given in Ref. [20],
where the existence of BaHgO2 and CuO was predicted in these conditions. This difference
might be caused by the usage of the lower value of enthalpy of the BaHgO2 formation (∆oxH°
= -41.3 kJ/mol) in Ref. [20] which significantly differs from those ones reported in [32] (-59.6
± 2.4 kJ/mol) and [33] (-63 ± 14 kJ/mol).
Two points from Tab.1 (points #5 and #6) corresponding to different phase
compositions at 800°C, presented in Fig.8, and point #1 (Tab.1) corresponding to the S(Hg-
1201)-S(BaHgO2)-S(Ba2Cu3O5+x)-V equilibrium, presented in Fig.9 show the correctness of
the computed diagram. It is clearly seen that a small increase of partial mercury and oxygen
pressure dramatically changes the phase composition of solid state from Hg-1201 to the
mixture of BaHgO2 and Ba2Cu3O5+x.
Several important conclusions can be made from these data. First, the Hg-concentration
in the Hg-1201 phase is lower than the stoichiometric value at commonly used synthesis
conditions in sealed tube, and, therefore, the Hg-stoichiometric phase cannot be prepared by
annealing under these conditions followed by rapid quenching. Moreover, the stoichiometric
composition cannot be achieved at higher mercury pressure, as it is limited by pressure of
19
saturated vapor over liquid mercury (line Hg(liq.) in Fig.9) or over mercury oxide. Second,
the stability field of Hg-1201 becomes narrow upon P(O2) increasing, and this fact explains
why the formation of this phase is often suppressed when oxygen-rich starting mixtures (like
peroxides or an excess of HgO) are directly used for the synthesis in closed vessels without
special efforts to decrease internal oxygen pressure. But, on other hand, the higher oxygen
pressure favors the increasing of the mercury content in Hg-1201.
It is important to notice that the Hg-1201 stability field becomes larger at higher
temperature, or at lower partial oxygen pressure. Therefore, at low P(O2) an increase of P(Hg)
should result in an increase of Hg-concentration in Hg-1201 while at higher P(O2) it can lead
to a decomposition of Hg-1201. We can estimate that nearly stoichiometric Hg-1201 phase
can be obtained at relatively low oxygen pressure (about 0.1 atm) at T = 800°C if P(Hg)
exceeds 1000 atm. Such high mercury pressure cannot be achieved in conventional sealed
tube synthesis, and, moreover, the vapor pressure over liquid mercury much lower (about 100
atm) at this temperature. However, a two-step procedure can help to overcome this problem
and prepare nearly stoichiometric Hg-1201.
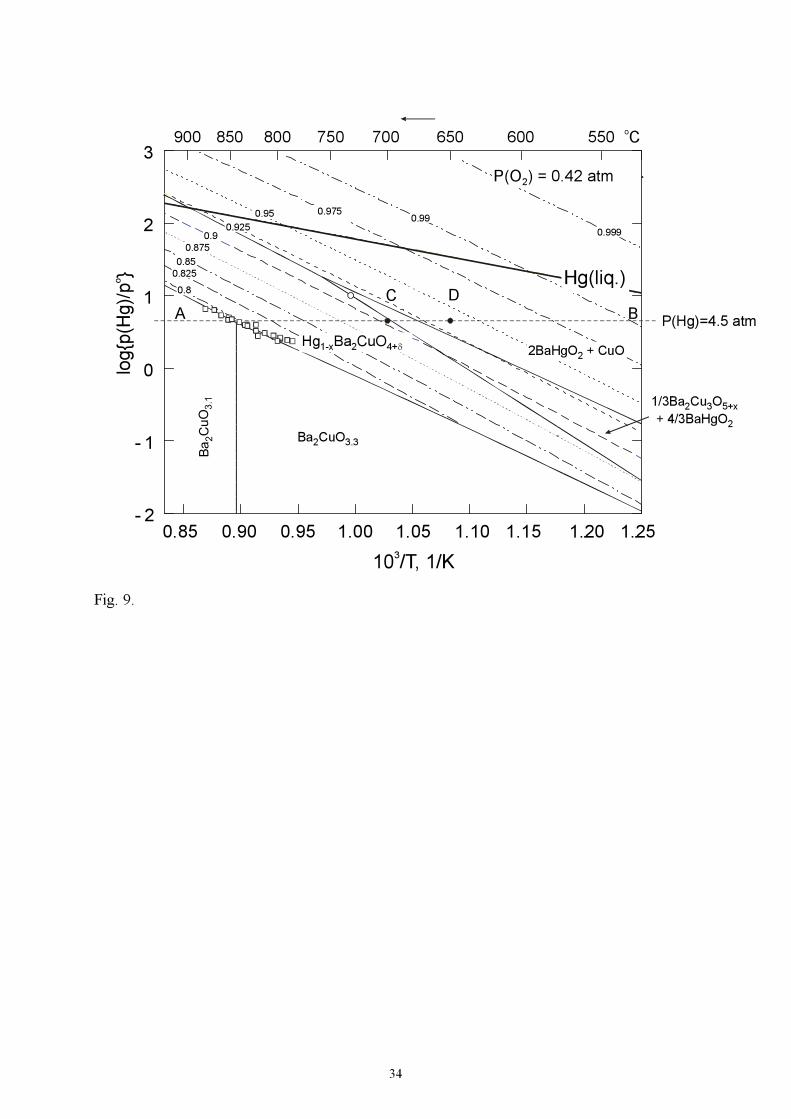
According to the P(Hg)-T cross-section at P(O2) = 0.42 atm (Fig.9), in order to obtain
such sample, Hg-1201 with a low Hg-concentration should be synthesized in the phase
stability region, then slowly cooled at constant mercury and oxygen pressures down to 600 -
650°C, and treated at this temperature for a short time to increase the Hg-concentration in Hg-
1201.
The synthesis at 800°C of nearly Hg-stoichiometric 1201 phase was described in Ref.
[16]. The Hg-concentration in the Hg-1201 phase can not exceed 84% according to Fig.9 if
the sample was prepared at P(O2) = 0.42 atm and P(Hg) = 4.5 atm (line AB, Fig.9). Then the
sample was treated for several hours at lower temperature under the same Hg and O2 partial
pressures. This additional procedure resulted in an increase of the Hg-concentration up to the
20
value close to ideal one. For instance, the pure Hg-1201 sample quenched from 700°C (point
C in Fig.9) has the Hg-content of 0.91(2), while the samples slowly cooled from 800°C to
650°C and treated about one hour at this temperature before quenching (point D) have the Hg-
concentration equal to 0.96(2) according to rhodanometric titration. The calculated Hg-
concentrations are close to the experimental ones and they are equal to 0.90(1) at 700°C and
0.94(1) at 650°C. The second treatment takes place at metastable conditions for Hg-1201,
however, relatively low temperature prevents the decomposition reaction with formation of
BaHgO2 and Ba2Cu3O5+x, or BaHgO2 and CuO due to a kinetic reason. The longer annealing
time (12 h), as it was shown in section 3.2, resulted in a decomposition of Hg-1201 according
to the equilibrium phase diagram. It should be mentioned that slow cooling allows also to
prepare the nearly-stoichiometric Hg-1201 phase (0.99(2) Hg) as it was described in Ref.
[16].
Conclusion
The P(Hg)-P(O2)-T phase diagram of the Hg-Ba-Cu-O system for the Ba/Cu=2/1 ratio
was studied and followed by the thermodynamics modeling. Experimental vapor pressures in
this system and literature thermodynamic data were used in the calculations. The calculated
and experimental values are in good agreement. The Hg-1201 stability field is sandwiched
between the surfaces of the S(Hg-1201)-S(Ba2CuO3+x)-V and S(Hg-1201)-S(BaHgO2)-
S(Ba2Cu3O5+x)-V equilibria. It was shown that the Hg1-xBa2CuO4+δ (Hg-1201) superconductor
possesses a significant range of the Hg-nonstoichiometry and exists in a certain P(Hg), P(O2)
and T range. The mercury nonstoichiometry of Hg-1201 was investigated in the 923 ≤ T ≤
1095 K; 2.0 ≤ P(Hg) ≤ 8.4 atm; 0.09 ≤ P(O2) ≤ 0.86 atm ranges. It was found that the mercury
content varies in the range of 0.80-0.94 under these conditions. The Gibbs energy of the Hg-
1201 phase was calculated as a function of temperature and mercury concentration. The
21
obtained results allow optimizing the synthesis conditions of Hg-1201 and varying Hg-
concentration including preparation of the Hg-stoichiometric phase.
Acknowledgments
This work was partly supported by Russian Foundation for Basic Research (00-03-
32379), Russian Scientific Program on Superconductivity (Poisk), INTAS (99-1136) and
Volkswagen Stiftung (I/75849). The authors are grateful to Dr. A.V.Shevelkov for valuable
comments.
22
References.
[1]. S.N. Putilin, E.V. Antipov, O. Chmaissem, M. Marezio. Nature (London) 362 (1993) 226.
[2]. A. Fukuoka, A. Tokiwa-Yamamoto, M. Itoh, K. Usami, S. Adachi, H. Yamauchi,
K. Tanabe. Physica C 265 (1996) 13.
[3]. J.-F. Marucco, V.Vialett, A.Bertinotti, D.Colson, A.Forget. Physica C 275 (1997) 12.
[4]. T. Tsuchiya, K. Fueki, T. Koyama. Physica C 298 (1998) 49.
[5]. V.L. Aksenov, A.M. Balagurov, V.V. Sikolenko, V.G. Simkin, V.A. Alyoshin,
E.V. Antipov, A.A. Gippius, D.A. Mikhailova, S.N. Putilin, F. Bouree.
Phys.Rev.B 55 (1997) 3966.
[6]. Q. Xiong, Y.Y. Xue, Y. Cao, F. Chen, Y.Y. Sun, J. Gibson, C.W. Chu, L.N. Liu,
A. Jacobson. Phys.Rev.B 50 (1994) 10346.
[7]. Q. Xiong, Y.Y. Xue, Y. Cao, F. Chen, J. Gibson, L.N. Liu, A. Jacobson, C.W. Chu.
Physica C 251 (1995) 216.
[8]. N.C. Hyatt, J.P. Hodges, I. Gameson, S. Hull, P.P. Edwards. J. of Solid State Chemistry
148 (1999) 119.
[9]. O. Chmaissem, Q. Huang, S.N. Putilin, M. Marezio, A. Santoro. Physica C, 212 (1993)
259.
[10]. Q. Huang, J.W. Lynn, Q.Xiong, C.W.Chu. Phys. Rev. B 52 (1995) 462.
[11]. B. Dabrowski, J.L. Wagner, D.G. Hinks, J.F. Mitchell, J.D. Jorgensen, O. Chmaissem.
Physica B 241 (1997) 805.
[12]. J.D. Jorgensen, O. Chmaissem, J.L. Wagner, W.R. Jensen, B. Dabrowski, D.G. Hinks,
J.F. Mitchell. Physica C 282-287 (1997) 97.
[13]. J.L. Wagner, P.G. Radaelli, D.G. Hinks, J.D. Jorgensen, J.F. Mitchell, D. Dabrowski,
G.S. Knapp, M.A. Beno. Physica C 210 (1993) 447.
[14]. Y.Y. Xue, Q. Xiong, Y. Cao, I. Rusakova, Y.Y. Sun, C.W. Chu.
Physica C 255 (1995) 1.
[15]. P. Border, F. Duc, S. LeFloch, J.J. Capponi, E. Alexandre, M. Rosa-Nunes, S. Putilin,
E.V. Antipov. Physica C 271 (1996) 189.
[16]. V.A. Alyoshin, D.A. Mikhailova, E.V. Antipov. Physica C 271 (1996) 197.
[17]. A. Yamamoto, M. Itoh, A. Fukuoka, S. Adachi, H. Yamauchi, K. Tanabe. J. of Materials
Research 14 (1999) 644.
[18]. Ayako Yamamoto, Wei-Zhu Hu, Setsuko Tajima. Physica C 335 (2000) 268.
[19]. V.A. Alyoshin, D.A. Mikhailova, E.V. Antipov. Physica C 255 (1995) 173.
23
[20]. D. Sedmidubský, J. Leitner, K. Knížek, A. Strejc, M. Veverka.
Physica C 329 (2000) 191.
[21]. I.S. Kulikov. Termodinamika oksidov, Spravochnik (Russian), Moskow (1986).
[22]. JANAF International Tables, NBS USA, Washington, 1971 - 1975.
[23]. A.N.Nesmeyanov. Davlenie para khimicheskich elementov (Vapor pressure of chemical
elements). Moscow, RAN, 1961, p.24 (Russian)
[24]. G.F. Voronin, S.A. Degterev. J.of Solid State Chemistry 110 (1994) 50.
[25]. A.T. Dinsdale. SGTE data for pure substances. CALPHAD, 1991, v. 15, N 4, p. 317.
[26]. V.A. Alyoshin, D.A. Mikhailova, E.V. Antipov, A.S. Monaenkova, A.A. Popova,
L.A.Tiphlova, J.Karpinski. Journal of Alloys and Compounds 284 (1999) 108.
[27]. E.B. Rudnyi, V.V. Kuzmenko, G.F. Voronin. J. Phys. Chem. Ref. Data
27 (1998) 855.
[28]. L.V. Gurvich, High Temp. Sci., 1989, 26, 197. (IVTAN-THERMO)
[29]. M.V. Gorbacheva, A.F. Maiorova, S.N. Mudretsova, E.B. Rudnyi, A.D. Rusin. M.V.
Zh. Fiz. Khim. (J. Phys. Chem.) 72 (1998) 416 (in Russian).
[30]. V.A. Aleshin, M.V. Gorbacheva, A.F. Maiorova, D.A. Mikhailova, S.N. Mudretsova,
Zh. Fiz. Khim. (J. Phys. Chem.) 72 (1998) 421 (in Russian).
[31]. M.V. Gorbacheva, A.F. Maiorova, S.N. Mudretsova. Trudy Vserosiiskoi konferentsii po
termicheskomu analizu, Kazan, 1996, p. 138 (in Russian).
[32]. A.S. Monaenkova, L.A. Tiphlova, A.A. Popova, A.V. Ignatov, V.A.Alyoshin. Russ. J.
Phys. Chem. 75 (2001) 1246.
[33]. D.A. Mikhailova, V.A. Alyoshin, E.V. Antipov, J. Karpinski. J.Solid State Chemistry
146 (1999) 151.
[34]. T. Tsuchiya, K. Fueki, T. Koyama. Physica C 258 (1998) 49.
24
Figure captions
Fig.1. Scheme of the two-temperature static weight technique.
Fig.2. Scheme of the three-temperature static weight technique.
Fig.3. Schemes of the polythermal (a) and two-temperature (b) annealing experiments.
Fig.4. The dependences of P(Hg) vs. T at fixed P(O2) for the three-phase S(Hg1201)-
S(Ba2CuO3+y)-V equilibrium (1,2 - CoO/Co3O4 getter , 3 - Mn2O3/MnO2 getter)
Fig.5. The P(Hg)-P(O2)-T phase diagram of the Hg-Ba-Cu-O system for the Ba/Cu=2/1
ratio
Fig.6. The P(Hg) vs. T dependences over Hg-1201 in the two-phase equilibrium S(Hg-
1201)-V (dashed lines – the calculated Hg-pressures if the Hg-concentration in Hg-1201 is
constant).
Fig.7. Normalized deviates by the standard deviation, εij/σr,i for the experiments related
to the phase equilibria. Labels of experimental points according to Tab.6.)
Fig.8. The computed P(Hg)-P(O2) cross-section of the P(Hg)-P(O2)-T phase diagram of
the Hg-Ba-Cu-O system at T = 800°C for the Ba/Cu=2/1 ratio.
Dashed lines are the (1-x)Hg-isoconcentrates inside the Hg-1201 homogeneity region.
Diamonds show experimental points for the S(Hg-1201)-S(Ba2CuO3+x)-V equilibrium at this
temperature. Circles (filled and empty) represent the results from Tab.1 (● - point #5, ○ -
point #6).
Fig.9. The computed P(Hg)-T cross-section of the P(Hg)-P(O2)-T phase diagram of the
Hg-Ba-Cu-O system at P(O2) = 0.42 atm for the Ba/Cu=2/1 ratio.
Dashed lines are the (1-x)Hg-isoconcentrates inside the Hg-1201 homogeneity region
spread into a metastable region for a higher mercury pressure. Squares are the experimental
points for the S(Hg-1201)-S(Ba2CuO3+x)-V equilibrium from Fig.4 at this P(O2). Empty circle
(○) represents the point #1 from Tab.1 corresponding to the S(Hg-1201)-S(BaHgO2)-
S(Ba2Cu3O5+x)-V equilibrium.
25
Table 1.
Selected experiments illustrating the determination of the Hg-1201 upper boundary stability
field.
No T, °C P(O2), atm P(Hg), atm Phase composition
Polythermal annealing
1 840 760 743
730 *
0.43
10.3
Hg-1201 Hg-1201 Hg-1201
Hg-1201, BaHgO2, Ba2Cu3O5+x
Two-temperature annealing
2 680 2.90 5.80 BaHgO2, Ba2Cu3O5+x
3 750 1.73 3.45 Hg-1201
4 750 * 2.46 4.92 BaHgO2, Ba2Cu3O5+x
5 800 * 4.06 8.12 Hg-1201
6 800 * 4.75 9.50 BaHgO2, Ba2Cu3O5+x
Static weight technique investigation
7 695 * 0.66 3.28 Hg-1201
8 700 * 0.81 3.04 Hg-1201
9 700 * 1.36 3.27 Hg-1201, BaHgO2, Ba2Cu3O5+x
* - these values were used in calculations of the upper boundary of the Hg-1201 stability field.
Table 2.
The results of the two-temperature SWT investigation of the mercury nonstoichiometry of Hg1-xBa2CuO4+δ
T,°C P(O2), atm
P(Hg), atm
Hg, (1-x)
T,°C P(O2), atm
P(Hg), atm
Hg, (1-x)
Sample #F1 804 0.417 3.671 0.843
747 0.412 3.172 0.842 822 0.418 3.982 0.816
776 0.425 3.344 0.837 732 0.109 3.732 0.823
800 0.417 3.580 0.828 756 0.110 3.930 0.808
831 0.418 3.856 0.818 775 0.111 4.021 0.804
Sample #F2 786 0.112 4.136 0.795
763 0.412 3.486 0.853 750 0.093 3.762 0.824
771 0.413 3.495 0.853 751 0.204 3.731 0.827
776 0.414 3.552 0.849
26
Table 3.
The results of the three-temperature SWT investigation of the mercury nonstoichiometry of Hg1-xBa2CuO4+δ
*)
T,°C P(O2) atm
P(Hg), atm
Hg, (1-x)
T,°C P(O2) atm
P(Hg), atm
Hg, (1-x)
Sample #F3 Sample #F4
750 0.405 4.559 0.861 750 0.413 2.952 0.845
770 0.408 4.772 0.850 770 0.413 3.564 0.836
730 0.404 4.072 0.871 790 0.411 4.778 0.835
730 0.666 3.984 0.876 730 0.413 2.491 0.853
702 0.664 3.434 0.876 730 0.676 2.642 0.865
695 0.664 3.279 0.881 755 0.676 3.152 0.866
700 0.811 3.043 0.878 754 0.187 3.807 0.859
740 0.666 4.214 0.869 770 0.189 4.431 0.855
740 0.186 4.225 0.859 790 0.189 5.431 0.852
761 0.187 4.583 0.852 710 0.676 2.705 0.866
680 0.666 2.850 0.886 730 0.679 1.998 0.863
700 0.664 3.395 0.881 730 0.860 2.687 0.877 #) 700 1.361 3.269 - 750 0.863 2.725 0.872
780 0.863 3.473 0.868
Rhodanometric titration: 0.87(2)
Sample #F5 Sample #F6
680 0.094 7.818 0.928 680 0.170 6.362 0.938
660 0.092 7.487 0.935 700 0.131 6.835 0.924
700 0.097 7.824 0.916 720 0.134 6.990 0.917
650 0.090 7.404 0.922 680 0.129 6.400 0.928
710 0.097 8.424 0.888 660 0.222 5.609 0.928
690 0.095 7.988 0.900 680 0.223 6.325 0.923
710 0.098 8.336 0.887 680 0.097 6.371 0.922
680 0.093 8.069 0.893 710 0.100 7.111 0.913
Rhodanometric titration: 0.88(2) 725 0.100 7.506 0.903
680 0.170 6.256 0.922 #)
Phase composition (XRD data): 70% Hg-1201, 20%BaHgO2, 10% Ba2Cu3O5+x. Experiment was
interrupted when mercury content in solid state was equal to 1.13 (1.11(2) from rhodanometric
titration).
*) The presented data are listed in sequence of the experiments carried out.
27
Table 4.
Auxiliary thermodynamic properties of key oxides and elements employed in the present work a
A B C D E F Ref.
BaO(s) -553092.97 463.41195 -72.028 -1858.564 0 -9963433 [27]
CuO(s) -167369.13 477.64762 -69.785 -1801.184 61609 0 [27]
Hg(g) b 55196.294 -35.85579 -20.7537 0 -927.854 0 [28]
HgO(s) -101735.10 361.28148 -60.23 -921.97 127811 0 [29]
O2(g) -1776.280 132.54252 -44.978 -1294.168 0 -13651002 [28] a the parameters allow us to compute G
o – H
oSER at standard pressure (p
o = 101325 Pa) according
to the equation:
Go – H
oSER = A + B T + C TlnT + D T
0.5 + E T
-1 + F T
–2
in J·mol-1 in the temperature interval from 250 K to 1300 K. A large number of significant digits in the
parameters is given in order to overcome the strong correlation among them.
b the equation G
o – H
oSER = A + B T + C TlnT + D T
0.5 + E T
-1 + F T
–2 + K T
2 + L T
3+ M T
4
was used, where the additional coefficients are: K = -2.76374e-05, L = 4.606922e-09, M = -
3.434378e-13
Table 5.
Auxiliary thermodynamic properties of reactions employed in the present work according to Ref. [24] a
Reaction A B C
2CuO - 0.5O2 = Cu2O 145204.5 -190.334 11.9295
BaO + 0.5O2 = BaO2 -70889 65.102 0
BaO + Cu2O =BaCu2O2 -46080 3.5170 0.3991
BaO + CuO =BaCuO2 -38820 -3.2676 1.0975
BaO + CuO + 0.05O2 = Ba2CuO3.1 -76243 24.860 0
BaO + CuO + 0.15O2 = Ba2CuO3.3 -97187 42.902 0
2BaO + 3CuO = Ba2Cu3O5 b -49282 8.31441 0
2BaO + 3CuO + 0.05O2= Ba2Cu3O6 b -142980 83.8010 0
a the parameters allow us to compute ∆rG
o at standard pressure (p
o = 101325 Pa) according to
the equation
∆rGo = A + B T + C TlnT
in J·mol-1 in the temperature interval from 298 K to 1250 K b Ba2Cu3O5 and Ba2Cu3O6 are the end members of the binary solution Ba2Cu3O5+x. The Gibbs
energy of the mixture was described as
∆mixG(T, x) = -73681.47x(1 - x) +RT[x ln x + (1 - x) ln (1 - x)]
28
Table 6.
The experimental results taken into account in the assessment of the Hg1-xBa2CuO4+δ phase thermodynamics
Label Set of values NI*) Comment Reference
∆oxH° (Hg-1201) {∆oxHij, Tij} 1 HgBa2CuO4.05 [26]
S° (Hg-1201) {Sij, Tij} 1 HgBa2CuO4.05 [30]
Cp° (Hg-1201) {Cpij, Tij} 21 HgBa2CuO4.05 [30]
Cp° (BaHgO2) {Cpij, Tij} 5 BaHgO2 [31]
∆oxH° (BaHgO2) {∆oxHij, Tij} 1 BaHgO2 [32]
Kp (BaHgO2) {Kpij, Tij} 9 BaHgO2 = BaO + Hg + 0.5 O2 [33]
E1 {p(Hg) ij, Tij, p(O2)ij} 10
E2 {p(Hg) ij, Tij, p(O2)ij} 8
E3 {p(Hg) ij, Tij, p(O2)ij} 1
E4 {p(Hg) ij, Tij, p(O2)ij} 3
E5 {p(Hg) ij, Tij, p(O2)ij} 7
E6 {p(Hg) ij, Tij, p(O2)ij} 19
E7 {p(Hg) ij, Tij, p(O2)ij} 1
E8 {p(Hg) ij, Tij, p(O2)ij} 2
Hg1-xBa2CuO4+δ + Ba2CuO3+x + V
[16] + present work
F1 {xij, Tij, p(Hg) ij, p(O2)ij} 3
F2 {xij, Tij, p(Hg) ij, p(O2)ij} 11
Hg1-xBa2CuO4+δ + V Tab.2
F3 {xij, Tij, p(Hg) ij, p(O2)ij} 12
F4 {xij, Tij, p(Hg) ij, p(O2)ij} 14
F5 {xij, Tij, p(Hg) ij, p(O2)ij} 8
F6 {xij, Tij, p(Hg) ij, p(O2)ij} 11
Hg1-xBa2CuO4+δ + V Tab.3
G1 {p(Hg) ij, Tij, p(O2)ij} 5 Hg1-xBa2CuO4+δ + BaHgO2 + Ba2Cu3O5+x + V
From Tab.1
NI*) – number of experiments
29
Table 7.
Standard deviation of the variable components under the thermodynamic assessment of the phase equilibria in the Hg-Ba-Cu-O system.
Variable components Standard deviation σr i,
2
∆oxH° (Hg-1201) 3.5 kJ·mol-1
S° (Hg-1201) 13 J·K-1mol-1
Cp° (Hg-1201), Cp° (BaHgO2) 1.03 J·K-1mol-1
∆oxH° (BaHgO2) 1.74 kJ·mol-1
P(Hg) in three-phase equilibrium Hg1-xBa2CuO4+δ + Ba2CuO3.3 + V (group of points E1-E8, tab.6)
0.175 atm
Mercury content in Hg-1201 (group of points F1-F6, tab.6) 0.0102
P(Hg) in four-phase equilibrium Hg1-xBa2CuO4+δ + BaHgO2 + Ba2Cu3O5+x + V (group of points G1, tab.6)
0.78 atm
Table 8.
The parameters within Eq. (3.7) obtained for the Hg1-xBa2CuO4-x+0.05 phasea
A B C D E
g1 -31247 35.199 0 0
g2 -88855 494.18 -55.865 -3896.3 -1.1691e+05
a0 -66006 0 0 0 a g1, g2, and a0 are the temperature functions within Eq. (3.7), and A, B, C, D, E are the
parameters within each temperature function according to the Eq. (3.9). The values given lead to the Gibbs energy in J·mol
-1. The Gibbs energy can be computed in the temperature range from 250 to
1250 K.
Table 9.
The parameters within Eq. (3.9) obtained for the formation of the BaHgO2 phase according to reaction (3.10)
A B C D E ∆oxG°298 kJ/mol
∆oxG°298 kJ/mol [33]
-45219 300.41 -34.037 -2816.6 0 -62.1 -61.5
30
Fig.1.
Fig.2.
T
L
Lo
L1
L3
L2
V1 V
2
T1
T2
∆F
T
L
Lo
L4
L5
L1
L3
L2
T1
T2
T3
V1
V2 V
3
∆F
31
Fig.3.
Fig.4.
1
8
7
6
5
4
3
2
P(H
g),
atm
1.2 atm O2
0.42 atm O2
0.86 0.88 0.90 0.92 0.94 0.96 0.98
10 /T, 1/T3
900 850 800 750o
C
0.11 atm O2
1
2
3
1/T
T
HgO
HgO
b)
a)
lgP(Hg)
Hg-1201Ba CuO2 3+x
BaHgO
+ Ba Cu O2
2 3 5+x
CoO/Co O3 4
32
Fig.5.
Fig.6.
T, KP(O2) , atm
950975
10001025
10501075
1,1
1,7
2,3
2,9
5
10
15
20
25
P( ), atmHg
Ba CuO2 3+x
Hg-1201
BaHgO + Ba Cu O2 3 5+y2
T, C
o
720 760 800 840 880
P(O ) = 0.42 atm2
Hg-1201
Ba CuO2 3+x
0.816 Hg
0.818 Hg
0.853 Hg
0.842 Hg
# F1
# F2
S(Hg-1201)-S(BaCuO
)-V
2
3+x
3.0
3.5
4.0
4
P(H
g),
atm
2.5
.5
33
Fig. 7..
Fig. 8..
-0.5
0
0.5
1
1.5
-2 -1.5 -1 -0.5 0 0.5 1 1.5 2 2.5
log{p(H
g)/p}
o
log{p(O )/p }2
o
2BaHgO + CuO2
1/3Ba Cu O
+ 4/3BaHgO2 3 5+x
2
1/3Ba Cu O
+ 4/3BaO2 3 5+x
2
Ba CuO2 3.1
Ba CuO2 3.3
2BaHgO + CuO + HgO2
0.9
0.875
0.85
0.825
0.8
T = 800 Co
Hg Ba CuO1-x 2 4+δ
-3
-2
-1
0
1
2
3
4
5
900 950 1000 1050 1100 1150 1200
εij
r,i
/σ
− 2ε σij r,i/
+ 2ε σij r,i/
T, K
E1E2E3E4E5E6E7E8F1F2F3F4F5F6G1
700 800 900o
C
34
Fig. 9.
- 2
- 1
0
1
2
3
0.85 0.90 0.95 1.00 1.05 1.10 1.15 1.20. 1.25.
.
P(Hg)=4.5 atm
lo
g{p
(Hg
)/p
}o
10 /T, 1/K3
900 850 800 750 700 650 600 550o
C
1/3Ba Cu O
+ 4/3BaHgO2 3 5+x
2
BaCuO
23.1
Ba CuO2 3.3
2BaHgO + CuO2
Hg Ba CuO1-x 2 4+δ
Hg(liq.)0.8
0.825
0.85
0.875
0.90.999
0.990.9750.95
0.925
AC D
B
P(O ) = 0.42 atm2


![To submit a proposal for magnet time, …...Nature 424, 912 (2003)Signature of Optimal Doping in Hall-effect Measurements on a High-Temperature Superconductor 0 10 20 30 40 T [K] p](https://static.fdocument.org/doc/165x107/5e686e7f41d7ae5bee04d7e2/to-submit-a-proposal-for-magnet-time-nature-424-912-2003signature-of-optimal.jpg)


![Magnetotransport studies of the organic superconductor and ...Ludwi… · The BETS donors were prepared as reported in ref. [22]. For electrochem-ical oxidation the BETS molecules](https://static.fdocument.org/doc/165x107/5fb7b5c2102acd7b4c0ca39c/magnetotransport-studies-of-the-organic-superconductor-and-ludwi-the-bets.jpg)