Measurement of Thermal Conductivity of PbTe Nanocrystal ... · Measurement of Thermal Conductivity...
7
Measurement of Thermal Conductivity of PbTe Nanocrystal Coated Glass Fibers by the 3ω Method Scott W. Finefrock, †,# Yan Wang, ‡,# John B. Ferguson, § James V. Ward, † Haiyu Fang, † Jonathan E. Pfluger, † Douglas S. Dudis, § Xiulin Ruan,* ,‡ and Yue Wu* ,† † School of Chemical Engineering, Purdue University, West Lafayette, Indiana 47907, United States ‡ School of Mechanical Engineering and the Birck Nanotechnology Center, Purdue University, West Lafayette, Indiana 47907, United States § Nanoelectronic Materials Branch, Materials and Manufacturing Directorate, Air Force Research Laboratory, Wright-Patterson Air Force Base, Dayton, Ohio 45433, United States * S Supporting Information ABSTRACT: Fiber-based thermoelectric materials can conform to curved surfaces to form energy harvesting devices for waste heat recovery. Here we investigate the thermal conductivity in the axial direction of glass fibers coated with lead telluride (PbTe) nanocrystals using the self-heated 3ω method particularly at low frequency. While prior 3ω measurements on wire-like structures have only been demonstrated for high thermal conductivity materials, the present work demonstrates the suitability of the 3ω method for PbTe nanocrystal coated glass fibers where the low thermal conductivity and high aspect ratio result in a significant thermal radiation effect. We simulate the experiment using a finite-difference method that corrects the thermal radiation effect and extract the thermal conductivity of glass fibers coated by PbTe nanocrystals. The simulation method for radiation correction is shown to be generally much more accurate than analytical methods. We explore the effect of nanocrystal volume fraction on thermal conductivity and obtain results in the range of 0.50−0.93 W/mK near room temperature. KEYWORDS: Thermoelectric, flexible, thermal conductivity, 3ω, radiation, finite difference method F lexible thermoelectric materials such as nanocomposites 1 and fibers 2 can significantly impact waste heat recovery and solid-state cooling because of the advantages of lightweight, flexibility, and higher tolerance to thermal expansion. Particularly, flexibility can allow thermoelectric devices to be installed on curved surfaces such as automobile exhaust pipes, power plant steam pipes, manufacturing industry cooling pipes, and so forth. Our previous studies 2 showed that thermoelectric fibers made from glass fibers coated with an ultrathin layer of PbTe nanocrystals (300 nm thick) can possess a similar thermoelectric figure of merit compared to traditional rigid bulk bismuth telluride modules. The module assemblies require several millimeters of thickness, which highlights a great potential for high performance with much reduced raw material cost for the coated fibers. In this paper, we present an investigation of the thermal conductivity of our thermoelectric fibers at the single fiber level using the 3ω method to further understand the thermal transport in the axial direction. Through simulations based on the finite-difference method, we successfully model the radiation effect and extract the thermal conductivity at the single fiber level. Our simulation method for radiation correction appears to be much more accurate than conventional analytical methods. Furthermore, we measure and simulate several samples to determine the thermal conductivities of composite fibers of varying composition; from 0% PbTe to 35.8% PbTe by volume fraction. Several methods have been developed to measure the thermal properties of wire-like samples in the axial direction. These include the self-heating 3ω method, 3 dc thermal bridge Received: February 12, 2013 Revised: October 15, 2013 Published: October 22, 2013 Letter pubs.acs.org/NanoLett © 2013 American Chemical Society 5006 dx.doi.org/10.1021/nl400558u | Nano Lett. 2013, 13, 5006−5012
Transcript of Measurement of Thermal Conductivity of PbTe Nanocrystal ... · Measurement of Thermal Conductivity...
Measurement of Thermal Conductivity of PbTe Nanocrystal CoatedGlass Fibers by the 3ω MethodScott W. Finefrock,†,# Yan Wang,‡,# John B. Ferguson,§ James V. Ward,† Haiyu Fang,†
Jonathan E. Pfluger,† Douglas S. Dudis,§ Xiulin Ruan,*,‡ and Yue Wu*,†
†School of Chemical Engineering, Purdue University, West Lafayette, Indiana 47907, United States‡School of Mechanical Engineering and the Birck Nanotechnology Center, Purdue University, West Lafayette, Indiana 47907, UnitedStates§Nanoelectronic Materials Branch, Materials and Manufacturing Directorate, Air Force Research Laboratory, Wright-Patterson AirForce Base, Dayton, Ohio 45433, United States
*S Supporting Information
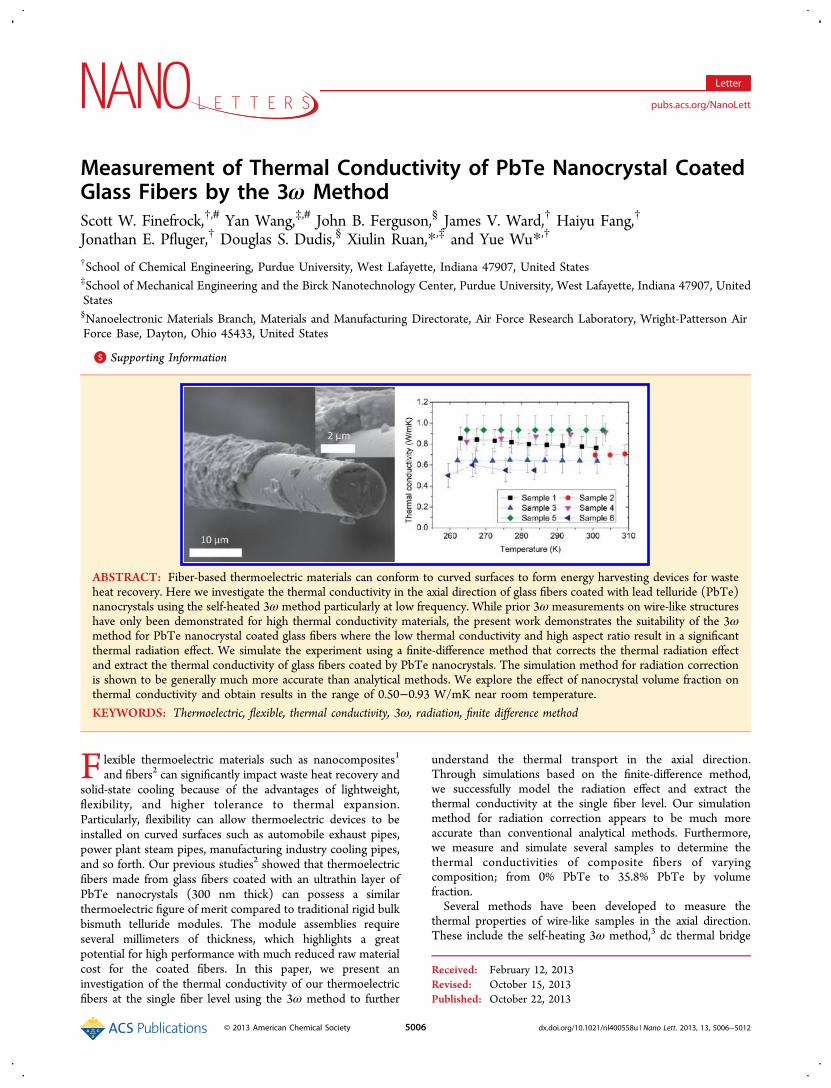
ABSTRACT: Fiber-based thermoelectric materials can conform to curved surfaces to form energy harvesting devices for wasteheat recovery. Here we investigate the thermal conductivity in the axial direction of glass fibers coated with lead telluride (PbTe)nanocrystals using the self-heated 3ω method particularly at low frequency. While prior 3ω measurements on wire-like structureshave only been demonstrated for high thermal conductivity materials, the present work demonstrates the suitability of the 3ωmethod for PbTe nanocrystal coated glass fibers where the low thermal conductivity and high aspect ratio result in a significantthermal radiation effect. We simulate the experiment using a finite-difference method that corrects the thermal radiation effectand extract the thermal conductivity of glass fibers coated by PbTe nanocrystals. The simulation method for radiation correctionis shown to be generally much more accurate than analytical methods. We explore the effect of nanocrystal volume fraction onthermal conductivity and obtain results in the range of 0.50−0.93 W/mK near room temperature.
KEYWORDS: Thermoelectric, flexible, thermal conductivity, 3ω, radiation, finite difference method
Flexible thermoelectric materials such as nanocomposites1
and fibers2 can significantly impact waste heat recovery andsolid-state cooling because of the advantages of lightweight,flexibility, and higher tolerance to thermal expansion.Particularly, flexibility can allow thermoelectric devices to beinstalled on curved surfaces such as automobile exhaust pipes,power plant steam pipes, manufacturing industry cooling pipes,and so forth. Our previous studies2 showed that thermoelectricfibers made from glass fibers coated with an ultrathin layer ofPbTe nanocrystals (300 nm thick) can possess a similarthermoelectric figure of merit compared to traditional rigid bulkbismuth telluride modules. The module assemblies requireseveral millimeters of thickness, which highlights a greatpotential for high performance with much reduced raw materialcost for the coated fibers. In this paper, we present aninvestigation of the thermal conductivity of our thermoelectricfibers at the single fiber level using the 3ω method to further
understand the thermal transport in the axial direction.Through simulations based on the finite-difference method,we successfully model the radiation effect and extract thethermal conductivity at the single fiber level. Our simulationmethod for radiation correction appears to be much moreaccurate than conventional analytical methods. Furthermore,we measure and simulate several samples to determine thethermal conductivities of composite fibers of varyingcomposition; from 0% PbTe to 35.8% PbTe by volumefraction.Several methods have been developed to measure the
thermal properties of wire-like samples in the axial direction.These include the self-heating 3ω method,3 dc thermal bridge
Received: February 12, 2013Revised: October 15, 2013Published: October 22, 2013
Letter
pubs.acs.org/NanoLett
© 2013 American Chemical Society 5006 dx.doi.org/10.1021/nl400558u | Nano Lett. 2013, 13, 5006−5012
method,4 thermal flash method,5 optical heating and electricalthermal sensing,6 pulsed laser-assisted thermal relaxationtechnique,7 and the technique of measuring a suspended wireover a microfabricated device.8−11 The 3ω method hasexperienced particularly widespread use on samples with highthermal conductivity, such as carbon nanotube bundles,3
carbon fibers12 and yarns,13 platinum wires,14 and polycrystal-line silicon microbridges.15 However, the 3ω method has notyet been applied to low thermal conductivity wire-like materialssuch as PbTe-coated glass fibers. Furthermore, while the 3ωmethod employing a line heater on a substrate has beenextended to layered composite planar samples,16−18 the self-heated wire 3ω technique has not yet been employed todetermine the thermal properties of composite fibers. Thiswork discusses the first 3ω experiments on composite fibers aswell as important radiation effects that future work shouldconsider when measuring the thermal properties of low thermal
conductivity high aspect ratio fiber composites such as layeredpolymer fibers19,20 and layered oxide fibers.21−23
The fabrication of the PbTe-coated thermoelectric glassfibers follows the procedure described in our previous studies.2
First, we synthesize PbTe nanocrystals by hot injection oftrioctylphosphine-tellurium (TOP-Te) into a lead oleatesolution. The chemicals including 1-octadecene (ODE, 90%),oleic acid (OA, 90%), lead(II) oxide (PbO, 99.9+%), telluriumpowder (99.8%), hexane (98.5%), acetone (99.5%), chloroform(99%), hydrazine hydrate solution (80%), and acetonitrile(99.8%) were purchased from Sigma-Aldrich and used withoutfurther purification. Tri-n-octylphosphine (TOP, 97%) waspurchased from Strem, Corning glass wool (fiber) waspurchased from VWR, and Epo-tek H20E silver epoxy waspurchased from Ted Pella.A 0.37 M TOP-Te solution is prepared in a nitrogen
glovebox by dissolving 0.191 g of tellurium powder in 2 mL ofTOP by heating at 57 °C and then diluting with 2 mL of
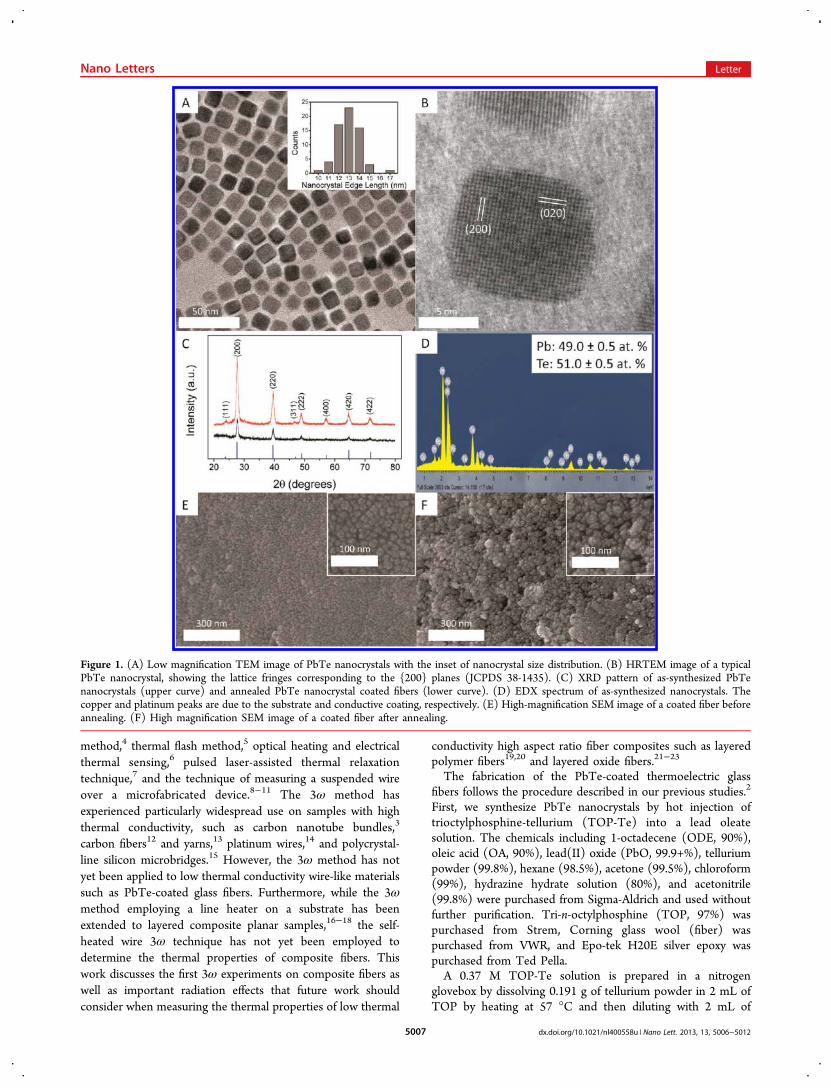
Figure 1. (A) Low magnification TEM image of PbTe nanocrystals with the inset of nanocrystal size distribution. (B) HRTEM image of a typicalPbTe nanocrystal, showing the lattice fringes corresponding to the {200} planes (JCPDS 38-1435). (C) XRD pattern of as-synthesized PbTenanocrystals (upper curve) and annealed PbTe nanocrystal coated fibers (lower curve). (D) EDX spectrum of as-synthesized nanocrystals. Thecopper and platinum peaks are due to the substrate and conductive coating, respectively. (E) High-magnification SEM image of a coated fiber beforeannealing. (F) High magnification SEM image of a coated fiber after annealing.
Nano Letters Letter
dx.doi.org/10.1021/nl400558u | Nano Lett. 2013, 13, 5006−50125007
degassed ODE. The lead oleate solution is prepared bydissolving 0.223 g of PbO powder in 0.75 mL of OA and 12.7mL of ODE in a 50 mL round-bottom flask and degassingunder vacuum at 150 °C for 1.5 h. Once degassed, the leadoleate solution is switched from vacuum to nitrogen positivepressure; the temperature is increased to 250 °C, and 4 mL of0.37 M TOP-Te is rapidly injected. The mixture is near 250 °Cfor 9 min and then cooled rapidly to room temperature byimmersing the flask in a water bath. The product is precipitatedby adding acetone and centrifuging, after which it is redissolvedin hexane. This washing procedure is repeated three times.Small bundles of glass fiber are coated and annealed aspreviously described except that 4% hydrogen diluted innitrogen is used during annealing to minimize the chance ofexplosion.The low magnification transmission electron microscopy
(TEM) image (Figure 1A) shows cubic nanocrystals with anedge length distribution of 12.9 ± 1.1 nm (Figure 1A inset).The high-resolution transmission electron microscopy(HRTEM) image (Figure 1B) shows lattice fringes with aspacing of 0.32 nm, which corresponds to the {200} planes ofPbTe (JCPDS 38-1435). X-ray diffraction (XRD) patterns ofas-synthesized nanocrystals and of coated and annealed fibers(Figure 1C) further show that the material is pure phase PbTe.Energy dispersive X-ray spectroscopy (EDX) of as-synthesizednanocrystals (Figure 1D) indicates that the material is slightlytellurium rich. High magnification scanning electron micros-copy (SEM) studies of the coated fiber surface elucidate theeffect of annealing. Figure 1E shows that the as-madenanocrystal coating is smooth with 1−2 nm gaps in betweenadjacent nanocrystals before annealing. Figure 1F shows that,after annealing, the coating is rough with groups ofagglomerated nanocrystals, creating a more effective networkfor charge carrier transport. All subsequently discussed
characterization and measurements are performed on annealedfibers.To investigate the effect of fiber composition on the
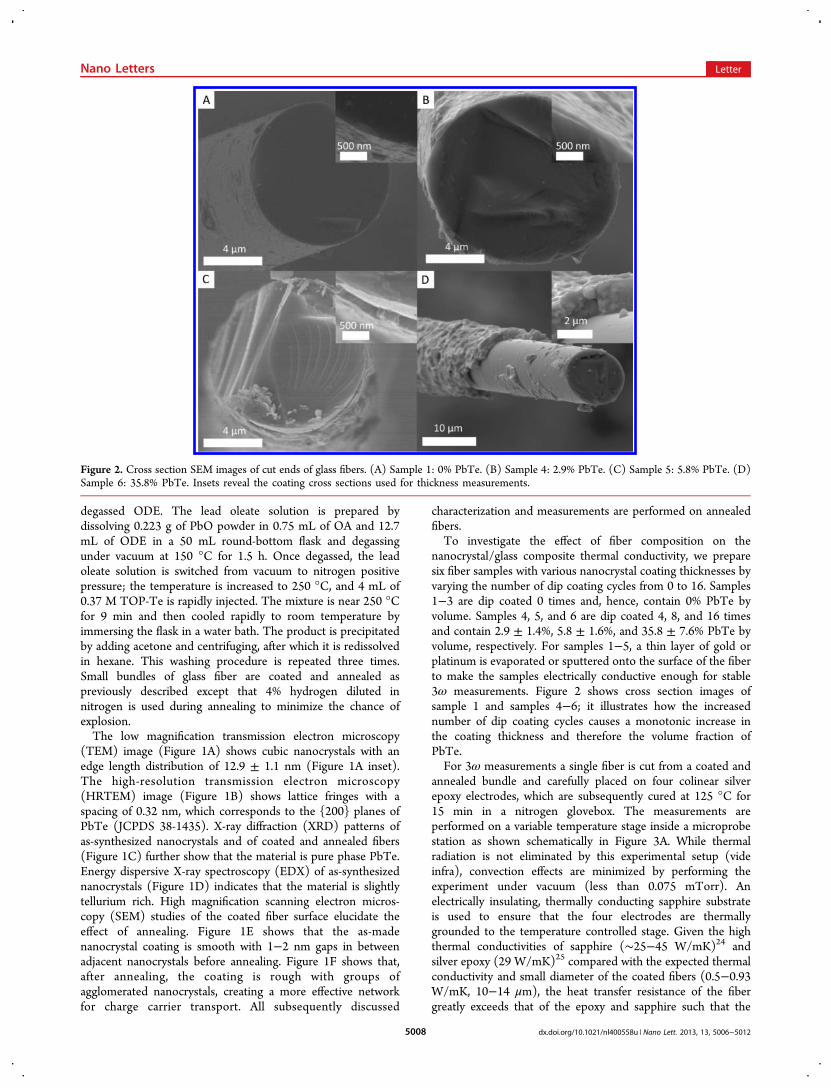
nanocrystal/glass composite thermal conductivity, we preparesix fiber samples with various nanocrystal coating thicknesses byvarying the number of dip coating cycles from 0 to 16. Samples1−3 are dip coated 0 times and, hence, contain 0% PbTe byvolume. Samples 4, 5, and 6 are dip coated 4, 8, and 16 timesand contain 2.9 ± 1.4%, 5.8 ± 1.6%, and 35.8 ± 7.6% PbTe byvolume, respectively. For samples 1−5, a thin layer of gold orplatinum is evaporated or sputtered onto the surface of the fiberto make the samples electrically conductive enough for stable3ω measurements. Figure 2 shows cross section images ofsample 1 and samples 4−6; it illustrates how the increasednumber of dip coating cycles causes a monotonic increase inthe coating thickness and therefore the volume fraction ofPbTe.For 3ω measurements a single fiber is cut from a coated and
annealed bundle and carefully placed on four colinear silverepoxy electrodes, which are subsequently cured at 125 °C for15 min in a nitrogen glovebox. The measurements areperformed on a variable temperature stage inside a microprobestation as shown schematically in Figure 3A. While thermalradiation is not eliminated by this experimental setup (videinfra), convection effects are minimized by performing theexperiment under vacuum (less than 0.075 mTorr). Anelectrically insulating, thermally conducting sapphire substrateis used to ensure that the four electrodes are thermallygrounded to the temperature controlled stage. Given the highthermal conductivities of sapphire (∼25−45 W/mK)24 andsilver epoxy (29 W/mK)25 compared with the expected thermalconductivity and small diameter of the coated fibers (0.5−0.93W/mK, 10−14 μm), the heat transfer resistance of the fibergreatly exceeds that of the epoxy and sapphire such that the
Figure 2. Cross section SEM images of cut ends of glass fibers. (A) Sample 1: 0% PbTe. (B) Sample 4: 2.9% PbTe. (C) Sample 5: 5.8% PbTe. (D)Sample 6: 35.8% PbTe. Insets reveal the coating cross sections used for thickness measurements.
Nano Letters Letter
dx.doi.org/10.1021/nl400558u | Nano Lett. 2013, 13, 5006−50125008
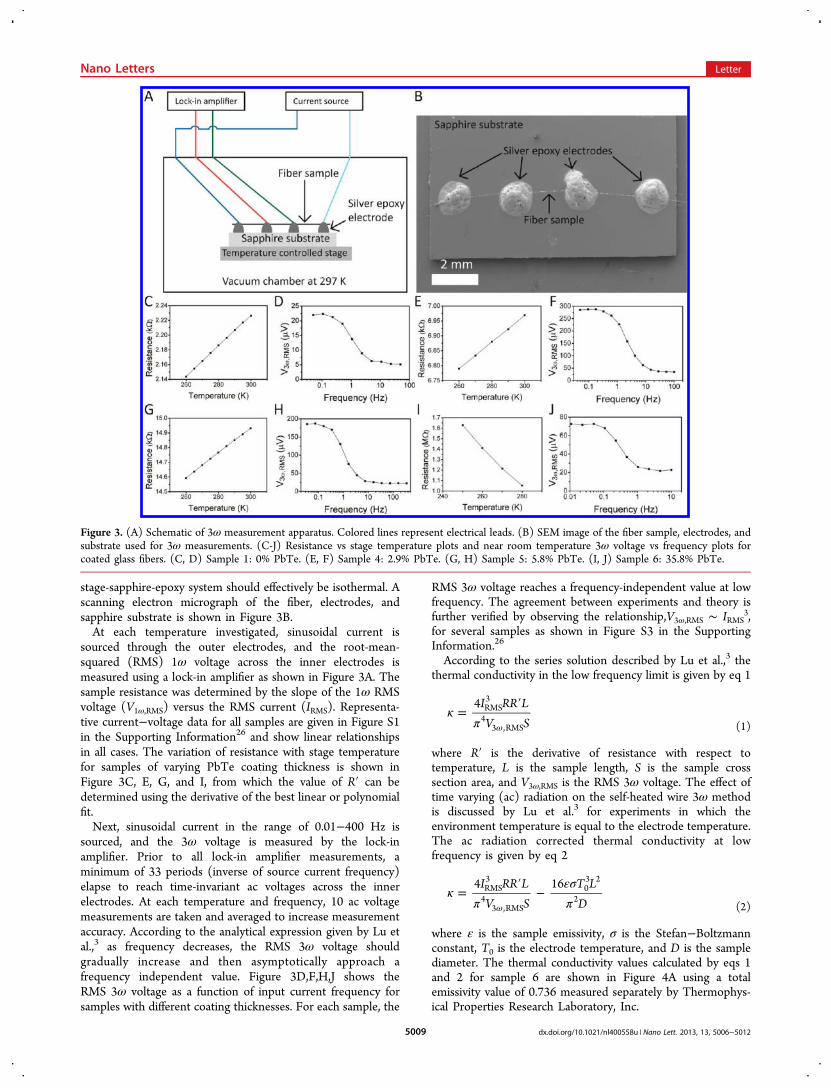
stage-sapphire-epoxy system should effectively be isothermal. Ascanning electron micrograph of the fiber, electrodes, andsapphire substrate is shown in Figure 3B.At each temperature investigated, sinusoidal current is
sourced through the outer electrodes, and the root-mean-squared (RMS) 1ω voltage across the inner electrodes ismeasured using a lock-in amplifier as shown in Figure 3A. Thesample resistance was determined by the slope of the 1ω RMSvoltage (V1ω,RMS) versus the RMS current (IRMS). Representa-tive current−voltage data for all samples are given in Figure S1in the Supporting Information26 and show linear relationshipsin all cases. The variation of resistance with stage temperaturefor samples of varying PbTe coating thickness is shown inFigure 3C, E, G, and I, from which the value of R′ can bedetermined using the derivative of the best linear or polynomialfit.Next, sinusoidal current in the range of 0.01−400 Hz is
sourced, and the 3ω voltage is measured by the lock-inamplifier. Prior to all lock-in amplifier measurements, aminimum of 33 periods (inverse of source current frequency)elapse to reach time-invariant ac voltages across the innerelectrodes. At each temperature and frequency, 10 ac voltagemeasurements are taken and averaged to increase measurementaccuracy. According to the analytical expression given by Lu etal.,3 as frequency decreases, the RMS 3ω voltage shouldgradually increase and then asymptotically approach afrequency independent value. Figure 3D,F,H,J shows theRMS 3ω voltage as a function of input current frequency forsamples with different coating thicknesses. For each sample, the
RMS 3ω voltage reaches a frequency-independent value at lowfrequency. The agreement between experiments and theory isfurther verified by observing the relationship,V3ω,RMS ∼ IRMS
3,for several samples as shown in Figure S3 in the SupportingInformation.26
According to the series solution described by Lu et al.,3 thethermal conductivity in the low frequency limit is given by eq 1
κπ
=′
ω
I RR LV S
4 RMS3
43 ,RMS (1)
where R′ is the derivative of resistance with respect totemperature, L is the sample length, S is the sample crosssection area, and V3ω,RMS is the RMS 3ω voltage. The effect oftime varying (ac) radiation on the self-heated wire 3ω methodis discussed by Lu et al.3 for experiments in which theenvironment temperature is equal to the electrode temperature.The ac radiation corrected thermal conductivity at lowfrequency is given by eq 2
κπ
εσπ
=′
−ω
I RR LV S
T LD
4 16RMS3
43 ,RMS
03 2
2(2)
where ε is the sample emissivity, σ is the Stefan−Boltzmannconstant, T0 is the electrode temperature, and D is the samplediameter. The thermal conductivity values calculated by eqs 1and 2 for sample 6 are shown in Figure 4A using a totalemissivity value of 0.736 measured separately by Thermophys-ical Properties Research Laboratory, Inc.
Figure 3. (A) Schematic of 3ω measurement apparatus. Colored lines represent electrical leads. (B) SEM image of the fiber sample, electrodes, andsubstrate used for 3ω measurements. (C-J) Resistance vs stage temperature plots and near room temperature 3ω voltage vs frequency plots forcoated glass fibers. (C, D) Sample 1: 0% PbTe. (E, F) Sample 4: 2.9% PbTe. (G, H) Sample 5: 5.8% PbTe. (I, J) Sample 6: 35.8% PbTe.
Nano Letters Letter
dx.doi.org/10.1021/nl400558u | Nano Lett. 2013, 13, 5006−50125009
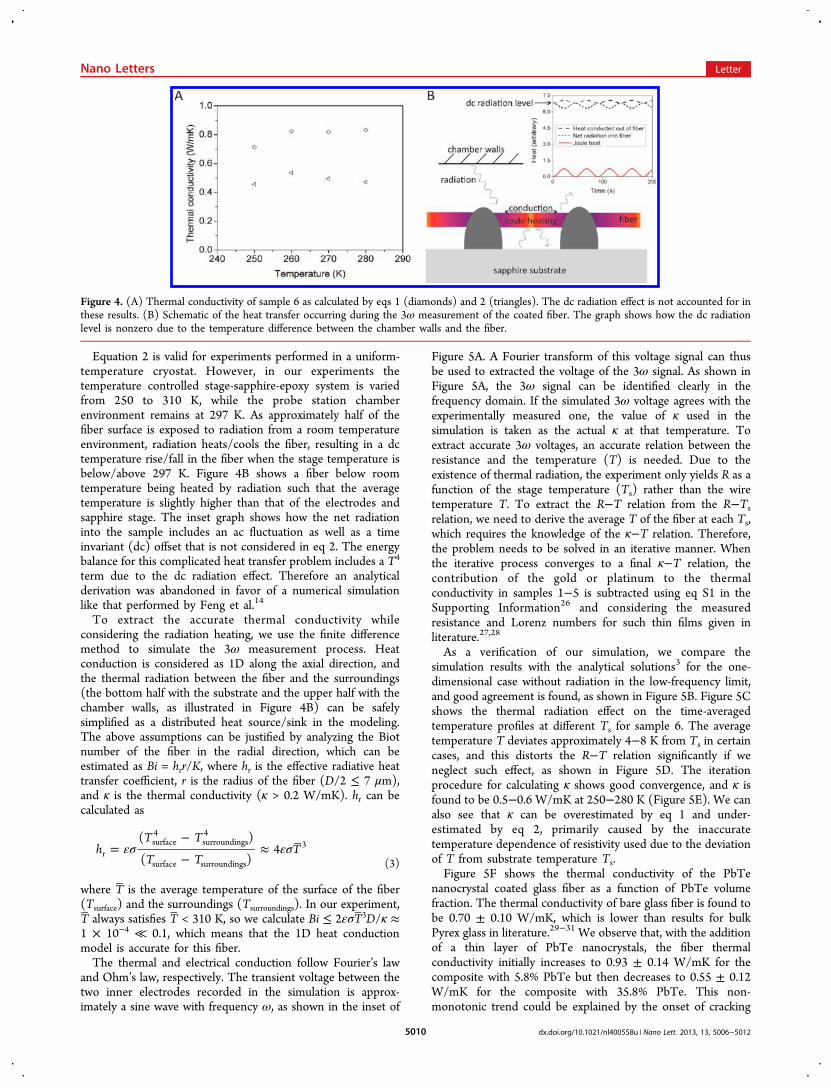
Equation 2 is valid for experiments performed in a uniform-temperature cryostat. However, in our experiments thetemperature controlled stage-sapphire-epoxy system is variedfrom 250 to 310 K, while the probe station chamberenvironment remains at 297 K. As approximately half of thefiber surface is exposed to radiation from a room temperatureenvironment, radiation heats/cools the fiber, resulting in a dctemperature rise/fall in the fiber when the stage temperature isbelow/above 297 K. Figure 4B shows a fiber below roomtemperature being heated by radiation such that the averagetemperature is slightly higher than that of the electrodes andsapphire stage. The inset graph shows how the net radiationinto the sample includes an ac fluctuation as well as a timeinvariant (dc) offset that is not considered in eq 2. The energybalance for this complicated heat transfer problem includes a T4
term due to the dc radiation effect. Therefore an analyticalderivation was abandoned in favor of a numerical simulationlike that performed by Feng et al.14
To extract the accurate thermal conductivity whileconsidering the radiation heating, we use the finite differencemethod to simulate the 3ω measurement process. Heatconduction is considered as 1D along the axial direction, andthe thermal radiation between the fiber and the surroundings(the bottom half with the substrate and the upper half with thechamber walls, as illustrated in Figure 4B) can be safelysimplified as a distributed heat source/sink in the modeling.The above assumptions can be justified by analyzing the Biotnumber of the fiber in the radial direction, which can beestimated as Bi = hrr/K, where hr is the effective radiative heattransfer coefficient, r is the radius of the fiber (D/2 ≤ 7 μm),and κ is the thermal conductivity (κ > 0.2 W/mK). hr can becalculated as
εσ εσ=−−
≈ ̅hT T
T TT
( )
( )4r
surface4
surroundings4
surface surroundings
3
(3)
where T̅ is the average temperature of the surface of the fiber(Tsurface) and the surroundings (Tsurroundings). In our experiment,T̅ always satisfies T̅ < 310 K, so we calculate Bi ≤ 2εσT̅3D/κ ≈1 × 10⁻⁴ ≪ 0.1, which means that the 1D heat conductionmodel is accurate for this fiber.The thermal and electrical conduction follow Fourier’s law
and Ohm’s law, respectively. The transient voltage between thetwo inner electrodes recorded in the simulation is approx-imately a sine wave with frequency ω, as shown in the inset of
Figure 5A. A Fourier transform of this voltage signal can thusbe used to extracted the voltage of the 3ω signal. As shown inFigure 5A, the 3ω signal can be identified clearly in thefrequency domain. If the simulated 3ω voltage agrees with theexperimentally measured one, the value of κ used in thesimulation is taken as the actual κ at that temperature. Toextract accurate 3ω voltages, an accurate relation between theresistance and the temperature (T) is needed. Due to theexistence of thermal radiation, the experiment only yields R as afunction of the stage temperature (Ts) rather than the wiretemperature T. To extract the R−T relation from the R−Tsrelation, we need to derive the average T of the fiber at each Ts,which requires the knowledge of the κ−T relation. Therefore,the problem needs to be solved in an iterative manner. Whenthe iterative process converges to a final κ−T relation, thecontribution of the gold or platinum to the thermalconductivity in samples 1−5 is subtracted using eq S1 in theSupporting Information26 and considering the measuredresistance and Lorenz numbers for such thin films given inliterature.27,28
As a verification of our simulation, we compare thesimulation results with the analytical solutions3 for the one-dimensional case without radiation in the low-frequency limit,and good agreement is found, as shown in Figure 5B. Figure 5Cshows the thermal radiation effect on the time-averagedtemperature profiles at different Ts for sample 6. The averagetemperature T deviates approximately 4−8 K from Ts in certaincases, and this distorts the R−T relation significantly if weneglect such effect, as shown in Figure 5D. The iterationprocedure for calculating κ shows good convergence, and κ isfound to be 0.5−0.6 W/mK at 250−280 K (Figure 5E). We canalso see that κ can be overestimated by eq 1 and under-estimated by eq 2, primarily caused by the inaccuratetemperature dependence of resistivity used due to the deviationof T from substrate temperature Ts.Figure 5F shows the thermal conductivity of the PbTe
nanocrystal coated glass fiber as a function of PbTe volumefraction. The thermal conductivity of bare glass fiber is found tobe 0.70 ± 0.10 W/mK, which is lower than results for bulkPyrex glass in literature.29−31 We observe that, with the additionof a thin layer of PbTe nanocrystals, the fiber thermalconductivity initially increases to 0.93 ± 0.14 W/mK for thecomposite with 5.8% PbTe but then decreases to 0.55 ± 0.12W/mK for the composite with 35.8% PbTe. This non-monotonic trend could be explained by the onset of cracking
Figure 4. (A) Thermal conductivity of sample 6 as calculated by eqs 1 (diamonds) and 2 (triangles). The dc radiation effect is not accounted for inthese results. (B) Schematic of the heat transfer occurring during the 3ω measurement of the coated fiber. The graph shows how the dc radiationlevel is nonzero due to the temperature difference between the chamber walls and the fiber.
Nano Letters Letter
dx.doi.org/10.1021/nl400558u | Nano Lett. 2013, 13, 5006−50125010
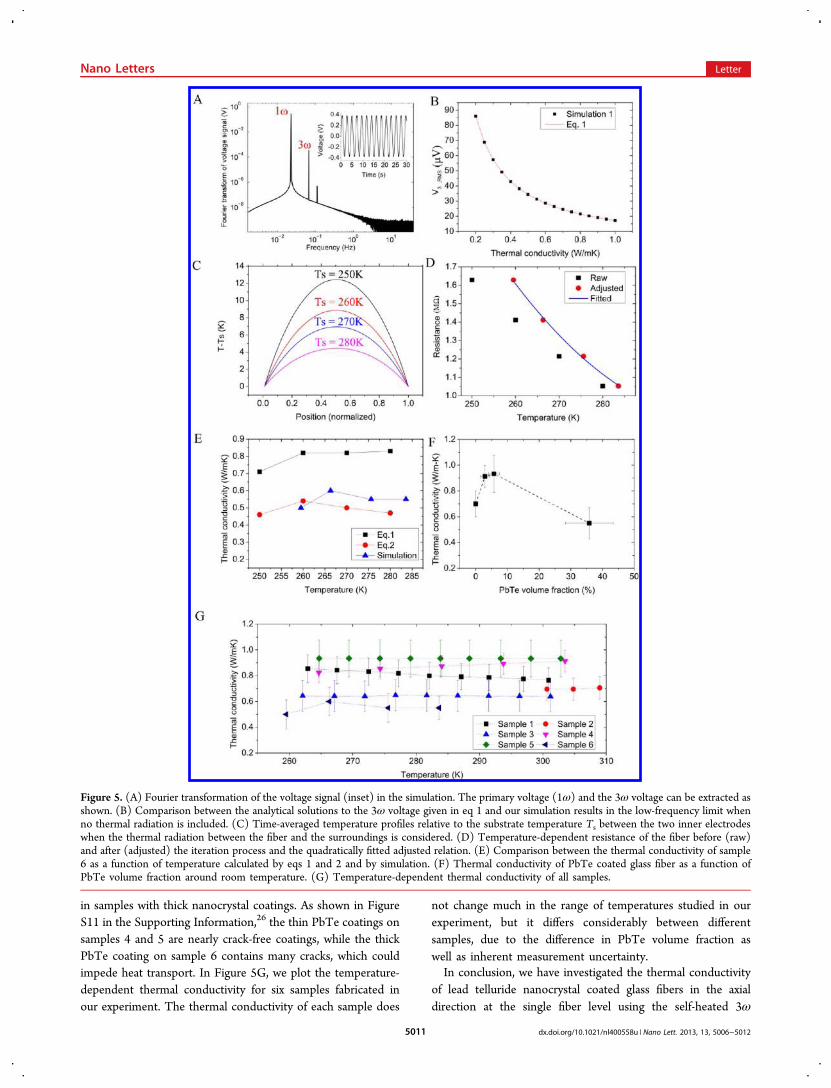
in samples with thick nanocrystal coatings. As shown in FigureS11 in the Supporting Information,26 the thin PbTe coatings onsamples 4 and 5 are nearly crack-free coatings, while the thickPbTe coating on sample 6 contains many cracks, which couldimpede heat transport. In Figure 5G, we plot the temperature-dependent thermal conductivity for six samples fabricated inour experiment. The thermal conductivity of each sample does
not change much in the range of temperatures studied in ourexperiment, but it differs considerably between differentsamples, due to the difference in PbTe volume fraction aswell as inherent measurement uncertainty.In conclusion, we have investigated the thermal conductivity
of lead telluride nanocrystal coated glass fibers in the axialdirection at the single fiber level using the self-heated 3ω
Figure 5. (A) Fourier transformation of the voltage signal (inset) in the simulation. The primary voltage (1ω) and the 3ω voltage can be extracted asshown. (B) Comparison between the analytical solutions to the 3ω voltage given in eq 1 and our simulation results in the low-frequency limit whenno thermal radiation is included. (C) Time-averaged temperature profiles relative to the substrate temperature Ts between the two inner electrodeswhen the thermal radiation between the fiber and the surroundings is considered. (D) Temperature-dependent resistance of the fiber before (raw)and after (adjusted) the iteration process and the quadratically fitted adjusted relation. (E) Comparison between the thermal conductivity of sample6 as a function of temperature calculated by eqs 1 and 2 and by simulation. (F) Thermal conductivity of PbTe coated glass fiber as a function ofPbTe volume fraction around room temperature. (G) Temperature-dependent thermal conductivity of all samples.
Nano Letters Letter
dx.doi.org/10.1021/nl400558u | Nano Lett. 2013, 13, 5006−50125011
technique. The low thermal conductivity of the sample and thedc radiation from the room temperature microprobe stationwalls violate assumptions inherent in the analytical expressionsderived by Lu et al. Therefore, a finite difference method hasbeen used to accurately simulate the 3ω measurements with theradiation effect. By iterating thermal conductivity values in thesimulations to obtain agreement with experimental 3ω voltages,the thermal conductivity was found to be 0.50−0.93 W/mK inthe temperature range 260−310 K. We also observe that fiberswith small volume fractions of PbTe possess an increase inthermal conductivity compared to bare glass. Meanwhile,cracking in thick nanocrystal coatings result in a decrease inthermal conductivity for fibers with a high volume fraction ofPbTe. We expect that our process of including both anexperimental approach and numerical modeling could be usefulto study the thermal conductivity of other wire-like sampleswith a low thermal conductivity and high aspect ratio at thesingle wire level, thus significantly broadening the application ofthe 3ω measurement technique.
■ ASSOCIATED CONTENT*S Supporting InformationAdditional sample preparation details, current vs voltage data,additional resistance vs temperature and 3ω voltage vsfrequency data, emissivity measurement details and results,and simulation details for all measured samples. This material isavailable free of charge via the Internet at http://pubs.acs.org.
■ AUTHOR INFORMATIONCorresponding Authors*Tel.: +1-765-494-5721. E-mail: [email protected]. Fax: +1-765-494-0539.*Tel.: +1-765-494-6028. E-mail: [email protected]. Fax: +1-765-494-0805.
Author Contributions#S.W.F. and Y. Wang contributed equally.
NotesThe authors declare no competing financial interest.
■ ACKNOWLEDGMENTSY. Wu thanks the support from NSF/DOE ThermoelectricPartnership (Award no. 1048616) and the support from AirForce Office of Scientific Research (Award no. FA9550-12-1-0061). Y. Wang and X.R. acknowledge the partial support fromNational Science Foundation (Award no. CBET-1150948). Y.Wu and S.W.F. thank the support from the ASEE SFFP.
■ REFERENCES(1) See, K. C.; Feser, J. P.; Chen, C. E.; Majumdar, A.; Urban, J. J.;Segalman, R. A. Nano Lett. 2010, 10 (11), 4664−4667.(2) Liang, D.; Yang, H.; Finefrock, S. W.; Wu, Y. Nano Lett. 2012, 12(4), 2140−2145.(3) Lu, L.; Yi, W.; Zhang, D. L. Rev. Sci. Instrum. 2001, 72 (7), 2996−3003.(4) Moon, J.; Weaver, K.; Feng, B.; Chae, H. G.; Kumar, S.; Baek, J.-B.; Peterson, G. P. Rev. Sci. Instrum. 2012, 83 (1), 016103−3.(5) Demko, M. T.; Dai, Z.; Yan, H.; King, W. P.; Cakmak, M.;Abramson, A. R. Rev. Sci. Instrum. 2009, 80 (3), 036103−3.(6) Hou, J.; Wang, X.; Zhang, L. Appl. Phys. Lett. 2006, 89 (15),152504−3.(7) Guo, J.; Wang, X.; Geohegan, D. B.; Eres, G.; Vincent, C. J. Appl.Phys. 2008, 103 (11), 113505−9.
(8) Boukai, A. I.; Bunimovich, Y.; Tahir-Kheli, J.; Yu, J.-K.; Goddard,W. A., III; Heath, J. R. Nature 2008, 451 (7175), 168−171.(9) Hochbaum, A. I.; Chen, R.; Delgado, R. D.; Liang, W.; Garnett, E.C.; Najarian, M.; Majumdar, A.; Yang, P. Nature 2008, 451 (7175),163−167.(10) Li, D.; Wu, Y.; Kim, P.; Shi, L.; Yang, P.; Majumdar, A. Appl.Phys. Lett. 2003, 83 (14), 2934−2936.(11) Shi, L.; Li, D.; Yu, C.; Jang, W.; Kim, D.; Yao, Z.; Kim, P.;Majumdar, A. J. Heat Transfer 2003, 125 (5), 881−888.(12) Wang, Z. L.; Tang, D. W.; Zhang, W. G. J. Phys. D: Appl. Phys.2007, 40 (15), 4686.(13) Aliev, A. E.; Guthy, C.; Zhang, M.; Fang, S.; Zakhidov, A. A.;Fischer, J. E.; Baughman, R. H. Carbon 2007, 45 (15), 2880−2888.(14) Feng, B.; Li, Z.; Zhang, X.; Peterson, G. P. J. Vac. Sci. Technol., B2009, 27 (5), 2280−2285.(15) Hopkins, P. E.; Phinney, L. M. J. Heat Transfer 2009, 131 (4),043201−8.(16) Cahill, D. G.; Katiyar, M.; Abelson, J. R. Phys. Rev. B 1994, 50(9), 6077−6081.(17) Liu, W.; Balandin, A. A. Appl. Phys. Lett. 2004, 85 (22), 5230−5232.(18) Coates, N. E.; Yee, S. K.; McCulloch, B.; See, K. C.; Majumdar,A.; Segalman, R. A.; Urban, J. J. Adv. Mater. 2013, 25 (11), 1629−1633.(19) Hakansson, E.; Kaynak, A.; Lin, T.; Nahavandi, S.; Jones, T.;Hu, E. Synth. Met. 2004, 144 (1), 21−28.(20) Lin, T.; Wang, L.; Wang, X.; Kaynak, A. Thin Solid Films 2005,479 (1−2), 77−82.(21) Boakye, E.; Hay, R. S.; Petry, M. D. J. Am. Ceram. Soc. 1999, 82(9), 2321−2331.(22) Boakye, E. E.; Hay, R. S.; Petry, M. D.; Parthasarathy, T. A. J.Am. Ceram. Soc. 2004, 87 (10), 1967−1976.(23) Boakye, E. E.; Hay, R. S.; Mogilevsky, P.; Cinibulk, M. K. J. Am.Ceram. Soc. 2008, 91 (1), 17−25.(24) Liu, W.; Balandin, A. A. J. Appl. Phys. 2005, 97 (7), 073710−6.(25) EPO-TEK H20E Technical Data Sheet. https://www.laddresearch.com/index.php/lanotattachments/download/file/id/6/store/1/, May 2009.(26) Additional details on sample preparation, emissivity measure-ment and iterative simulation procedure in computing thermalconductivity from measured data can be found in the SupportingInformation.(27) Lin, H.; Xu, S.; Li, C.; Dong, H.; Wang, X. Nanoscale 2013, 5(11), 4652−4656.(28) Zhang, X.; Xie, H.; Fujii, M.; Ago, H.; Takahashi, K.; Ikuta, T.;Abe, H.; Shimizu, T. Appl. Phys. Lett. 2005, 86 (17), 171912−3.(29) Yang, G.; Migone, A. D.; Johnson, K. W. Phys. Rev. B 1992, 45(1), 157−160.(30) Log, T.; Metallinou, M. M. Rev. Sci. Instrum. 1992, 63 (8),3966−3971.(31) Miller, M. S.; Kotlar, A. J. Rev. Sci. Instrum. 1993, 64 (10),2954−2960.
Nano Letters Letter
dx.doi.org/10.1021/nl400558u | Nano Lett. 2013, 13, 5006−50125012