Low energy measurement of the N(p,γ Ototal cross...
21
Nuclear Physics A 779 (2006) 297–317 Low energy measurement of the 14 N(p, γ ) 15 O total cross section at the LUNA underground facility LUNA Collaboration D. Bemmerer a , F. Confortola b , A. Lemut b , R. Bonetti c , C. Broggini a , P. Corvisiero b , H. Costantini b , J. Cruz d , A. Formicola e , Zs. Fülöp f , G. Gervino g , A. Guglielmetti c , C. Gustavino e , Gy. Gyürky f , G. Imbriani h , A. Jesus d , M. Junker e , B. Limata h , R. Menegazzo a , P. Prati b,∗,1 , V. Roca h , C. Rolfs i , D. Rogalla h , M. Romano h , C. Rossi-Alvarez a , F. Schümann i , E. Somorjai f , O. Straniero j , F. Strieder i , F. Terrasi k , H.P. Trautvetter i a INFN Sezione di Padova, Padova, Italy b Università degli Studi Genova & INFN Genova, Genova, Italy c Università di Milano & INFN Milano, Istituto di Fisica Generale Applicata, Milano, Italy d Centro de Fisica Nuclear da Universidade de Lisboa, Lisboa, Portugal e INFN, Laboratori Nazionali del Gran Sasso, Assergi, L’Aquila, Italy f ATOMKI, Debrecen, Hungary g Università di Torino & INFN Torino, Torino, Italy h Università “Federico II” & INFN Napoli, Napoli, Italy i Institut für Experimentalphysik III, Ruhr-Universität Bochum, Bochum, Germany j INAF, Osservatorio Astronomico di Collurania, Teramo, and INFN Napoli, Napoli, Italy k Seconda Università di Napoli & INFN Napoli, Napoli, Italy Received 8 June 2006; received in revised form 31 August 2006; accepted 6 September 2006 Available online 25 September 2006 Abstract Deep underground in Gran Sasso National Laboratory (Italy), at the LUNA facility, the cross section of the 14 N(p, γ ) 15 O, the slowest process of the CNO cycle, has been measured at energies much lower than * Corresponding author. Tel.: +39 010 353 6439; fax: +39 010 314218. E-mail address: [email protected] (P. Prati). 1 Present address: Dipartimento di Fisica, Via Dodecaneso 33, 16146 Genova, Italy. 0375-9474/$ – see front matter © 2006 Elsevier B.V. All rights reserved. doi:10.1016/j.nuclphysa.2006.09.001
Transcript of Low energy measurement of the N(p,γ Ototal cross...
Nuclear Physics A 779 (2006) 297–317
Low energy measurement of the 14N(p,γ )15O totalcross section at the LUNA underground facility
LUNA Collaboration
D. Bemmerer a, F. Confortola b, A. Lemut b, R. Bonetti c, C. Broggini a,P. Corvisiero b, H. Costantini b, J. Cruz d, A. Formicola e, Zs. Fülöp f,
G. Gervino g, A. Guglielmetti c, C. Gustavino e, Gy. Gyürky f,G. Imbriani h, A. Jesus d, M. Junker e, B. Limata h, R. Menegazzo a,
P. Prati b,∗,1, V. Roca h, C. Rolfs i, D. Rogalla h, M. Romano h,C. Rossi-Alvarez a, F. Schümann i, E. Somorjai f, O. Straniero j,
F. Strieder i, F. Terrasi k, H.P. Trautvetter i
a INFN Sezione di Padova, Padova, Italyb Università degli Studi Genova & INFN Genova, Genova, Italy
c Università di Milano & INFN Milano, Istituto di Fisica Generale Applicata, Milano, Italyd Centro de Fisica Nuclear da Universidade de Lisboa, Lisboa, Portugal
e INFN, Laboratori Nazionali del Gran Sasso, Assergi, L’Aquila, Italyf ATOMKI, Debrecen, Hungary
g Università di Torino & INFN Torino, Torino, Italyh Università “Federico II” & INFN Napoli, Napoli, Italy
i Institut für Experimentalphysik III, Ruhr-Universität Bochum, Bochum, Germanyj INAF, Osservatorio Astronomico di Collurania, Teramo, and INFN Napoli, Napoli, Italy
k Seconda Università di Napoli & INFN Napoli, Napoli, Italy
Received 8 June 2006; received in revised form 31 August 2006; accepted 6 September 2006
Available online 25 September 2006
Abstract
Deep underground in Gran Sasso National Laboratory (Italy), at the LUNA facility, the cross section ofthe 14N(p,γ )15O, the slowest process of the CNO cycle, has been measured at energies much lower than
* Corresponding author. Tel.: +39 010 353 6439; fax: +39 010 314218.E-mail address: [email protected] (P. Prati).
1 Present address: Dipartimento di Fisica, Via Dodecaneso 33, 16146 Genova, Italy.
0375-9474/$ – see front matter © 2006 Elsevier B.V. All rights reserved.doi:10.1016/j.nuclphysa.2006.09.001
298 LUNA Collaboration / Nuclear Physics A 779 (2006) 297–317
achieved before. Using a 400 kV accelerator, a windowless gas target and a 4π BGO summing detector,direct cross section data has been obtained down to 70 keV, reaching a value of 0.24 picobarn, correspond-ing to an S-factor of 1.74 ± 0.14(stat) ± 0.14(syst) keV barn. The Gamow peak has been covered by directexperimental data for several scenarios of stable and explosive hydrogen burning. The ωγ strength of the259 keV resonance has been re-measured obtaining 12.8 ± 0.3(stat) ± 0.4(syst) meV. The stellar reactionrate has been calculated for temperatures 0.09 × 10⁹ − 0.3 × 10⁹ K. A complete description of the experi-ment is here presented, including the impact of the present data on nucleosynthesis in AGB stars.© 2006 Elsevier B.V. All rights reserved.
PACS: 25.40.Lw; 26.20.+f
Keywords: 14N(p,γ )15O; CNO cycle; Direct measurement; Underground accelerator
1. Introduction
Stars generate energy and synthesize chemical elements in thermonuclear reactions [1]. Non-resonant reactions induced by charged particles in a star take place in a narrow energy windowcalled the Gamow peak, far below the Coulomb barrier.
At low energy, the cross section σ(E) of a charged particle induced reaction drops steeplywith decreasing energy due to the Coulomb barrier in the entrance channel [1]:
σ(E) = S(E)e−2πη(E)
E, (1)
where S(E) is the astrophysical S factor, and η is the Sommerfeld parameter with 2πη =31.29 Z1Z2(μ/E)1/2. Here Z1 and Z2 are the charge numbers of projectile and target nucleus,respectively, μ is the reduced mass (in amu units), and E is the center of mass energy2 (in keVunits).
Generally, σ(E) has a very low value at the Gamow peak, this preventing a direct measure-ment in a laboratory at the Earth’s surface, where the signal to background ratio is too smallbecause of cosmic ray interactions with detectors. Hence, cross sections are usually measured athigh energies and expressed as the astrophysical S factor from Eq. (1). The S factor is then usedto extrapolate the data to the Gamow peak region. Although S(E) varies only slowly with energyfor the direct process, resonances and resonance tails may hinder the extrapolation, resulting inlarge uncertainties [1]. Therefore, the primary goal of experimental nuclear astrophysics remainsto measure the cross section at energies inside the Gamow peak, or at least to approach it asclosely as possible.
The Laboratory for Underground Nuclear Astrophysics (LUNA) has been designed for thispurpose and is located deep underground in the Laboratori Nazionali del Gran Sasso (LNGS)3
in Italy. The Gran Sasso site is protected from cosmic rays by a rock cover (1400 m thick)equivalent to 3800 m water, suppressing the flux of cosmic ray induced muons by six orders ofmagnitude [2] and the neutron flux by three orders of magnitude [3]. Using this approach, incombination with high current accelerators [4,5] and high efficiency detection systems, two hy-drogen burning reactions were studied for the first time directly in their respective solar Gamowpeak: the 3He(3He, 2p)4He [6] and the 2H(p, γ )3He reaction [7].
2 In the present work, E denotes the energy in the center of mass system, and Ebeam is the projectile energy in thelaboratory system.
3 http://www.lngs.infn.it.
LUNA Collaboration / Nuclear Physics A 779 (2006) 297–317 299
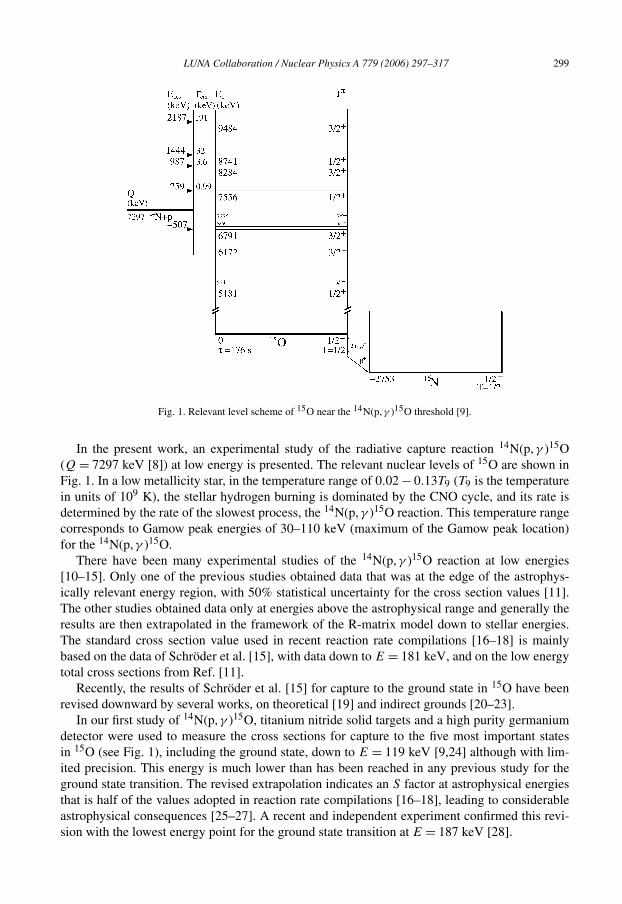
Fig. 1. Relevant level scheme of 15O near the 14N(p, γ )15O threshold [9].
In the present work, an experimental study of the radiative capture reaction 14N(p, γ )15O(Q = 7297 keV [8]) at low energy is presented. The relevant nuclear levels of 15O are shown inFig. 1. In a low metallicity star, in the temperature range of 0.02 − 0.13T9 (T9 is the temperaturein units of 109 K), the stellar hydrogen burning is dominated by the CNO cycle, and its rate isdetermined by the rate of the slowest process, the 14N(p, γ )15O reaction. This temperature rangecorresponds to Gamow peak energies of 30–110 keV (maximum of the Gamow peak location)for the 14N(p, γ )15O.
There have been many experimental studies of the 14N(p, γ )15O reaction at low energies[10–15]. Only one of the previous studies obtained data that was at the edge of the astrophys-ically relevant energy region, with 50% statistical uncertainty for the cross section values [11].The other studies obtained data only at energies above the astrophysical range and generally theresults are then extrapolated in the framework of the R-matrix model down to stellar energies.The standard cross section value used in recent reaction rate compilations [16–18] is mainlybased on the data of Schröder et al. [15], with data down to E = 181 keV, and on the low energytotal cross sections from Ref. [11].
Recently, the results of Schröder et al. [15] for capture to the ground state in 15O have beenrevised downward by several works, on theoretical [19] and indirect grounds [20–23].
In our first study of 14N(p, γ )15O, titanium nitride solid targets and a high purity germaniumdetector were used to measure the cross sections for capture to the five most important statesin 15O (see Fig. 1), including the ground state, down to E = 119 keV [9,24] although with lim-ited precision. This energy is much lower than has been reached in any previous study for theground state transition. The revised extrapolation indicates an S factor at astrophysical energiesthat is half of the values adopted in reaction rate compilations [16–18], leading to considerableastrophysical consequences [25–27]. A recent and independent experiment confirmed this revi-sion with the lowest energy point for the ground state transition at E = 187 keV [28].
300 LUNA Collaboration / Nuclear Physics A 779 (2006) 297–317
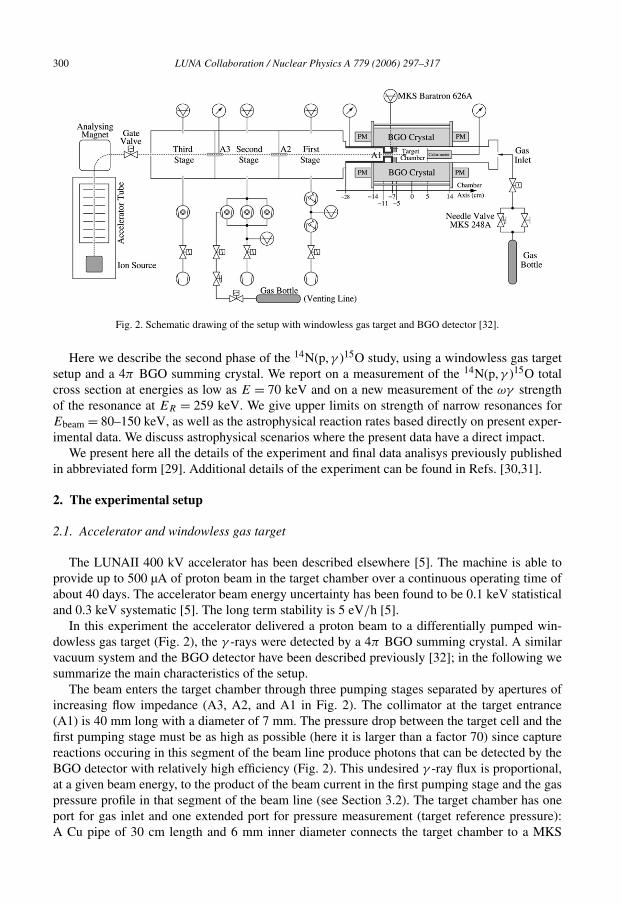
Fig. 2. Schematic drawing of the setup with windowless gas target and BGO detector [32].
Here we describe the second phase of the 14N(p, γ )15O study, using a windowless gas targetsetup and a 4π BGO summing crystal. We report on a measurement of the 14N(p, γ )15O totalcross section at energies as low as E = 70 keV and on a new measurement of the ωγ strengthof the resonance at ER = 259 keV. We give upper limits on strength of narrow resonances forEbeam = 80–150 keV, as well as the astrophysical reaction rates based directly on present exper-imental data. We discuss astrophysical scenarios where the present data have a direct impact.
We present here all the details of the experiment and final data analisys previously publishedin abbreviated form [29]. Additional details of the experiment can be found in Refs. [30,31].
2. The experimental setup
2.1. Accelerator and windowless gas target
The LUNAII 400 kV accelerator has been described elsewhere [5]. The machine is able toprovide up to 500 µA of proton beam in the target chamber over a continuous operating time ofabout 40 days. The accelerator beam energy uncertainty has been found to be 0.1 keV statisticaland 0.3 keV systematic [5]. The long term stability is 5 eV/h [5].
In this experiment the accelerator delivered a proton beam to a differentially pumped win-dowless gas target (Fig. 2), the γ -rays were detected by a 4π BGO summing crystal. A similarvacuum system and the BGO detector have been described previously [32]; in the following wesummarize the main characteristics of the setup.
The beam enters the target chamber through three pumping stages separated by apertures ofincreasing flow impedance (A3, A2, and A1 in Fig. 2). The collimator at the target entrance(A1) is 40 mm long with a diameter of 7 mm. The pressure drop between the target cell and thefirst pumping stage must be as high as possible (here it is larger than a factor 70) since capturereactions occuring in this segment of the beam line produce photons that can be detected by theBGO detector with relatively high efficiency (Fig. 2). This undesired γ -ray flux is proportional,at a given beam energy, to the product of the beam current in the first pumping stage and the gaspressure profile in that segment of the beam line (see Section 3.2). The target chamber has oneport for gas inlet and one extended port for pressure measurement (target reference pressure):A Cu pipe of 30 cm length and 6 mm inner diameter connects the target chamber to a MKS
LUNA Collaboration / Nuclear Physics A 779 (2006) 297–317 301
Baratron capacitance manometer with an accuracy of 0.25%, located outside the BGO detector(Fig. 2). The nitrogen pressure in the target chamber is kept constant within 0.5% by a needlevalve (Fig. 2) in combination with an active electronic feedback regulation system.
The BGO detector is shaped as a 28 cm long cylinder with a coaxial hole of 6 cm diameter.The crystal is divided into 6 optically indepedent sectors (radial thickness 7 cm), each covering anazimuthal angle of 60 degrees. Two Hamamatsu R1847-07 photomultipliers (PMs) are coupledto the opposite faces of each sector. The target chamber and the beam calorimeter are hostedinside the BGO hole (Fig. 2). The center of the 10 cm long target cell is at the middle of thedetector. This way the detector covers a large fraction of the solid angle (97.7%).
2.2. Beam current integration
The beam current in the target area was determined using a beam calorimeter with constanttemperature gradient [32]. The use of a Faraday cup is here prevented since in passing throughthe different pumping stages of the gas target system the charge state of low energy projectilesfluctuates [33]. The power delivered by the beam (and consequently the number of projectiles) iscalculated as the difference between heating power without beam (Wno_beam) and with ion beam(Wbeam). Thus, the number of accelerated proton in a run is given by:
Np = (Wno_beam − Wbeam)
Ecal× �t, (2)
where Ecal is the laboratory energy of the beam projectiles at the calorimeter surface, and �t themeasurement time. Ecal is calculated according to the stopping power tabulation of Ref. [34] andto the effective target density discussed in the next section. The calorimeter has been designedto measure beam powers in the range 10–140 W. It has been calibrated at the LUNAII 400 kVaccelerator with a systematic uncertainty smaller than 1% [32].
2.3. Effective target density
The gas pressure P and temperature T vary along the beam path from the accelerator to theinteraction chamber and the target density (in units of atoms/cm3) at position z is given by [1]:
ρ(z) = νP (z)
kT (z), (3)
where ν is the number of atoms per molecule and k is the Boltzmann constant. The pressureprofile in the first pumping stage and in the target chamber was measured with a dedicated setup(shown in Fig. 2 of Ref. [32]) using a couple of manometers with an accuracy of 0.25%. Thepressure drop along the Cu pipe connecting the manometer to the target chamber was foundsmaller than 0.5%. In the pipe sections where direct pressure measurements were impossible(i.e. inside the 40 mm long collimator at target entrance) linear pressure gradients were assumed.
The gas temperature profile without beam was measured in the target chamber with a speciallow thermal capacity PT100 temperature transducer, shielded against thermal radiative effects,with an accuracy of 0.1 C◦. The resulting density profile without beam, ρ(z), is shown in Fig. 5;ρ(z) values are affected by statistical and systematic uncertainties of 0.25% and 0.5%, respec-tively.
When the beam passes through the nitrogen gas the local density can be reduced due totemperature and other effects at intense ion beam [35]. Moreover, pressure and temperature
302 LUNA Collaboration / Nuclear Physics A 779 (2006) 297–317
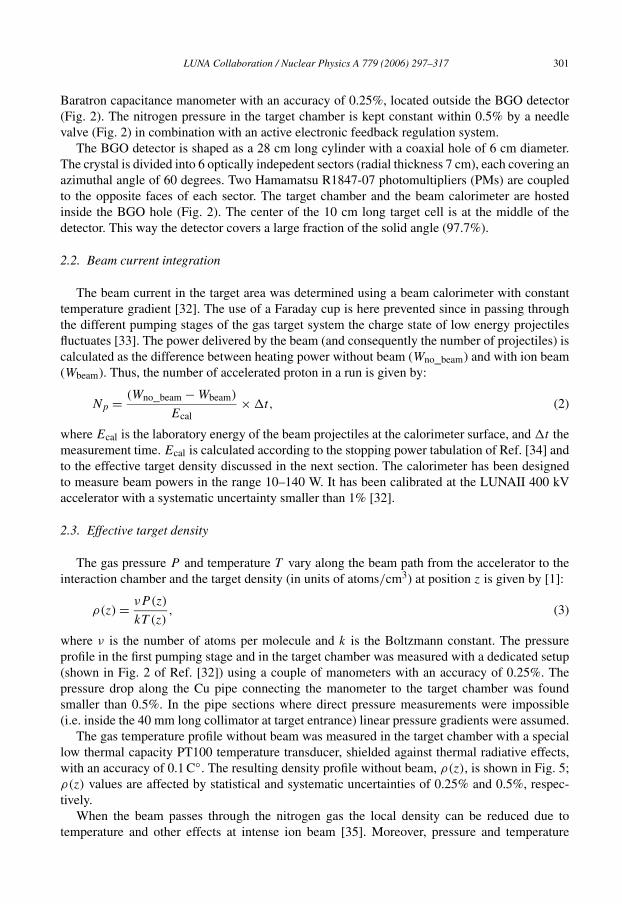
Fig. 3. Setup used to study the beam heating effect. See text for details.
gauges cannot be used in conjunction with the beam to detect changes in the local area alongthe beam path. We measured the local gas density with and indirect method [35] exploiting theER = 259 keV resonance in the 14N(p, γ )15O reaction.
The local density is related to the energy loss �Ebeam by:
�Ebeam = Ebeam(zR) − ER =zR∫
0
dE
d(ρx)
(E(z)
)ρbeam(z) dz, (4)
where Ebeam(zR) is the proton energy at the accelerator resulting, due to the energy loss in thegas target, in E = 259 keV at position zR along the beam path, ER is the resonance energy, dE
d(ρx)is the proton stopping power in nitrogen [34], and ρbeam is the actual target density with thebeam.
To take into account the beam heating effect in the nitrogen gas we introduced a correctionfactor hbeam defined by:
ρbeam(z) = hbeam(z) × ρ(z), (5)
where ρ(z) is the gas density profile measured without beam. Combining Eqs. (4) and (5), andassuming hbeam as constant with position (see later), the correction factor is given by:
hbeam = �Ebeam
�E, (6)
where �Ebeam is the proton energy loss given by Eq. (4), and �E is the energy loss calculatedwith the density profile measured without beam.
To measure �Ebeam we used a lead shielded 1′′ × 1′′ NaI detector mounted on a slit movablealong an axis parallel to the beam direction (Fig. 3). The lead shield had an hole of 5 mm diameterand was 70 mm thick. The effective target length seen by the collimated detector was determined,with the LUNA Monte Carlo code [36], to be 2.00 ± 0.14 cm (FWHM of the spatial efficiencydistribution for 7 MeV γ -rays).
To determine at which beam energy the resonance is located at zR in front of the NaI detector,the resonance scan technique was used: The proton beam energy Ebeam was changed in fine steps(500 eV) for getting the excitation functions and consequently the maximum of the yield.
The scans were repeated at several detector position along the target chamber, namely −5,−3, −1, 1, and 3 cm (see Figs. 2 and 3). At each position the measurements were performed at
LUNA Collaboration / Nuclear Physics A 779 (2006) 297–317 303
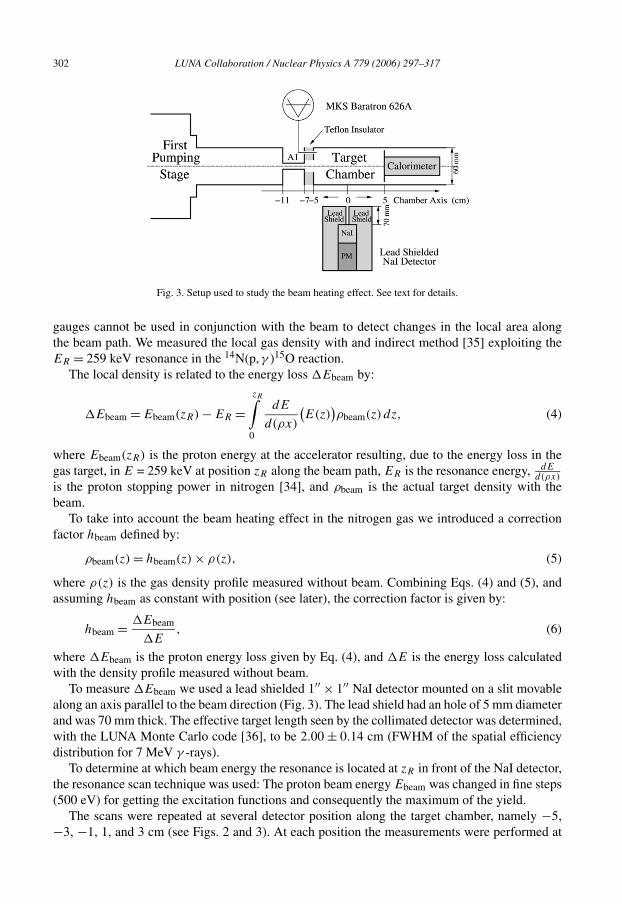
Fig. 4. Beam heating correction factor hbeam as a function of the dissipated power per unit length in the nitrogen gas[35] for different positions along the beam path (Fig. 2). Error bars do not include the systematic uncertainty of the beamenergy loss �Ebeam. The solid line through the data points assumes a linear relationship between the correction factorand dW/dx.
several pressures, (0.5, 1.0, and 2.0 mbar) and with different beam intensities. For each resonancescan, we calculated the density correction factor hbeam (Eq. (6)). The results are plotted in Fig. 4as a function of the dissipated power per unit length dW/dx [35]:
dW
dx= dE
dx× Ip, (7)
where dEdx
is the proton energy loss per unit length [34], and Ip is the proton beam intensity.The hbeam values are mainly affected by the systematic uncertainties due to the determination
of the energy loss �Ebeam (see Eq. (4)) that ranged from 35% at 0.5 mbar, through 16% at 1 mbarto 7% at 2.0 mbar (not shown in Fig. 4).
No sizeable hbeam dependence on the position has been observed (Fig. 4). This is in agreementwith the conclusions in Ref. [35]. In fact, a 10% variation in the target density ρ(z) (Fig. 5) wouldresult in a change of hbeam smaller than 2%, well below other experimental uncertainties.
As in Ref. [35] we assumed a linear relationship between hbeam and dW/dx (Fig. 4) obtaining:
hbeam = 1.0 − 5.4 × 10⁻⁴(
dW
dx
), (8)
where dW/dx is in units of mW/cm. The total uncertainty of the hbeam factor given by Eq. (8)is 3.2%, given by the average deviation between the adopted linear interpolation and the experi-mental values.
The effective target density profile, including the beam heating effect, is shown in Fig. 5.
2.4. BGO detector and LUNA Monte Carlo simulation
In the experiment the signals from the six BGO sectors were summed to give the spectrum ofthe total γ -rays energy emitted per event. The performance of the BGO detector were simulatedwith the LUNA Monte Carlo code [36] and its predictions were tested in terms of detectionefficiency η(z) and spectrum shape. The code had also been extensively tested in the past [6,7,
304 LUNA Collaboration / Nuclear Physics A 779 (2006) 297–317
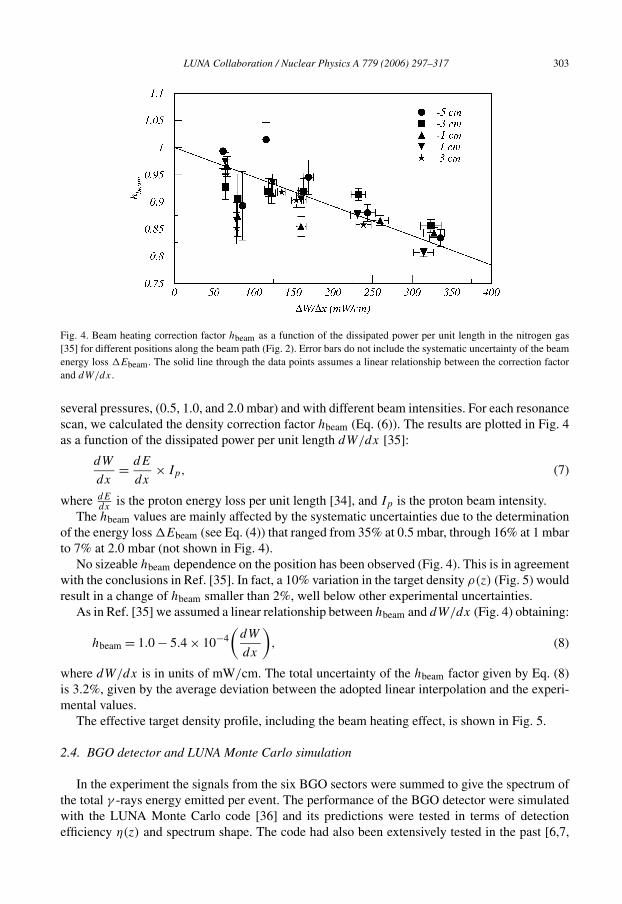
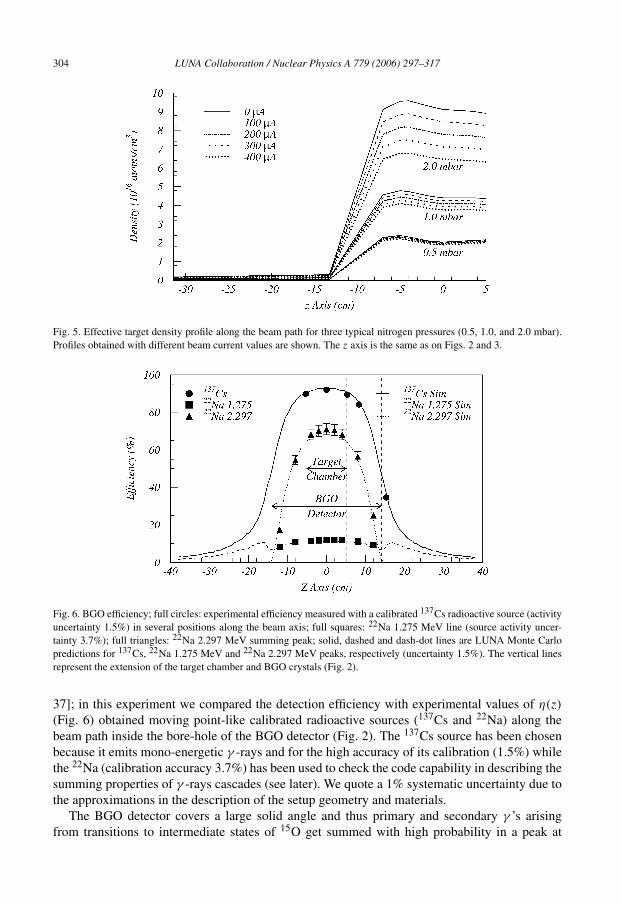
Fig. 5. Effective target density profile along the beam path for three typical nitrogen pressures (0.5, 1.0, and 2.0 mbar).Profiles obtained with different beam current values are shown. The z axis is the same as on Figs. 2 and 3.
Fig. 6. BGO efficiency; full circles: experimental efficiency measured with a calibrated 137Cs radioactive source (activityuncertainty 1.5%) in several positions along the beam axis; full squares: 22Na 1.275 MeV line (source activity uncer-tainty 3.7%); full triangles: 22Na 2.297 MeV summing peak; solid, dashed and dash-dot lines are LUNA Monte Carlopredictions for 137Cs, 22Na 1.275 MeV and 22Na 2.297 MeV peaks, respectively (uncertainty 1.5%). The vertical linesrepresent the extension of the target chamber and BGO crystals (Fig. 2).
37]; in this experiment we compared the detection efficiency with experimental values of η(z)
(Fig. 6) obtained moving point-like calibrated radioactive sources (137Cs and 22Na) along thebeam path inside the bore-hole of the BGO detector (Fig. 2). The 137Cs source has been chosenbecause it emits mono-energetic γ -rays and for the high accuracy of its calibration (1.5%) whilethe 22Na (calibration accuracy 3.7%) has been used to check the code capability in describing thesumming properties of γ -rays cascades (see later). We quote a 1% systematic uncertainty due tothe approximations in the description of the setup geometry and materials.
The BGO detector covers a large solid angle and thus primary and secondary γ ’s arisingfrom transitions to intermediate states of 15O get summed with high probability in a peak at
LUNA Collaboration / Nuclear Physics A 779 (2006) 297–317 305
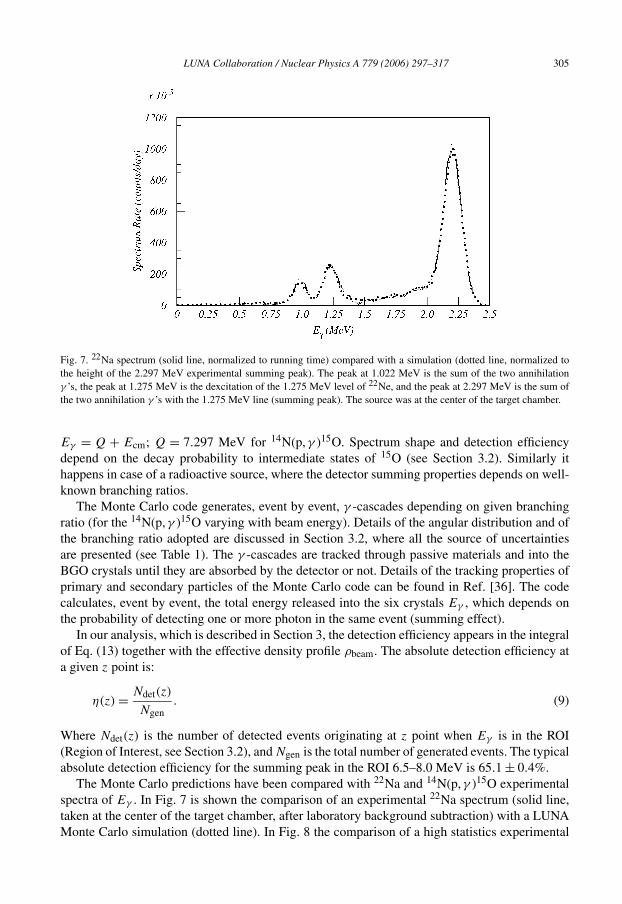
Fig. 7. 22Na spectrum (solid line, normalized to running time) compared with a simulation (dotted line, normalized tothe height of the 2.297 MeV experimental summing peak). The peak at 1.022 MeV is the sum of the two annihilationγ ’s, the peak at 1.275 MeV is the dexcitation of the 1.275 MeV level of 22Ne, and the peak at 2.297 MeV is the sum ofthe two annihilation γ ’s with the 1.275 MeV line (summing peak). The source was at the center of the target chamber.
Eγ = Q + Ecm; Q = 7.297 MeV for 14N(p, γ )15O. Spectrum shape and detection efficiencydepend on the decay probability to intermediate states of 15O (see Section 3.2). Similarly ithappens in case of a radioactive source, where the detector summing properties depends on well-known branching ratios.
The Monte Carlo code generates, event by event, γ -cascades depending on given branchingratio (for the 14N(p, γ )15O varying with beam energy). Details of the angular distribution and ofthe branching ratio adopted are discussed in Section 3.2, where all the source of uncertaintiesare presented (see Table 1). The γ -cascades are tracked through passive materials and into theBGO crystals until they are absorbed by the detector or not. Details of the tracking properties ofprimary and secondary particles of the Monte Carlo code can be found in Ref. [36]. The codecalculates, event by event, the total energy released into the six crystals Eγ , which depends onthe probability of detecting one or more photon in the same event (summing effect).
In our analysis, which is described in Section 3, the detection efficiency appears in the integralof Eq. (13) together with the effective density profile ρbeam. The absolute detection efficiency ata given z point is:
η(z) = Ndet(z)
Ngen. (9)
Where Ndet(z) is the number of detected events originating at z point when Eγ is in the ROI(Region of Interest, see Section 3.2), and Ngen is the total number of generated events. The typicalabsolute detection efficiency for the summing peak in the ROI 6.5–8.0 MeV is 65.1 ± 0.4%.
The Monte Carlo predictions have been compared with 22Na and 14N(p, γ )15O experimentalspectra of Eγ . In Fig. 7 is shown the comparison of an experimental 22Na spectrum (solid line,taken at the center of the target chamber, after laboratory background subtraction) with a LUNAMonte Carlo simulation (dotted line). In Fig. 8 the comparison of a high statistics experimental
306 LUNA Collaboration / Nuclear Physics A 779 (2006) 297–317
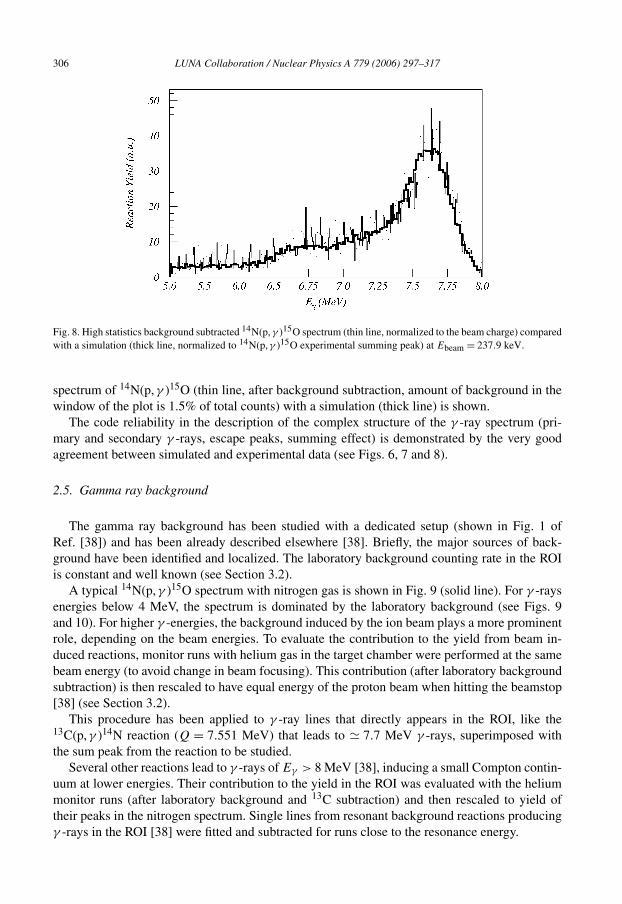
Fig. 8. High statistics background subtracted 14N(p, γ )15O spectrum (thin line, normalized to the beam charge) comparedwith a simulation (thick line, normalized to 14N(p, γ )15O experimental summing peak) at Ebeam = 237.9 keV.
spectrum of 14N(p, γ )15O (thin line, after background subtraction, amount of background in thewindow of the plot is 1.5% of total counts) with a simulation (thick line) is shown.
The code reliability in the description of the complex structure of the γ -ray spectrum (pri-mary and secondary γ -rays, escape peaks, summing effect) is demonstrated by the very goodagreement between simulated and experimental data (see Figs. 6, 7 and 8).
2.5. Gamma ray background
The gamma ray background has been studied with a dedicated setup (shown in Fig. 1 ofRef. [38]) and has been already described elsewhere [38]. Briefly, the major sources of back-ground have been identified and localized. The laboratory background counting rate in the ROIis constant and well known (see Section 3.2).
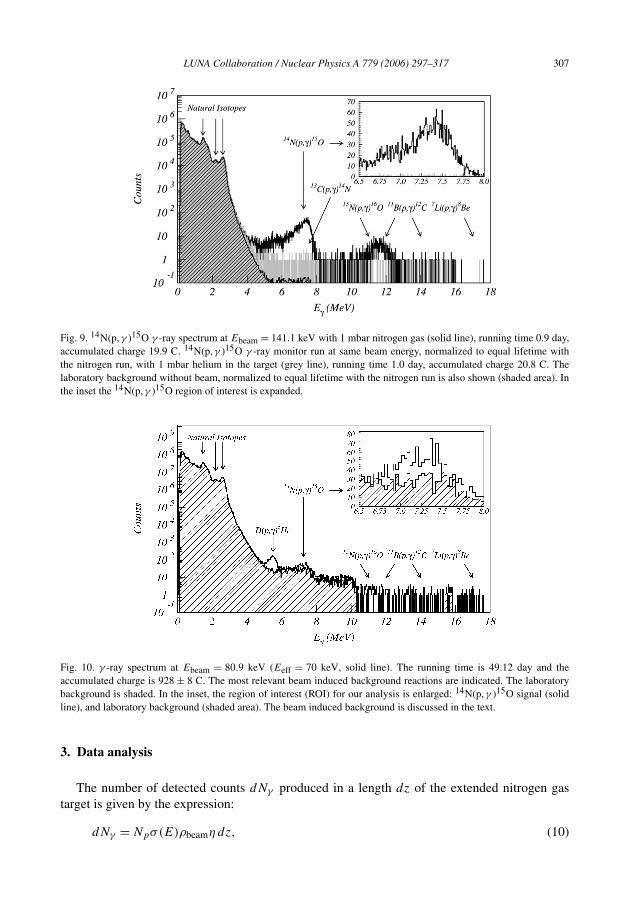
A typical 14N(p, γ )15O spectrum with nitrogen gas is shown in Fig. 9 (solid line). For γ -raysenergies below 4 MeV, the spectrum is dominated by the laboratory background (see Figs. 9and 10). For higher γ -energies, the background induced by the ion beam plays a more prominentrole, depending on the beam energies. To evaluate the contribution to the yield from beam in-duced reactions, monitor runs with helium gas in the target chamber were performed at the samebeam energy (to avoid change in beam focusing). This contribution (after laboratory backgroundsubtraction) is then rescaled to have equal energy of the proton beam when hitting the beamstop[38] (see Section 3.2).
This procedure has been applied to γ -ray lines that directly appears in the ROI, like the13C(p, γ )14N reaction (Q = 7.551 MeV) that leads to � 7.7 MeV γ -rays, superimposed withthe sum peak from the reaction to be studied.
Several other reactions lead to γ -rays of Eγ > 8 MeV [38], inducing a small Compton contin-uum at lower energies. Their contribution to the yield in the ROI was evaluated with the heliummonitor runs (after laboratory background and 13C subtraction) and then rescaled to yield oftheir peaks in the nitrogen spectrum. Single lines from resonant background reactions producingγ -rays in the ROI [38] were fitted and subtracted for runs close to the resonance energy.
LUNA Collaboration / Nuclear Physics A 779 (2006) 297–317 307
Fig. 9. 14N(p, γ )15O γ -ray spectrum at Ebeam = 141.1 keV with 1 mbar nitrogen gas (solid line), running time 0.9 day,accumulated charge 19.9 C. 14N(p, γ )15O γ -ray monitor run at same beam energy, normalized to equal lifetime withthe nitrogen run, with 1 mbar helium in the target (grey line), running time 1.0 day, accumulated charge 20.8 C. Thelaboratory background without beam, normalized to equal lifetime with the nitrogen run is also shown (shaded area). Inthe inset the 14N(p, γ )15O region of interest is expanded.
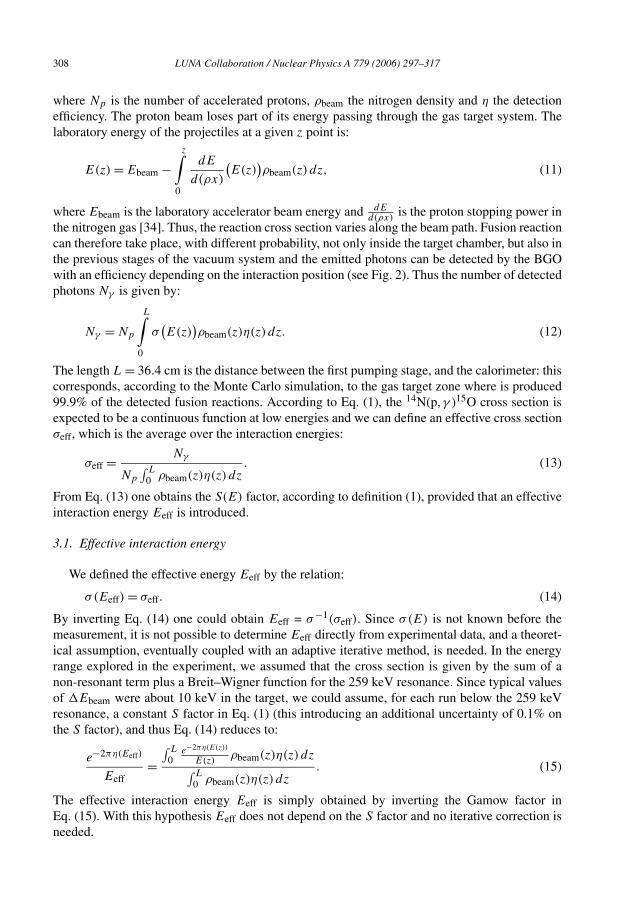
Fig. 10. γ -ray spectrum at Ebeam = 80.9 keV (Eeff = 70 keV, solid line). The running time is 49.12 day and theaccumulated charge is 928 ± 8 C. The most relevant beam induced background reactions are indicated. The laboratorybackground is shaded. In the inset, the region of interest (ROI) for our analysis is enlarged: 14N(p, γ )15O signal (solidline), and laboratory background (shaded area). The beam induced background is discussed in the text.
3. Data analysis
The number of detected counts dNγ produced in a length dz of the extended nitrogen gastarget is given by the expression:
dNγ = Npσ(E)ρbeamη dz, (10)
308 LUNA Collaboration / Nuclear Physics A 779 (2006) 297–317
where Np is the number of accelerated protons, ρbeam the nitrogen density and η the detectionefficiency. The proton beam loses part of its energy passing through the gas target system. Thelaboratory energy of the projectiles at a given z point is:
E(z) = Ebeam −z∫
0
dE
d(ρx)
(E(z)
)ρbeam(z) dz, (11)
where Ebeam is the laboratory accelerator beam energy and dEd(ρx)
is the proton stopping power inthe nitrogen gas [34]. Thus, the reaction cross section varies along the beam path. Fusion reactioncan therefore take place, with different probability, not only inside the target chamber, but also inthe previous stages of the vacuum system and the emitted photons can be detected by the BGOwith an efficiency depending on the interaction position (see Fig. 2). Thus the number of detectedphotons Nγ is given by:
Nγ = Np
L∫0
σ(E(z)
)ρbeam(z)η(z) dz. (12)
The length L = 36.4 cm is the distance between the first pumping stage, and the calorimeter: thiscorresponds, according to the Monte Carlo simulation, to the gas target zone where is produced99.9% of the detected fusion reactions. According to Eq. (1), the 14N(p, γ )15O cross section isexpected to be a continuous function at low energies and we can define an effective cross sectionσeff, which is the average over the interaction energies:
σeff = Nγ
Np
∫ L
0 ρbeam(z)η(z) dz. (13)
From Eq. (13) one obtains the S(E) factor, according to definition (1), provided that an effectiveinteraction energy Eeff is introduced.
3.1. Effective interaction energy
We defined the effective energy Eeff by the relation:
σ(Eeff) = σeff. (14)
By inverting Eq. (14) one could obtain Eeff = σ−1(σeff). Since σ(E) is not known before themeasurement, it is not possible to determine Eeff directly from experimental data, and a theoret-ical assumption, eventually coupled with an adaptive iterative method, is needed. In the energyrange explored in the experiment, we assumed that the cross section is given by the sum of anon-resonant term plus a Breit–Wigner function for the 259 keV resonance. Since typical valuesof �Ebeam were about 10 keV in the target, we could assume, for each run below the 259 keVresonance, a constant S factor in Eq. (1) (this introducing an additional uncertainty of 0.1% onthe S factor), and thus Eq. (14) reduces to:
e−2πη(Eeff)
Eeff=
∫ L
0e−2πη(E(z))
E(z)ρbeam(z)η(z) dz∫ L
0 ρbeam(z)η(z) dz. (15)
The effective interaction energy Eeff is simply obtained by inverting the Gamow factor inEq. (15). With this hypothesis Eeff does not depend on the S factor and no iterative correction isneeded.
LUNA Collaboration / Nuclear Physics A 779 (2006) 297–317 309
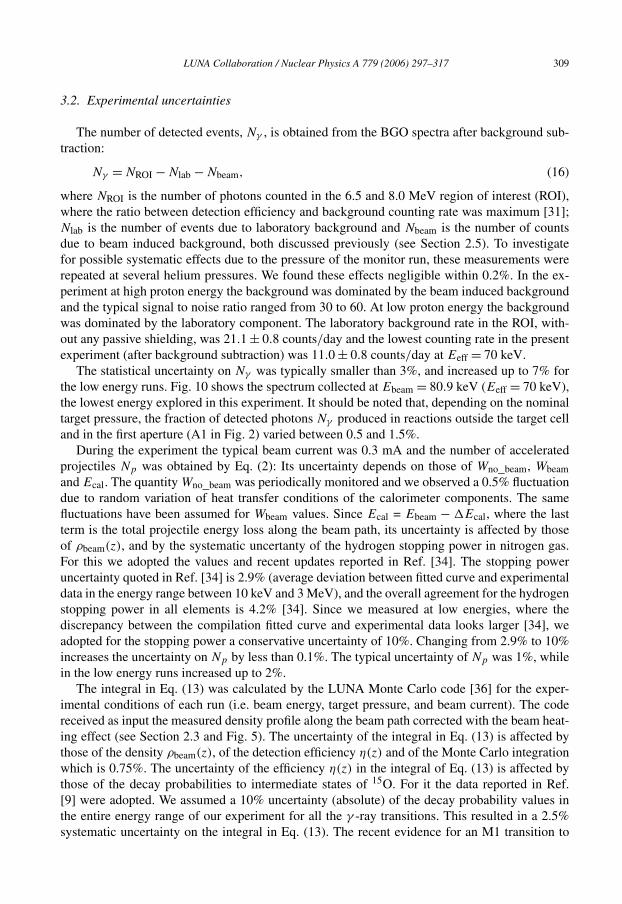
3.2. Experimental uncertainties
The number of detected events, Nγ , is obtained from the BGO spectra after background sub-traction:
Nγ = NROI − Nlab − Nbeam, (16)
where NROI is the number of photons counted in the 6.5 and 8.0 MeV region of interest (ROI),where the ratio between detection efficiency and background counting rate was maximum [31];Nlab is the number of events due to laboratory background and Nbeam is the number of countsdue to beam induced background, both discussed previously (see Section 2.5). To investigatefor possible systematic effects due to the pressure of the monitor run, these measurements wererepeated at several helium pressures. We found these effects negligible within 0.2%. In the ex-periment at high proton energy the background was dominated by the beam induced backgroundand the typical signal to noise ratio ranged from 30 to 60. At low proton energy the backgroundwas dominated by the laboratory component. The laboratory background rate in the ROI, with-out any passive shielding, was 21.1 ± 0.8 counts/day and the lowest counting rate in the presentexperiment (after background subtraction) was 11.0 ± 0.8 counts/day at Eeff = 70 keV.
The statistical uncertainty on Nγ was typically smaller than 3%, and increased up to 7% forthe low energy runs. Fig. 10 shows the spectrum collected at Ebeam = 80.9 keV (Eeff = 70 keV),the lowest energy explored in this experiment. It should be noted that, depending on the nominaltarget pressure, the fraction of detected photons Nγ produced in reactions outside the target celland in the first aperture (A1 in Fig. 2) varied between 0.5 and 1.5%.
During the experiment the typical beam current was 0.3 mA and the number of acceleratedprojectiles Np was obtained by Eq. (2): Its uncertainty depends on those of Wno_beam, Wbeamand Ecal. The quantity Wno_beam was periodically monitored and we observed a 0.5% fluctuationdue to random variation of heat transfer conditions of the calorimeter components. The samefluctuations have been assumed for Wbeam values. Since Ecal = Ebeam − �Ecal, where the lastterm is the total projectile energy loss along the beam path, its uncertainty is affected by thoseof ρbeam(z), and by the systematic uncertanty of the hydrogen stopping power in nitrogen gas.For this we adopted the values and recent updates reported in Ref. [34]. The stopping poweruncertainty quoted in Ref. [34] is 2.9% (average deviation between fitted curve and experimentaldata in the energy range between 10 keV and 3 MeV), and the overall agreement for the hydrogenstopping power in all elements is 4.2% [34]. Since we measured at low energies, where thediscrepancy between the compilation fitted curve and experimental data looks larger [34], weadopted for the stopping power a conservative uncertainty of 10%. Changing from 2.9% to 10%increases the uncertainty on Np by less than 0.1%. The typical uncertainty of Np was 1%, whilein the low energy runs increased up to 2%.
The integral in Eq. (13) was calculated by the LUNA Monte Carlo code [36] for the exper-imental conditions of each run (i.e. beam energy, target pressure, and beam current). The codereceived as input the measured density profile along the beam path corrected with the beam heat-ing effect (see Section 2.3 and Fig. 5). The uncertainty of the integral in Eq. (13) is affected bythose of the density ρbeam(z), of the detection efficiency η(z) and of the Monte Carlo integrationwhich is 0.75%. The uncertainty of the efficiency η(z) in the integral of Eq. (13) is affected bythose of the decay probabilities to intermediate states of 15O. For it the data reported in Ref.[9] were adopted. We assumed a 10% uncertainty (absolute) of the decay probability values inthe entire energy range of our experiment for all the γ -ray transitions. This resulted in a 2.5%systematic uncertainty on the integral in Eq. (13). The recent evidence for an M1 transition to
310 LUNA Collaboration / Nuclear Physics A 779 (2006) 297–317
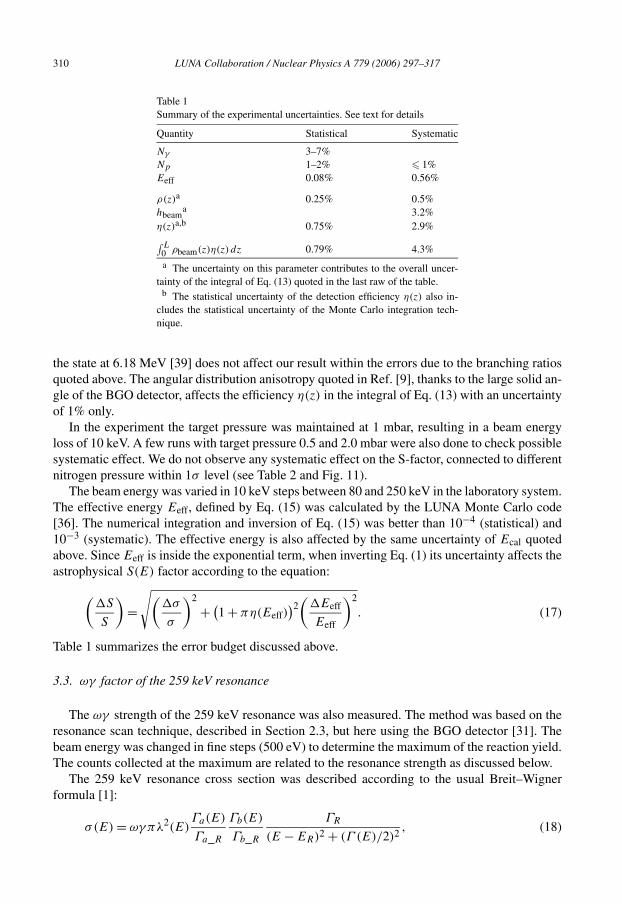
Table 1Summary of the experimental uncertainties. See text for details
Quantity Statistical Systematic
Nγ 3–7%Np 1–2% � 1%Eeff 0.08% 0.56%
ρ(z)a 0.25% 0.5%hbeam
a 3.2%η(z)a,b 0.75% 2.9%∫ L
0 ρbeam(z)η(z) dz 0.79% 4.3%
a The uncertainty on this parameter contributes to the overall uncer-tainty of the integral of Eq. (13) quoted in the last raw of the table.
b The statistical uncertainty of the detection efficiency η(z) also in-cludes the statistical uncertainty of the Monte Carlo integration tech-nique.
the state at 6.18 MeV [39] does not affect our result within the errors due to the branching ratiosquoted above. The angular distribution anisotropy quoted in Ref. [9], thanks to the large solid an-gle of the BGO detector, affects the efficiency η(z) in the integral of Eq. (13) with an uncertaintyof 1% only.
In the experiment the target pressure was maintained at 1 mbar, resulting in a beam energyloss of 10 keV. A few runs with target pressure 0.5 and 2.0 mbar were also done to check possiblesystematic effect. We do not observe any systematic effect on the S-factor, connected to differentnitrogen pressure within 1σ level (see Table 2 and Fig. 11).
The beam energy was varied in 10 keV steps between 80 and 250 keV in the laboratory system.The effective energy Eeff, defined by Eq. (15) was calculated by the LUNA Monte Carlo code[36]. The numerical integration and inversion of Eq. (15) was better than 10−4 (statistical) and10−3 (systematic). The effective energy is also affected by the same uncertainty of Ecal quotedabove. Since Eeff is inside the exponential term, when inverting Eq. (1) its uncertainty affects theastrophysical S(E) factor according to the equation:
(�S
S
)=
√(�σ
σ
)2
+ (1 + πη(Eeff)
)2(
�Eeff
Eeff
)2
. (17)
Table 1 summarizes the error budget discussed above.
3.3. ωγ factor of the 259 keV resonance
The ωγ strength of the 259 keV resonance was also measured. The method was based on theresonance scan technique, described in Section 2.3, but here using the BGO detector [31]. Thebeam energy was changed in fine steps (500 eV) to determine the maximum of the reaction yield.The counts collected at the maximum are related to the resonance strength as discussed below.
The 259 keV resonance cross section was described according to the usual Breit–Wignerformula [1]:
σ(E) = ωγπλ2(E)Γa(E) Γb(E) ΓR
2 2, (18)
Γa_R Γb_R (E − ER) + (Γ (E)/2)
LUNA Collaboration / Nuclear Physics A 779 (2006) 297–317 311
where λ is the De Broglie wavelength, ER is the resonance energy, and Γ = Γa + Γb is the totalwidth of the resonance, Γa and Γb are the partial width of the decay channel, Γa_R and Γb_R arethe partial width values at the resonance, ωγ is the strength factor defined as [1]:
ωγ = 2J + 1
(2J1 + 1)(2J2 + 1)(1 + δ12)
Γa_RΓb_R
ΓR
, (19)
where J is the resonant state spin and J1 and J2 are the spins of the projectile and target nu-clei. The energy dependence of the relative partial widths Γa(E)/Γa_R and Γb(E)/Γb_R havebeen assumed as in Ref. [1]. For the partial width of the entrance channel Γa(E) we used theexpression [1]:
Γa,l(E) =(
2E
μ
)1/2 2h̄
Rn
Pl(E,Rn)θ2l . (20)
Where μ is the reduced mass (in amu units), Rn is the nuclear radius (in fm units), θ2l is the
dimensionless reduced width, l is the orbital angular momentum quantum number, and Pl(E,Rn)
is the penetrability. At sub-Coulomb energies (E � EC ), the penetration factor Pl(E,Rn) isrelated to the Gamow factor Pl=0 = exp(−2πη(E)) by the approximated expression [1]:
Pl(E,Rn)
P0(E,Rn)= e
−2l(l+1)( h̄2
2μZ1Z2e2Rn
)1/2
= e−7.61 l(l+1)
(Z1Z2Rn)1/2. (21)
Combining the Eqs. (20) and (21) and assuming s wave (l = 0), the energy dependence of therelative partial widths Γa(E)/Γa_R becomes:
Γa(E)
Γa_R
=(
E
ER
)1/2e−2πη(E)
e−2πη(ER). (22)
Note that for a �E of 10 keV the effect of the energy dependence of Γb(E)/Γb_R is negligible,while neglecting the energy dependence of Γa(E)/Γa_R (Eq. (22)) has an effect of 0.9% on thedetermination of the ωγ factor. We included both the energy dependence of the relative partialwidth in our determination of the ωγ strength.
Inserting Eq. (18) in Eq. (12) and solving for the ωγ factor one obtains:
ωγ = Nγ
Np
∫ L
0 πλ2(E(z))Γa(E(z))
Γa_R
Γb(E(z))Γb_R
ΓR
(E(z)−ER)2+(Γ (E(z))/2)2 ρbeam(z)η(z) dz. (23)
Due to the very high counting rate, the statistical uncertainty of Nγ is negligible. The uncertaintyof Np is about 1%, while the accuracy of ρbeam(z), and η(z) have been discussed above. The in-tegral in Eq. (23) has 2% statistical uncertainty due to the Monte Carlo integration. The stoppingpower uncertainty quoted above affects the uncertainty of the ωγ strength, through Eq. (11), for1.6% (included in the values shown in Table 3). The ωγ factor of the 259 keV resonance wasmeasured for three nitrogen pressures (0.5, 1.0, and 2.0 mbar) and the results are discussed in thenext section.
4. Results
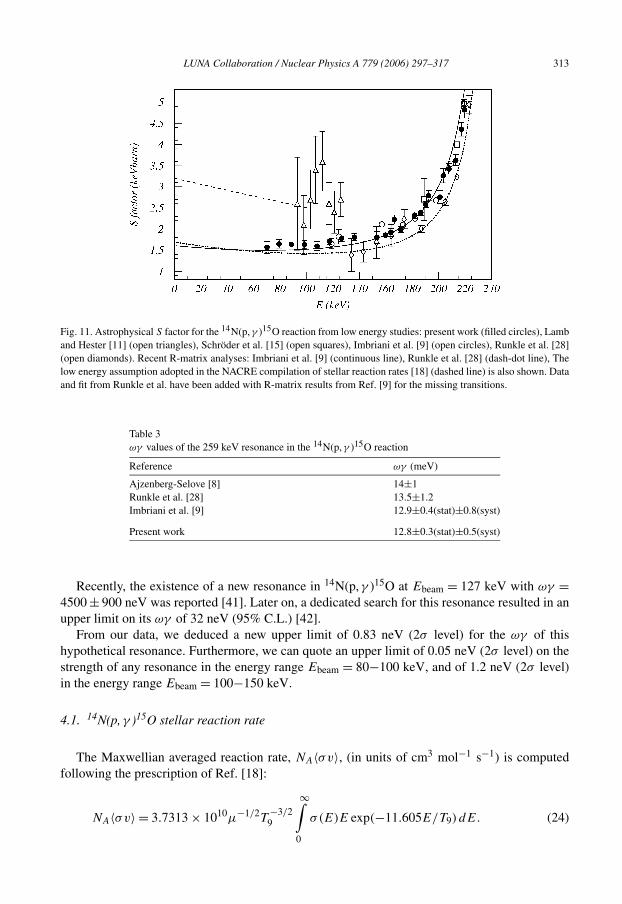
Table 2 and Fig. 11 summarize the results obtained in the experiment. In Fig. 11, astrophysicalS factor values from the present study (filled circles) are compared with previous results: Our dataand that from Lamb and Hester [11] (open triangles) have been corrected for electron screening
312 LUNA Collaboration / Nuclear Physics A 779 (2006) 297–317
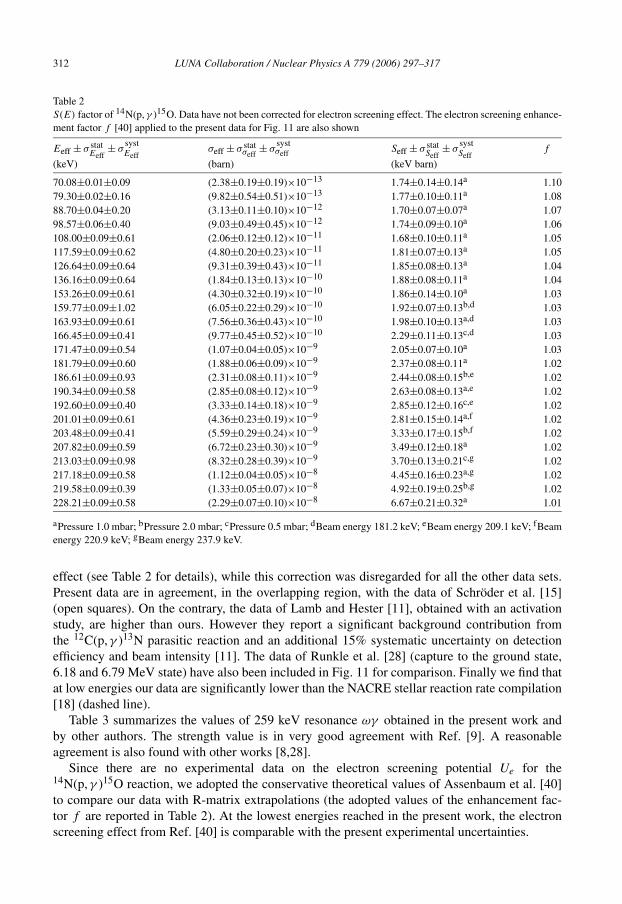
Table 2S(E) factor of 14N(p, γ )15O. Data have not been corrected for electron screening effect. The electron screening enhance-ment factor f [40] applied to the present data for Fig. 11 are also shown
Eeff ± σ statEeff
± σsystEeff
σeff ± σ statσeff
± σsystσeff Seff ± σ stat
Seff± σ
systSeff
f
(keV) (barn) (keV barn)
70.08±0.01±0.09 (2.38±0.19±0.19)×10−13 1.74±0.14±0.14a 1.1079.30±0.02±0.16 (9.82±0.54±0.51)×10−13 1.77±0.10±0.11a 1.0888.70±0.04±0.20 (3.13±0.11±0.10)×10−12 1.70±0.07±0.07a 1.0798.57±0.06±0.40 (9.03±0.49±0.45)×10−12 1.74±0.09±0.10a 1.06108.00±0.09±0.61 (2.06±0.12±0.12)×10−11 1.68±0.10±0.11a 1.05117.59±0.09±0.62 (4.80±0.20±0.23)×10−11 1.81±0.07±0.13a 1.05126.64±0.09±0.64 (9.31±0.39±0.43)×10−11 1.85±0.08±0.13a 1.04136.16±0.09±0.64 (1.84±0.13±0.13)×10−10 1.88±0.08±0.11a 1.04153.26±0.09±0.61 (4.30±0.32±0.19)×10−10 1.86±0.14±0.10a 1.03159.77±0.09±1.02 (6.05±0.22±0.29)×10−10 1.92±0.07±0.13b,d 1.03163.93±0.09±0.61 (7.56±0.36±0.43)×10−10 1.98±0.10±0.13a,d 1.03166.45±0.09±0.41 (9.77±0.45±0.52)×10−10 2.29±0.11±0.13c,d 1.03171.47±0.09±0.54 (1.07±0.04±0.05)×10−9 2.05±0.07±0.10a 1.03181.79±0.09±0.60 (1.88±0.06±0.09)×10−9 2.37±0.08±0.11a 1.02186.61±0.09±0.93 (2.31±0.08±0.11)×10−9 2.44±0.08±0.15b,e 1.02190.34±0.09±0.58 (2.85±0.08±0.12)×10−9 2.63±0.08±0.13a,e 1.02192.60±0.09±0.40 (3.33±0.14±0.18)×10−9 2.85±0.12±0.16c,e 1.02201.01±0.09±0.61 (4.36±0.23±0.19)×10−9 2.81±0.15±0.14a,f 1.02203.48±0.09±0.41 (5.59±0.29±0.24)×10−9 3.33±0.17±0.15b,f 1.02207.82±0.09±0.59 (6.72±0.23±0.30)×10−9 3.49±0.12±0.18a 1.02213.03±0.09±0.98 (8.32±0.28±0.39)×10−9 3.70±0.13±0.21c,g 1.02217.18±0.09±0.58 (1.12±0.04±0.05)×10−8 4.45±0.16±0.23a,g 1.02219.58±0.09±0.39 (1.33±0.05±0.07)×10−8 4.92±0.19±0.25b,g 1.02228.21±0.09±0.58 (2.29±0.07±0.10)×10−8 6.67±0.21±0.32a 1.01
aPressure 1.0 mbar; bPressure 2.0 mbar; cPressure 0.5 mbar; dBeam energy 181.2 keV; eBeam energy 209.1 keV; fBeamenergy 220.9 keV; gBeam energy 237.9 keV.
effect (see Table 2 for details), while this correction was disregarded for all the other data sets.Present data are in agreement, in the overlapping region, with the data of Schröder et al. [15](open squares). On the contrary, the data of Lamb and Hester [11], obtained with an activationstudy, are higher than ours. However they report a significant background contribution fromthe 12C(p, γ )13N parasitic reaction and an additional 15% systematic uncertainty on detectionefficiency and beam intensity [11]. The data of Runkle et al. [28] (capture to the ground state,6.18 and 6.79 MeV state) have also been included in Fig. 11 for comparison. Finally we find thatat low energies our data are significantly lower than the NACRE stellar reaction rate compilation[18] (dashed line).
Table 3 summarizes the values of 259 keV resonance ωγ obtained in the present work andby other authors. The strength value is in very good agreement with Ref. [9]. A reasonableagreement is also found with other works [8,28].
Since there are no experimental data on the electron screening potential Ue for the14N(p, γ )15O reaction, we adopted the conservative theoretical values of Assenbaum et al. [40]to compare our data with R-matrix extrapolations (the adopted values of the enhancement fac-tor f are reported in Table 2). At the lowest energies reached in the present work, the electronscreening effect from Ref. [40] is comparable with the present experimental uncertainties.
LUNA Collaboration / Nuclear Physics A 779 (2006) 297–317 313
Fig. 11. Astrophysical S factor for the 14N(p, γ )15O reaction from low energy studies: present work (filled circles), Lamband Hester [11] (open triangles), Schröder et al. [15] (open squares), Imbriani et al. [9] (open circles), Runkle et al. [28](open diamonds). Recent R-matrix analyses: Imbriani et al. [9] (continuous line), Runkle et al. [28] (dash-dot line), Thelow energy assumption adopted in the NACRE compilation of stellar reaction rates [18] (dashed line) is also shown. Dataand fit from Runkle et al. have been added with R-matrix results from Ref. [9] for the missing transitions.
Table 3ωγ values of the 259 keV resonance in the 14N(p, γ )15O reaction
Reference ωγ (meV)
Ajzenberg-Selove [8] 14±1Runkle et al. [28] 13.5±1.2Imbriani et al. [9] 12.9±0.4(stat)±0.8(syst)
Present work 12.8±0.3(stat)±0.5(syst)
Recently, the existence of a new resonance in 14N(p, γ )15O at Ebeam = 127 keV with ωγ =4500 ± 900 neV was reported [41]. Later on, a dedicated search for this resonance resulted in anupper limit on its ωγ of 32 neV (95% C.L.) [42].
From our data, we deduced a new upper limit of 0.83 neV (2σ level) for the ωγ of thishypothetical resonance. Furthermore, we can quote an upper limit of 0.05 neV (2σ level) on thestrength of any resonance in the energy range Ebeam = 80−100 keV, and of 1.2 neV (2σ level)in the energy range Ebeam = 100−150 keV.
4.1. 14N(p, γ )15O stellar reaction rate
The Maxwellian averaged reaction rate, NA〈σv〉, (in units of cm3 mol−1 s−1) is computedfollowing the prescription of Ref. [18]:
NA〈σv〉 = 3.7313 × 10¹⁰μ−1/2T−3/29
∞∫σ(E)E exp(−11.605E/T9) dE. (24)
0
314 LUNA Collaboration / Nuclear Physics A 779 (2006) 297–317
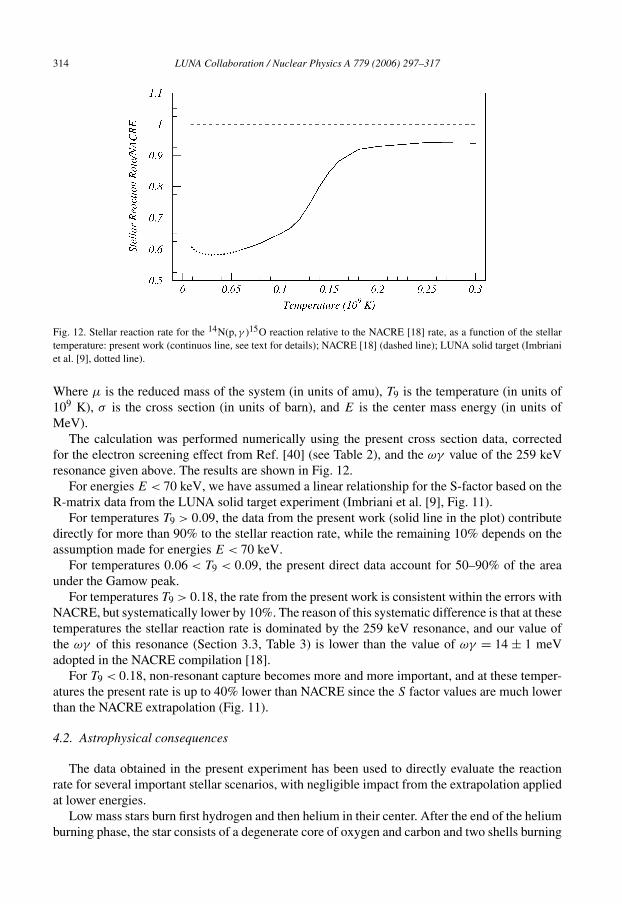
Fig. 12. Stellar reaction rate for the 14N(p, γ )15O reaction relative to the NACRE [18] rate, as a function of the stellartemperature: present work (continuos line, see text for details); NACRE [18] (dashed line); LUNA solid target (Imbrianiet al. [9], dotted line).
Where μ is the reduced mass of the system (in units of amu), T9 is the temperature (in units of109 K), σ is the cross section (in units of barn), and E is the center mass energy (in units ofMeV).
The calculation was performed numerically using the present cross section data, correctedfor the electron screening effect from Ref. [40] (see Table 2), and the ωγ value of the 259 keVresonance given above. The results are shown in Fig. 12.
For energies E < 70 keV, we have assumed a linear relationship for the S-factor based on theR-matrix data from the LUNA solid target experiment (Imbriani et al. [9], Fig. 11).
For temperatures T9 > 0.09, the data from the present work (solid line in the plot) contributedirectly for more than 90% to the stellar reaction rate, while the remaining 10% depends on theassumption made for energies E < 70 keV.
For temperatures 0.06 < T9 < 0.09, the present direct data account for 50–90% of the areaunder the Gamow peak.
For temperatures T9 > 0.18, the rate from the present work is consistent within the errors withNACRE, but systematically lower by 10%. The reason of this systematic difference is that at thesetemperatures the stellar reaction rate is dominated by the 259 keV resonance, and our value ofthe ωγ of this resonance (Section 3.3, Table 3) is lower than the value of ωγ = 14 ± 1 meVadopted in the NACRE compilation [18].
For T9 < 0.18, non-resonant capture becomes more and more important, and at these temper-atures the present rate is up to 40% lower than NACRE since the S factor values are much lowerthan the NACRE extrapolation (Fig. 11).
4.2. Astrophysical consequences
The data obtained in the present experiment has been used to directly evaluate the reactionrate for several important stellar scenarios, with negligible impact from the extrapolation appliedat lower energies.
Low mass stars burn first hydrogen and then helium in their center. After the end of the heliumburning phase, the star consists of a degenerate core of oxygen and carbon and two shells burning
LUNA Collaboration / Nuclear Physics A 779 (2006) 297–317 315
hydrogen and helium, respectively. This phase of stellar evolution is called the Asymptotic GiantBranch (AGB) [43]. It is characterized by flashes of the helium burning shell that spawn convec-tive mixing in a process called dredge-up. Such a dredge-up transports the products of nuclearburning from inner regions of the star to its surface, where they are in principle accessible toastronomical observations.
The temperature in the hydrogen burning shell of an AGB star is of the order of T9 =0.05–0.08 for the example of a 2M star (M: mass of our Sun) with metallicity Z = 0.01.It has been shown [44] that an arbitrary 25% reduction of the 14N(p, γ )15O rate with respect tothe NACRE [18] rate leads to twice as efficient dredge-up of carbon to the surface of the star,because the rate of energy generation in the hydrogen burning shell becomes even lower thanbefore, enhancing the disequilibrium between hydrogen and helium burning shell. The CNO ratesuggested by the present study is more than 25% below the NACRE [18] rate. Still, the changein the 14N(p, γ )15O rate might lift a disagreement between model and observation for so-calledcarbon stars [45]: For low (i.e. 2M) mass stars, models do not reproduce a sufficiently highcarbon content in the atmosphere.
Recently, a simulation for a 5M, Z = 0.02 AGB star [46] found stronger thermal flashes fora reduced CNO rate, consistent with the finding of Ref. [44] for a 2M, Z = 0.01 AGB star.
For a zero metallicity (population III) star of 1M, after a sufficient amount of carbon hasbeen created in the triple-α reaction, the CNO cycle is ignited in the so-called CN flash. ThisCN flash takes place at T9 ≈ 0.065 and leads to a brief loop of the trajectory of the star in theHertzsprung–Russell diagram [47]. With a CNO rate that is 40% lower than the NACRE [18]rate, this loop disappears [46]. Also, the first core helium flash in such a star was found to be lessluminous than in the reference case, albeit with a higher core mass, as a result of a lower CNOrate [46].
Temperatures of T9 ≈ 0.1 correspond to CNO burning in heavy (20M) population IIIstars [48]. Explosive burning in novae [49] takes place at even higher temperatures, typicallyT9 ≈ 0.2. The 15N/14N isotopic ratio in nova ashes depends sensitively on the 14N(p, γ )15Orate [50]; the more precise rate that can be calculated from the cross sections obtained in thepresent study will reduce the uncertainty of the isotopic ratio.
5. Conclusion
The total cross section of the 14N(p, γ )15O reaction, the bottleneck of the CNO cycle, hasbeen measured down to E = 70keV, well within the energy window where stellar CNO hydro-gen burning takes place. The strength of the ER = 259 keV resonance has been determined withimproved precision, and stringent upper limits have been put on possible narrow resonances be-tween Ebeam = 80–150 keV. The reaction rate for several scenarios of hydrogen burning, bothstable and explosive, has been calculated directly from the present cross section data, with neg-ligible impact from the assumptions made for the cross section at lower energies. The impact ofthe present rate on nucleosynthesis in AGB stars of different masses (M = 1–20M), in partic-ular the carbon content of the atmosphere and the luminosity of the core helium flash, and onexplosive burning in novae (15N/14N isotopic ratio) has been discussed.
Acknowledgements
The authors are grate to the INFN technical staff at Gran Sasso and in Genova, in particularP. Cocconi and F. Parodi, for their support during the experiment. This work was supported by
316 LUNA Collaboration / Nuclear Physics A 779 (2006) 297–317
INFN and in part by: TARI RII-CT-2004-506222, OTKA T 42733 and T 49245, and BMBF(05CL1PC1-1).
References
[1] C. Rolfs, W.S. Rodney, Cauldrons in the Cosmos, University of Chicago Press, 1988.[2] S.P. Ahlen, et al., Phys. Lett. B 249 (1990) 149.[3] P. Belli, et al., Nuovo Cimento A 101 (1989) 959.[4] U. Greife, et al., Nucl. Instrum. Methods Phys. Res. A 350 (1994) 327.[5] A. Formicola, et al., Nucl. Instrum. Methods Phys. Res. A 507 (2003) 609.[6] R. Bonetti, et al., Phys. Rev. Lett. 82 (1999) 5205.[7] C. Casella, et al., Nucl. Phys. A 706 (2002) 203.[8] F. Ajzenberg-Selove, Nucl. Phys. A 523 (1991) 1.[9] G. Imbriani, et al., Eur. Phys. J. A 25 (2005) 455.
[10] D.B. Duncan, J.E. Perry, Phys. Rev. 82 (1951) 1304.[11] W. Lamb, R. Hester, Phys. Rev. 108 (1957) 1304.[12] R.E. Pixley, The reaction cross section of nitrogen 14 for protons between 220 keV and 600 keV, PhD Thesis,
California Institute of Technology, August 1957.[13] B. Povh, D.F. Hebbard, Phys. Rev. 115 (1959) 608.[14] D.F. Hebbard, G.M. Bailey, Nucl. Phys. 49 (1963) 606.[15] U. Schröder, et al., Nucl. Phys. A 467 (1987) 240.[16] G. Caughlan, W. Fowler, At. Data Nucl. Data Tables 40 (1988) 283.[17] E. Adelberger, et al., Rev. Mod. Phys. 70 (1998) 1265.[18] C. Angulo, et al., Nucl. Phys. A 656 (1999) 3.[19] C. Angulo, P. Descouvemont, Nucl. Phys. A 690 (2001) 755.[20] P.F. Bertone, et al., Phys. Rev. Lett. 87 (2001) 152501.[21] P.F. Bertone, et al., Phys. Rev. C 66 (2002) 055804.[22] A. Mukhamedzhanov, et al., Phys. Rev. C 67 (2003) 065804.[23] K. Yamada, et al., Phys. Lett. B 579 (2004) 265.[24] A. Formicola, et al., Phys. Lett. B 591 (2004) 61.[25] J.N. Bahcall, M.H. Pinsonneault, Phys. Rev. Lett. 92 (2004) 121301.[26] S. Degl’Innocenti, et al., Phys. Lett. B 590 (2004) 13.[27] G. Imbriani, et al., Astron. Astrophys. 420 (2004) 625.[28] R.C. Runkle, et al., Phys. Rev. Lett. 94 (2005) 082503.[29] A. Lemut, et al., Phys. Lett. B 634 (2006) 483.[30] D. Bemmerer, Experimental study of the 14N(p, γ )15O reaction at energies far below the Coulomb barrier, PhD
Thesis, Technische Universität Berlin, August 2004.[31] A. Lemut, Misura della sezione d’urto della reazione 14N(p, γ )15O ad energie di interesse astrofisico, PhD. Thesis,
Università degli Studi di Genova, April 2005.[32] C. Casella, et al., Nucl. Instrum. Methods Phys. Res. A 489 (2002) 160.[33] S.K. Allison, Rev. Mod. Phys. 30 (1958) 1137.[34] H.H. Andersen, J.F. Ziegler, Stopping Powers and Ranges in All Elements, Pergamon, 1977 (updated data are
available online at http://www.srim.org).[35] J. Görres, et al., Nucl. Instrum. Methods 177 (1980) 295.[36] C. Arpesella, et al., Nucl. Instrum. Methods Phys. Res. A 360 (1995) 607.[37] H. Costantini, et al., Phys. Lett. B 482 (2000) 43.[38] D. Bemmerer, et al., Eur. Phys. J. A 24 (2005) 313.[39] S.O. Nelson, et al., Phys. Rev. C 68 (2003) 065804.[40] H. Assenbaum, et al., Z. Phys. A 327 (1987) 461.[41] S.O. Nelson, et al., Bull. Am. Phys. Soc. 46 (2001) 64.[42] R.C. Runkle, et al., Phys. Rev. C 66 (2002) 022801.[43] I. Iben, A. Renzini, Annu. Rev. Astron. Astrophys. 21 (1983) 271.[44] F. Herwig, S.M. Austin, Astrophys. J. 612 (2004) L73.[45] I. Iben, Astrophys. J. 246 (1981) 278.[46] A. Weiss, et al., Astron. Astrophys. 441 (2005) 1129.
LUNA Collaboration / Nuclear Physics A 779 (2006) 297–317 317
[47] A. Weiss, et al., Astrophys. J. 533 (2000) 413.[48] L. Siess, M. Livio, J. Lattanzio, Astrophys. J. 570 (2002) 329.[49] J. Jose, M. Hernanz, Astrophys. J. 494 (1998) 680.[50] C. Iliadis, et al., Astrophys. J. Suppl. Ser. 142 (2002) 105.