Strictosidine synthase, an indispensable enzyme involved ...
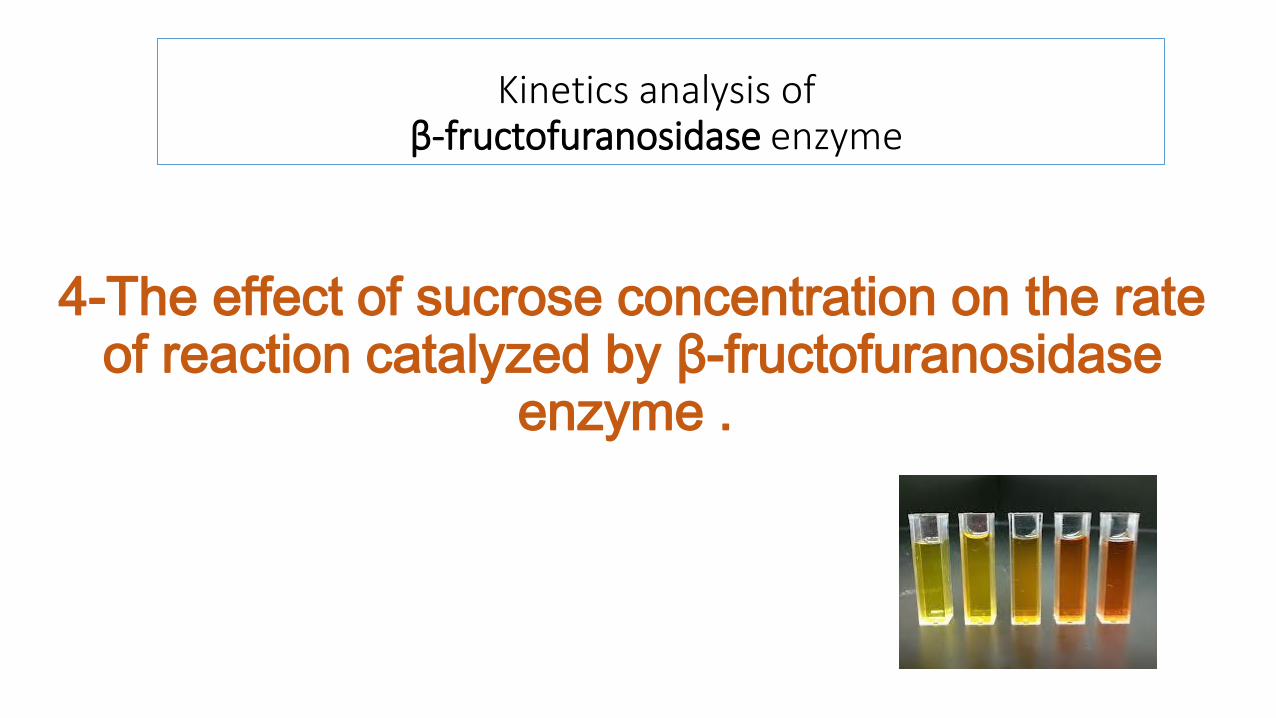
Kinetics analysis of β-fructofuranosidase enzyme
4-The effect of sucrose concentration on the rate
of reaction catalyzed by β-fructofuranosidase enzyme .
• One of the important parameter affecting the rate of a reaction catalyzed by an enzyme is the substrate concentration, [S].
• During enzyme substrate reaction, the initial velocity V0 gradually increases with increasing the concentration of the substrate. Finally a point is reached, beyond which the increase in V0 will not depend on the [S].
• When a graph plotted with substrate concentration on the X axis and corresponding velocity on Y axis. It can be observed from the graph that as the concentration of the substrate increases, there is a corresponding increase in the V0.
• However beyond a particular substrate concentration, the velocity remains constant without any further increase. This maximum velocity of an enzyme catalyzed reaction under substrate saturation is called the Vmax , Maximum velocity.
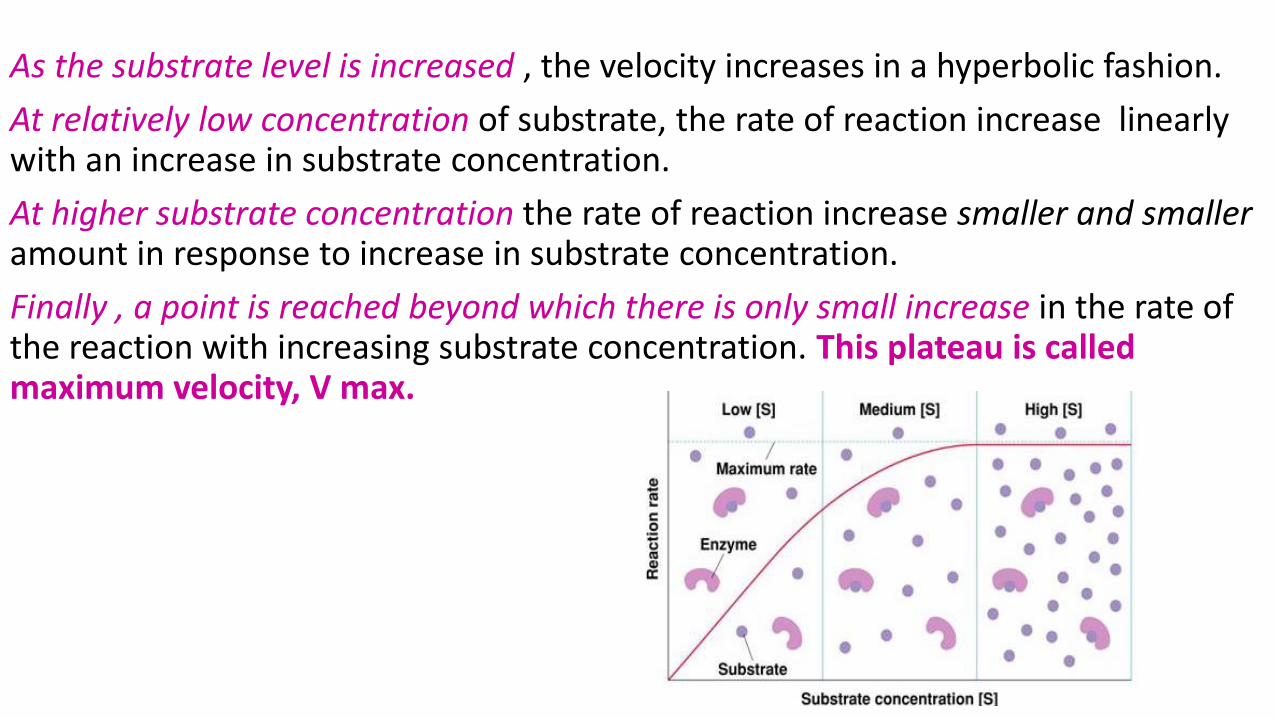
As the substrate level is increased , the velocity increases in a hyperbolic fashion.
At relatively low concentration of substrate, the rate of reaction increase linearly with an increase in substrate concentration.
At higher substrate concentration the rate of reaction increase smaller and smaller amount in response to increase in substrate concentration.
Finally , a point is reached beyond which there is only small increase in the rate of the reaction with increasing substrate concentration. This plateau is called maximum velocity, V max.
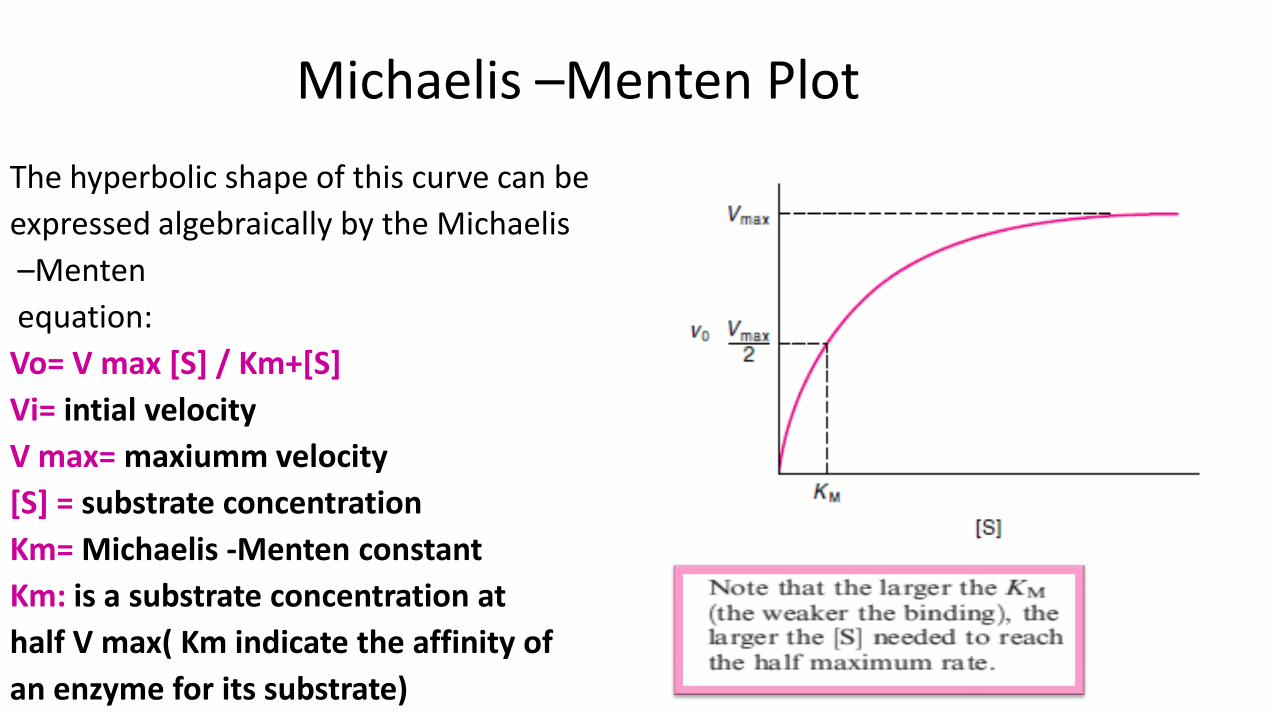
The hyperbolic shape of this curve can be
expressed algebraically by the Michaelis
–Menten
equation:
Vo= V max [S] / Km+[S]
Vi= intial velocity
V max= maxiumm velocity
[S] = substrate concentration
Km= Michaelis -Menten constant
Km: is a substrate concentration at
half V max( Km indicate the affinity of
an enzyme for its substrate)
Michaelis –Menten Plot
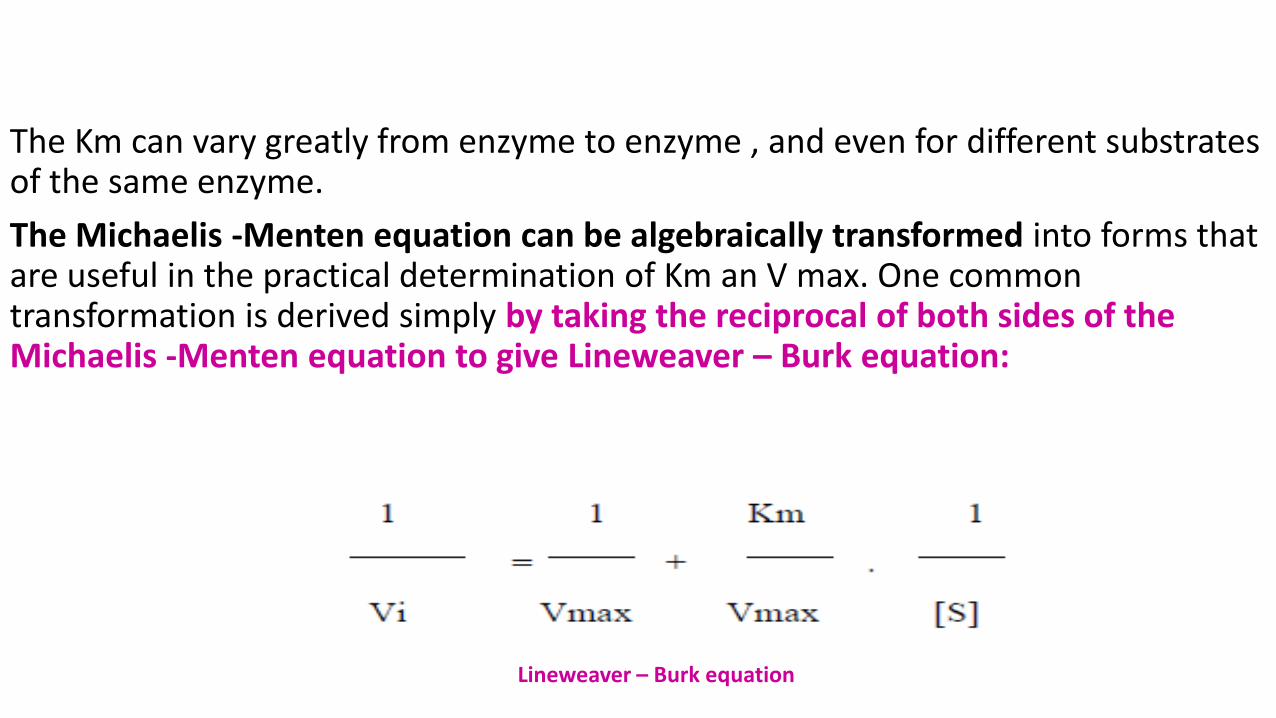
The Km can vary greatly from enzyme to enzyme , and even for different substrates of the same enzyme.
The Michaelis -Menten equation can be algebraically transformed into forms that are useful in the practical determination of Km an V max. One common transformation is derived simply by taking the reciprocal of both sides of the Michaelis -Menten equation to give Lineweaver – Burk equation:
Lineweaver – Burk equation
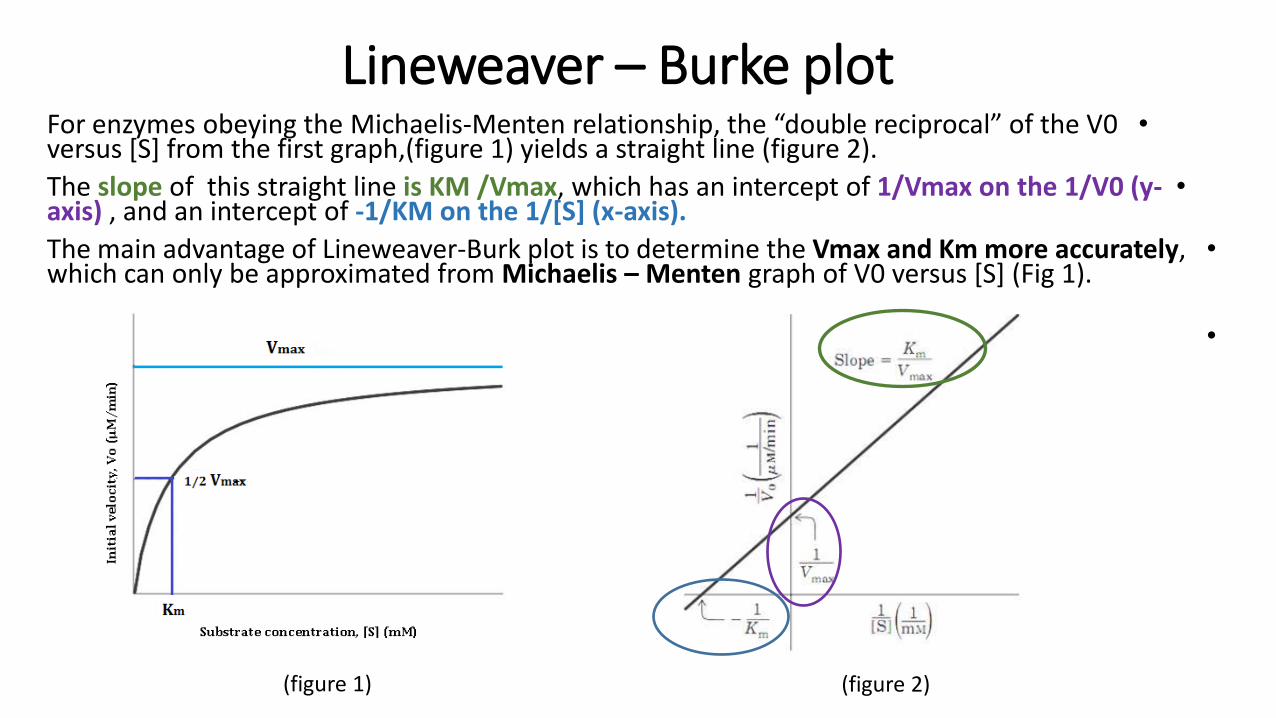
Lineweaver – Burke plot •For enzymes obeying the Michaelis-Menten relationship, the “double reciprocal” of the V0
versus [S] from the first graph,(figure 1) yields a straight line (figure 2).
•The slope of this straight line is KM /Vmax, which has an intercept of 1/Vmax on the 1/V0 (y-axis) , and an intercept of -1/KM on the 1/[S] (x-axis).
•The main advantage of Lineweaver-Burk plot is to determine the Vmax and Km more accurately, which can only be approximated from Michaelis – Menten graph of V0 versus [S] (Fig 1).
•
(figure 1) (figure 2)
Objectives:
• 1)To establish the relationship between substrate concentration and the rate of an enzyme catalyzed reaction.
• 2) To determine the Km and V max of the enzyme for a particular substrate.
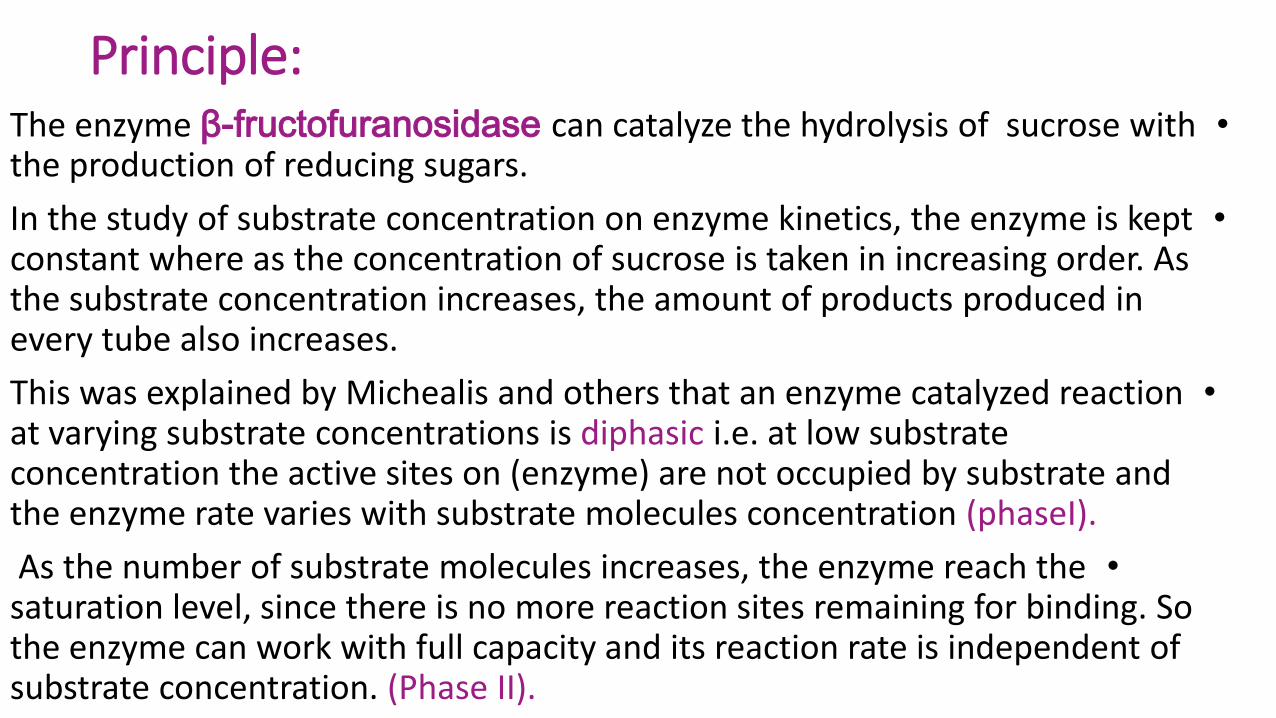
Principle: •The enzyme β-fructofuranosidase can catalyze the hydrolysis of sucrose with
the production of reducing sugars.
•In the study of substrate concentration on enzyme kinetics, the enzyme is kept constant where as the concentration of sucrose is taken in increasing order. As the substrate concentration increases, the amount of products produced in every tube also increases.
•This was explained by Michealis and others that an enzyme catalyzed reaction at varying substrate concentrations is diphasic i.e. at low substrate concentration the active sites on (enzyme) are not occupied by substrate and the enzyme rate varies with substrate molecules concentration (phaseI).
• As the number of substrate molecules increases, the enzyme reach the saturation level, since there is no more reaction sites remaining for binding. So the enzyme can work with full capacity and its reaction rate is independent of substrate concentration. (Phase II).
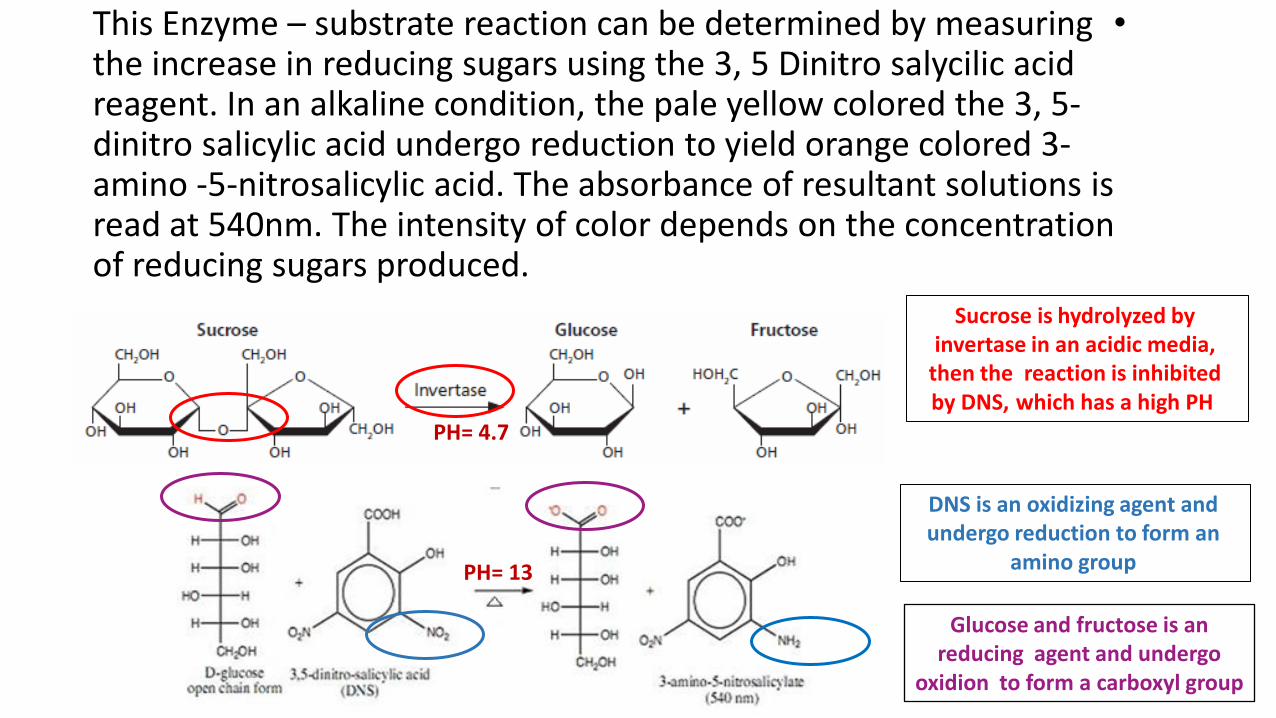
•This Enzyme – substrate reaction can be determined by measuring the increase in reducing sugars using the 3, 5 Dinitro salycilic acid reagent. In an alkaline condition, the pale yellow colored the 3, 5- dinitro salicylic acid undergo reduction to yield orange colored 3- amino -5-nitrosalicylic acid. The absorbance of resultant solutions is read at 540nm. The intensity of color depends on the concentration of reducing sugars produced.
PH= 4.7
PH= 13
DNS is an oxidizing agent and undergo reduction to form an
amino group
Glucose and fructose is an reducing agent and undergo
oxidion to form a carboxyl group
Sucrose is hydrolyzed by invertase in an acidic media,
then the reaction is inhibited which has a high PH by DNS,
Material
Solutions :
• 0.05M Sodium Acetate buffer , pH 4.7 .
• 0.18 M Sucrose
• Reducing sugar (0.005M glucose + 0.005M fructose)
• ß-Fructofuranosidase enzyme extract from yeast.
• DNS (dinitrosalicylicacid )Reagent .
• Sodium Bicarbonate .
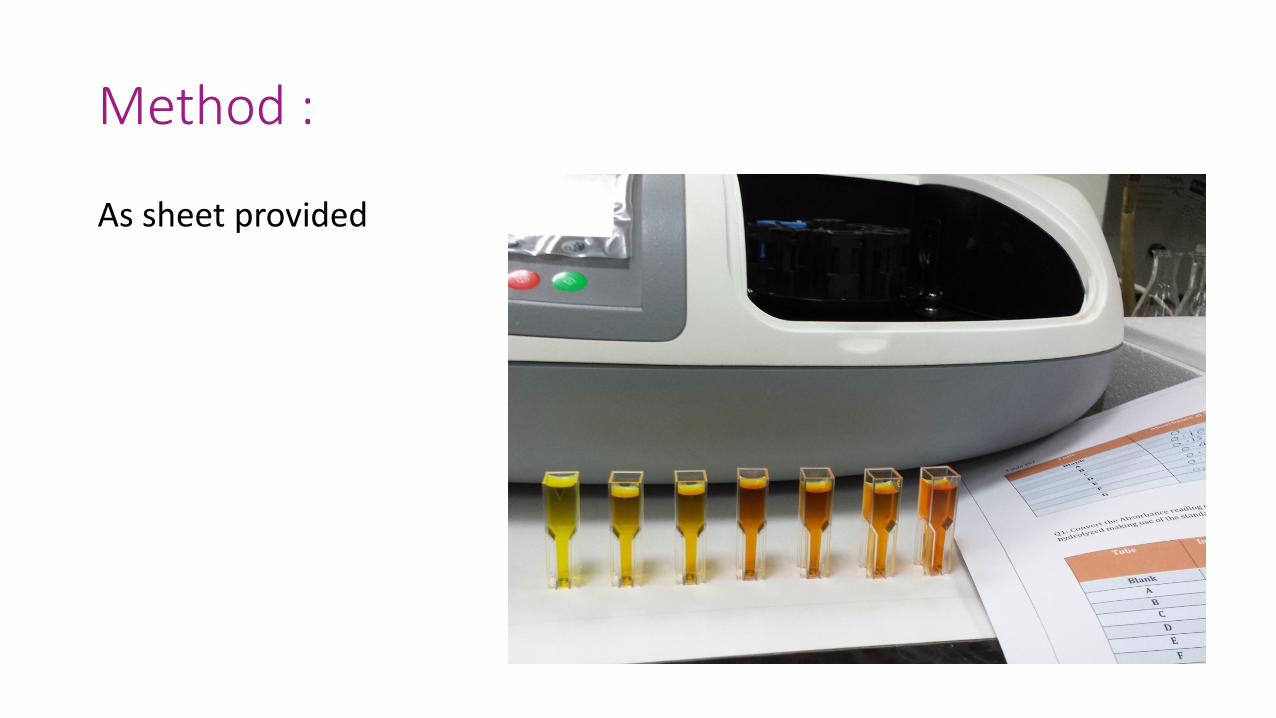
Method :
As sheet provided
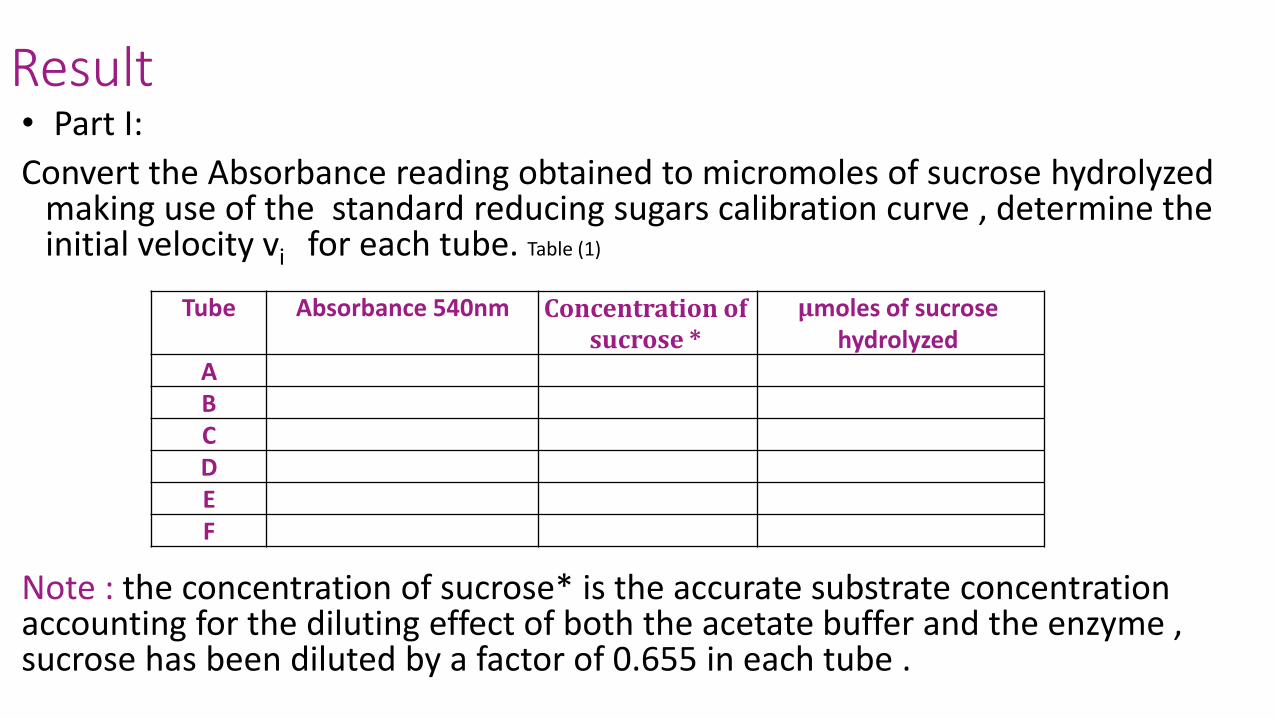
Result • Part I:
Convert the Absorbance reading obtained to micromoles of sucrose hydrolyzed making use of the standard reducing sugars calibration curve , determine the initial velocity vi for each tube. Table (1)
Note : the concentration of sucrose* is the accurate substrate concentration accounting for the diluting effect of both the acetate buffer and the enzyme , sucrose has been diluted by a factor of 0.655 in each tube .
Tube Absorbance 540nm Concentration of sucrose *
µmoles of sucrose hydrolyzed
A B C D E F
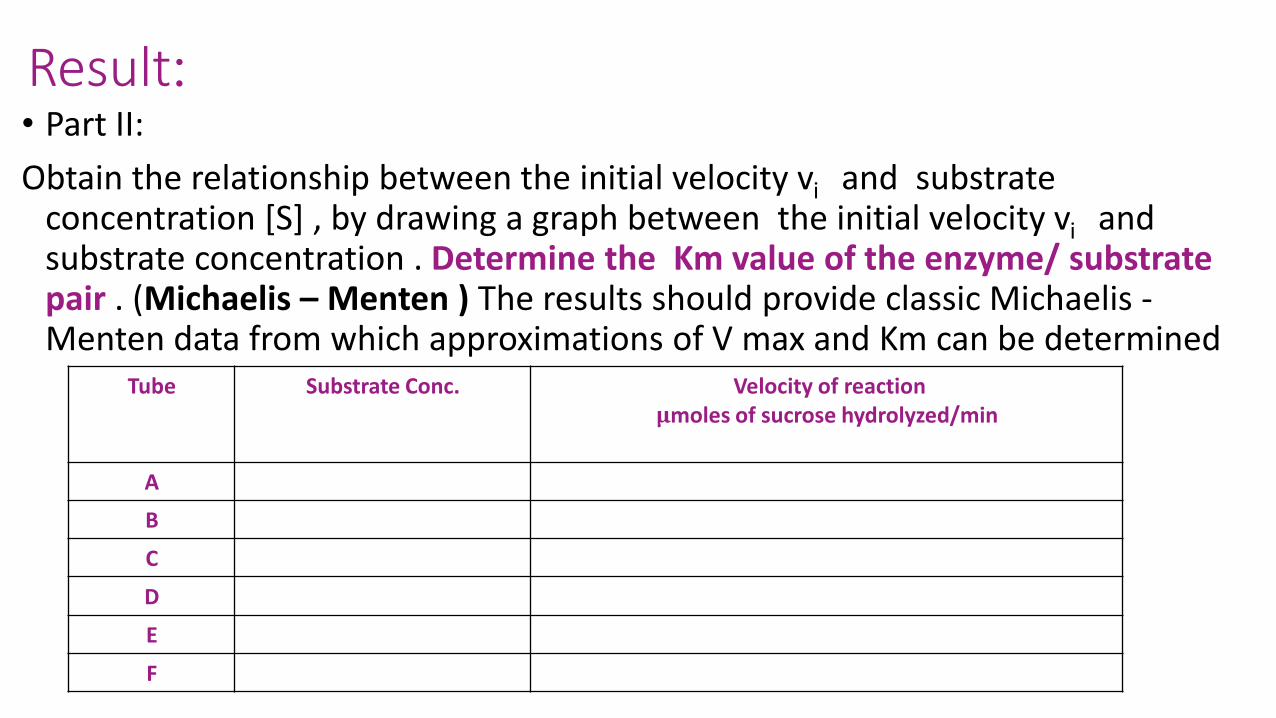
:Result • Part II:
Obtain the relationship between the initial velocity vi and substrate concentration [S] , by drawing a graph between the initial velocity vi and substrate concentration . Determine the Km value of the enzyme/ substrate pair . (Michaelis – Menten ) The results should provide classic Michaelis -Menten data from which approximations of V max and Km can be determined
Tube Substrate Conc. Velocity of reaction µmoles of sucrose hydrolyzed/min
A
B
C
D
E
F
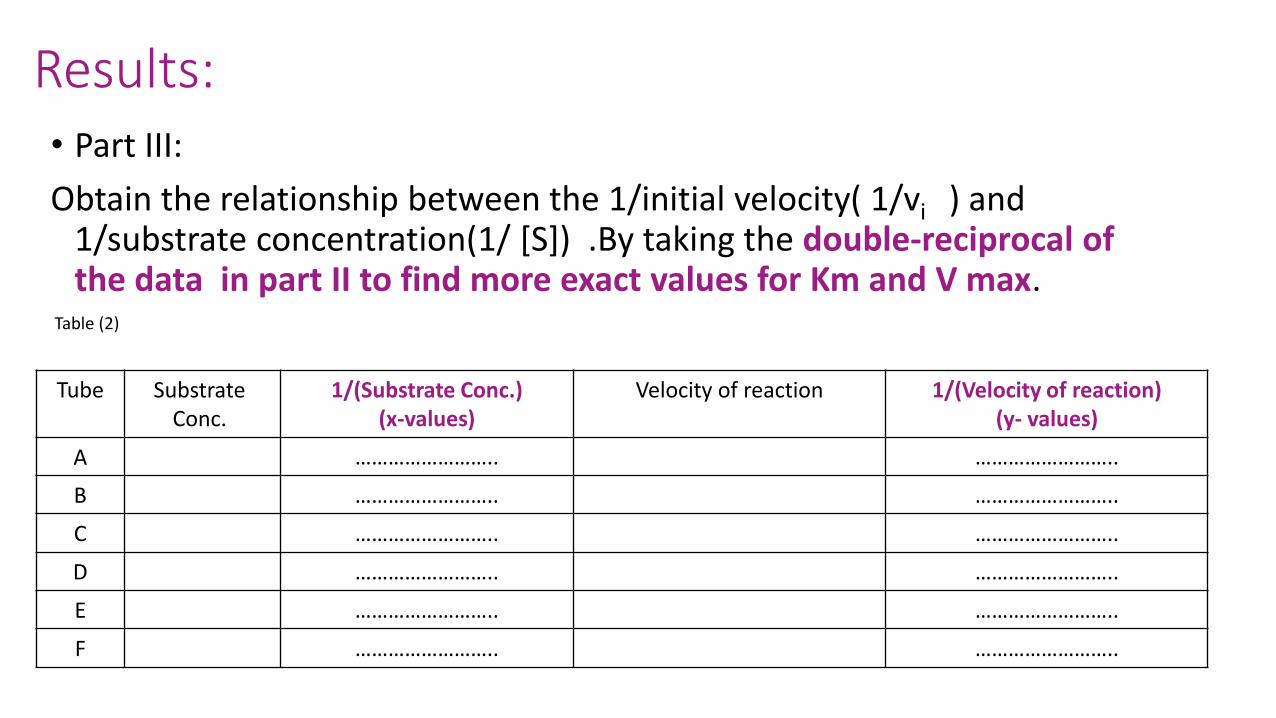
Results:
• Part III:
Obtain the relationship between the 1/initial velocity( 1/vi ) and 1/substrate concentration(1/ [S]) .By taking the double-reciprocal of the data in part II to find more exact values for Km and V max.
Table (2)
Tube Substrate
Conc. 1/(Substrate Conc.)
(x-values) Velocity of reaction 1/(Velocity of reaction)
(y- values)
A …………………….. ……………………..
B …………………….. ……………………..
C …………………….. ……………………..
D …………………….. ……………………..
E …………………….. ……………………..
F …………………….. ……………………..
Discussion:
• Comment on the results, pattrens, shape of the curves and mention the resaons of shap obtained.
• Calculate the V max and Michaelis – Menten conestant Km from the tow graphes.
• Determine the Km for β-fructofuranosidase and sucrose and comment on the affenty of sucrose to β-fructofuranosidase

Thank You


![BCH472 [Practical] 1 - fac.ksu.edu.safac.ksu.edu.sa/sites/default/files/8_determination_of_plasma_amylase_1.pdf · •Amylase is an enzyme that catalyze the breakdown of starch and](https://static.fdocument.org/doc/165x107/5e103e2da29581189566d1db/bch472-practical-1-facksuedusafacksuedusasitesdefaultfiles8determinationofplasmaamylase1pdf.jpg)