Intramolecular delocalization of Π electrons in polythiophenes with fixed conformation: A...
13
Intramolecular delocalization of Π electrons in polythiophenes with fixed conformation: A spectroscopic study Giuseppe Zerbi, Roberta Radaelli, Maurizio Veronelli, Elisabetta Brenna, Franco Sannicolò et al. Citation: J. Chem. Phys. 98, 4531 (1993); doi: 10.1063/1.465014 View online: http://dx.doi.org/10.1063/1.465014 View Table of Contents: http://jcp.aip.org/resource/1/JCPSA6/v98/i6 Published by the American Institute of Physics. Additional information on J. Chem. Phys. Journal Homepage: http://jcp.aip.org/ Journal Information: http://jcp.aip.org/about/about_the_journal Top downloads: http://jcp.aip.org/features/most_downloaded Information for Authors: http://jcp.aip.org/authors Downloaded 30 Apr 2013 to 198.91.37.2. This article is copyrighted as indicated in the abstract. Reuse of AIP content is subject to the terms at: http://jcp.aip.org/about/rights_and_permissions
Transcript of Intramolecular delocalization of Π electrons in polythiophenes with fixed conformation: A...

Intramolecular delocalization of Π electrons in polythiophenes with fixedconformation: A spectroscopic studyGiuseppe Zerbi, Roberta Radaelli, Maurizio Veronelli, Elisabetta Brenna, Franco Sannicolò et al. Citation: J. Chem. Phys. 98, 4531 (1993); doi: 10.1063/1.465014 View online: http://dx.doi.org/10.1063/1.465014 View Table of Contents: http://jcp.aip.org/resource/1/JCPSA6/v98/i6 Published by the American Institute of Physics. Additional information on J. Chem. Phys.Journal Homepage: http://jcp.aip.org/ Journal Information: http://jcp.aip.org/about/about_the_journal Top downloads: http://jcp.aip.org/features/most_downloaded Information for Authors: http://jcp.aip.org/authors
Downloaded 30 Apr 2013 to 198.91.37.2. This article is copyrighted as indicated in the abstract. Reuse of AIP content is subject to the terms at: http://jcp.aip.org/about/rights_and_permissions
Intramolecular delocalization of II electrons in polythiophenes with fixed conformation: A spectroscopic study
Giuseppe Zerbi, Roberta Radaelli, and Maurizio Veronelli Dipartimento di Chimica Industriale, Politecnico di Milano, 1-20133 Milano, Italy
Elisabetta Brenna and Franco Sannicolo Dipartimento di Chimica Organica e Industriale dell'Universita, Via Golgi 19, 1-20133 Milano, Italy
Gianni Zotti Istituto di Polarografia ed Elettrochimica Applicata-CNR, Cso Stati Uniti 4, 1-35020 Padova, Italy
(Received 23 July 1992; accepted 29 October 1992)
The main feature of (3,{3' -bridge-a,a' -bithienyls is that their conformation is controlled by the bridge length. This class of molecules could be useful for the understanding of the intra and intermolecular processes which determine the conductivity of the corresponding polymers. In this work we have recorded and studied (i) the electronic spectra of the monomers, (ii) the vibrational spectra (IR, Raman Aexc = 514 nm, FT -Raman Aexc = 1064 nm) of the monomers and polymers in the pristine state, (iii) the IR spectra of the doped polymers, and (iv) the IR spectra (probe) of the polymers photoinduced by visible light (pump). The interpretation of the spectra is made in terms of the "effective conjugation coordinate" theory. Poly(cyclopentabithiophene) peT + 1) has the largest 'IT-electron delocalization with a wide distribution of conjugation lengths. In poly(cycloheptabithiophene) peT +3) 'IT electrons are highly localized, while an intermediate situation is observed in poly(dihydrobenzobithiophene) peT +2). The various aspects of intra and intermolecular hopping of charge carriers are discussed.
I. INTRODUCTION
It is commonly accepted that the electrical conductivity of doped polyconjugated organic materials originates from charge carrier hopping within and between molecules (intra and intermolecular hopping, respectively). 1 This concept is the outcome of a detailed study of the prototype molecule, polyacetylene,2 and has been extrapolated to other more complex structures. Disentangling the contributions of the intra and intermolecular hopping is not easy even for polyacetylene, and becomes impossible, even qualitatively, for chemically and structurally complex systems. However, polyconjugated materials, which may be potentially useful in new technology, are made up by molecules with complex chemical and molecular structures. To take advantage of such systems it is essential to have some knowledge of the roles played by inter and intramolecular processes. We refer in general to oligomers and polymers of heteroaromatic molecules such as pyrrole3 and thiophene,4 which are the center of attention in basic and applied material science, such molecules being good candidates for devices because of their large electrical conductivity5 andlor nonlinear optical properties.6,7
The molecular origin of the electrical properties of these polyconjugated materials requires that intramolecular delocalization favors charge carrier intramolecular hopping; when this hopping is hindered by some kind of barrier (chemical defects, conformational distortions, chain ends, etc.) intermolecular processes may occur; such contribution depends in turn on the supramolecular organization of the chains.
Intramolecular delocalization of 'IT electrons depends on the extent of the overlapping of the pz orbitals of the
carbon atoms in positions a and a' of adjacent fivemembered heteroaromatic rings.8 Such overlapping is modulated by the conformation.
Let 8 be the torsional angle around the inter-ring bond. Both theoretical and experimental data for thiophene and pyrrole oligomers in the gas and solution states show that the actual molecular conformation is the result of a balance between steric (favoring 8=90° clinal conformation) and delocalization forces (favoring 8=0°, syn conformation, or 8= 180°, anticonformation).8 In the crystalline state, lattice forces squeeze the heterocyclic rings in the coplanar arrangement,9.10 making it necessary to add an additional term to the torsional potential.
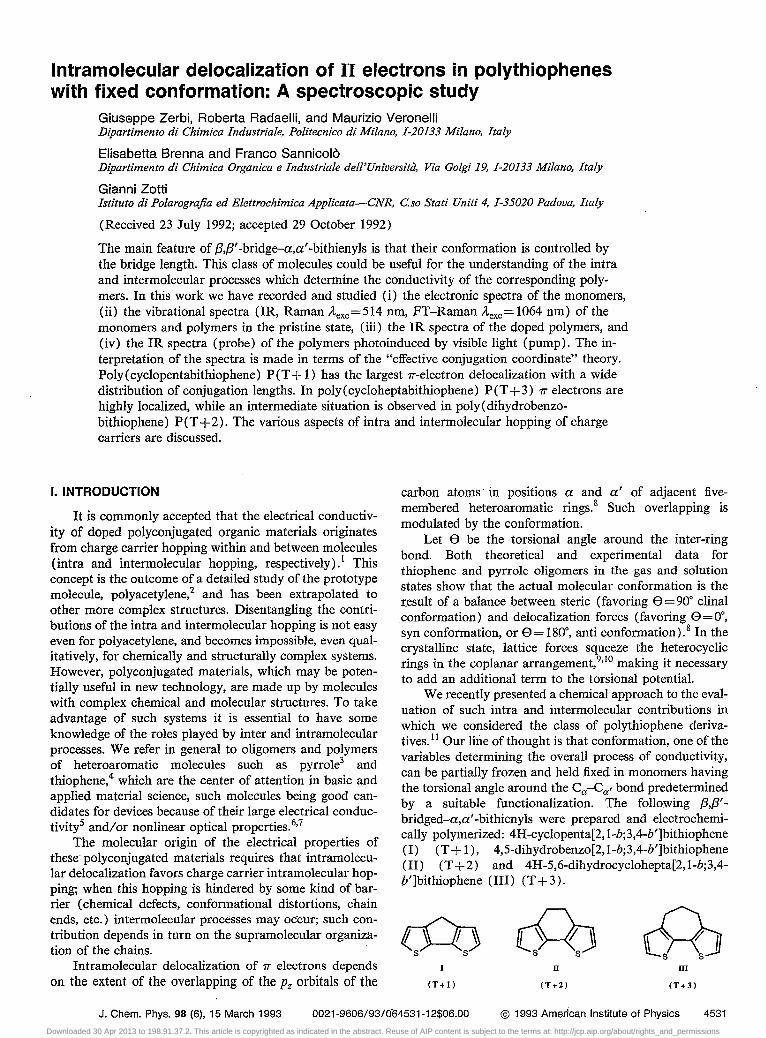
We recently presented a chemical approach to the evaluation of such intra and intermolecular contributions in which we considered the class of poly thiophene derivatives. 11 Our line of thought is that conformation, one of the variables determining the overall process of conductivity, can be partially frozen and held fixed in monomers having the torsional angle around the Ca-Ca, bond predetermined by a suitable functionalization. The following {3,{3'bridged-a,a' -bithienyls were prepared and electrochemically polymerized: 4H-cyclopenta[2,I-b;3,4-b']bithiophene (I) (T + 1 ), 4,5-dihydrobenzo[2,I-b;3,4-b']bithiophene (II) (T +2) and 4H-5,6-dihydrocyc1ohepta[2,I-b;3,4-b']bithiophene (III) (T +3).
cQ) s s uSb s S
II
(T+2)
III
(T+3)
J. Chern. Phys. 98 (6), 15 March 1993 0021-9606/93/0(34531-12$06.00 @ 1993 American Institute of Physics 4531
Downloaded 30 Apr 2013 to 198.91.37.2. This article is copyrighted as indicated in the abstract. Reuse of AIP content is subject to the terms at: http://jcp.aip.org/about/rights_and_permissions
4532 Zerbi et af.: Spectroscopy of polythiophenes
From the chemical formulasit is apparent that, while in a first approximation the conformation is fixed within the monomer unit, the C-C bonds joining the dithienyl units in the polymer still allow torsional flexibility. If intramolecular hopping is an important contribution, then the trend in conductivity should be 0"1> O"n> O"m. The conductivity values (S/cm)J1 [O"p(T+l)=40, O"P(T+2) = 1.5, O"P(T+3) =3] suggest that intramolecular hopping is sizeable.
This paper evaluates the possibility of modulating intramolecular hopping by fixing the intraunit conformation in poly thiophene based materials. Delocalization of 1T" electrons within the monomers themselves and between monomers in the polymer is evaluated by using, as a probe, the vibrational spectrum in its various experimental and theoretical aspects.
II. EXPERIMENT
Studies were made on the methylene bridged dithienyl monomers (T+1) (I), (T+2)(II), and (T+3)(III) and the corresponding polymers peT + 1), peT +2), and P(T+3).
4H-Cyclopenta [2,I-b;3,4-b']bithiophene (T + 1) (I) 12 and 4,5-dihydrobenzo[2,I-b;3,4-b']bithiophene (T + 3) (II), 13 already known in the literature, were prepared through the known routes and the physical and spectral data were in agreement with literature data. The synthesis of new 4H-5,6-dihydrobenzo[2,1-b;3,4-b']bithiophene (T+3) (III) will be reported elsewhere: 14 light yellow oil with b.p. 145°C at 0.3 mmHg. MS 206 (M+); IH NMR (CDCI3) 82.03 (2H, m, CH2 in position 5), 2.95 (4H, m, 2CH2 in positions 4 and 6), 6.75 (2H, d, aromatic in position {3 and (3'J=5.2 Hz), 6.98 (2H, d, aromatic in position a and a'); l3C NMR (CDCI3) ppm 23.57 (C in position 5),31.01 (2C in positions 4 and 6), 121.18 (2CH in positions 2 and 8), 130.54 (2CH in positions 3 and 7), 131.48 (2 quaternary C in position a), 137.64 (2 quaternary C in position (3).
We recorded and studied: 15
(i) The electronic spectra of (T+1), (T+2), and (T +3) in solution (Perkin Elmer mod. Lambda 6) and of (T+1) in solid phase (Jasco mod. Uvidec-610 equipped with an integrating sphere for the recording of the diffuse reflectance spectra of the solids). The solid sample was a finely ground mixture of T + 1 and BaS04, the BaS04 absorption always being subtracted from the spectra.
(ii) The infrared spectra of doped polymers with a FTIR interferometer (Nicolet mod. 7000).
(iii) The Raman spectra of monomers and polymers (Dilor XY-Raman spectrometer with multichannel detector) with excitation in the visible (Aexc =514 nm of a Spectra Physics Ar+ laser).
(iv) The infrared spectra of photogenerated species in the polymers. Only polymers give photoexcited spectra. A sample of the pristine polymer suspended in a KBr pellet and kept at 15 K was illuminated (pump) by the green light of a Ar+ laser (power=75 mW /cm2) chopped at the frequency of 0.1 Hz. The ir spectrum was recorded
(probe) with a FTIR interferometer by coadding thousands of spectra.
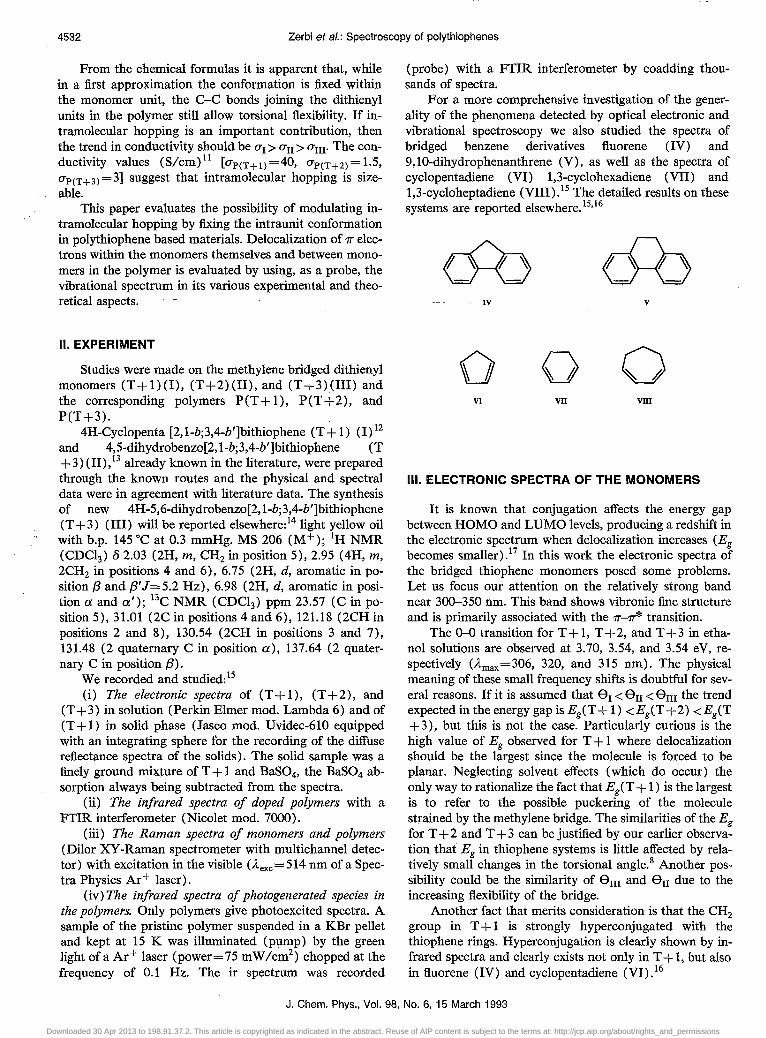
For a more comprehensive investigation of the generality of the phenomena detected by optical electronic and vibrational spectroscopy we also studied the spectra of bridged benzene derivatives fluorene (IV) and 9,1O-dihydrophenanthrene (V), as well as the spectra of cyclopentadiene (VI) 1,3-cyclohexadiene (VII) and 1,3-cycloheptadiene (VIII)Y The detailed results on these systems are reported elsewhere. 15,16
IV v
o o o VI VII VITI
III. ELECTRONIC SPECTRA OF THE MONOMERS
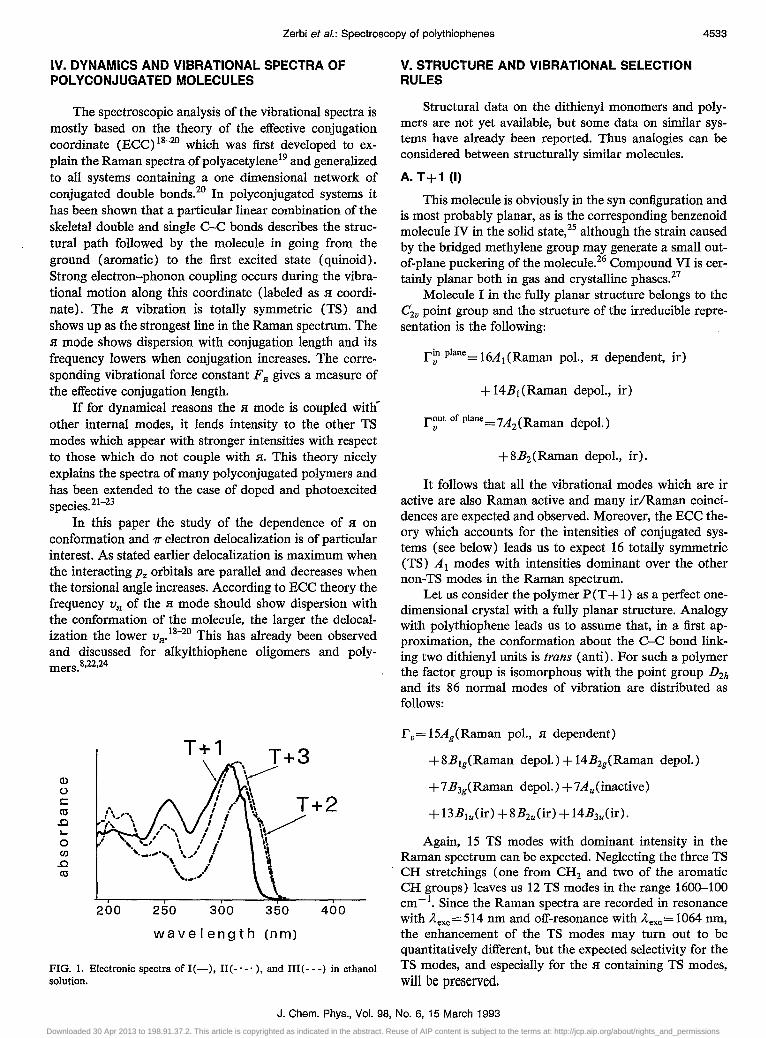
It is known that conjugation affects the energy gap between HOMO and LUMO levels, producing a redshift in the electronic spectrum when delocalization increases (Eg
becomes smaller) Y In this work the electronic spectra of the bridged thiophene monomers posed some problems. Let us focus our attention on the relatively strong band near 300-350 nm. This band shows vibronic fine structure and is primarily associated with the 1T"-1T* transition.
The 0--0 transition for T + 1, T +2, and T +3 in ethanol solutions are observed at 3.70, 3.54, and 3.54 eV, respectively (Amax =306, 320, and 315 nm). The physical meaning of these small frequency shifts is doubtful for several reasons. If it is assumed that 8 1 < 8 n < 8 m the trend expected in the energy gap is EgCT + 1) <EgCT +2) <Eg(T + 3 ), but this is not the case. Particularly curious is the high value of Eg observed for T + 1 where delocalization should be the largest since the molecule is forced to be planar. Neglecting solvent effects (which do occur) the only way to rationalize the fact that EgCT + 1) is the largest is to refer to the possible puckering of the molecule strained by the methylene bridge. The similarities of the Eg for T + 2 and T + 3 can be justified by our earlier observation that Eg in thiophene systems is little affected by relatively small changes in the torsional angle.8 Another possibility could be the similarity of 8 m and 8 n due to the increasing flexibility of the bridge.
Another fact that merits consideration is that the CH2 group in T + 1 is strongly hyperconjugated with the thiophene rings. Hyperconjugation is clearly shown by infrared spectra and clearly exists not only in T + 1, but also in fluorene (IV) and cyclopentadiene (VI) .16
J. Chern. Phys., Vol. 98. No.6. 15 March 1993
Downloaded 30 Apr 2013 to 198.91.37.2. This article is copyrighted as indicated in the abstract. Reuse of AIP content is subject to the terms at: http://jcp.aip.org/about/rights_and_permissions
Zerbi et al.: Spectroscopy of polythiophenes 4533
IV. DYNAMICS AND VIBRATIONAL SPECTRA OF POLYCONJUGATED MOLECULES
The spectroscopic analysis of the vibrational spectra is mostly based on the theory of the effective conjugation coordinate (BCC) 18-20 which was first developed to explain the Raman spectra ofpolyacetylenel9 and generalized to all systems containing a one dimensional network of conjugated double bonds.2o In polyconjugated systems it has been shown that a particular linear combination of the skeletal double and single C-C bonds describes the structural path followed by the molecule in going from the ground (aromatic) to the first excited state (quinoid). Strong electron-phonon coupling occurs during the vibrational motion along this coordinate (labeled as .ff coordinate). The .ff vibration is totally symmetric (TS) and shows up as the strongest line in the Raman spectrum. The .ff mode shows dispersion with conjugation length and its frequency lowers when conjugation increases. The corresponding vibrational force constant FH gives a measure of the effective conjugation length.
If for dynamical reasons the .ff mode is coupled with other internal modes, it lends intensity to the other TS modes which appear with stronger intensities with respect to those which do not couple with fl. This theory nicely explains the spectra of many polyconjugated polymers and has been extended to the case of doped and photoexcited species.21- 23
In this paper the study of the dependence of .ff on conformation and 1r electron delocalization is of particular interest. As stated earlier delocalization is maximum when the interacting pz orbitals are parallel and decreases when the torsional angle increases. According to BCC theory the frequency VH of the .ff mode should show dispersion with the conformation of the molecule, the larger the delocalization the lower vH.18-20 This has already been observed and discussed for alkylthiophene oligomers and polymers.8,22,24
Q)
(.)
c co .0 .... o en .0 co
200
T+3
T+2
250 300 350 400
wavelength (nm)
FIG. 1. Electronic spectra ofl(-), H(-'-'), and lII(---) in ethanol solution.
V. STRUCTURE AND VIBRATIONAL SELECTION RULES
Structural data on the dithienyl monomers and polymers are not yet available, but some data on similar systems have already been reported. Thus analogies can be considered between structurally similar molecules.
A. T +1 (I)
This molecule is obviously in the syn configuration and is most probably planar, as is the corresponding benzenoid molecule IV in the solid state,25 although the strain caused by the bridged methylene group may generate a small outof-plane puckering of the molecule.26 Compound VI is certainly planar both in gas and crystalline phasesP
Molecule I in the fully planar structure belongs to the C2v point group and the structure of the irreducible representation is the following:
r~n plane= 16AI (Raman pol., .ff dependent, ir)
+ 14BI (Raman depol., ir)
r~ut of plane=7A2(Raman depol.)
+8B2(Raman depol., ir).
It follows that all the vibrational modes which are ir active are also Raman active and many ir/Raman coincidences are expected and observed. Moreover, the BCC theory which accounts for the intensities of conjugated systems (see below) leads us to expect 16 totally symmetric (TS) Al modes with intensities dominant over the other non-TS modes in the Raman spectrum.
Let us consider the polymer P (T + 1) as a perfect onedimensional crystal with a fully planar structure. Analogy with poly thiophene leads us to assume that, in a first approximation, the conformation about the C-C bond linking two dithienyl units is trans (anti). For such a polymer the factor group is isomorphous with the point group D2h
and its 86 normal modes of vibration are distributed as follows:
r v= 15AgCRaman pol., fl dependent)
+8B1g(Raman depol.) + 14B2gCRaman depol.)
+ 7 B3gCRaman depol.) + 7Au(inactive)
+ 13B1u(ir) + 8 B2u Cir) + 14B3uCir).
Again, 15 TS modes with dominant intensity in the Raman spectrum can be expected. Neglecting the three TS CH stretchings (one from CH2 and two of the aromatic CH groups) leaves us 12 TS modes in the range 1600-100 cm -I. Since the Raman spectra are recorded in resonance with Aexc = 514 nm and off-resonance with Aexc = 1064 nm, the enhancement of the TS modes may turn out to be quantitatively different, but the expected selectivity for the TS modes, and especially for the fl containing TS modes, will be preserved.
J. Chern. Phys., Vol. 98, No.6, 15 March 1993
Downloaded 30 Apr 2013 to 198.91.37.2. This article is copyrighted as indicated in the abstract. Reuse of AIP content is subject to the terms at: http://jcp.aip.org/about/rights_and_permissions
4534 Zerbi et al.: Spectroscopy of polythiophenes
B. T +2 (II)
As no structural data on this molecule are available, analogy with similar systems must be taken into account. Data from electron diffraction,28 microwave,29 and NMR30
on 1,3-cyclohexadiene (VII) show that this molecule is definitely distorted with 8::::::20° and that the CH2 groups are in a staggered conformation. A similar torsion angle is found for molecule V in which 8::::::21°.31
The symmetry point group of II is C2 and the vibrations are distributed as follows: rv=28A (Raman pol., .H
dependent, ir) + 26B(Raman depol., ir).
C. T +3 (III)
No structural data are available for this molecule; however, it could be structurally similar to 1,3-cycloheptadiene (VII) for which two structures have been proposed: (i) a "quasiplanar" structure in which the two double bonds are coplanar and the central CH2 group lies above the molecular plane;32 (ii) a twisted structure.33
For structure (i) (point group Cs ) symmetry is low and many modes are predicted: rv=33A' (Raman pol., .H
dependent, ir) +30A" (Raman depol., ir). For structure (ii) (point group C2 ) the following
modes are predicted: rv=32A (Raman pol., .H dependent, ir) +31B (Raman depol., ir).
In any case, on the basis of selection rulell, itis practically impossible to distinguish between structures (i) and (ii) with ir and Raman spectra.
VI. RAMAN SPECTRA OF MONOMERS
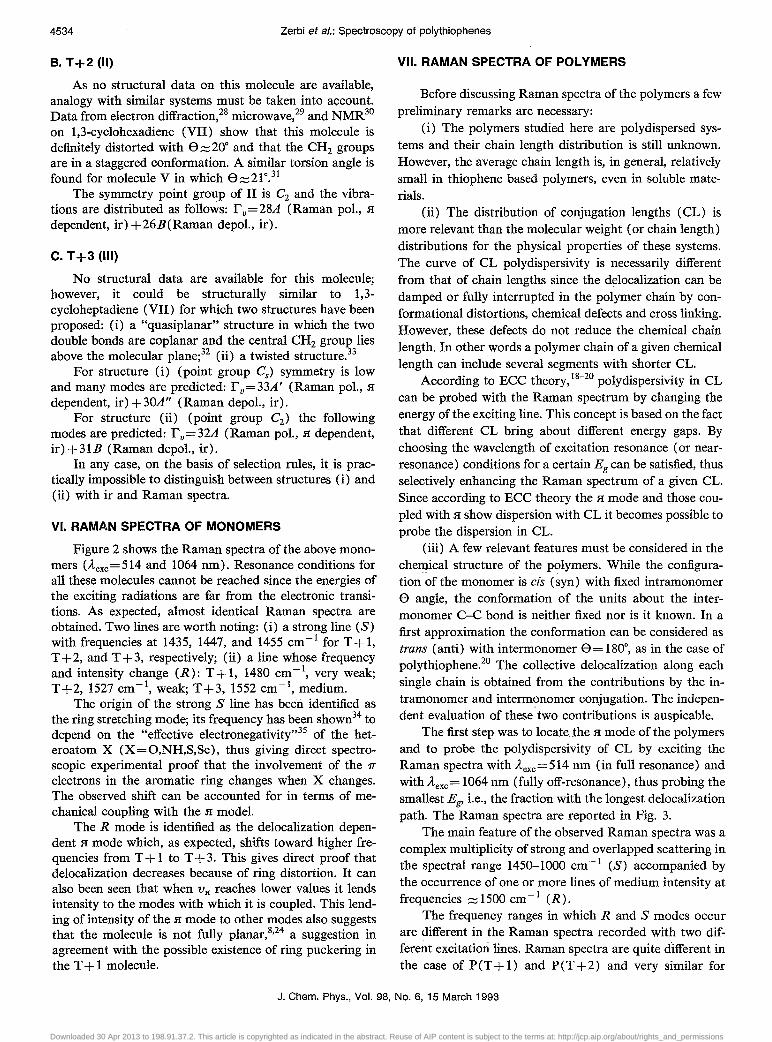
Figure 2 shows the Raman spectra of the above monomers (Aexc = 514 and 1064 nm). Resonance conditions for all these molecules cannot be reached since the energies of the exciting radiations are far from the electronic transitions. As expected, almost identical Raman spectra are obtained. Two lines are worth noting: (i) a strong line (S) with frequencies at 1435, 1447, and 1455 cm -1 for T + 1, T +2, and T +3, respectively; (ii) a line whose frequency and intensity change (R): T + 1, 1480 cm - I, very weak; T+2, 1527 cm-t, weak; T+3, 1552 cm-t, medium.
The origin of the strong S line has been identified as the ring stretching mode; its frequency has been shown34 to depend on the "effective electronegativity,,35 of the heteroatom X (X=O,NH,S,Se), thus giving direct spectroscopic experimental proof that the involvement of the 1r
electrons in the aromatic ring changes when X changes. The observed shift can be accounted for in terms of mechanical coupling with the .H model.
The R mode is identified as the delocalization dependent .H mode which, as expected, shifts toward higher frequencies from T + 1 to T + 3. This gives direct proof that delocalization decreases because of ring distortion. It can also been seen that when Va reaches lower values it lends intensity to the modes with which it is coupled. This lending of intensity of the .H mode to other modes also suggests that the molecule is not fully planar,8,24 a suggestion in agreement with the possible existence of ring puckering in the T + 1 molecule.
VII. RAMAN SPECTRA OF POLYMERS
Before discussing Raman spectra of the polymers a few preliminary remarks are necessary:
(i) The polymers studied here are polydispersed systems and their chain length distribution is still unknown. However, the average chain length is, in general, relatively small in thiophene based polymers, even in soluble materials.
(ii) The distribution of conjugation lengths (CL) is more relevant than the molecular weight (or chain length) distributions for the physical properties of these systems. The curve of CL polydispersivity is necessarily different from that of chain lengths since the delocalization can be damped or fully interrupted in the polymer chain by conformational distortions, chemical defects and cross linking. However, these defects do not reduce the chemical chain length. In other words a polymer chain of a given chemical length can include several segments with shorter CL.
According to ECC theory,18-20 polydispersivity in CL can be probed with the Raman spectrum by changing the energy of the exciting line. This concept is based on the fact that different CL bring about different energy gaps. By choosing the wavelength of excitation resonance (or nearresonance) conditions for a certain Eg can be satisfied, thus selectively enhancing the Raman spectrum of a given CL. Since according to ECC theory the .H mode and those coupled with .H show dispersion with CL it becomes possible to probe the dispersion in CL.
(iii) A few relevant features must be considered in the chemical structure of the polymers. While the configuration of the monomer is cis (syn) with fixed intramonomer 8 angle, the conformation of the units about the intermonomer C-C bond is neither fixed nor is it known. In a first approximation the conformation can be considered as trans (anti) with intermonomer 8= 180°, as in the case of poly thiophene. 20 The collective delocalization along each single chain is obtained from the contributions by the intramonomer and intermonomer conjugation. The independent evaluation of these two contributions is auspicable.
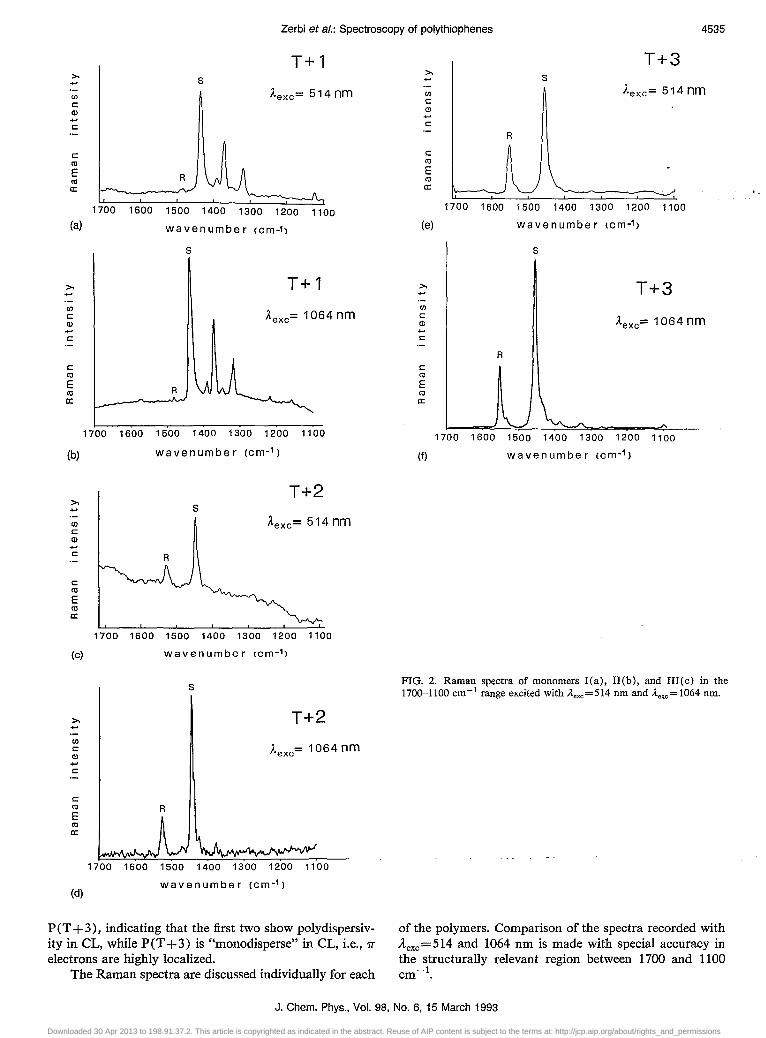
The first step was to locate the .H mode of the polymers and to probe the polydispersivity of CL by exciting the Raman spectra with Aexc = 514 nm (in full resonance) and with Aexc= 1064 nm (fully off-resonance), thus probing the smallest Eg> i.e., the fraction with the longest delocalization path. The Raman spectra are reported in Fig. 3.
The main feature of the observed Raman spectra was a complex multiplicity of strong and overlapped scattering in the spectral range 1450--1000 cm- I (S) accompanied by the occurrence of one or more lines of medium intensity at frequencies :::::: 1500 cm - 1 (R).
The frequency ranges in which Rand S modes occur are different in the Raman spectra recorded with two different excitation lines. Raman spectra are quite dIfferent in the case of P (T + 1) and P (T + 2) and very similar for
J. Chern. Phys., Vol. 98, No.6, 15 March 1993
Downloaded 30 Apr 2013 to 198.91.37.2. This article is copyrighted as indicated in the abstract. Reuse of AIP content is subject to the terms at: http://jcp.aip.org/about/rights_and_permissions
Zerbi et al.: Spectroscopy of polythiophenes 4535
(J)
c: Q) -c:
c: ro E ro a:
(a)
(J)
c: Q) -c:
c: ro E ro a:
(b)
(J)
c: Q) -c:
c: ro E ro a:
(e)
(J)
c: Q) -c:
c: ro E ro a:
(d)
T+1 s
Aexc= 514 nm
R
1700 1600 1500 1300 1200 1100
wavenumber (cm-I>
s
T+1
Aexc= 1064 nm
R
1700 1600 1500 1400 1300 1200 1100
wavenumber (cm-I )
T+2 s
Aexc= 514 nm
R
1700 1600 1500 1400 1300 1200 1100
wavenumber (em-I>
s
T+2
Aexc= 1064 nm
R
1700 1600 1500 1400 1300
wavenumber (cm-I )
1100
P (T + 3), indicating that the first two show polydispersivity in CL, while P (T + 3) is "monodisperse" in CL, i.e., 1T
electrons are highly localized. The Raman spectra are discussed individually for each
(J)
c: Q)
c: ro E ro a:
(e)
(J)
c: Q) -c:
c: ro E ro 0:
(f)
T+3 s
Aexc= 514 nm
R
1700160015001400130012001100
wa v e n umbe r (cm-I >
s
T+3
Aexc= 1064 nm
R
1700 1600 1500 1400 1300 1200 1100
wavenumber (em-I)
FIG. 2. Raman spectra of monomers I(a), II(b), and III(c) in the 1700--1100 cm- 1 range excited with ilexc =514 nm and ilexc = 1064 nm.
of the polymers. Comparison of the spectra recorded with Aexc = 514 and 1064 nm is made with special accuracy in the structurally relevant region between 1700 and 1100 cm-l.
J. Chern. Phys., Vol. 98, No.6, 15 March 1993
Downloaded 30 Apr 2013 to 198.91.37.2. This article is copyrighted as indicated in the abstract. Reuse of AIP content is subject to the terms at: http://jcp.aip.org/about/rights_and_permissions
4536 Zerbi et al.: Spectroscopy of polythiophenes
>-
(fl
c CD -c:
c: co E co 0:
(a)
>-
(fl
c CD .... c:
c co E co 0:
(b)
(fl
c CD .... C
c co E co 0:
(c)
(fl
c CD .... C
c co E co 0:
(d)
s P (T + 1) ,----,
Aexc= 514 nm
1700 1600 1500 1400 1300 1200 1100
wavenumber (cm-1 )
P (T + 1)
Aexc= 1064 nm
1700 1600 1500 1400 1300 1200 1100
wavenumber (cm-')
P (T +2) R
Aexc= 514 nm
1700160015001400130012001100
wavenumber (cm-')
S r--l
R r---1
P (T +2)
Aexc= 1064 nm
1700 1.600 1500 1400 1300 1200 1100
wavenumber (cm-1)
A. P(T +1)
The spectra with the two excitations are drastically different, indicating in-resonance or near-resonance with two regions of the distributions of conjugation lengths generating Eg close to the energy of the exciting radiation. At
s P (T+3) >- ,----,
(fl Aexc= 514 nm c R CD -c
c co E co 0:
1700 1600 1500 1400 1300 1200 1100
(e) wavenumber (cm-1)
S ,----, >- P (T +3) C/l c Aexc= 1064 nm CD .... c
c co E co 0:
1700 1600 1500 1400 1300 1200 1100
(f) wa v e n u m b e r (C m -1 )
FIG. 3. Raman spectra of polymers of methylene bridged bithiophenes: peT + 1) (a), peT +2) (b), and peT +3) (c) excited with ..1.exc =514 nm and ..1.exc = 1064 nm.
iLexc = 514 nm the R line identifies the H mode at 1521 cm- 1
and the group S of lines is peaked at 1397 cm -1. With iLexc= 1064 nm both the Rand S group of lines shift to lower frequencies, indicating that resonance is reached with a smaller Eg> i.e., with segments with higher CL. A
J. Chem. Phys., Vol. 98, No.6, 15 March 1993
Downloaded 30 Apr 2013 to 198.91.37.2. This article is copyrighted as indicated in the abstract. Reuse of AIP content is subject to the terms at: http://jcp.aip.org/about/rights_and_permissions
Zerbi et at.: Spectroscopy of polythiophenes 4537
group of modes with the highest v = 1510 cm -I is assigned to the .H mode. The lending of the intensity to lines at 1387, 1355, and 1341 cm- I confirms delocalization and suggests that the molecular chain is conformationally distorted, as discussed earlier.
The main message from the Raman spectra of P (T + 1) is that the sample consists of a collection of chains with a broad distribution of CL. The sample is generally highly conjugated, even if P(T + 1) is not necessarily fully planar, either because of the slight puckering of the monomer or because of non planar conformation about the interunit C-C bonds.
B. P(T+2)
The spectra with the two excitations are drastically different. The spectrum excited with the 514 nm line shows the group R peaked at vg =1534 cm- I . With excitation in the near infrared the whole spectral pattern shifts toward lower frequencies (with intensity exchange) again showing large delocalization, but more restricted than in the case of P(T +1). The group of lines, which is peaked at 1546 and 1523 cm- I when near ir excitation is used, must be the Vg
scattering of the fraction of chains with larger Eg which coincides with the strong .H mode excited in the green. The strong intensity of the line near 1405 cm- I is again an indication that the conformation of the whole polymer chain is, on the whole, distorted.
c. P(T+3)
The spectra obtained with the two exciting lines are practically identical: the R group of lines contains the .H
mode (:::::1530 cm- I ) and the S group contains the "unperturbed" ring stretching mode at 1464 cm- I at frequencies very similar to those observed for the monomer T +3. We can conclude that the material is strongly "monodisperse" in conjugation length, and the conjugation length is very short, possibly as short as in the monomer. For some reason not immediately clear it may well happen that the trimethylene bridge forces the inter-monomer torsional angle e to be almost 90·, thus breaking delocalization between monomer units. Alternatively these re~ults make us wonder whether the material is a polymer or a complex molecular oligomeric system in which conjugation is highly localized. More physicochemical characterization is needed.
VIII. INFRARED SPECTRA OF DOPED POL YI\iJERS
According to Eee theory the doping induced infrared spectrum is again related to the delocalization of 1T electrons which occurs in the pristine materials. 18-20 The infrared spectrum consists of very strong absorptions which are often overwhelmingly stronger than in the infrared spectrum of the pristine material. This is due to the fact that upon formation of a charge transfer the electronic charge is strongly displaced within the molecule and extremely large dipole moment changes are associated with the vibrations of the charge carrier. On the contrary the intensities of the corresponding modes in the Raman spectra of doped spe-
cies are expected to be very weak. 19,20 The spectrum of doped polyacetylene is a paradigma case for the application of Eee theory.'
The doping induced infrared bands are generally loosely called "bipolaron bands," since for systems with nondegenerate electronic ground states solitonic excitations cannot exist and only polarons (radical-ions) and/or bipolarons (di-ions) are produced. It has also been shown that infrared spectra can be taken as evidence of strong charge displacement, but do not discriminate between solitonic, polaronic, or bipolaronic defects. 18- 20,36,37 Other physical measurements (electronic spectrum, ESR, etc.) are needed.
With the Eee approach the nature of the charge carrier (i.e., the topological extension along the polymer chain, the amount of charge transferred, the strength of the charge transfer bond, etc.) depends on the delocalization length of the pristine material. Indeed when the effective CL increases, the HOMO-LUMO energy gap decreases and the ionization potential decreases.38 Thus doping is easier when effective CL increases.
It is then expected that .H modes are also observed for doped materials, but this time with a very strong band in ir. Thus the so called "bipolaron bands" are actually the .H
mode strongly activated in ir and must therefore show dispersion in frequency and intensity. The larger the delocalization in the pristine segment attacked by the dopant the lower the frequency of the .H mode. 19,20 Moreover, intensity dispersion is also expected. When the frequency of the .H
mode decreases the mode mechanically couples with other modes with closer frequencies, repulsion and perturbation of the vibrational levels occur and the intensity of the .H
mode is lent to the modes taking part in the coupling. These predictions have been verified for several doped polyconjugated systems. 19-23
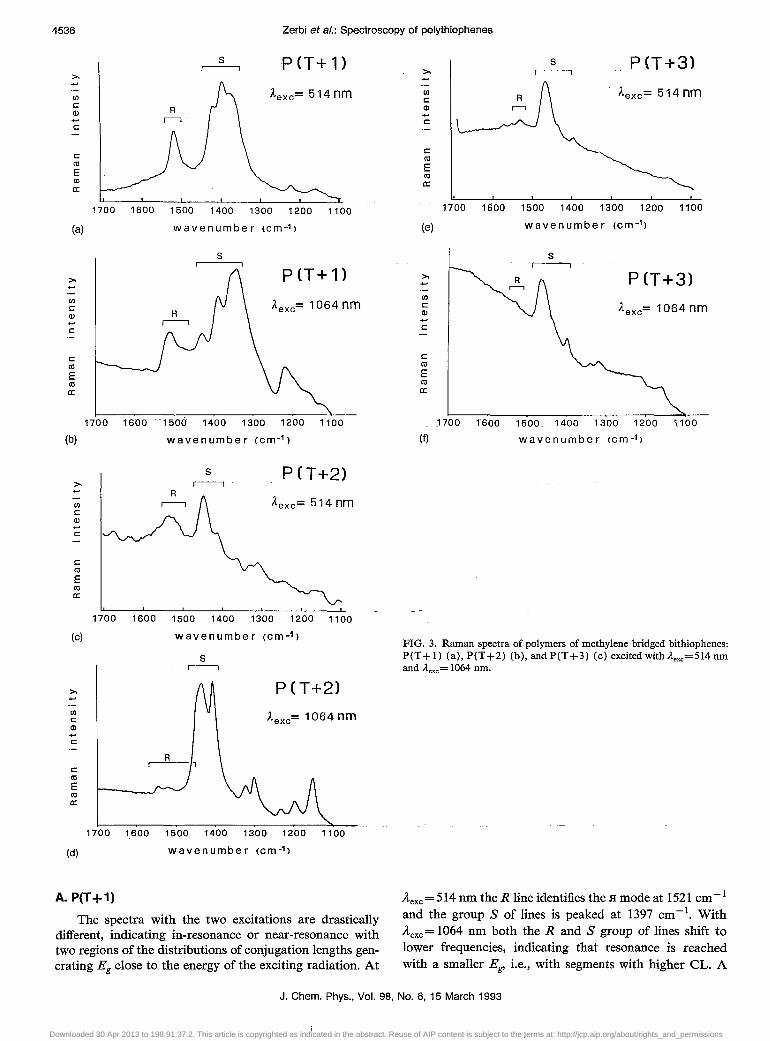
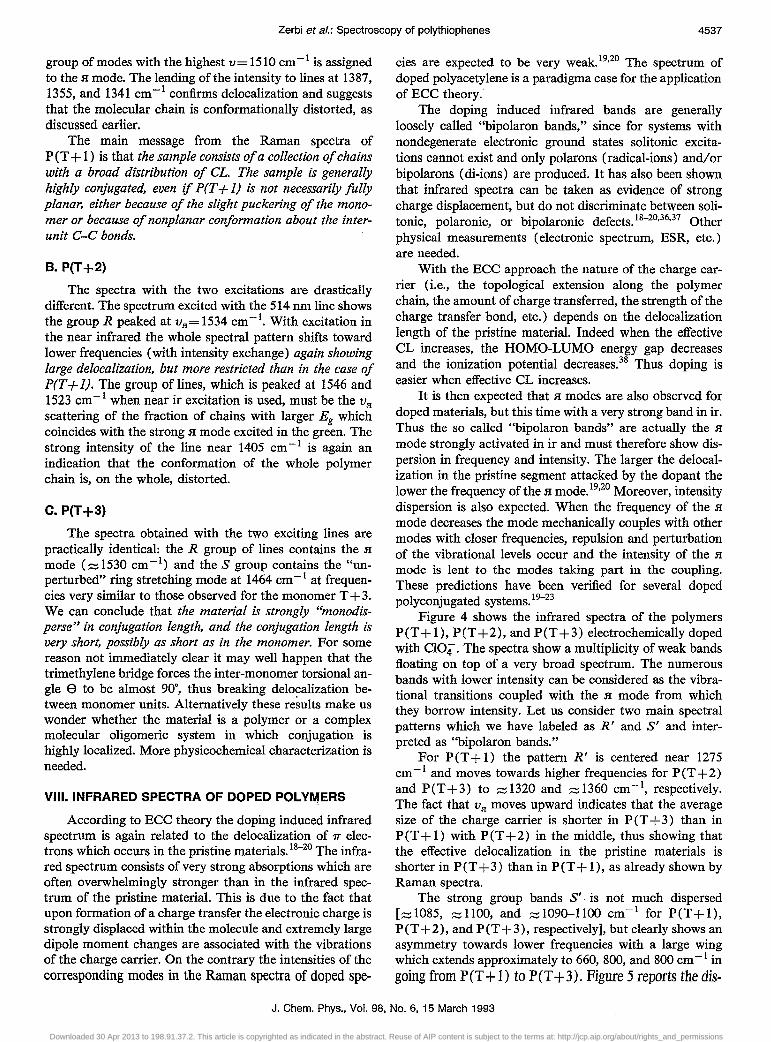
Figure 4 shows the infrared spectra of the polymers peT + 1), peT +2), and peT +3) electrochemically doped with CI04". The spectra show a multiplicity of weak bands floating on top of a very broad spectrum. The numerous bands with lower intensity can be considered as the vibrational transitions coupled with the .H mode from which they borrow intensity. Let us consider two main spectral patterns which we have labeled as R' and S' and interpreted as "bipolaron bands."
For P(T+l) the pattern R' is centered near 1275 cm -I and moves towards higher frequencies for P (T + 2) and P(T+3) to :::::1320 and :::::1360 cm- I , respectively. The fact that Vg moves upward indicates that the average size of the charge carrier is shorter in P (T + 3) than in peT + 1) with PCT +2) in the middle, thus showing that the effective delocalization in the pristine materials is shorter in peT +3) than in PCT + 1), as already shown by Raman spectra.
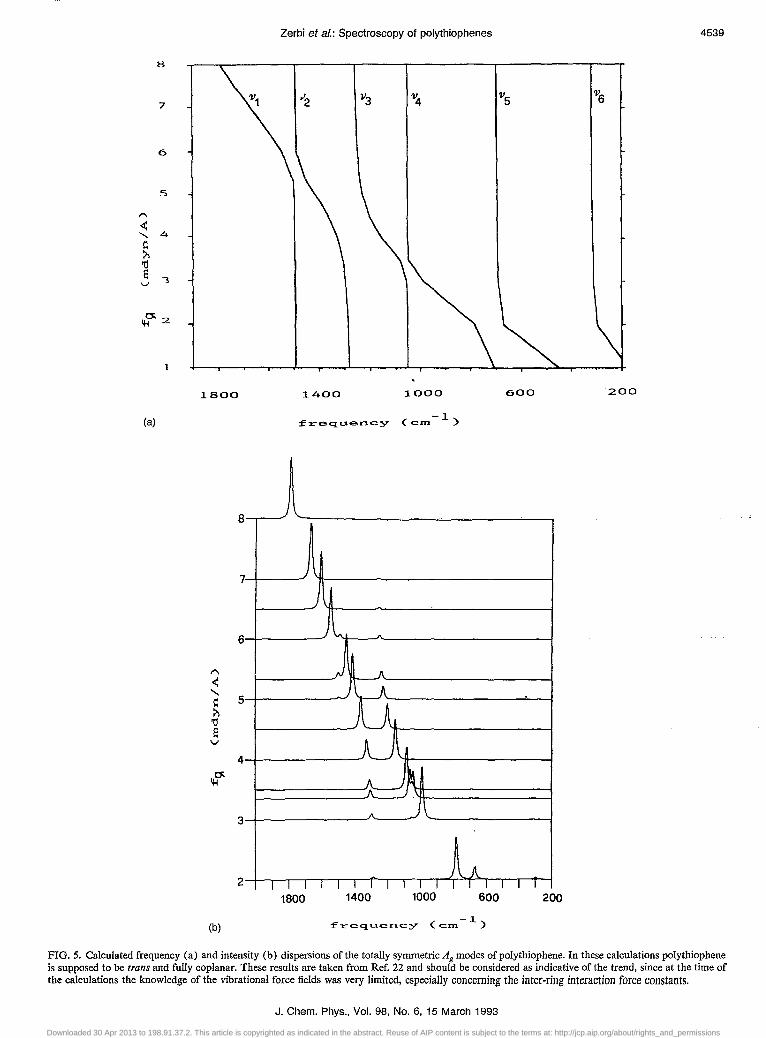
The strong group bands S' is not much dispersed [:::::1085, :::::1100, and :::::1090--1100 cm- I for PCT+l), peT +2), and PCT +3), respectively], but clearly shows an asymmetry towards lower frequencies with a large wing which extends approximately to 660, 800, and 800 cm -I in going from peT + 1) to peT +3). Figure 5 reports the dis-
J. Chern. Phys., Vol. 98, No.6, 15 March 1993
Downloaded 30 Apr 2013 to 198.91.37.2. This article is copyrighted as indicated in the abstract. Reuse of AIP content is subject to the terms at: http://jcp.aip.org/about/rights_and_permissions
4538 Zerbi et al.: Spectroscopy of polythiophenes
Q)
t.> C co .rl
o rn .rl co
Q)
t.> C co .rl .... o rn .rl co
Q)
t.> C co .rl .... o rn
..CI co
P (T + 1)
1500 1000 500
wavenumbe r (cm -1)
P (T +2)
1500 1000 500
wavenumber (cm-1)
P (T +3)
1500 1000 500
w a v e n u m b e r (c m-1 )
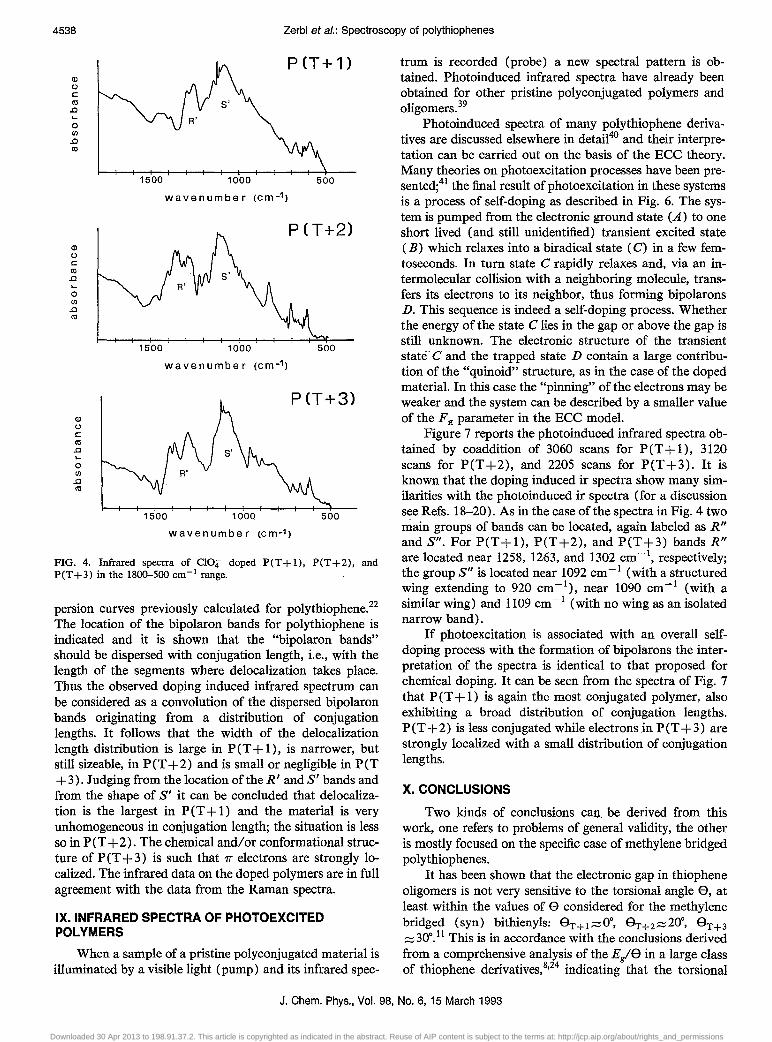
FIG. 4. Infrared spectra of CI0.! doped P(T+l), P(T+2), and P(T+3) in the 1800-500 cm- 1 range.
persion curves previously calculated for polythiophene.22
The location of the bipolaron bands for poly thiophene is indicated and it is shown that the "bipolaron bands" should be dispersed with conjugation length, i.e., with the length of the segments where delocalization takes place. Thus the observed doping induced infrared spectrum can be considered as a convolution of the dispersed bipolaron bands originating from a distribution of conjugation lengths. It follows that the width of the delocalization length distribution is large in peT + 1), is narrower, but still sizeable, in peT +2) and is small or negligible in peT +3). Judging from the location oftheR' andS' bands and from the shape of S' it can be concluded that delocalization is the largest in peT + 1) and the material is very unhomogeneous in conjugation length; the situation is less so in peT +2). The chemical and/or conformational structure of P (T + 3) is such that 1r electrons are strongly localized. The infrared data on the doped polymers are in full agreement with the data from the Raman spectra.
IX. INFRARED SPECTRA OF PHOTOEXCITED POLYMERS
When a sample of a pristine polyconjugated material is illuminated by a visible light (pump) and its infrared spec-
trum is recorded (probe) a new spectral pattern is obtained. Photoinduced infrared spectra have already been obtained for other pristine polyconjugated polymers and oligomers.39
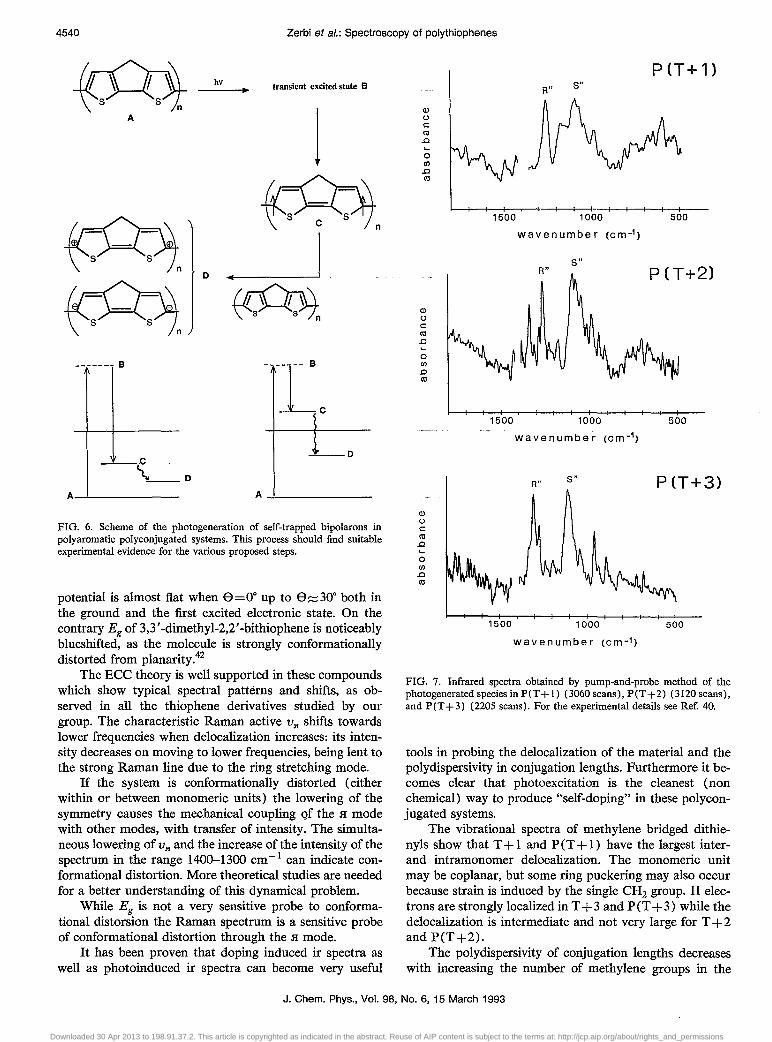
Photoinduced spectra of many poly thiophene derivatives are discussed elsewhere in detail40 and their interpretation can be carried out on the basis of the Eee theory. Many theories on photoexcitation processes have been presented;41 the final result of photo excitation in these systems is a process of self-doping as described in Fig. 6. The system is pumped from the electronic ground state (A) to one short lived (and still unidentified) transient excited state (B) which relaxes into a biradical state (C) in a few femtoseconds. In turn state C rapidly relaxes and, via an intermolecular collision with a neighboring molecule, transfers its electrons to its neighbor, thus forming bipolarons D. This sequence is indeed a self-doping process. Whether the energy of the state C lies in the gap or above the gap is still unknown. The electronic structure of the transient state C and the trapped state D contain a large contribution of the "quinoid" structure, as in the case of the doped material. In this case the "pinning" of the electrons may be weaker and the system can be described by a smaller value of the Fa parameter in the Eee model.
Figure 7 reports the photoinduced infrared spectra obtained by coaddition of 3060 scans for P (T + 1), 3120 scans for peT +2), and 2205 scans for peT +3). It is known that the doping induced ir spectra show many similarities with the photoinduced ir spectra (for a discussion see Refs. 18-20). As in the case of the spectra in Fig. 4 two main groups of bands can be located, again labeled as R" and S". For P(T+l), P(T+2), and P(T+3) bands R" are located near 1258, 1263, and 1302 cm-l, respectively; the group S" is located near 1092 cm -I (with a structured wing extending to 920 cm -I), near 1090 cm -I (with a similar wing) and 1109 cm- I (with no wing as an isolated narrow band).
If photoexcitation is associated with an overall selfdoping process with the formation of bipolarons the interpretation of the spectra is identical to that proposed for chemical doping. It can be seen from the spectra of Fig. 7 that P (T + 1) is again the most conjugated polymer, also exhibiting a broad distribution of conjugation lengths. P(T+2) is less conjugated while electrons in P(T+3) are strongly localized with a small distribution of conjugation lengths.
X. CONCLUSIONS
Two kinds of conclusions can be derived from this work, one refers to problems of general validity, the other is mostly focused on the specific case of methylene bridged polythiophenes.
It has been shown that the electronic gap in thiophene oligomers is not very sensitive to the torsional angle e, at least within the values of e considered for the methylene bridged (syn) bithienyls: eT+1ZOo, e T+2z20°, e T+3 z30o. 11 This is in accordance with the conclusions derived from a comprehensive analysis of the E/e in a large class of thiophene derivatives,8,24 indicating that the torsional
J. Chem. Phys., Vol. 98, No.6, 15 March 1993
Downloaded 30 Apr 2013 to 198.91.37.2. This article is copyrighted as indicated in the abstract. Reuse of AIP content is subject to the terms at: http://jcp.aip.org/about/rights_and_permissions
7
6
s
1"\
< ....... 4
C ~ 'tl e ., ...,
11-10:. 2
1800
(a)
8
7
6
4
3
2
(b)
Zerbi et al.: Spectroscopy of polythiophenes
V3 'V4 115
)
1400
frequen.c.y
)
J"" _"
pJ ~
i..l
1000
-1 (cn> )
8~ A \
AA I I I I I I I I I I I I I I I
1800 1400 1000 600
-1 frequency (cn> )
600
I I
4539
'V6
200
200
FIG. 5. Calculated frequency (a) and intensity (b) dispersions of the totally symmetric Ag modes of poly thiophene. In these calculations poly thiophene is supposed to be trans and fully coplanar. These results are taken from Ref. 22 and should be considered as indicative of the trend, since at the time of the calculations the knowledge of the vibrational force fields was very limited, especially concerning the inter-ring interaction force constants.
J. Chern. Phys., Vol. 98, No.6, 15 March 1993
Downloaded 30 Apr 2013 to 198.91.37.2. This article is copyrighted as indicated in the abstract. Reuse of AIP content is subject to the terms at: http://jcp.aip.org/about/rights_and_permissions
4540 Zerbi et al.: Spectroscopy of polythiophenes
~ S S n
~ S S n
------- B
___ c \ __ 0
A~ ____________ _
FIG. 6. Scheme of the photogeneration of self-trapped bipolarons in poly aromatic polyconjugated systems. This process should find suitable experimental evidence for the various proposed steps.
potential is almost flat when 8=0· up to 8:::;30· both in the ground and the first excited electronic state. On the contrary Eg of 3,3' -dimethyl-2,2' -bithiophene is noticeably blueshifted, as the molecule is strongly conformationally distorted from planarity.42
The ECC theory is well supported in these compounds which show typical spectral patterns and shifts, as observed in all the thiophene derivatives studied by our group. The characteristic Raman active va shifts towards lower frequencies when delocalization increases: its intensity decreases on moving to lower frequencies, being lent to the strong Raman line due to the ring stretching mode.
If the system is conformationally distorted (either within or between monomeric units) the lowering of the symmetry causes the mechanical coupling Qf the H mode with other modes, with transfer of intensity. The simultaneous lowering of Va and the increase of the intensity of the spectrum in the range 1400-1300 cm -1 can indicate conformational distortion. More theoretical studies are needed for a better understanding of this dynamical problem.
While Eg is not a very sensitive probe to conformational distorsion the Raman spectrum is a sensitive probe of conformational distortion through the H mode.
It has been proven that doping induced ir spectra as well as photoinduced ir spectra can become very useful
Q)
u c ct1 .c .... o en .c ct1
500
wavenumber (cm-1)
FIG. 7. Infrared spectra obtained by pump-and-probe method of the photogenerated species in peT + 1) (3060 scans), peT +2) (3120 scans), and P(T+3) (2205 scans). For the experimental details see Ref. 40.
tools in probing the delocalization of the material and the polydispersivity in conjugation lengths. Furthermore it becomes clear that photoexcitation is the cleanest (non chemical) way to produce "self-doping" in these polyconjugated systems.
The vibrational spectra of methylene bridged dithienyls show that T + 1 and P (T + 1) have the largest interand intramonomer delocalization. The monomeric unit may be coplanar, but some ring puckering may also occur because strain is induced by the single CH2 group. II electrons are strongly localized in T + 3 and P (T + 3) while the delocalization is intermediate and not very large for T + 2 and peT +2).
The polydispersivity of conjugation lengths decreases with increasing the number of methylene groups in the
J. Chern. Phys., Vol. 98, No.6, 15 March 1993
Downloaded 30 Apr 2013 to 198.91.37.2. This article is copyrighted as indicated in the abstract. Reuse of AIP content is subject to the terms at: http://jcp.aip.org/about/rights_and_permissions
Zerbi et al.: Spectroscopy of polythiophenes 4541
bridge. P (T + 3) turns out to be a polymer where 'TT' electrons are highly localized because the trimethylene bridge forces the thiophene rings to be almost orthogonal.
The largest delocalization in P (T + 1) is also favored by the injection of electrons caused by the hyperconjugation effect of the single CH2 bridging group. The infrared spectra give strong and unquestionable evidence of hyperconjugation. 16 This result is new and very relevant to the search for new structures with improved delocalization, structures which may provide materials with large electrical conductivity or nonlinear optical response.
The electrical conductivities 0' [S/cm] reported ll for the polymers are: O'P(T+ 1) =40, O'p(T+2) = 1.5, O'p(T+3) =3. The drop in conductivity could be associated with the decrease of intramonomer delocalization, idea that motivated the synthesis of the molecules studied in this work.
The certainty that intermolecular hopping of the charge carrier gives a relevant contribution to conductivity comes from different observations. That the Raman spectrum is a probe for intramolecular delocalization is evident from many references quoted in this paper. In Sec. VII of this paper the Raman spectra have been used for the study of delocalization in the pristine polymers and thus it becomes apparent that delocalization in peT +3) is extremely limited. The conformational distortions both within the monomer unit and between monomer units are such that 'TT' electrons are highly localized in P (T + 3 ) where the Raman spectrum looks very similar to that observed in short oligomers.8,24 On the other hand, the electrical conductivity of this material is not negligible if compared with other polyconjugated materials, which show values of 0' in the range 10-2_10- 6 S/cm. The only way to account for this fact is to ascribe the observed conductivity mostly to interchain hopping processes. The scenario for the description of the conductivity in P (T + 3) is that dopant has formed a charge carrier, but the intramolecular hopping in this molecule is very restricted by conformational distortions and the only way to respond to an applied electric field is to hop from molecule to molecule. Further studies on other model compounds are in progress.
ACKNOWLEDGMENTS
This work has been supported by Consiglio Nazionale delle Ricerche, Progetto Finalizzato Nuovi Materiali; publication no. 9 by the group at the Politecnico of Milano. We thank Bruker Co. for the use of their FT-Raman spectrometer.
I For a general discussion see A. J. Heeger, in Handbook of Conducting Polymers, edited by T. A. Skotheim (Dekker, New York, 1986), Vol. 2, p.729.
2W. P. Su, J. R. Schrieffer, and A. J. Heeger, Phys. Rev. B 22, 2099 (1980).
3 See, for instance, G. B. Street, in Handbook of Conducting Polymers, edited by T. A. Skotheim (Dekker, New York, 1986), Vol. 1, p. 265.
4See, for instance, G. Tourillon, Ref. 3, p. 293. sSee, for instance, A. G. MacDiarmid, Ref. 3, p. 689. 6p. N. Prasad and D. R. Ulrich, Non Linear Optical and Electroactive Polymers (Plenum, New York, 1988); M.-T. Zao, B. P. Singh, and P. N. Prasad, J. Chern. Phys. 89, 5535 (1988).
7E. E. Havinga, 1. Ratte, E. W. Meijer, W. Ten Hoeve, and H. Wynberg, Synth. Met. 41, 1 (1991).
8G. Zerbi, M. L. Rivola, and E. E. Havinga, J. Chern. Phys. (submitted).
9K. Krebs, S. Sandroni, and G. Zerbi, J. Chern. Phys. 40, 3502 (1964). IOD. A. Santos, D. S. Galvao, B. Laks, and M. C. dos Santos, Chern.
Phys. Lett. 184, 579 (1991). II E. Brenna, Proceedings of the Third International Conference on Het
eroatom Chemistry, Riccione, Italy, 1992, paper C45, p. 47. 12 A. T. Jeffries, K. C. Moore, D. M. Ondeya, A. W. Springsteen, and D.
W. H. Macdowell, J. Org. Chern. 46, 2885 (1981). 13S. Gronowitz and P. Pedaja, Tetrahedron 34, 587 (1978). 14F. Sannicolo and G. Zerbi, Mol. Cryst. Liq. Cryst. (in press). ISR. RadaeIli, thesis in physics, University of Milano, 1992. 16C. Castiglioni, R. Radaelli, and G. Zerbi (in press). 17 A. E. Gillam and E. S. Stem, An Introduction to Electronic Absorption
Spectroscopy (Arnold, New York, 1955). ISC. Castiglioni, M. Gussoni, J. T. Lopez Navarrete, and G. Zerbi, Solid
State Commun. 65, 625 (1988). 19For a review mostly focused on polyenes and polyacetylene see M.
Gussoni, C. Castiglioni, and G. Zerbi, in Vibrational Spectroscopy of New Materials, edited by R. J. H. Clark and R. E. Hester (Wiley, New York, 1992), Vol. 11, p. 251.
2oFor a review focused on polyaromatic materials see G. Zerbi, M. Gussoni, and C. Castiglioni, in Conjugated Polymers, edited by J. L. BrMas and R. Silbey (K1uwer, Amsterdam, 1992), p. 435.
21B. Tian and G. Zerbi, J. Chern. Phys. 92, 3866, 3892 (1990). 22J. T. Lopez Navarrete and G. Zerbi, J. Chern. Phys. 94, 957, 965
(1991). 23B. Tian, G. Zerbi, R. Schenk, and K. Miillen, J. Chern. Phys. 95, 3191
(1991); B. Tian, G. Zerbi, and K. Miillen, ibid. 95, 3198 (1991). 24M. L. Rivola, thesis in physics, University of Milano, 1992. 2SV. K. Belsky, V. E. Zavodnik, and V. M. Vozzhennikov, Acta Crystal-
10gr. C 40, 1210 (1984); G. M. Brown and M. H. Bortner, Acta Crystallogr.7, 139 (1954); D. M. Bums and J. Iball, Nature (London) 173, 635 (1954).
26R. E. Gerkin, A. P. Lundstedt, and W. J. Reppart, Acta Crystallogr. C 40, 1892 (1984).
27 (a) Gas Phase: Electron Diffraction: V. Schomaker and L. Pauling, J. Am. Chern. Soc. 61, 1769 (1939); Microwaves: L. H. Scharpen and V. W. Laurie, J. Chern. Phys. 43, 2765 (1965); R. C. Benson and W. H. Flygare, J. Am. Chern. Soc. 92, 7523 (1970); (b) Nematic matrix: NMR: C. A. Veracini, M. Guidi, M. Longeri, and A. M. Serra, Chern. Phys. Lett. 24, 99 (1974); (iii) Solid: X-ray diffraction: G. Liebling and R. E. Marsh, Acta Crystallogr. 19, 202 (1965).
28M. Traetteberg, Acta Chern. Scand. 22, 2305 (1968); H. Oberhammer and S. H. Bauer, J. Am. Chern. Soc. 91, 10 (1969); G. DaJlinga and L. H. Toneman, J. Mol. Strnct. 1, 11 (1967-68).
29S. S. Butcher, J. Chern. Phys. 42, 1830 (1965). 30W. Auf der Heyde and W. Liittke, Chern. Ber. 111, 2384 (1978). 31 A. Unanue and P. BothoreI, Bull. Soc. Chim. Fr. 1640 (1966); H.
Suzuki, Bull. Soc. Chim. Jpn. 32,1340 (1959); E. A. Braude and W. F. Forbes, J. Chern. Soc. 3776 (1955); R. B. Bates, F. A. Camou, V. V. Kane, P. K. Mishra, K. Suvannachut, and J. J. White, J. Org. Chern. 54, 311 (1989). Recent data from x-ray diffraction at 128 K are reported by R. Cosmo, T. W. Hambley, and S. Sternhell, J. Org. Chern. 52, 3119 (1987).
32 Gas phase: Electron Diffraction: J. F. Chiang and S. H. Bauer, J. Am. Chern. Soc. 88, 420 (1966); K. Hagen and K. Traetteberg, Acta Chern. Scand. 26, 3643 (1972); Microwave Spectroscopy: T. K. Avirah, T. B. Malloy, Jr., and R. L. Cook, J. Chern. Phys. 71, 2194 (1979); Liquid Phase: Vibrational Spectra: B. Schrader and A. Ansmann, Angew. Chern. 87, 345 (1975), Int. Ed. 14, 364 (1975); A. Ansmann and B. Schrader, J. Raman Spectrosc. 5, 281 (1976).
33Data from NMR spectroscopy: P. Crews, J. Chern. Soc. D 1971, 583. 34C. A. Coulson, B. O'Leary, and R. B. MalIion, Huckel Theory for
Organic Chemists (Academic, New York, 1978), p. 49. 35 A. Streitwieser, Molecular Orbital Theory for Organic Chemists (Wiley,
New York, 1961), p. 332. 36C. Castiglioni, M. Gussoni, M. Miragoli, and G. Zerbi, Spectrochim.
Acta A 41, 371 (1985).
J. Chern. Phys., Vol. 98, No.6, 15 March 1993
Downloaded 30 Apr 2013 to 198.91.37.2. This article is copyrighted as indicated in the abstract. Reuse of AIP content is subject to the terms at: http://jcp.aip.org/about/rights_and_permissions
4542 Zerbi et al.: Spectroscopy of polythiophenes
37 C. Castiglioni, R. Rabaioli, M. Gussoni, and G. Zerbi, Synth. Met. 41, 3452 (1991).
3SJ. T. Lopez Navarrete and G. Zerbi, Solid State Cornrnun. 74, 199 (1990).
39Por an introductory discussion see J. Orenstein, Ref. 1, p. 1297. 4OM. Veronelli and G. Zerbi (to be published). 41Por a review see H. Bleier, Synth. Met. (in press). 42G. Zerbi, R. RadaeIli, and M. L. Rivola, J. Chern. Phys. (in press).
J. Chern. Phys., Vol. 98, No.6, 15 March 1993
Downloaded 30 Apr 2013 to 198.91.37.2. This article is copyrighted as indicated in the abstract. Reuse of AIP content is subject to the terms at: http://jcp.aip.org/about/rights_and_permissions