Supporting Information Exciton delocalization and dynamics ... · Supporting Information Exciton...
17
1 Supporting Information Exciton delocalization and dynamics in helical π-stacks of self-assembled perylene bisimides Jong Min Lim, a Pyosang Kim, a Min-Chul Yoon, a Jooyoung Sung, a Volker Dehm, b Zhijian Chen, b,c Frank Würthner,* ,b and Dongho Kim* ,a a Department of Chemistry, Yonsei University, Seoul, 120-749, Korea, b Institut für Organische Chemie & Center for Nanosystems Chemistry, Universität Würzburg, Würzburg, 97074, Germany, and c School of Chemical Engineering and Technology, Tianjin University, Tianjin, 300072, China [email protected] , [email protected] RECEIVED DATE (to be automatically inserted after your manuscript is accepted if required according to the journal that you are submitting your paper to) Electronic Supplementary Material (ESI) for Chemical Science This journal is © The Royal Society of Chemistry 2012
Transcript of Supporting Information Exciton delocalization and dynamics ... · Supporting Information Exciton...
1
Supporting Information
Exciton delocalization and dynamics in helical π-stacks
of self-assembled perylene bisimides
Jong Min Lim,a Pyosang Kim,a Min-Chul Yoon,a Jooyoung Sung,a Volker Dehm,b Zhijian Chen,b,c Frank
Würthner,*,b and Dongho Kim*,a
aDepartment of Chemistry, Yonsei University, Seoul, 120-749, Korea, bInstitut für Organische Chemie
& Center for Nanosystems Chemistry, Universität Würzburg, Würzburg, 97074, Germany, and cSchool
of Chemical Engineering and Technology, Tianjin University, Tianjin, 300072, China
[email protected], [email protected]
RECEIVED DATE (to be automatically inserted after your manuscript is accepted if required
according to the journal that you are submitting your paper to)
Electronic Supplementary Material (ESI) for Chemical ScienceThis journal is © The Royal Society of Chemistry 2012
2
EXPERIMENTAL METHODS
Sample preparation Tetracarboxylic acid bisimide (PBI) dyes 1, 2, 3, and 4 were synthesized
according to previously reported procedures.1-3 In all spectroscopic experiments, chloroform and
methylcyclohexane were used as solvent (Sigma-Aldrich, spectrophotometric grade) without further
purification. For quencher embedment experiments, standard solution of PBI dyes 1 and 4 are prepared
in chloroform solvent. After mixing two standard solutions of PBI 1 and 4 with proper ratios (1000, 100,
10, and 5 versus 1), chloroform solvent was evaporated and the hetero-PBI dyes were dissolved in
methylcyclohexane solvent. By using this solution of hetero-PBI dyes, we have examined the
fluorescence spectra and the pump-power dependency in fs-transient absorption measurements.
Steady-state absorption and fluorescence measurements UV-vis spectra were recorded with a
Varian Cary 5000 UV-Vis-NIR spectrophotometer and fluorescence spectra were recorded with a
Hitachi model F-2500 fluorescence spectrophotometer.
Fluorescence lifetime and time-resolved fluorescence anisotropy A time-correlated single-photon-
counting (TCSPC) system was used for measurements of spontaneous fluorescence decay and
fluorescence anisotropy decay. As an excitation light source, we used a mode-locked Ti:sapphire laser
(Spectra Physics, MaiTai BB) which provides ultrashort pulse (80 fs at full width half maximum, fwhm)
with high repetition rate (80 MHz). This high repetition rate slows down to 1M ~ 800 kHz by using
homemade pulse-picker. The pulse-picked output pulse was frequency-doubled by a 1 mm thickness of
a BBO crystal (EKSMA). The fluorescence was collected by a microchannel plate photomultiplier
(MCP-PMT, Hamamatsu, R3809U-51) with a thermoelectric cooler (Hamamatsu, C4878) connected to
a TCSPC board (Becker&Hickel SPC-130). The overall instrumental response function was about 25 ps
(fwhm). A vertically polarized pump pulse by a Glan-laser polarizer was irradiated to samples, and a
sheet polarizer, set at an angle complementary to the magic angle (54.7°), was placed in the
fluorescence collection path to obtain polarization-independent fluorescence decays.
Femtosecond transient absorption measurement Femtosecond (fs) time-resolved transient
absorption (TA) spectra were recorded using a spectrometer consisting of a homemade noncollinear
optical parametric amplifier (NOPA) pumped by a Ti:sapphire regenerative amplifier system
Electronic Supplementary Material (ESI) for Chemical ScienceThis journal is © The Royal Society of Chemistry 2012
3
(Quantronix, Integra-C) operating at 1 kHz repetition rate coupled with an optical detection system. The
generated visible NOPA pulses had a pulse width of ~ 100 fs and an average power of 1 mW in the
range 480-700 nm, which were used as pump pulses. White light continuum (WLC) probe pulses were
generated using a sapphire window (2 mm of thickness) by focusing of small portion of the fundamental
800 nm pulses that were picked off by a quartz plate before entering into the NOPA. The time delay
between pump and probe beams was carefully controlled by causing the pump beam to travel along a
variable optical delay (Newport, ILS250). Intensities of the spectrally dispersed WLC probe pulses are
monitored by a miniature spectrograph (OceanOptics USB2000+). To obtain the time-resolved transient
absorption difference signal (ΔA) at a specific time, the pump pulses were chopped at 25 Hz and the
absorption spectra intensities were saved alternately with or without pump pulse. Typically, 6000 pulses
were used to excite the samples so as to obtain a TA spectra at a particular delay time. The polarization
angle between the pump and probe beams was set at the magic angle (54.7°) using a Glan-laser
polarizer with a half-wave retarder so as to prevent polarization-dependent signals. The cross-
correlation fwhm in the pump-probe experiments was less than 200 fs and the chirp of WLC probe
pulses was measured to be 800 fs in the 400-1250 nm region. To minimize chirp, all-reflection optics in
the probe beam path and a 2 mm path length quartz cell were used. After the TA experiments, the
absorption spectra of all compounds was carefully checked so as to avoid artifacts arising from, e.g.,
photo-degradation or photo-oxidation of the samples in question. HPLC grade solvents were used in all
steady-state and time-resolved spectroscopic studies.
Femtosecond transient absorption anisotropy decay Dual-beam femtosecond time-resolved
transient absorption (TA) spectrometer consisted of two independently-tunable home-made noncollinear
optical parametric amplifiers (NOPA) pumped by a regeneratively amplified Ti:sapphire laser system
(Spectra-Physics, Hurricane-X) operating at 3 kHz repetition rate and an optical detection system. The
NOPA was based on non-collinearly phase-matching geometry, which was easily color-tuned by
controlling optical delay between white light continuum seed pulses (450-1400 nm) and visible pump
pulses (400 nm) produced by using a sapphire window and BBO crystal, respectively. The generated
Electronic Supplementary Material (ESI) for Chemical ScienceThis journal is © The Royal Society of Chemistry 2012
4
visible OPA pulses had a pulse width of ~ 35 fs and an average power of 10 mW at 3 kHz repetition rate
in the range 500-700 nm after a fused-silica prism compressor. Two OPA pulses were used as the pump
and probe pulses, respectively, for TA measurement. The probe beam was split into two parts. The one
part of the probe beam was overlapped with the pump beam at the sample to monitor the transient
(signal), while the other part of the probe beam was passed through the sample without overlapping the
pump beam to compensate the fluctuation of probe beam. The time delay between pump and probe
beams was carefully controlled by making the pump beam travel along a variable optical delay
(Newport, ILS250). To obtain the time-resolved transient absorption difference signal at specific
wavelength, the monitoring wavelength was selected by using a narrow interference filter (FWHM ~10
nm). By chopping the pump pulses at 47 Hz, the modulated probe pulses as well as the reference pulses
were detected by two separate photodiodes (New Focus, Femtowatt Photoreceiver). The modulated
signals of the probe pulses were measured by a gated-integrator (SRS, SR250) and a lock-in amplifier
(EG&G, DSP7265) and stored in a personal computer for further signal processing. In general
experimental conditions, time-resolutions of less than 50 fs were achieved. For anisotropy
measurement, both I|| and I⊥ signals were collected simultaneously by combination of polarizing beam-
splitter cube and dual lock-in amplifiers as following equation:4
)2/(()()( |||| ⊥⊥ +−= IIIItr
where I|| and I⊥ represent TA signals with the polarization of the pump and probe pulses being
mutually parallel and perpendicular respectively. The pump pulse was set to vertical polarization and
that of probe pulse was set to 45° with respect to the pump pulse by using Glan-laser polarizers and
half-wave plates. After the probe pulse passes through the sample cell, it was split by a polarizing beam-
splitter cube and then detected by two separate photodiodes. Two gated-integrators and two lock-in
amplifiers record the signal simultaneously within a single scan. As a standard anisotropy measurement
showed a clean single exponential decay with reorientational relaxation times of 122.1 ± 0.3 ps and the
initial anisotropy r(0) value of 0.39 ± 0.02 for rhodamine 6G dye in methanol, which are well-matched in
other reference.5 For all TAA measurements, wavelength of pump and probe pulses were set to 550 nm
Electronic Supplementary Material (ESI) for Chemical ScienceThis journal is © The Royal Society of Chemistry 2012
5
with an average power of less than 40 μW and 690 nm, respectively. A thin absorption cell with a
pathlength of 500 μm was used to eliminate additional chirping.
Fluorescence up-conversion spectroscopy A femtosecond fluorescence up-conversion apparatus
was used for the time-resolved spontaneous fluorescence. As an excitation light source, we used a
mode-locked Ti:sapphire laser (Spectra Physics, MaiTai BB) which provides ultrashort pulse (80 fs at
full width half maximum, fwhm) with high repetition rate (80 MHz). The second harmonic of the
fundamental generated by a 200-μm thick BBO crystal served as pump pulse. Residual fundamental
pulse was used as a gate pulse. The pump beam was focused onto a 500-μm thick quartz cuvette
containing sample solution using a 5-cm focal length plano-convex lens with a magic angle (54.7°) in
order to prevent polarization-dependent signals. The cuvette was mounted on a motor-driven stage and
moved constantly back and forth to minimize photo-degradation. Collection of the fluorescence and
focusing into a 500 μmm-thick BBO crystal for frequency conversion was achieved by a reflecting
microscope objective lens (Coherent). The FWHM of the cross-correlation function between the
scattered pump pulse and the gate pulse is measured to be ~340 fs. The average excitation power was
kept at a level below 2 mW in order to minimize thermal lens effect. In this excitation intensity regime
the fluorescence dynamics was be independent of the excitation intensity for all samples.
References
1) Z. Chen, V. Stepanenko, V. Dehm, P. Prins, L. D. A. Siebbeles, J. Seibt, P. Marquetand, V. Engel
and F. Würthner, Chem. Eur. J, 2007, 13, 436-449.
2) Z. Chen, U. Baumeister, C. Tschierske and F. Würthner, Chem. Eur. J, 2007, 13, 450-465.
3) F. Würthner, C. Thalacker, S. Diele and C. Tschierske, Chem. Eur. J, 2001, 7, 2245-2253.
4) C. K. Min, T. Joo, M.-C. Yoon, C. M. Kim, Y. N. Hwang, D. Kim, N. Aratani, N. Yoshida and A.
Osuka, J. Chem. Phys., 2001, 114, 6750-6758.
5) L. A. Philips, S. P. Webb, S. W. Yeh and J. H. Clark, J. Phys. Chem., 1985, 89, 17-19.
Electronic Supplementary Material (ESI) for Chemical ScienceThis journal is © The Royal Society of Chemistry 2012
6
350 400 450 500 550 600 650 700 750
PBI 3
PBI 2
PBI 1
PBI 4
Flu
orescen
ce Inten
sity (No
rm.)
Wavelength (nm)
Ab
sorb
ance
(N
orm
.)
350 400 450 500 550 600 650 700 750
Flu
orescen
ce Inten
sity (No
rm.)
Ab
sorb
ance
(N
orm
.)
PBI 4
PBI 3
PBI 2
PBI 1
Wavelength (nm)
a)
b)
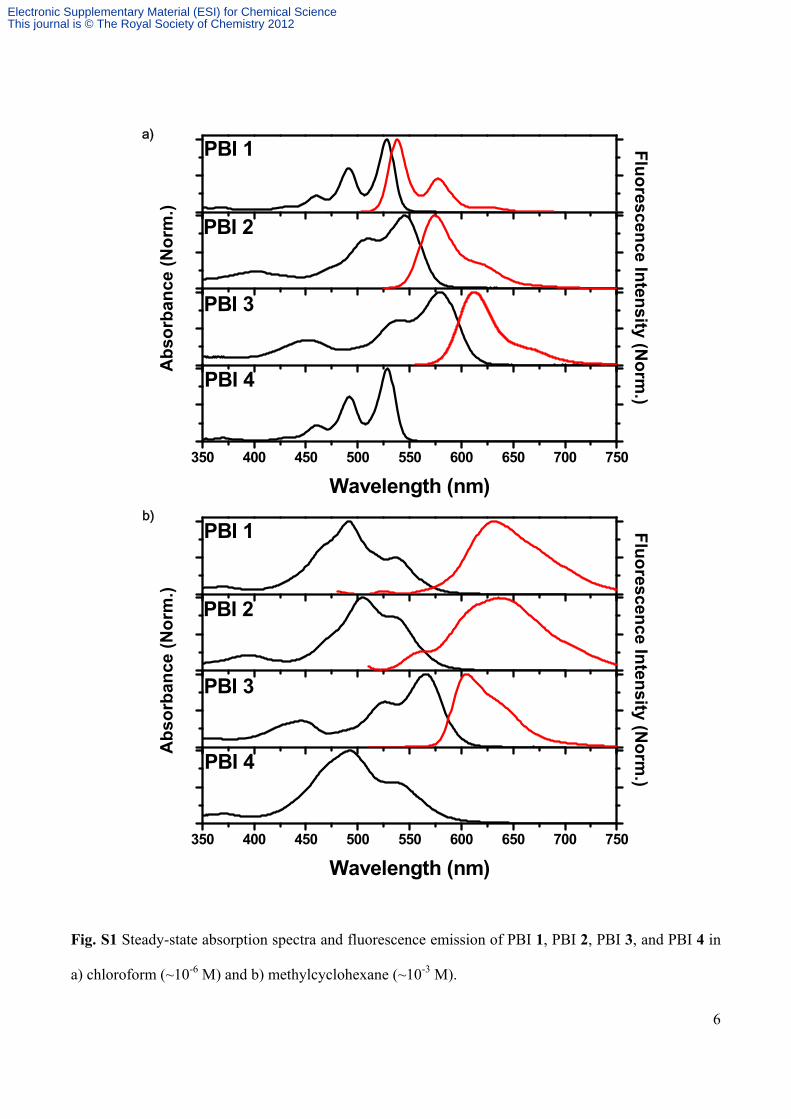
Fig. S1 Steady-state absorption spectra and fluorescence emission of PBI 1, PBI 2, PBI 3, and PBI 4 in
a) chloroform (~10-6 M) and b) methylcyclohexane (~10-3 M).
Electronic Supplementary Material (ESI) for Chemical ScienceThis journal is © The Royal Society of Chemistry 2012
7
0 20 40 60 80 1000.01
0.1
1
In
ten
sit
y(a
.u.)
Time (ns)
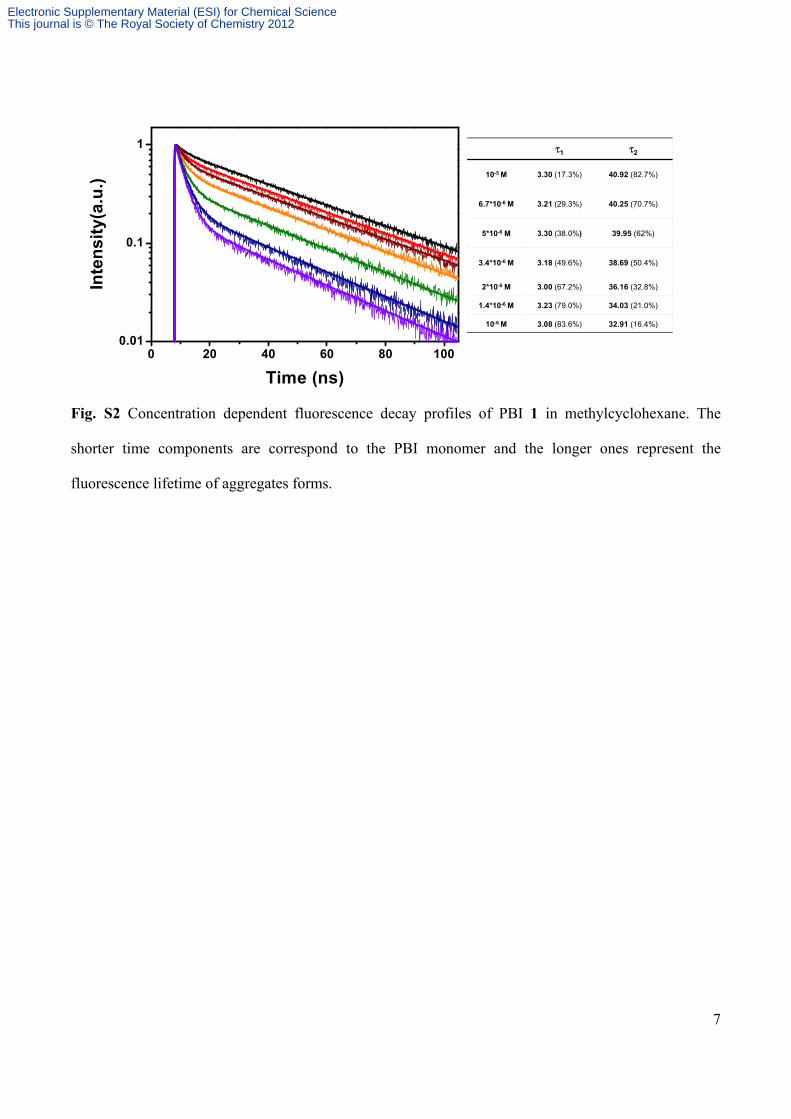
τ1 τ2
10-5 M 3.30 (17.3%) 40.92 (82.7%)
6.7*10-6 M 3.21 (29.3%) 40.25 (70.7%)
5*10-6 M 3.30 (38.0%) 39.95 (62%)
3.4*10-6 M 3.18 (49.6%) 38.69 (50.4%)
2*10-6 M 3.00 (67.2%) 36.16 (32.8%)
1.4*10-6 M 3.23 (79.0%) 34.03 (21.0%)
10-6 M 3.08 (83.6%) 32.91 (16.4%)
Fig. S2 Concentration dependent fluorescence decay profiles of PBI 1 in methylcyclohexane. The
shorter time components are correspond to the PBI monomer and the longer ones represent the
fluorescence lifetime of aggregates forms.
Electronic Supplementary Material (ESI) for Chemical ScienceThis journal is © The Royal Society of Chemistry 2012
8
~200 ps
~300 ps ~300 ps
0.0 0.5 1.0 1.5 2.00.0
0.2
0.4
0.6
0.8
1.0
1.2
In
ten
sity
(N
orm
.)
Time (ns)
10-7 Mλprobe = 650 nm
0.0 0.5 1.0 1.5 2.00.0
0.2
0.4
0.6
0.8
1.0
1.2
Inte
nsi
ty (
No
rm.)
Time (ns)
10-6 Mλprobe = 700 nm
0.0 0.5 1.0 1.5 2.00.0
0.2
0.4
0.6
0.8
1.0
1.2
Inte
ns
ity
(N
orm
.)
Time (ns)
10-5 Mλprobe = 700 nm
0.0 0.5 1.0 1.5 2.00.0
0.2
0.4
0.6
0.8
1.0
1.2
Inte
ns
ity
(N
orm
.)
Time (ns)
10-3 Mλprobe = 700 nm
a) b)
c) d)
~200 ps
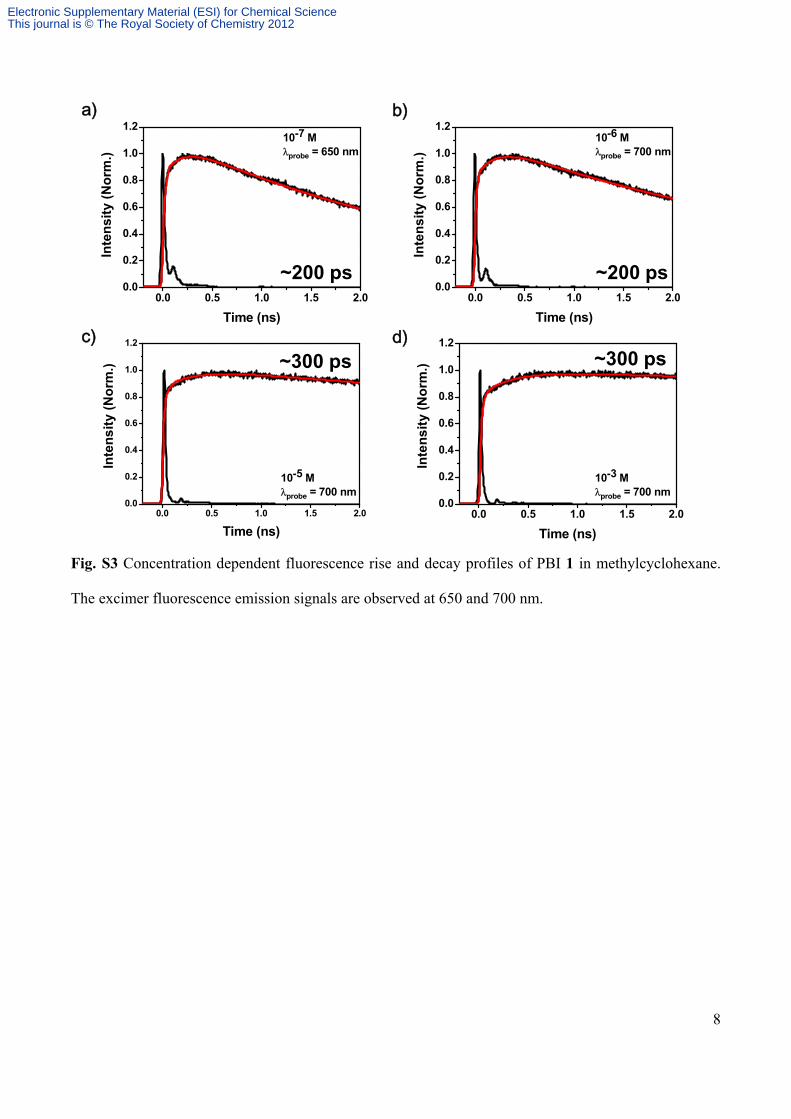
Fig. S3 Concentration dependent fluorescence rise and decay profiles of PBI 1 in methylcyclohexane.
The excimer fluorescence emission signals are observed at 650 and 700 nm.
Electronic Supplementary Material (ESI) for Chemical ScienceThis journal is © The Royal Society of Chemistry 2012
9
0 10 20 30 40 50 60
0.0
0.2
0.4
0.0
0.2
0.4
0.0
0.2
0.4
0.0
0.2
0.4
10-3 M
Time (ns)
λex = 450 nm
λprobe = 700 nm
10-6 M
3.4 X10⁻⁶ M
An
iso
tro
py
10-5 M
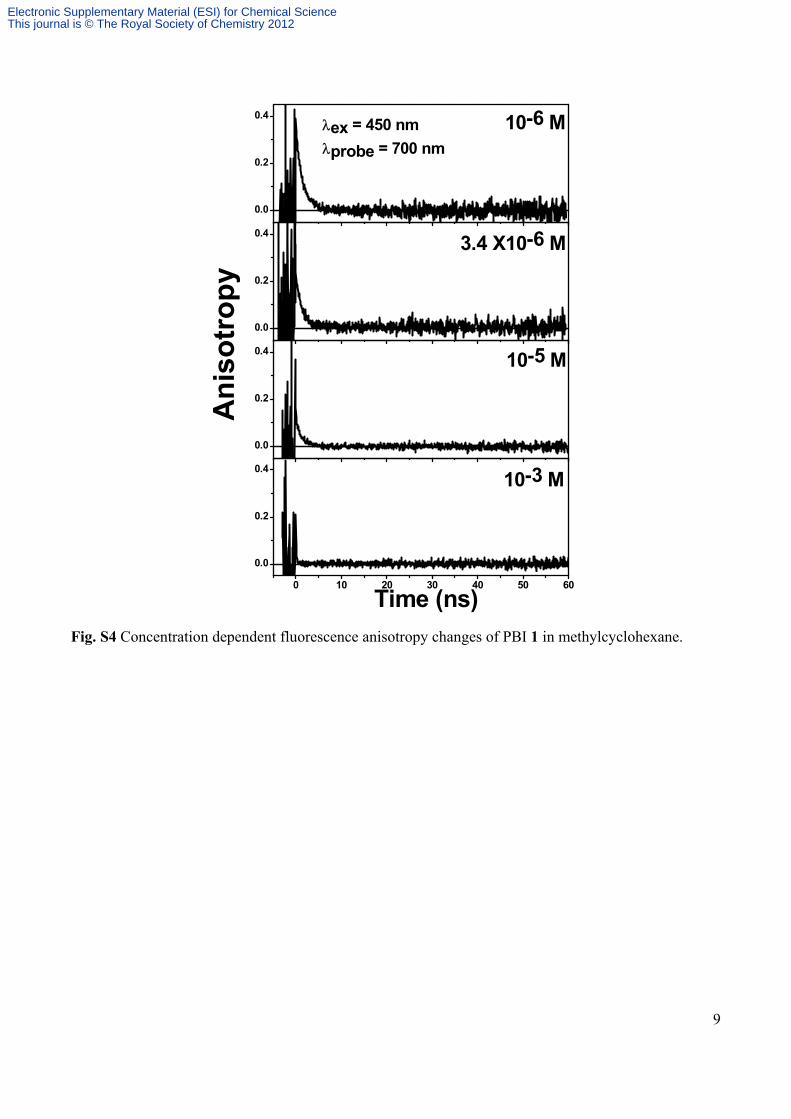
Fig. S4 Concentration dependent fluorescence anisotropy changes of PBI 1 in methylcyclohexane.
Electronic Supplementary Material (ESI) for Chemical ScienceThis journal is © The Royal Society of Chemistry 2012
10
0 2 4 6 8 10
0.0
0.2
0.4 τrot
= 1.5 ns
An
iso
tro
py
Time (ns)
0 2 4 6 8 10 12 14 16 18 20 22 240.0
0.2
0.4
0.6
0.8
1.0
τf = 3 ns
Inte
nsi
ty (
No
rm.)
Time (ns)
a)
b)
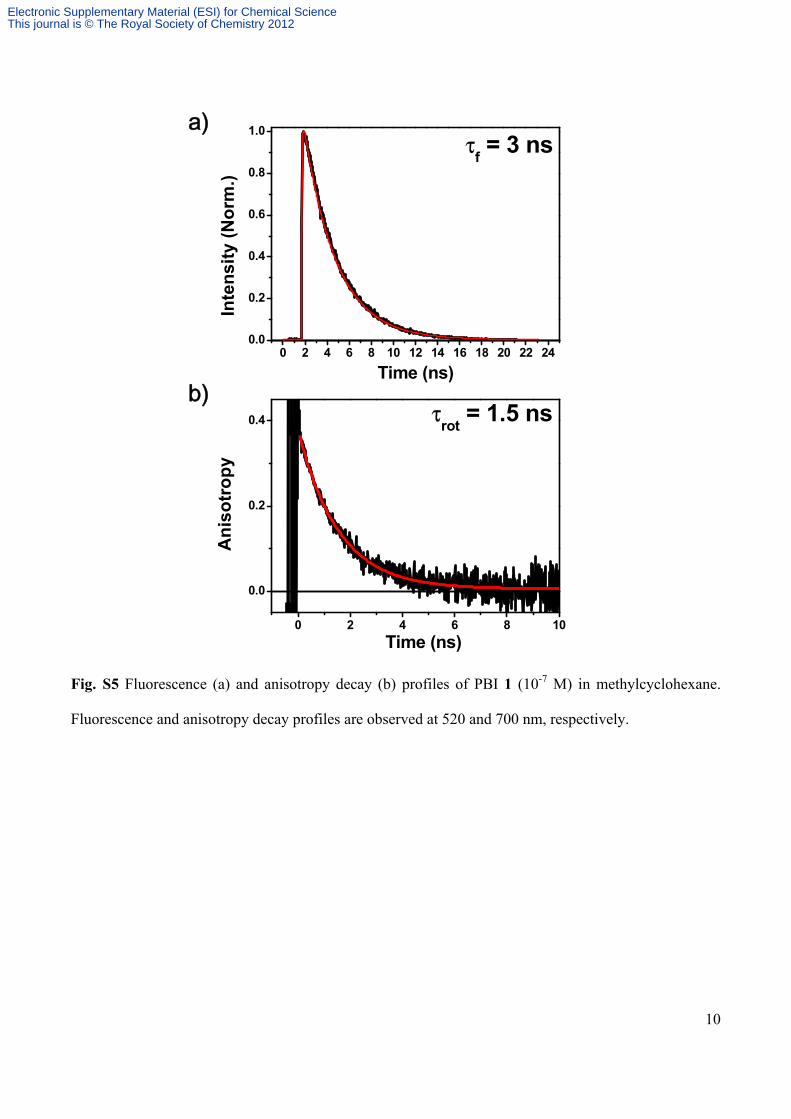
Fig. S5 Fluorescence (a) and anisotropy decay (b) profiles of PBI 1 (10-7 M) in methylcyclohexane.
Fluorescence and anisotropy decay profiles are observed at 520 and 700 nm, respectively.
Electronic Supplementary Material (ESI) for Chemical ScienceThis journal is © The Royal Society of Chemistry 2012
11
0 20 40 60 80 100
40
80
120
160
F
luo
resc
ence
Inte
nsi
ty
Time (ps)
τ (ps) = 0.8 (38.4 %) 19.3 (25.6 %) long (42.3 %)
in methylcyclohexaneλprobe
= 580 nm
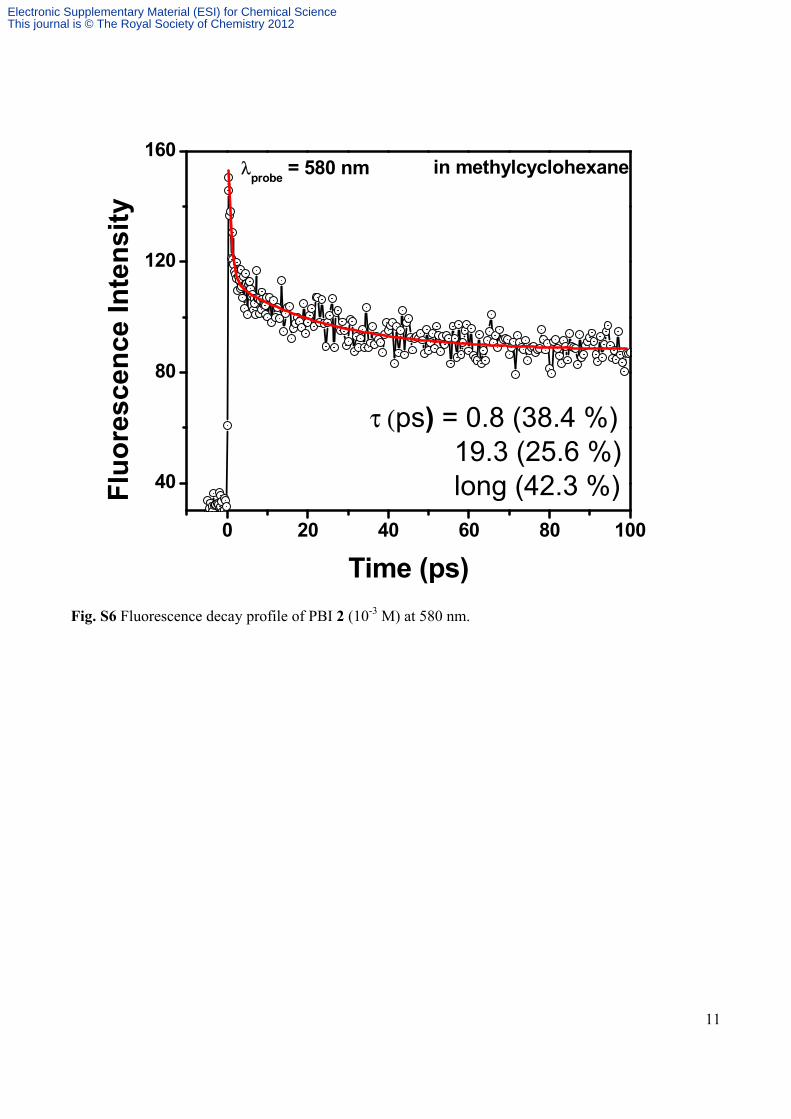
Fig. S6 Fluorescence decay profile of PBI 2 (10-3 M) at 580 nm.
Electronic Supplementary Material (ESI) for Chemical ScienceThis journal is © The Royal Society of Chemistry 2012
12
450 500 550 600 650 700 750 800 850
-0.3
-0.2
-0.1
0.0
0.1
0.2
0 500 1000 1500 2000 2500 3000
-0.10
-0.05
0.00
0.05
0.10
0.15
0.20
τs = 1.4 ns
λpump
= 530 nm
Time (ps)
λprobe
(nm) =
490 704
in CHCl3
λpump
= 530 nm
Δ
OD
Wavelength (nm)
Time (ps) -2 1 10 300 500 1000 2000 3000
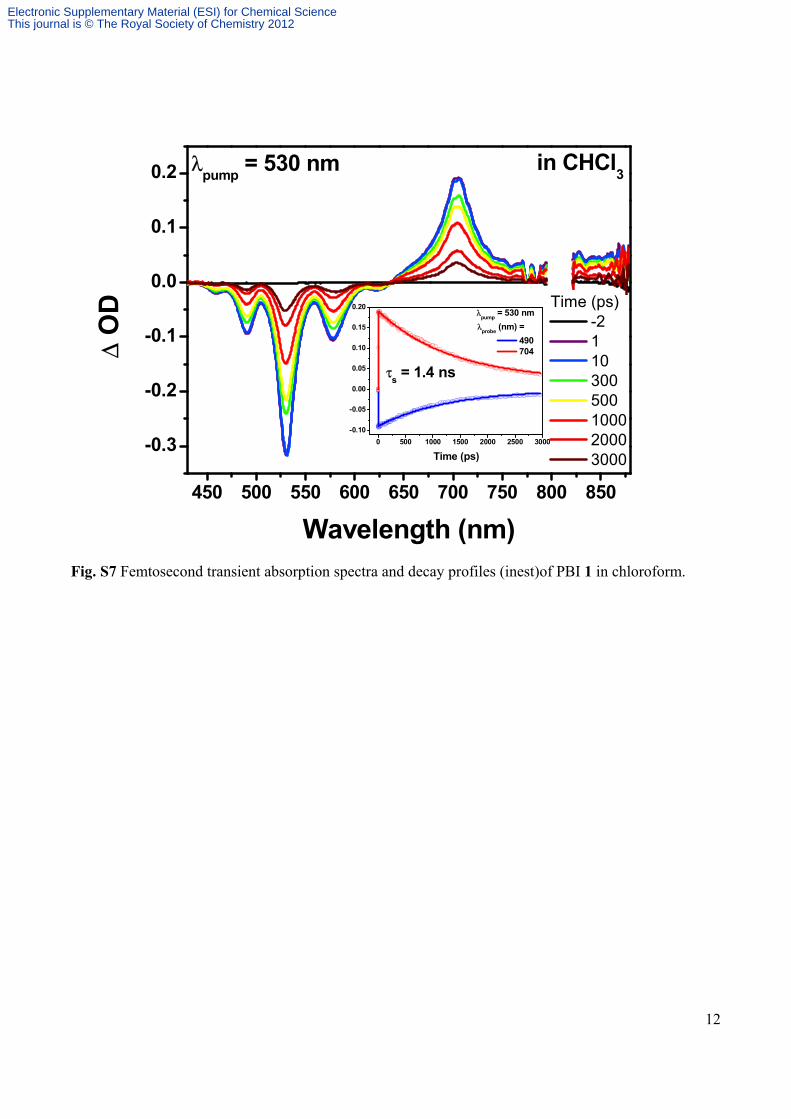
Fig. S7 Femtosecond transient absorption spectra and decay profiles (inest)of PBI 1 in chloroform.
Electronic Supplementary Material (ESI) for Chemical ScienceThis journal is © The Royal Society of Chemistry 2012
13
450 500 550 600 650 700 750
-0.2
-0.1
0.0
0.1in CHCl
3λ
pump = 550 nm
0 500 1000 1500 2000 2500 3000-0.10
-0.05
0.00
0.05
0.10
0.15
Time (ps)
λprobe
=
511 nm 704 nm
Δ
OD
Wavelength (nm)
Time (ps) -1 1
50 100 200 300 500 1000 2000 3000
τs = 2 ns
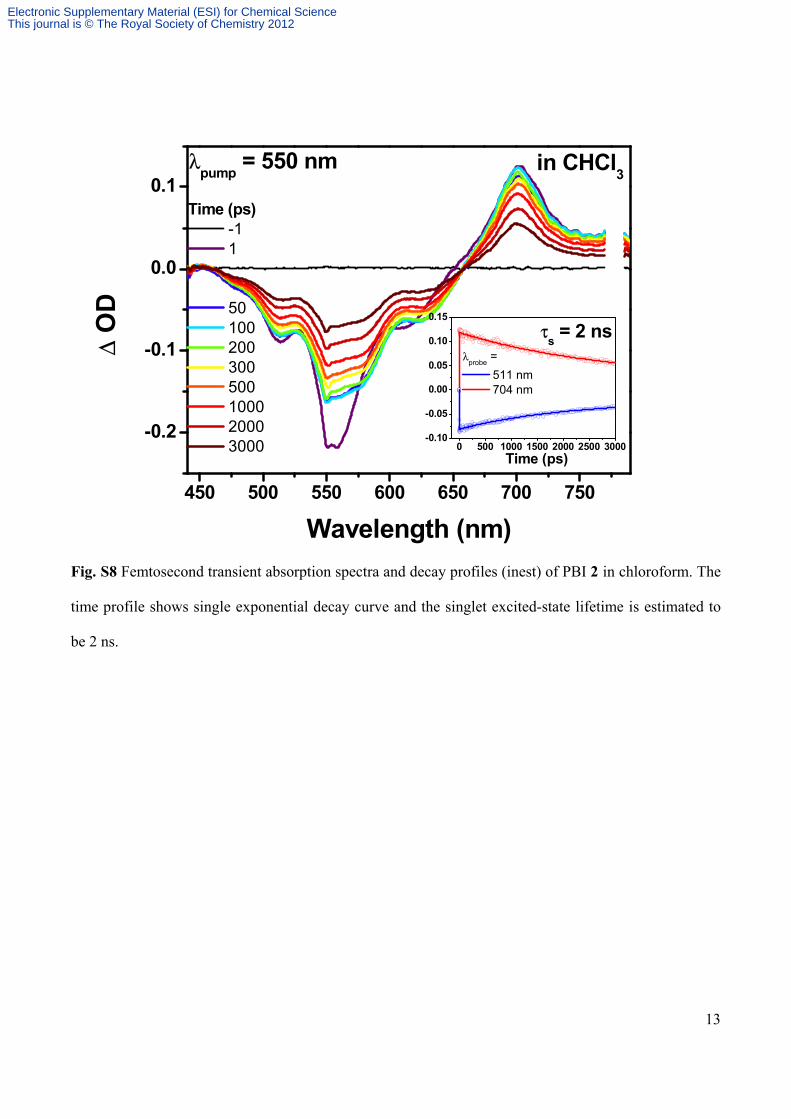
Fig. S8 Femtosecond transient absorption spectra and decay profiles (inest) of PBI 2 in chloroform. The
time profile shows single exponential decay curve and the singlet excited-state lifetime is estimated to
be 2 ns.
Electronic Supplementary Material (ESI) for Chemical ScienceThis journal is © The Royal Society of Chemistry 2012
14
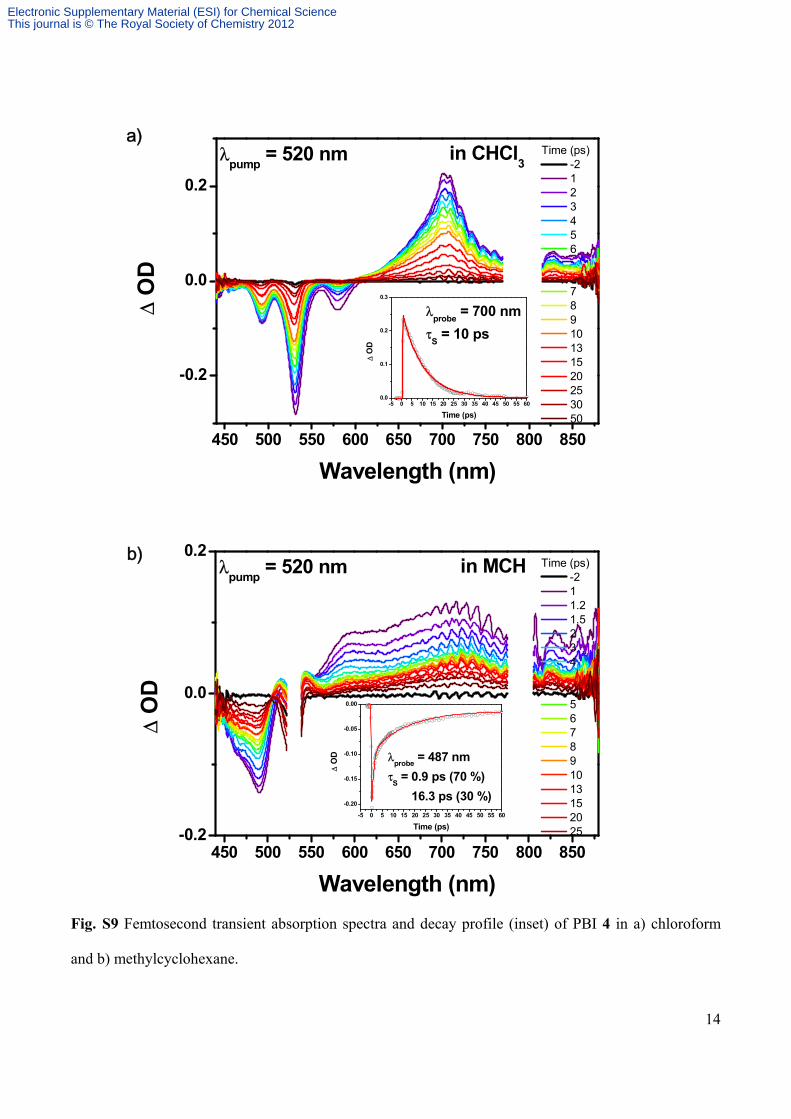
450 500 550 600 650 700 750 800 850
-0.2
0.0
0.2
in CHCl3
λpump
= 520 nm
-5 0 5 10 15 20 25 30 35 40 45 50 55 600.0
0.1
0.2
0.3
λprobe
= 700 nm
τS = 10 ps
Δ O
D
Time (ps)
Δ O
D
Wavelength (nm)
Time (ps) -2 1 2 3 4 5 6
7 8 9 10 13 15 20 25 30 50
450 500 550 600 650 700 750 800 850-0.2
0.0
0.2in MCHλ
pump = 520 nm
-5 0 5 10 15 20 25 30 35 40 45 50 55 60
-0.20
-0.15
-0.10
-0.05
0.00
λprobe
= 487 nm
τS = 0.9 ps (70 %)
16.3 ps (30 %)
Δ O
D
Time (ps)
Δ O
D
Wavelength (nm)
Time (ps) -2 1 1.2 1.5 2 3 4
5 6 7 8 9 10 13 15 20 25
a)
b)
Fig. S9 Femtosecond transient absorption spectra and decay profile (inset) of PBI 4 in a) chloroform
and b) methylcyclohexane.
Electronic Supplementary Material (ESI) for Chemical ScienceThis journal is © The Royal Society of Chemistry 2012
15
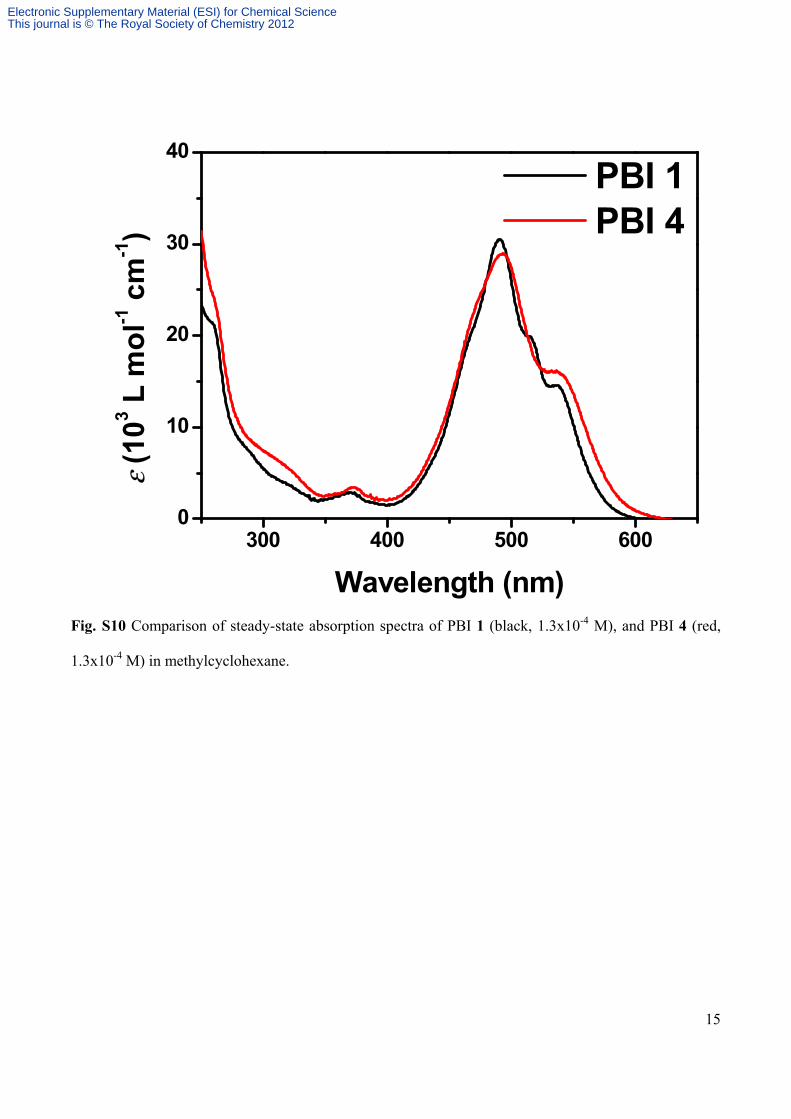
300 400 500 6000
10
20
30
40
ε (1
03 L
mo
l-1 c
m-1)
Wavelength (nm)
PBI 1 PBI 4
Fig. S10 Comparison of steady-state absorption spectra of PBI 1 (black, 1.3x10⁻⁴ M), and PBI 4 (red,
1.3x10⁻⁴ M) in methylcyclohexane.
Electronic Supplementary Material (ESI) for Chemical ScienceThis journal is © The Royal Society of Chemistry 2012
16
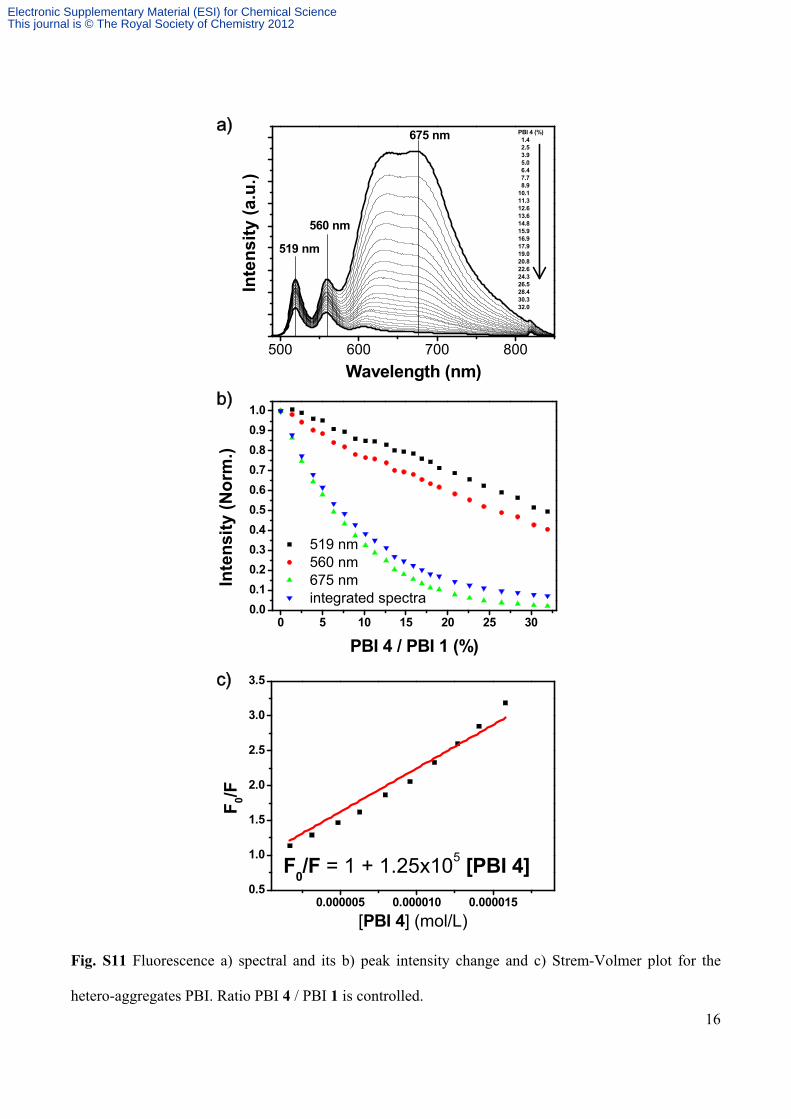
b)
a)
0.000005 0.000010 0.0000150.5
1.0
1.5
2.0
2.5
3.0
3.5
F0/F = 1 + 1.25x10⁵ [PBI 4]
F0/F
[PBI 4] (mol/L)
0 5 10 15 20 25 300.0
0.1
0.2
0.3
0.4
0.5
0.6
0.7
0.8
0.9
1.0
Inte
nsi
ty (
No
rm.)
PBI 4 / PBI 1 (%)
519 nm 560 nm 675 nm integrated spectra
500 600 700 800
560 nm
519 nm
PBI 4 (%) 1.4 2.5 3.9 5.0 6.4 7.7 8.910.111.312.613.614.815.916.917.919.020.822.624.326.528.430.332.0
Inte
nsi
ty (
a.u
.)
Wavelength (nm)
675 nm
c)
Fig. S11 Fluorescence a) spectral and its b) peak intensity change and c) Strem-Volmer plot for the
hetero-aggregates PBI. Ratio PBI 4 / PBI 1 is controlled.
Electronic Supplementary Material (ESI) for Chemical ScienceThis journal is © The Royal Society of Chemistry 2012
17
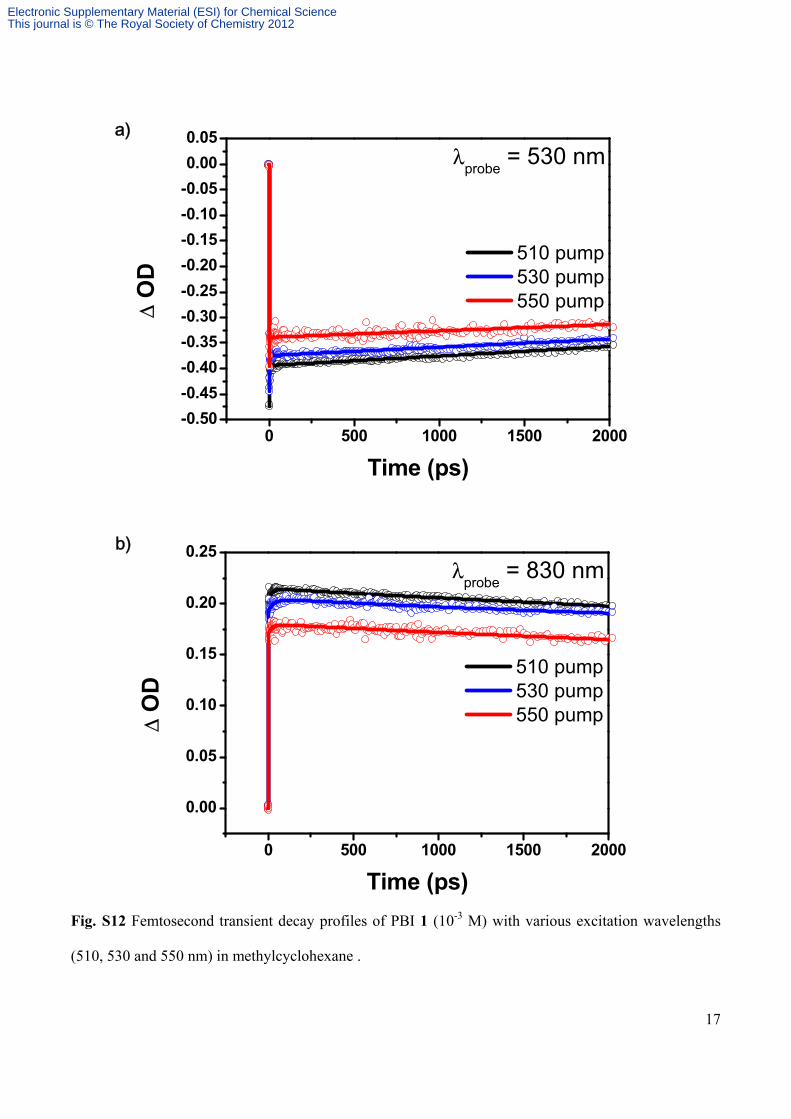
0 500 1000 1500 2000-0.50
-0.45
-0.40
-0.35
-0.30
-0.25
-0.20
-0.15
-0.10
-0.05
0.00
0.05λ
probe = 530 nm
Δ O
D
Time (ps)
510 pump 530 pump 550 pump
a)
b)
0 500 1000 1500 2000
0.00
0.05
0.10
0.15
0.20
0.25
Δ O
D
Time (ps)
510 pump 530 pump 550 pump
λprobe
= 830 nm
Fig. S12 Femtosecond transient decay profiles of PBI 1 (10-3 M) with various excitation wavelengths
(510, 530 and 550 nm) in methylcyclohexane .
Electronic Supplementary Material (ESI) for Chemical ScienceThis journal is © The Royal Society of Chemistry 2012


![Electronic Supporting Information organocatalyst, catalyst ... · Electronic Supporting Information “On water” synthesis of dibenzo-[1,4]-diazepin-1-ones using L-proline as an](https://static.fdocument.org/doc/165x107/5f0809357e708231d420023d/electronic-supporting-information-organocatalyst-catalyst-electronic-supporting.jpg)