Hysteretic behavior of electrical conductivity in packings ...
34
1 Hysteretic behavior of electrical conductivity in packings of particles Behzad Ghanbarian 1* and Muhammad Sahimi 2 1 Bureau of Economic Geology, Jackson School of Geosciences, University of Texas at Austin, Austin, Texas 78713, USA 2 Mork Family Department of Chemical Engineering and Materials Science, University of Southern California, Los Angeles, California 90089-1211, USA Abstract We address the problem of predicting saturation-dependent electrical conductivity σ in packings of spheres during drainage and imbibition. The effective- medium approximation (EMA) and the universal power law of percolation for σ are used, respectively, at higher and low water saturations to predict the conductivity, with the crossover between the two occurring at some intermediate saturation Swx. The main input to the theory is a single parameter that we estimate using the capillary pressure data. The predictions are compared with experimental, as well as numerical data for three distinct types of packings. The results for drainage in all the packings indicate that the universal power law of percolation is valid over the entire range of Sw. For imbibition, however, the universal power law crosses over to the EMA at Swx = 0.5. We also find that the effect of the pore-size distribution on the σ-Sw relation is minimal during both drainage and imbibition. Key words: Drainage . Imbibition . Packings of spheres . Electrical conductivity . Partially saturated
Transcript of Hysteretic behavior of electrical conductivity in packings ...

1
Hysteretic behavior of electrical conductivity in packings of particles
Behzad Ghanbarian1* and Muhammad Sahimi2
1 Bureau of Economic Geology, Jackson School of Geosciences, University of Texas at
Austin, Austin, Texas 78713, USA
2 Mork Family Department of Chemical Engineering and Materials Science, University
of Southern California, Los Angeles, California 90089-1211, USA
Abstract We address the problem of predicting saturation-dependent electrical
conductivity σ in packings of spheres during drainage and imbibition. The effective-
medium approximation (EMA) and the universal power law of percolation for σ are used,
respectively, at higher and low water saturations to predict the conductivity, with the
crossover between the two occurring at some intermediate saturation Swx. The main input
to the theory is a single parameter that we estimate using the capillary pressure data. The
predictions are compared with experimental, as well as numerical data for three distinct
types of packings. The results for drainage in all the packings indicate that the universal
power law of percolation is valid over the entire range of Sw. For imbibition, however,
the universal power law crosses over to the EMA at Swx = 0.5. We also find that the effect
of the pore-size distribution on the σ-Sw relation is minimal during both drainage and
imbibition.
Key words: Drainage . Imbibition . Packings of spheres . Electrical conductivity .
Partially saturated
2
* Corresponding author’s email address: [email protected]
1 Introduction
The relationship between the effective permeability k and electrical conductivity σ of
porous media has been studied for decades (see, for example, Johnson et al. 1986; Katz
and Thompson 1986,1987; Bernabe and Bruderer 1998; for a comprehensive review, see
Sahimi 2011). Since k has the units of a length squared, its square root is a characteristic
length scale of porous media, representing a static property. On the other hand, σ is a
dynamic property that characterizes flow of electrons in a pore space saturated by a
conducting fluid, such as brine. Thus, in principle, there is no exact relation between k
and σ. Despite this, σ is commonly used in geophysics and hydrology to predict k and the
relative permeabilities (see, for example, Revil and Cathles 1999; Doussan and Ruy
2009; Niu et al. 2015; Mawer et al. 2015). For this reason accurate prediction of σ has
been a problem of great interest for a long time (see e.g., Knight 1991; Friedma, 2005;
Zhan et al. 2010; Revil 2016), particularly under partially-saturated conditions, for which
various models have been proposed to predict σ. Among them is the empirical Archie’s
law (Archie 1942), which is valid only for water-wet rocks deprived of microporosity or
substantial clay-exchange cations (Toumelin and Torres-Verdín 2008), and has been
extensively used to determine σ. A recent review of the theoretical models of σ is given
by Ghanbarian et al. (2015a).
Mualem and Friedman (1991) represented the pore space by a bundle of series-
parallel capillary tubes (Mualem 1976) in order to predict σ. By including the concept of
residual volumetric water content, they proposed power laws for σ under fully- and
3
partially-saturated conditions. The exponents that characterized their power laws were 1.5
and 2.5 [see their Eqs. (30) and (31)] for, respectively, the fully- and partially-saturated
media. The effect of hysteresis, pore shape, pore-size distribution (PSD), viscosity, and
wettability on saturation-dependent σ has been well studied using pore-network models
(PNMs) and/or solving the Laplace equation in digitized images (see Schwartz and
Kimminau 1987; Tsakiroglou and Fleury 1999a,b; Man and Jing, 2000; Bekri et al.,
2003). Bryant and Pallatt (1996) argued that σ is dependent upon the geometry of the
pore space, and proposed a PNM for computing it for a packing of spheres. The
predictions were in good agreement with experimental data. Suman and Knight (1997)
studied the effect of the pore structure and wettability on saturation-dependence of σ
during drainage and imbibition by means of a PNM. The effect of the wettability was
investigated, and the influence of the pore structure was studied by varying the breadth of
the PSD and the pore-size correlations. Suman and Knight (1997) reported that the effect
of hysteresis is more significant in oil-wet porous media than in the water-wet ones.
Hysteresis in both types of porous media decreased, however, as the extent of the
correlation between the pores increased. Li et al. (2015) computed σ during drainage and
imbibition, modeled by invasion percolation (Chandler et al. 1982; Wilkinson and
Willemsen 1983, Knackstedt et al. 2000) in the PNMs under completely water-wet
conditions. The computed σ did not generally follow Archie’s law (consistent with the
experimental data of Longeron et al. 1989), and exhibited either downward or upward
curvature at lower saturations, depending on whether the effect of the thin water films
was included in the model.
4
Percolation theory has been also invoked to predict σ in partially-saturated soil
and rock (see, for example, Heiba et al. 1992; Zhou et al. 1997; Wang et al. 2007;
Montaron 2009). Using percolation theory, Ewing and Hunt (2006) proposed the
following equation for the saturation-dependence of σ,
𝜎𝑟 =𝜎(𝑆𝑤)−𝜎𝑠
𝜎(𝑆𝑤=1)−𝜎𝑠= [
𝑆𝑤−𝑆𝑤𝑐
1−𝑆𝑤𝑐]
𝑡
, 𝑆𝑤𝑐 ≤ 𝑆𝑤 ≤ 1 (1)
where Sw and Swc are, respectively, the water saturation and its critical value (or the
percolation threshold), σ(Sw) and σ(Sw
=1) are the electrical conductivities under partially-
and fully-saturated conditions, t = 2, and σs is the surface conductivity. Equation (1),
which is similar in form to the model of Mualem and Friedman (1991), assumes that the
solid and bulk phases conduct strictly in parallel. The exponent t = 2 in Eq. (1)
incorporates the effect of pore connectivity, tortuosity and the correlations that arise as a
result of tortuous conduction paths near the critical saturation.
The power laws of Mualem and Friedman (1991) and Ewing and Hunt (2006) are
not, however, valid over the entire range of saturation, particularly if the porous medium
is highly heterogeneous. To address such cases, Ewing and Hunt (2006) proposed another
power law in which, instead of the universal t = 2 in Eq. (1), a non-universal exponent
was used. The model invoked the critical-path analysis (CPA), which is based on
percolation theory and included a crossover saturation Swx at which the universal power
law, Eq. (1), switches to a non-universal one based on the CPA, given by
𝜎𝑟 =𝜎(𝑆𝑤)−𝜎𝑠
𝜎(𝑆𝑤=1)−𝜎𝑠= [
1 𝜙⁄ −1+𝑆𝑤𝑥−𝑆𝑤𝑐
1 𝜙⁄ −𝑆𝑤𝑐]
1
3−𝐷[
𝑆𝑤−𝑆𝑤𝑐
𝑆𝑤𝑥−𝑆𝑤𝑐]
2
, 𝑆𝑤𝑐 ≤ 𝑆𝑤 ≤ 𝑆𝑤𝑥 (2a)
𝜎𝑟 =𝜎(𝑆𝑤)−𝜎𝑠
𝜎(𝑆𝑤=1)−𝜎𝑠= [
1 𝜙⁄ −1+𝑆𝑤−𝑆𝑤𝑐
1 𝜙⁄ −𝑆𝑤𝑐]
1
3−𝐷, 𝑆𝑤𝑥 ≤ 𝑆𝑤 ≤ 1 (2b)
5
wheref is the total porosity and D is the pore space fractal dimension. Equations (2) are
valid for porous media whose PSD is broad or, equivalently, when 𝐷 ≥ 3 −(1−𝑆𝑤𝑐)
2(1/𝜙−𝑆𝑤𝑐).
For example, in a porous medium with f = 0.3 and Swc = 0.25, Eq. (2) is applicable only
if D ³ 2.88. By comparing the predictions of Eqs. (1) and (2) with the experimental data
for sediments and soils, Ewing and Hunt (2006) argued that Eq. (1) should predict
accurately the saturation-dependence of σ.
Ghanbarian et al. (2014; see, however, Dashtian et al, 2015 for a note of caution)
combined the universal power law of percolation, i.e., σr ~ (Sw – Swc)t in which t = 2, with
the effective-medium approximation (EMA), σr ~ (Sw – 2/Z), in which Z is the average
pore connectivity, to obtain,
𝜎𝑟 =𝜎(𝑆𝑤)
𝜎(𝑆𝑤=1)=
𝑆𝑤𝑥−2/𝑍
1−2/𝑍[
𝑆𝑤−𝑆𝑤𝑐
𝑆𝑤𝑥−𝑆𝑤𝑐]
2
, 𝑆𝑤𝑐 ≤ 𝑆𝑤 ≤ 𝑆𝑤𝑥 (3a)
𝜎𝑟 =𝜎(𝑆𝑤)
𝜎(𝑆𝑤=1)=
𝑆𝑤𝑥−2/𝑍
1−2/𝑍, 𝑆𝑤𝑥 ≤ 𝑆𝑤 ≤ 1 (3b)
The significance of a crossover between the EMA and percolation description of the
conductivity was first pointed out by Sahimi et al. (1983b). By comparing the predictions
with the data for sandstones and carbonates, Ghanbarian et al. (2014) found that, under
fully-saturated conditions, the crossover point depends on the pore space morphology.
Equation (3) was also successfully used to predict saturation-dependent gas and solute
diffusivities (Hunt et al. 2014a,b; Ghanbarian and Hunt 2014; Ghanbarian et al. 2015b) in
rocks, soils, and packings of spheres, and is consistent with random walk results of
saturation-dependent diffusion simulation in isotropic and homogeneous reconstructed
unimodal porous media reported by Valfouskaya and Adler (2005). Whether it can also
6
predict σ in partially-saturated packings of mono-sized spheres and glass beads during
drainage and imbibition is still an open question.
The main objectives of this study are, therefore, (1) investigating hysteresis in the
σ -Sw relation in packings of mono-sized spheres; (2) evaluating the accuracy of Eq. (3)
against numerical and experimental data for such packings, and (3) studying the effect of
the PSD on the saturation-dependence of σ. Note that we study the saturation dependence
of static, low-frequency electrical conductivity in which such processes as polarization
and relaxation are negligible. The general frequency-dependent dynamic conductivity
may be studied by the EMA of Sahimi et al. (1983a).
2 Theory
The predictions that we present in this paper rely on two distinct theories that we describe
first.
2.1 The pore-size and pore-conductance distributions
The PSD of the pore space of a packing of spheres is well approximated by a power law
(Bryant et al. 1993). Indeed, rigorous analysis by Halperin et al. (1985) and Feng et al.
(1987) indicated that the pore-conductance distribution (PCD) of the same packing is of
the power-law type. On the other hand, the electrical conductance g of a cylindrical pore
of radius r and length l, filled with a fluid of conductivity 𝜎𝑓 conforms to
𝑔 = 𝜎𝑓𝜋𝑟2
𝑙 (4)
Clearly, then, if the PCD follows a power law, so also does the PSD. Since the pore space
of packings of spheres is isotropic, the conductance of the pores scales with a single
scaling factor in all the directions, and we assume that, 𝑙 ∝ 𝑟 (although others have
argued that 𝑙 ∝ 1/𝑟). Accordingly, Eq. (4) becomes
7
𝑔 ∝ 𝑟𝛾 (5)
in which 𝛾 = 1, if 𝑙 ∝ 𝑟. In the classical percolation problem, the various variables, such
as the pores’ conductance, take on discrete values. But, if they are distributed according
to a continuous probability distribution function, then the problem is referred to as
continuum percolation. The analyses of Halperin et al. (1985) and Feng et al. (1987)
demonstrated that the conductance distribution f(g) of the pore space of a packing of
spheres is given by
𝑓(𝑔) = 𝑐𝑔𝑔−𝛼, 𝑔𝑚𝑖𝑛 ≤ 𝑔 ≤ 𝑔𝑚𝑎𝑥 (6)
in which 𝑐𝑔 = (1 − 𝛼)/(𝑔𝑚𝑎𝑥1−𝛼 − 𝑔𝑚𝑖𝑛
1−𝛼) and 𝛼 = (𝛾 − 1)/𝛾.
Using the EMA, Kogut and Straley (1979) studied steady-state conduction, and
Sahimi et al. (1983a) investigated frequency-dependent diffusion and conduction in
disordered materials and media. Both groups showed that power law (1) that describes σ
near the percolation threshold is characterized by a non-universal exponent t, if 0 < 𝛼 < 1
(i.e. one that depends on the details of the PCD), whereas its universality is restored for 𝛼
≤ 0. Using a scaling analysis, Halperin et al. (1985) and Feng et al. (1987) made the
approximate work of Kogut and Straley (1979) and Sahimi et al. (1983a) rigorous.
Therefore, in porous media in which the PCD is given by a power law, one should expect
σ to follow Eq. (1) near the percolation threshold with a universal t = 2, if γ ≤ 1, and a
non-universal t for γ > 1. In the latter case (Straley 1982; Feng et al. 1987),
𝑡 = 𝑚𝑎𝑥 {2,1 + 𝜈 +𝛼
1−𝛼} = 𝑚𝑎𝑥{2,1 + 𝜈 + (𝛾 − 1)} (7)
where is the exponent that characterizes the divergence of the percolation correlation
length near the percolation threshold, with ≈ 0.88 (Stauffer and Aharony 1994). Thus,
so long as γ ≥ 1.12, one has
n
n
8
𝑡 = 0.88 + 𝛾 (8)
The significance of the non-universal power laws of percolation to correct comparison of
theoretical predictions for flow and transport in porous media with the experimental data
was recently discussed and emphasized by Sahimi (2012).
2.2 Pore-size distribution and the capillary pressure
Next, we need a relation between the PSD and the capillary pressure-saturation curve.
Many porous media have a fractal pore space (Katz and Thompson 1985; Perrier et al.
1996) with their PSD given by,
𝑓(𝑟) =𝐷
𝑟𝑚𝑖𝑛−𝐷 −𝑟𝑚𝑎𝑥
−𝐷 𝑟−1−𝐷, 𝑟𝑚𝑖𝑛 ≤ 𝑟 ≤ 𝑟𝑚𝑎𝑥 (9)
where rmin and rmax are the minimum and maximum pore radii, and D is the fractal
dimension of the pore space. If −1 < D < 3, one has a pore space in which smaller pores
are more probable than the larger ones. If D = −1, Eq. (9) reduces to a uniform PSD. If D
< −1, however, larger pores are more probable than the smaller ones. Using the
relationship among porosity, rmin/rmax, and D, Ghanbarian-Alavijeh and Hunt (2012)
demonstrated that negative values of D is permissible theoretically [see their Eq. (7) and
Table 1; see also Mandelbrot 1990], although such values are associated with very
complex structures.
The pore space of a packing of spheres does not have a fractal structure, unless
the porosity is so low that the pore space is at or very close to the percolation threshold or
the critical porosity. In most porous media, D > 2 and is a measure of ruggedness of the
pore space and its pore surface. Thus, since the pore space of a packing of sphere has a
power-law PSD similar to Eq. (9), we refer to such porous media as power-law porous
media, rather than fractal porous media. If D < 2, we view D merely as a parameter of the
9
PSD (or PCD, as the PSD and PCD are related). As we demonstrate below, for all the
packings that we study, D < 2, justifying our view of D.
Following Eq. (9), the capillary pressure curve for a power-law pore space can be
derived. By invoking the Young-Laplace equation for the capillary pressure, Pc = A/r in
which A is a constant, one has
𝑆𝑤 = 1 −𝛽
𝜙[1 − (
𝑃𝑐
𝑃𝑒)
𝐷−3
], 𝑃𝑒 ≤ 𝑃𝑐 ≤ 𝑃𝑐𝑚𝑎𝑥 (10)
where Pe is the entry (displacement) pressure at which the invading fluid (e.g., air) begins
displacing the defending fluid (water, for example), Pcmax = A/rmin is the maximum
pressure, and 𝛽 = 𝜙𝑟𝑚𝑎𝑥3−𝐷/(𝑟𝑚𝑎𝑥
3−𝐷 − 𝑟𝑚𝑖𝑛3−𝐷) and is smaller for a pore space with more
uniform pore sizes. Equation (10) reduces to the models proposed by Tyler and
Wheatcraft (1990) and Rieu and Sposito (1991) for β = ϕ and 1, respectively. It is also
equivalent to the empirical Brooks and Corey (1964) model when β = ϕ and λ = 3 – D
(Perrier et al. 1996) in which λ, referred to by Brooks and Corey as the PSD index, may
take on any positive value, being small for media with a wide range of pore sizes and
large for a pore space with a relatively uniform PSD. Note that b = f requires that rmin →
0, implying a very broad PSD (rmax/rmin → ∞). Recall that such broad PSDs are the cause
of the non-universality of the conductivity exponent t.
Thus, if we view Eq. (10) as the saturation-capillary pressure relation for porous
media in which the PSD and PCD are of power-law type, we can utilize it to study
electrical conductivity of partially-saturated packings of spherical particles.
3 The Data
3.1 Data of Mawer et al.
10
We first utilized the database reported by Mawer et al. (2015) who carried out numerical
computation of saturation-dependent capillary pressure and σ for the Finney packing
(Finney, 1970) whose porosity 𝜙 is 0.362, and 14 other packings with porosities 0.23 <
𝜙 < 0.46. Finney constructed random packings of spherical particles experimentally and
recorded the coordinates of their centers. Salient details of each sphere packing are
presented in Table 1. It has been used for simulating various flow and transport (Roberts
and Schwartz 1985; Bryant et al. 1993) in porous media, and biological reaction and
transport (Dadvar and Sahimi 2003) in packed-bed reactors, as its structure is very well
characterized.
In order to generate a packing with a partial saturation, Mawer et al. (2015)
saturated the pore space and carried out drainage and imbibition simulations to capture
hysteresis between the two. The conductivity of the packings was computed using the
finite-element approach (Garboczi 1998). Complete details are given by Mawer et al.
(2015). To predict the saturation-dependence of σ, the parameters of the power-law
model of the capillary pressure curve, namely, D, b , and Pe, were estimated by fitting
Eq. (10) to the capillary pressure data computed by computer simulations.
3.2 Data of Knackstedt et al.
Knackstedt et al. (2007) studied conduction in a monodisperse glass bead pack with a
porosity of 0.258, measured via porosimetry. The sample’s image was obtained by micro-
computed tomography with a resolution of 55 microns per voxel and a total of 20483
voxels. They use a finite-element method to solve the Laplace equation under non-
periodic boundary conditions by minimizing the energy using the conjugate-gradient
method (Vaez Allaei and Sahimi, 2005), and calculated the electrical conductivity of the
11
glass bead during drainage. Knackstedt et al. (2007) considered two limiting cases of
wettability: strongly water-wet and strongly oil-wet. As expected, the non-wetting fluid
resided in the regions with large covering spheres (i.e. large pores between the glass
beads), while the wetting fluid was distributed in the small radius region.
3.3 Data of Sharma et al.
Sharma et al. (1991) used packings of glass beads the diameters of which varied from
0.18 to 0.25 mm. The beads were packed inside a resistivity cell equipped with two end-
current electrodes and two ring-voltage electrodes, across which the electrical resistivity
was measured using a four-electrode method. After packing the beads, an axial stress of
100 psi was applied, followed by a radial stress of 300 psi. The packings were then
saturated using a 30,000 ppm brine solution. Sharma et al. (1991) used two non-wetting
phase fluids, namely, n-decane, and naphtha, and measured the electrical resistivity at
various water saturations during both drainage and imbibition. The digitized data used in
the present study were taken from their Figures 6 and 8.
4 Results and Discussions
4.1 Predictions for the Data of Mawer et al.
We first discuss the capillary pressure curve, and the pore space parameters D and b for
the packings under drainage and imbibition conditions, after which we compare the
predictions for σ with the data for the 15 packings.
4.1.1 Capillary pressure: drainage vs. imbibition
The estimated parameters D, b , and Pe are listed in Table 1, indicating that -1.64 < D <
0.62 for drainage and 0.99 < D <1.74 for imbibition. The latter range is compatible with
D = 1.34 that we derived based on the PSD of the Finney packing, reported by the
12
Dadvar and Sahimi (2003). A comparison of D for drainage and imbibition reported in
Table 1 indicates that the imbibition PSD is broader than that of drainage, in agreement
with the general results of Ojeda et al. (2006) and consistent with the assumption of D =
0.5 (λ = 2.5) and 1.75 (λ = 1.25), respectively, for drainage and imbibition (Gerhard et al.
2007; see their Table 1). We should point out that the negative values of D presented in
Table 1 are in accord with the large values of the PSD index λ of the Brooks and Corey
(1964) for packings of spheres. Brooks and Corey (1964), Mualem (1976), Eckberg and
Sunada (1984), and Ioannidis et al. (2006) reported, respectively, that λ = 7.3, 6.24, 7, and
5.07 corresponding to D = -4.3, -3.24, -4, and -2.07 [if β = ϕ in Eq. (5)] for glass beads of
uniform sizes.
4.1.2 Electrical conductivity during drainage
Figure 1 presents the computed capillary pressure and σr during drainage and their
dependence on the water saturation. Although the data are scattered, exhibiting relatively
wide range of the PSDs, 𝜎𝑟 follows the same trends with the water saturation, indicating
clearly that the effect of the PSD and PCD on 𝜎𝑟 is minimal. Since the packings are
relatively homogeneous, their pore space is well connected, and the spheres’ surface is
smooth, the water saturation vanishes at a non-zero capillary pressure. That is, the
irreducible water saturation is zero; see Figure 1(a). We, therefore, set Swc = 0 to predict
the saturation-dependence of 𝜎𝑟 using Eq. (3).
For all the packings, Eq. (3) reduces to the universal power law of percolation,
implying that Swx = 1. We find that Eq. (1) with σr = [(Sw – Swc)/(1 – Swc)]
2 and Swc = 0 is
accurate over the entire range of water saturation; see Figure 1(b). This is consistent with
Feng et al. (1987) who pointed out that when the exponent α < 0 in Eq. (6), the effect of
13
the PCD on σ is negligible. Ewing and Hunt (2006) and Ghanbarian et al. (2014; 2015a)
emphasized also that one should expect the saturation-dependence of σ to follow
universality, if the medium is not too heterogeneous (i.e. if D < 2).
Kogut and Straley (1979), Sahimi et al. (1983a), and Feng et al. (1987) all
emphasized that the propensity of very small or zero conductance is the root cause of the
non-universality of the exponent t. Putting it another way, rmin = 0 is the origin of non-
universality (Sahimi et al. 1983a). Although we find b = f for several of the packings (see
Table 1), their σr conforms to the universal power law, Eq. (1) with t = 2; see Figure 2(b).
That for all the packings D < 2 (Table 1) implies that in the present formulation the key
parameter for the universality or non-universality of t is D: σr follows the universal power
law of percolation, if D < 2. Ghanbarian et al. (2015a) discussed the special case b = f
using the CPA, and pointed out that there exists no criterion to distinguish the crossover
point separating the power law from the CPA when 𝛽 = 𝜙. They proposed combining the
two power laws to model σr over the entire range of saturation, if D ≥ 2.
4.1.3 Electrical conductivity during imbibition
Figure 2 presents the computed capillary pressure and σr for all the packings during
imbibition. Although, similar to drainage, the data follow a wide range of trends, σr
conforms to the same behavior as in drainage: varying linearly with water saturations
near 1, but following a quadratic dependence on the saturation when it is close to Swc. The
linear behavior is consistent with the EMA, Eq. 3(b), while the quadratic dependence is
compatible with the universal power law of percolation, Eq. 3(a). The computed results
are in accord with the universal electrical conductivity model of Ghanbarian et al. (2014),
Eq. (3). We find that, with Swc = 0, Swx = 0.5, and Z = 8 Eq. (3) provides predictions that
14
are in very good agreement with the imbibition σr; see Figure 2(b). The crossover
saturation that we identify, Swx = 0.5, should be compared with 0.75, reported by Kiefer
et al. (2009), while Z = 8 is consistent with the range of connectivities reported by Makse
et al. (2000), Aste et al. (2006), Bhattad et al. (2011) and Jiang et al. (2016) for packings
of spheres. As was the case for the drainage, the effect of the PSD and PCD on σr is
negligible.
Ghanbarian et al. (2015b) also showed that Eq. (3) was in agreement with gas and
solute diffusion in mono-size packings of overlapping or non-overlapping spheres, in
accord with Einstein’s relation that σ is proportional to the diffusion coefficient. They
demonstrated that, as the PSD becomes very narrow, one should expect the crossover
point between the EMA and the power-law regimes to occur below the numerical value
of the corresponding porosity. This is consistent with the imbibition results. Bearing this
in mind, one may expect the presence of a crossover point on the drainage σr curve, since
the drainage PSD is narrower than the imbibition, as quantified by the D values in Table
1.
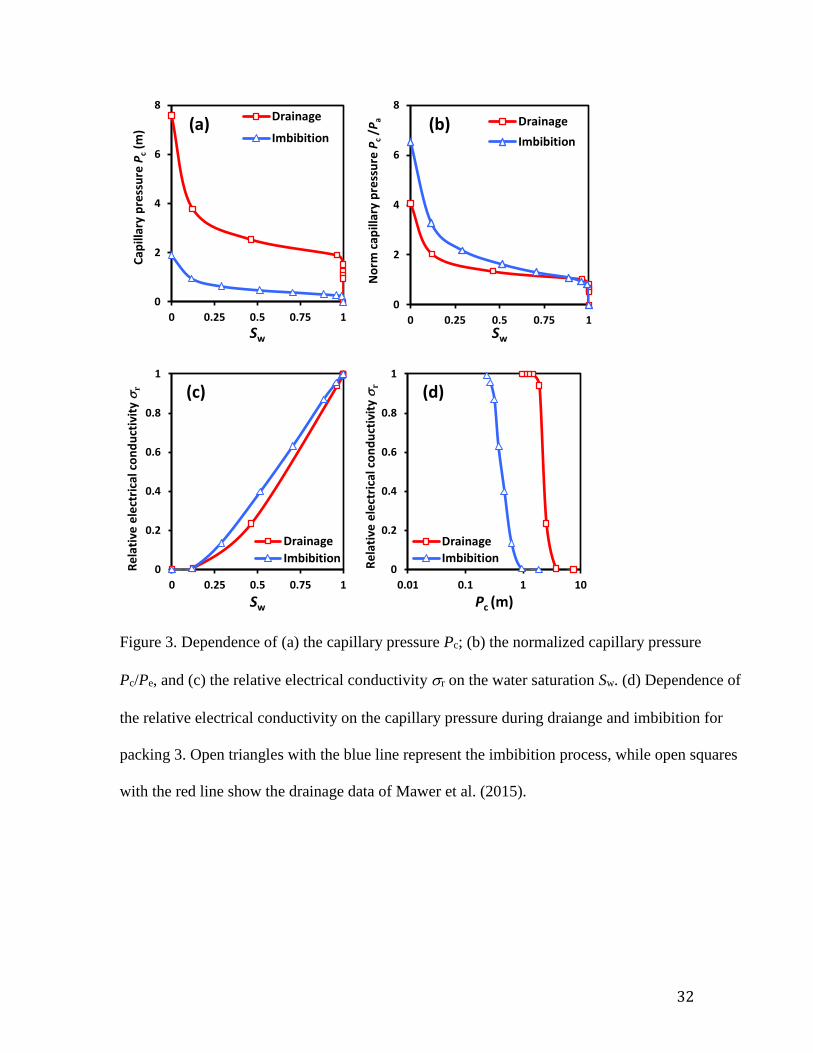
Figure 3(a) shows the imbibition and drainage capillary pressures for packing
number 3 from Mawer et al. (2015). The maximum drainage capillary pressure, Pcmax =
7.6 m, is four times greater than Pcmax = 1.9 m for imbibition. Therefore, it may appear
that the drainage PSD might be broader than the imbibition’s. In contrast, for imbibition,
D = 1.74 is greater than that of drainage, D = 0.49, by a factor of 3.5. In fact, in order to
graphically compare the breadth of the PSD during drainage and imbibition, one should
normalize the capillary pressures by the entry pressure Pe. Given that the entry pressure
Pe = 1.87 and 0.29 m, we obtain, Pcmax/Pe = rmax/rmin = 4.05 and 6.54 for drainage and
15
imbibition, respectively. The normalized capillary pressure curves in Figure 3(b) also
confirm that the imbibition PSD is broader than that of the drainage. One should bear in
mind, however, that the drainage PSD in other types of porous media may be broader
than that of imbibition.
The dependence of σr on water saturation and capillary pressure during drainage
and imbibition for packing number 3 are shown in Figures 3(c) and 3(d). As expected, the
broader the PSD, the sharper is the σr curve. Therefore, one may expect the saturation-
dependent σr during imbibition to lie below the drainage, since the imbibition PSD is
broader than that in drainage. As Figure 3(c) indicates, however, the imbibition σr curve
falls above the drainage, consistent with experimental measurements of Bourget et al.
(1958), Longeron et al. (1989), and Knight (1991). We should, however, keep in mind
that the water saturation level under drainage is not comparable with that under
imbibition.
We show in Figure 3(d) the variations of σr with the capillary pressure for during
drainage and imbibition. At a specific capillary pressure, e.g. Pc = 1 m, where the
drainage water saturation is greater than that in imbibition Sw [see Figure 3(a)], the
imbibition σr is smaller than the drainage, which is expected since small pores are filled
during imbibition, whereas large pores are occupied during drainage.
We point out that Knight (1991) investigated experimentally the hysteresis in the
saturation-dependence of σr in three sandstone samples, reporting pronounced hysteresis
in the electrical resistivity (inverse of the conductivity) throughout much of the saturation
range, particularly at intermediate water saturations. This agrees with Figure 3(c). She
showed that in the hysteric (intermediate saturation) region, the electrical resistivity
16
measured during imbibition was consistently less than that measured during drainage.
The resistivity in most of the sandstones studied by Knight (1991) tended, however, to a
finite value at zero water saturation (Sw = 1), indicating that surface conduction
contributed to flow at completely dry conditions. We also point out that the data reported
by Knight (1991) had been measured at 60 kHz, which is above the frequency range
affected by polarization at the sample/electrode interface, as well as far above the low-
frequency range addressed in this study. Nonetheless, our predictions are in reasonable
agreement with the data of Knight (1991) for sandstones.
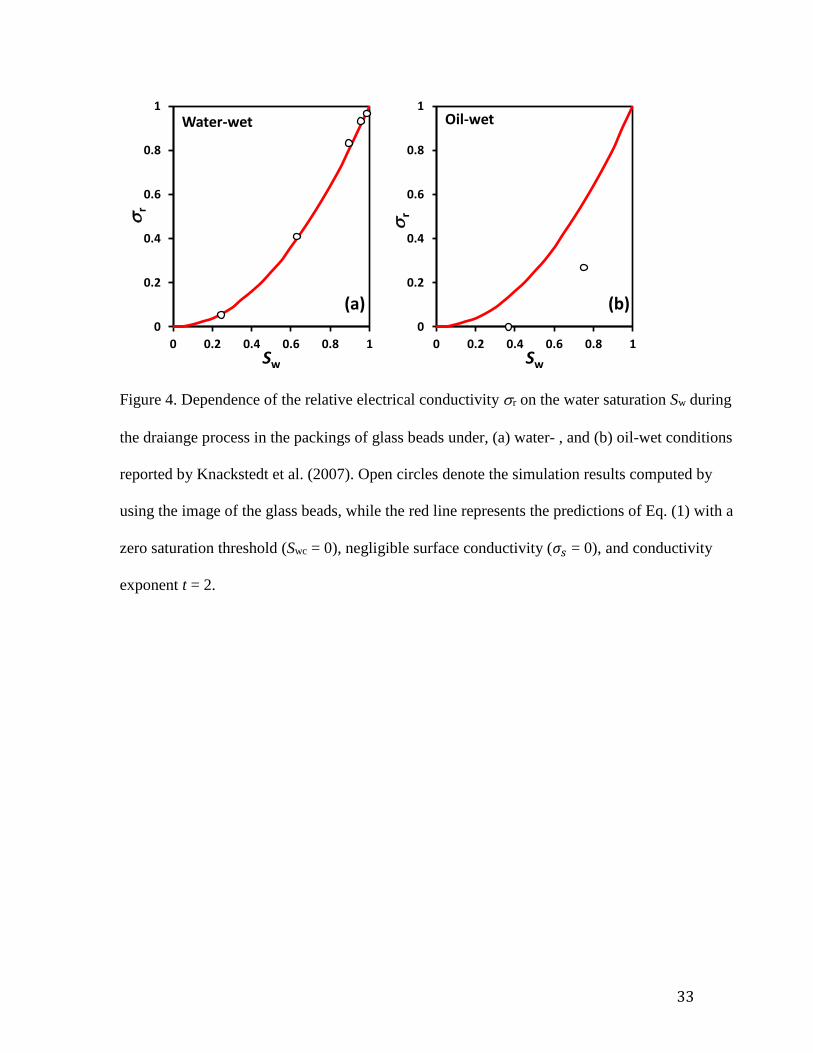
4.2 Predictions for the Data of Knackstedt et al.
Figure 4 compares the electrical conductivity of the mono-sized glass bead during
drainage, computed by Knackstedt et al. (2007) using the image of the packings, with the
predictions of Eq. (1) under strongly water- and oil-wet conditions. Following the results
that we described for the data of Mawer et al. (2015), we set Swc = 0, 𝜎𝑠 = 0, and t = 2 and
found very good agreement between the water-wet numerical simulations of Knackstedt
et al. (2007) and the predictions of Eq. (1). This confirms that the effect of the PSD in
water-wet sphere packings is negligible, and that the universal power law of percolation,
Eq. (1), predicts accurately the saturation-dependence of the electrical conductivity
during drainage. Equation (1) with Swc = 0, 𝜎𝑠 = 0, and t = 2 overestimated the saturation-
dependence of the electrical conductivity under oil-wet conditions. Given that the
morphology of the pore space of the glass bead packings of Knackstedt et al. (2007) is
the same for both water- and oil-wet conditions, Fig. 4 clearly indicates the effect of the
wettability on the saturation-dependence of the electrical conductivity during drainage.
Although we found better agreement between the predictions of Eq. (1) with Swc = 0.3, 𝜎𝑠
17
= 0, and t = 2 (not shown) and Knackstedt et al.’s computed conductivity of the oil-wet
packings, the sharp change in the 𝜎𝑟 − 𝑆𝑤 functional form presented in Fig. 4(b) may not
be attributed to a large critical water saturation, because Morrow (1970) demonstrated
experimentally that the irreducible wetting-phase saturation varied slightly with the
change in the contact angle in random packings of 3-mm teflon spheres. More
specifically, Morrow (1970) reported irreducible wetting-phase saturations in the range
0.066 - 0.09 with no specific trend of variations as the contact angle was varied from 0 to
108°. Since within the framework of percolation theory the value of conductivity
exponent t depends only on the pore-size or the conductance distribution [see Eq. (7)], the
conclusion is that one should expect the proposed theoretical method in this study to
predict accurately the saturation-dependence of the electrical conductivity in water-wet
porous media. Further investigation is required to address the possible effect of the
wettability on the exponent t in Eq. (1).
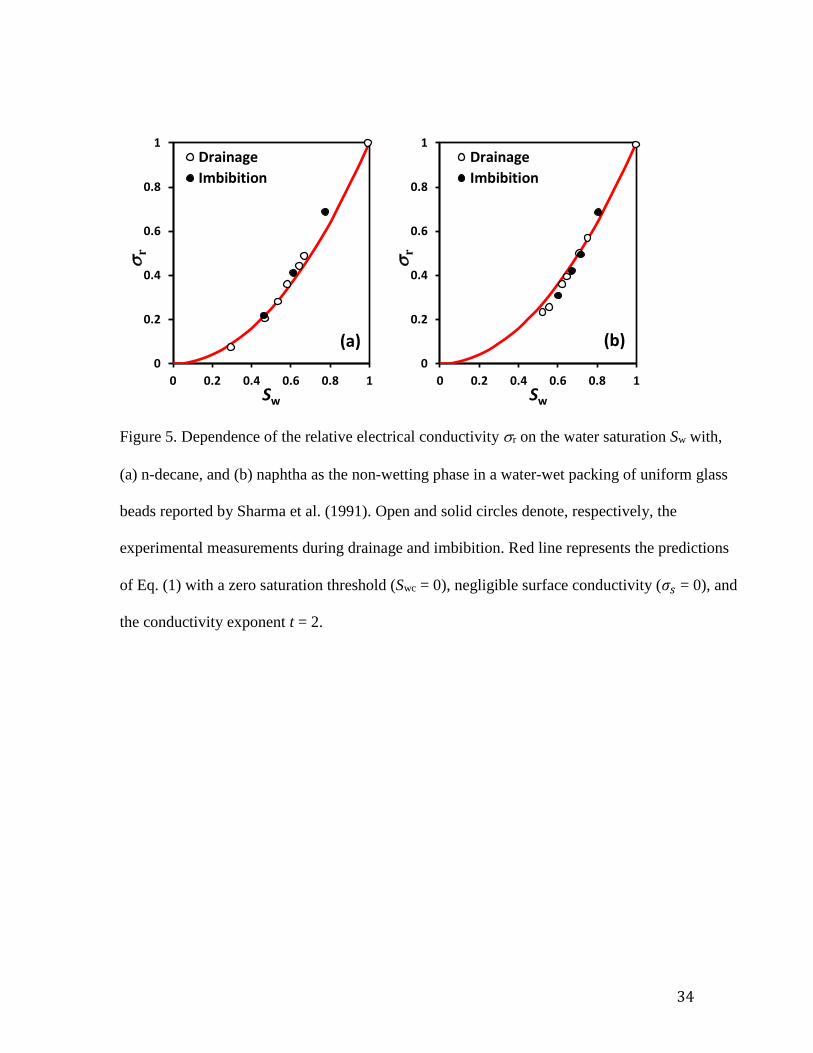
4.3 Predictions for the Data of Sharma et al.
We show in Figure 5 the experimental data of Sharma et al. (1991) for the electrical
conductivity during both drainage and imbibition. There is no remarkable difference
between the two cases, and the effect of hysteresis on the saturation-dependence of the
electrical conductivity in uniform packing of water-wet glass beads is negligible. Figure 5
also shows the predictions of Eq. (1), indicating good agreement with the experimental
data. Due to lack of extensive experimental data, we only compared the predictions of
Eq. (1) with such measurements, since precise determination of the crossover saturation
in Eq. (3) requires accurate data (experimental or simulated) for the saturation-
dependence of the electrical conductivity.
18
By fitting Archie’s law, i.e., 𝜎𝑏
𝜎𝑓= 𝑆𝑤
𝑛 , to their data, Sharma et al. (1991) reported
that the average values of n are, respectively, 2.22 and 1.69 for the water-wet uniform
glass beads during drainage and imbibition. Note that n = 2.2 reported for drainage is
only 10 percent greater than the universal exponent of 2 predicted by percolation theory
for the electrical conductivity, Eq. (1). The estimate is also consistent with that obtained
by the numerical simulations of Mawer et al. (2015) shown in Fig. 3(c).
On the other hand, the exponent 1.69 reported by Sharma et al. (1991) for
imbibition represents an intermediate value between Eq. (3) in which the electrical
conductivity scales with the water saturation with the exponent 2 (as predicted by
percolation theory) at saturations near the critical, and 1 that the EMA predicts near the
fully-saturated condition. In other words, because the two regimes were mixed by Sharma
et al. (1991), the resulting exponent represents an effective, but not true, estimate of the
exponent. Sharma et al. (1991) stated that, “Two-endpoint n measurements indicate that
for both glass beads and Berea cores the imbibition n values are smaller than those for
drainage (Tables 1, 3). For water-wet beads, the two-point drainage-saturation exponents
were higher than for the imbibition cycle by 27% (2.22 versus 1.69). Likewise, for water-
wet cores, the average drainage n value was substantially higher than that for imbibition
(1.53). These observations are consistent and reproducible and are also consistent with
the observations of Swanson (1980), who reported similar differences.” But, in fact, the
emphasis of the present work is that, at least for imbibition, the two regimes should not
be mixed.
Although we addressed the saturation-dependence of the electrical conductivity in
packings of spheres and glass beads by means of percolation theory and the EMA, further
19
investigation is required to study the possible effect of other factors and the
circumstances under which the crossover saturation Swx may be altered.
5 Summary
This paper combined the EMA with the power law of percolation to predict the
saturation-dependent electrical conductivity σr in packings of particles. The predictions
were evaluated against the numerical data for 15 packings reported by Mawer et al.
(2015), as well as two other datasets by Knackstedt et al. (2007) and Sharma et al. (1991).
By analyzing the capillary pressure data reported by Mawer et al. (2015), we showed that
the imbibition PSD is broader than that of drainage. The estimated power-law exponent
of the PSD, D < 2, indicated that the electrical conductivity should follow the universality
of the conductivity exponent. Although the capillary pressure data varied remarkably
among the 15 packings, their saturation-dependent electrical conductivity followed the
same trends during both drainage and imbibition. This means that in the packings that we
considered in which all the spheres have the same size, the effect of the PSD on the σr-Sw
relation is minimal. Our results also indicated that the drainage σr conforms to the
universal power law of percolation conductivity over the entire range of water
saturation. The imbibition σr, however, exhibited a crossover from the universal power
law to the EMA. Our predictions for the dataset of Knackstedt et al. (2007), computed by
the universal power law of percolation theory, were accurate only for water-wet packing
of mono-sized glass beads. We found the same trends for the Sharma et al. (1991)
dataset.
Acknowledgements
20
B. G. is grateful to Chloe Mawer, Silicon Valley Data Science, for providing the results
of numerical simulation of drainage and imbibition used in this study, and to Hugh
Daigle, the University of Texas at Austin, for his comments on the very first draft of this
paper. Publication was authorized by the Director, Bureau of Economic Geology.
21
References
Archie, G. E.: The electrical resistivity log as an aid in determining some reservoir
characteristics. Trans. AIME 146, 54 (1942).
Aste, T., Saadatfar, M., Senden, T.J.: Local and global relations between the number of
contacts and density in monodisperse sphere packs. J. Stat. Mech., Paper P07010
(2006).
Bekri, S., Howard, J., Muller, J., Adler, P.M.: Electrical resistivity index in multiphase
flow through porous media. Transport in Porous Media, 51, 41-65 (2003).
Bernabé, Y., Bruderer, C.: Effect of the variance of pore size distribution on the transport
properties of heterogeneous networks. J. Geophy. Res.: Solid Earth 103, 513 (1998).
Bhattad, P., Willson, C.S., Thompson, K.E.: Effect of network structure on
characterization and flow modeling using X-ray micro-tomography images of granular
and fibrous porous media. Transp. Porous Media 90, 363 (2011).
Bourget, S. J., Elrick, D.E., Tanner, C.B.: Electrical resistance units for moisture
measurements: their moisture hysteresis, uniformity, and sensitivity. Soil Sci. 86, 298
(1958).
Brooks, R. H., Corey, A.T.: Hydraulic properties of porous media. Hydrology Paper 3,
Department of Civil Engineering, Colorado State Univiversity, Fort Collins (1964).
Bryant, S., Pallatt, N.: Predicting formation factor and resistivity index in simple
sandstones. J. Pet. Sci. Eng. 15, 169 (1996).
22
Bryant, S.L., King, P.R., Mellor, D.W.: Network model evaluation of permeability and
spatial correlation in a real random sphere packing. Transp. Porous Media 11, 53
(1993).
Dadvar, M., Sahimi, M.: Pore network model of deactivation of immobilized glucose
isomerase in packed-bed reactors. III: Multiscale modeling. Chem. Eng. Sci. 58, 4935
(2003).
Dashtian, H., Yang, Y., Sahimi, M. Non-universality of the Archie exponent due to
multifractality of the resistivity well logs, Geophys. Res. Lett. 42, 1065 (2015).
Doussan, C., Ruy, S.: Prediction of unsaturated soil hydraulic conductivity with electrical
conductivity. Water Resour. Res. 45, W10408 (2009).
Eckberg, D. K., Sunada, D.K.: Nonsteady three-phase immiscible fluid distribution in
porous media. Water Resour. Res. 20, 1891 (1984).
Ewing, R.P., Hunt, A.G.: Dependence of the electrical conductivity on saturation in real
porous media. Vadose Zone J. 5, 731 (2006).
Feng, S., Halperin, B.I., Sen, P.N.: Transport properties of continuum systems near the
percolation threshold. Phys. Rev. B 35, 197 (1985).
Finney, J.L.: Random packing and the structure of simple liquids. I. Geometry of random
close packing. Proc. Roy. Soc. Lond. A 319, 479 (1970).
Friedman, S. P.: Soil properties influencing apparent electrical conductivity: a
review. Comput. Electron. Agri. 46, 45 (2005).
Garboczi, E. J.: Finite element and finite difference programs for computing the linear
electric and elastic properties of digital images of random materials, Building and Fire
23
Research Laboratory, National Institute of Standards and Technology. Springfield, VA
(1998).
Gerhard, J. I., Pang, T., Kueper, B.H.: Time scales of DNAPL migration in sandy
aquifers examined via numerical simulation. Ground Water 45, 147 (2007).
Ghanbarian, B., Hunt, A.G.: Universal scaling of gas diffusion in porous media. Water
Resour. Res. 50, 2242 (2014).
Ghanbarian-Alavijeh, B., Hunt, A.G.: Comments on “More general capillary pressure and
relative permeability models from fractal geometry” by Kewen Li. J. Contam.
Hydrol. 140, 21 (2012).
Ghanbarian, B., Hunt, A.G., Ewing, R.P., Skinner, T.E.: Universal scaling of the
formation factor in porous media derived by combining percolation and effective
medium theories. Geophys. Res. Lett. 41, 3884 (2014).
Ghanbarian, B., Hunt, A.G., Skinner, T.E., Ewing, R.P.: Saturation dependence of
transport in porous media predicted by percolation and effective medium
theories. Fractals 23, 1540004 (2015a).
Ghanbarian, B., Daigle, H., Hunt, A.G., Ewing, R.P., Sahimi, M.: Gas and solute
diffusion in partially saturated porous media: percolation theory and effective medium
approximation compared with lattice Boltzmann simulations. J. Geophys. Res.: Solid
Earth 120, 182 (2015b).
Halperin, B.I., Feng, S., Sen, P.N.: Differences between lattice and continuum
percolation transport exponents. Phys. Rev. Lett. 54, 2391 (1985).
Heiba, A.A., Sahimi, M., Scriven, L.E., Davis, H.T.: Percolation theory of two-phase
relative permeability. SPE Reservoir Eng. 7, 123 (1992).
24
Hunt, A.G., Ewing, R.P., Ghanbarian, B.: Percolation Theory for Flow in Porous Media,
3rd ed., Springer, Berlin (2014a).
Hunt, A. G., Ghanbarian, B., Ewing, R.P.: Saturation dependence of solute diffusion in
porous media: Universal scaling compared with experiments. Vadose Zone J. 13,
doi:10.2136/vzj2013.12.0204 (2014b).
Ioannidis, M.A., Chatzis, I., Lemaire, C., Perunarkilli, R.: Unsaturated hydraulic
conductivity from nuclear magnetic resonance measurements. Water Resour. Res. 42,
W07201 (2006).
Jiang, L., Liu, Y., Teng, Y., Zhao, J., Zhang, Y., Yang, M., Song, Y.: Permeability
estimation of porous media by using an improved capillary bundle model based on
micro-CT derived pore geometries. Heat and Mass Transfer 1, DOI 10.1007/s00231-
016-1795-4 (2016).
Johnson, D.L., Koplik, J., Schwartz, L.M.: New pore-size parameter characterizing
transport in porous media. Phys. Rev. Lett. 57, 2564 (1986).
Katz, A.J., Thompson, A.H.: Fractal sandstone pores: implications for conductivity and
pore formation. Phys. Rev. Lett. 54, 1325 (1985).
Katz, A.J., Thompson, A.H.: Quantitative prediction of permeability in porous
rock. Phys. Rev. B 34, 8179 (1986).
Katz, A.J., Thompson, A.H.: Prediction of rock electrical conductivity from mercury
injection measurements. J. Geophys. Res: Solid Earth 92, 599 (1987).
Kiefer, T., Villanueva, G., Brugger, J.: Conduction in rectangular quasi-one-dimensional
and two-dimensional random resistor networks away from the percolation threshold.
Phys. Rev. E 80, 021104 (2009).
25
Knackstedt, M.A., Arns, C.H., Sheppard, A.P., Senden, T.J., Sok, R.M., Cinar, Y.,
Olafuyi, A.O., Pinczewski, W.V. Padhy, G., Ioannidis, M.: Pore scale analysis of
electrical resistivity in complex core material. International Symposium of the Society
of Core Analysis, Calgary Canada, Sep. 10-12 (2007).
Knackstedt, M.A., Sahimi, M., Sheppard, A.P.: Invasion percolation with long-range
correlation: First-order phase transition and nonuniversal scaling properties. Phys.
Rev. E 61, 4920 (2000).
Knight, R.: Hysteresis in the electrical resistivity of partially saturated sandstones.
Geophys. 56, 2139 (1991).
Kogut, P.M., Straley, J.P.: Distribution-induced non-universality of the percolation
conductivity exponents. J. Phys. C 12, 2151 (1979).
Li, M., Tang, Y.B., Bernabé, Y., Zhao, J.Z., Li, X.F., Bai, X.Y., Zhang, L.H.: Pore
connectivity, electrical conductivity, and partial water saturation: Network
simulations. J. Geophys. Res.: Solid Earth 120, 4055 (2015).
Longeron, D.G., Argaud, M.J., Feraud, J.P.: Effect of overburden pressure and the nature
and microscopic distribution of fluids on electrical properties of rock samples. SPE
Form. Eval. 4, 194 (1989).
Makse, H.A., Johnson, D.L., Schwartz, L.M.: Packing of compressible granular
materials. Phys. Rev. Lett. 84, 4160 (2000).
Man, H.N., Jing, X.D.: Pore network modelling of electrical resistivity and capillary
pressure characteristics. Transp. Porous Media. 41, 263 (2000).
Mandelbrot, B.B.: Negative fractal dimensions and multifractals. Physica A 163, 306
(1990).
26
Mawer, C., Knight, R., Kitanidis, P.K.: Relating relative hydraulic and electrical
conductivity in the unsaturated zone. Water Resour. Res. 51, 599 (2015).
Montaron, B.: Connectivity theory – a new approach to modeling non-Archie
rocks. Petrophys. 50, 102 (2009).
Morrow, N. R.: Irreducible wetting-phase saturations in porous media. Chemical
Engineering Science, 25, 1799-1815 (1970).
Mualem, Y.: A new model for predicting the hydraulic conductivity of unsaturated
porous media. Water Resour. Res. 12, 513 (1976).
Mualem, Y., Friedman, S.P.: Theoretical prediction of electrical conductivity in saturated
and unsaturated soil. Water Resour. Res. 27, 2771 (1991).
Niu, Q., Fratta, D., Wang, Y.H.: The use of electrical conductivity measurements in the
prediction of hydraulic conductivity of unsaturated soils. J. Hydrol. 522, 475 (2015).
Ojeda, G., Perfect, E., Alcañiz, J.M., Ortiz, O.: Fractal analysis of soil water hysteresis as
influenced by sewage sludge application. Geoderma 134, 386 (2006).
Perrier, E., Rieu, M., Sposito, G., and G. de Marsily, G.: Models of the water retention
curve for soils with a fractal pore size distribution. Water Resour. Res. 32, 3025
(1996).
Revil, A.: Transport of water and ions in partially water-saturated porous media, Part 1.
Constitutive equations. Adv. Water Resour. doi:10.1016/j.advwatres.2016.02.006
(2016).
Revil, A., Cathles, L.M.: Permeability of shaly sands. Water Resour. Res. 35, 651 (1999)
Rieu, M., Sposito, G.: Fractal fragmentation, soil porosity, and soil water properties: I.
Theory, II. Applications. Soil Sci. Soc. Am. J. 55, 1231 (1991).
27
Roberts, J.N., Schwartz, L.M.: Grain consolidation and electrical conductivity in porous
media. Phys. Rev. B 31, 5990 (1985).
Sahimi, M.: Flow and Transport in Porous Media and Fractured Rock, 2nd ed. Wiley-
VCH, Weinheim (2011).
Sahimi, M.: Dispersion in porous media, continuous-time random walks, and percolation.
Phys. Rev. E 85, 016316 (2012).
Sahimi, M., Hughes, B.D., Scriven, L.E., Davis, H.T.: Stochastic transport in disordered
systems. J. Chem. Phys. 78, 6849 (1983a).
Sahimi, M., Hughes, B.D., Scriven, L.E., Davis, H.T.: Real-space renormalization and
effective-medium approximation to the percolation conduction problem. Phys. Rev. B
28, 307 (1983b).
Schwartz, L. M., Kimminau, S.: Analysis of electrical conduction in the grain
consolidation model. Geophys. 52, 1402 (1987).
Sharma, M. M., Garrouch, A. and Dunlap, H. F.: Effects of wettability, pore geometry,
and stress on electrical conduction in fluid-saturated rocks, Log Analyst 32, 511–526
(1991).
Stauffer, D., Aharony, A.: Introduction to Percolation Theory, 2nd ed. Taylor and
Francis, London (1994).
Straley, J.P.: Non-universal threshold behaviour of random resistor networks with
anomalous distribution of conductances. J. Phys. C 15, 2343 (1982).
Suman, R. J., Knight, R.J.: Effects of pore structure and wettability on the electrical
resistivity of partially saturated rocks-A network study. Geophys. 62, 1151 (1997).
28
Swanson, B. F.: Rationalizing the influence of crude wetting on reservoir fluid flow with
electrical resistivity behavior. Journal of Petroleum Technology, 32, 1459-1464 (1980).
Toumelin, E., Torres-Verdín, C.: Object-oriented approach for the pore-scale simulation
of DC electrical conductivity of two-phase saturated porous media. Geophysics, 73,
E67-E79 (2008).
Tsakiroglou, C.D., Fleury, M.: Resistivity index of fractional wettability porous media. J.
Pet. Sci. Eng. 22, 253 (1999a).
Tsakiroglou, C.D., Fleury, M.: Pore network analysis of resistivity index for water-wet
porous media. Transp. Porous Media 35, 89 (1999b).
Tyler, S. W., Wheatcraft, S.W.: Fractal processes in soil water retention, Water Resour.
Res. 26, 1047 (1990).
Vaez Allaei, S.M., Sahimi, M.: Computing transport properties of heterogeneous media
by an optimization method. Int. J. Modern Phys. C 16, 1 (2005).
Valfouskaya, A., Adler, P.M.: Nuclear-magnetic-resonance diffusion simulations in two
phases in porous media. Phys. Rev. E 72, 056317 (2005).
Wang, K. W., Sun, J.M., Guan, J.T., Zhu, D.W.: A percolation study of electrical
properties of reservoir rocks. Physica A 380, 19 (2007).
Zhan, X., Schwartz, L.M., Toksöz, M.N., Smith, W.C., Morgan, F.D.: Pore-scale
modeling of electrical and fluid transport in Berea sandstone. Geophys. 75, F135
(2010).
Zhou, D., Arbabi, S., Stenby, E.H.: A percolation study of wettability effect on the
electrical properties of reservoir rocks. Transp. Porous Media 29, 85 (1997).
29
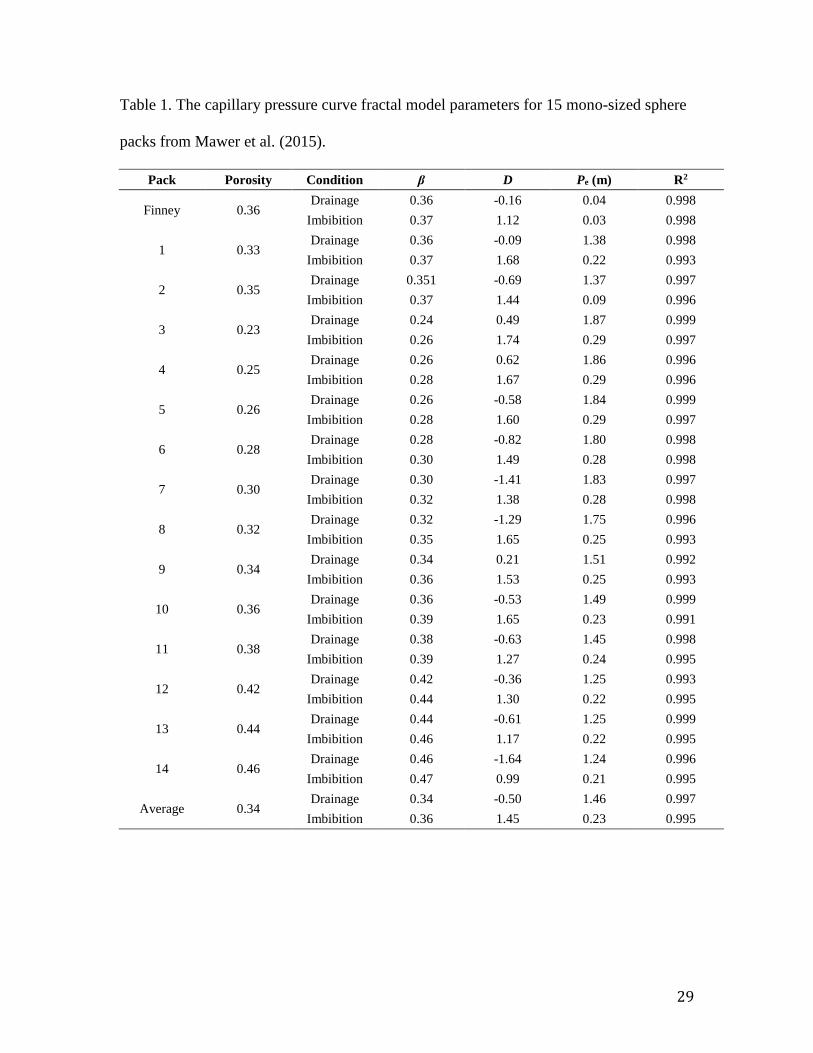
Table 1. The capillary pressure curve fractal model parameters for 15 mono-sized sphere
packs from Mawer et al. (2015).
Pack Porosity Condition β D Pe (m) R2
Finney 0.36 Drainage 0.36 -0.16 0.04 0.998
Imbibition 0.37 1.12 0.03 0.998
1 0.33 Drainage 0.36 -0.09 1.38 0.998
Imbibition 0.37 1.68 0.22 0.993
2 0.35 Drainage 0.351 -0.69 1.37 0.997
Imbibition 0.37 1.44 0.09 0.996
3 0.23 Drainage 0.24 0.49 1.87 0.999
Imbibition 0.26 1.74 0.29 0.997
4 0.25 Drainage 0.26 0.62 1.86 0.996
Imbibition 0.28 1.67 0.29 0.996
5 0.26 Drainage 0.26 -0.58 1.84 0.999
Imbibition 0.28 1.60 0.29 0.997
6 0.28 Drainage 0.28 -0.82 1.80 0.998
Imbibition 0.30 1.49 0.28 0.998
7 0.30 Drainage 0.30 -1.41 1.83 0.997
Imbibition 0.32 1.38 0.28 0.998
8 0.32 Drainage 0.32 -1.29 1.75 0.996
Imbibition 0.35 1.65 0.25 0.993
9 0.34 Drainage 0.34 0.21 1.51 0.992
Imbibition 0.36 1.53 0.25 0.993
10 0.36 Drainage 0.36 -0.53 1.49 0.999
Imbibition 0.39 1.65 0.23 0.991
11 0.38 Drainage 0.38 -0.63 1.45 0.998
Imbibition 0.39 1.27 0.24 0.995
12 0.42 Drainage 0.42 -0.36 1.25 0.993
Imbibition 0.44 1.30 0.22 0.995
13 0.44 Drainage 0.44 -0.61 1.25 0.999
Imbibition 0.46 1.17 0.22 0.995
14 0.46 Drainage 0.46 -1.64 1.24 0.996
Imbibition 0.47 0.99 0.21 0.995
Average 0.34 Drainage 0.34 -0.50 1.46 0.997
Imbibition 0.36 1.45 0.23 0.995
30
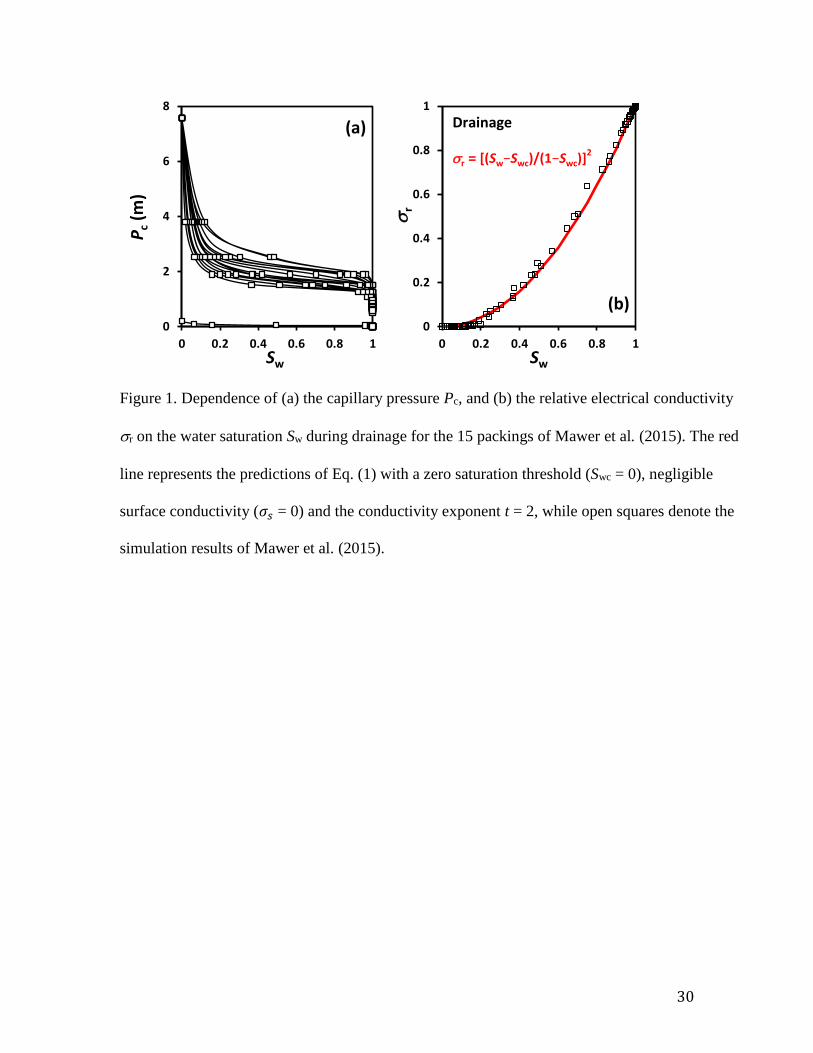
Figure 1. Dependence of (a) the capillary pressure Pc, and (b) the relative electrical conductivity
r on the water saturation Sw during drainage for the 15 packings of Mawer et al. (2015). The red
line represents the predictions of Eq. (1) with a zero saturation threshold (Swc = 0), negligible
surface conductivity (𝜎𝑠 = 0) and the conductivity exponent t = 2, while open squares denote the
simulation results of Mawer et al. (2015).
0
2
4
6
8
0 0.2 0.4 0.6 0.8 1
Pc
(m)
Sw
(a)
0
0.2
0.4
0.6
0.8
1
0 0.2 0.4 0.6 0.8 1
r
Sw
(b)
r = [(Sw−Swc)/(1−Swc)]2
Drainage
31
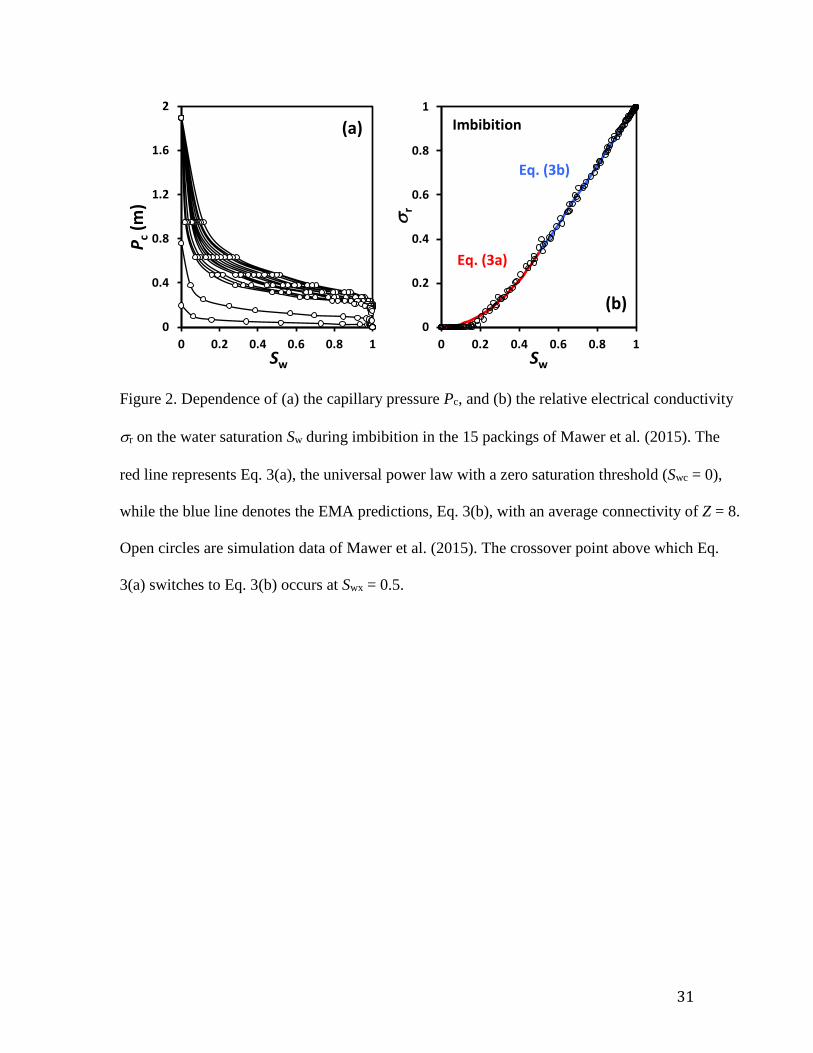
Figure 2. Dependence of (a) the capillary pressure Pc, and (b) the relative electrical conductivity
r on the water saturation Sw during imbibition in the 15 packings of Mawer et al. (2015). The
red line represents Eq. 3(a), the universal power law with a zero saturation threshold (Swc = 0),
while the blue line denotes the EMA predictions, Eq. 3(b), with an average connectivity of Z = 8.
Open circles are simulation data of Mawer et al. (2015). The crossover point above which Eq.
3(a) switches to Eq. 3(b) occurs at Swx = 0.5.
0
0.4
0.8
1.2
1.6
2
0 0.2 0.4 0.6 0.8 1
Pc
(m)
Sw
(a)
0
0.2
0.4
0.6
0.8
1
0 0.2 0.4 0.6 0.8 1
r
Sw
(b)
Eq. (3a)
Eq. (3b)
Imbibition
32
Figure 3. Dependence of (a) the capillary pressure Pc; (b) the normalized capillary pressure
Pc/Pe, and (c) the relative electrical conductivity r on the water saturation Sw. (d) Dependence of
the relative electrical conductivity on the capillary pressure during draiange and imbibition for
packing 3. Open triangles with the blue line represent the imbibition process, while open squares
with the red line show the drainage data of Mawer et al. (2015).
0
2
4
6
8
0 0.25 0.5 0.75 1
Cap
illar
y p
ress
ure
Pc
(m)
Sw
Drainage
Imbibition(a)
0
2
4
6
8
0 0.25 0.5 0.75 1
No
rm c
apill
ary
pre
ssu
re P
c/P
a
Sw
Drainage
Imbibition(b)
0
0.2
0.4
0.6
0.8
1
0 0.25 0.5 0.75 1
Re
lati
ve e
lect
rica
l co
nd
uct
ivit
y
r
Sw
Drainage
Imbibition
(c)
0
0.2
0.4
0.6
0.8
1
0.01 0.1 1 10
Re
lati
ve e
lect
rica
l co
nd
uct
ivit
y
r
Pc (m)
Drainage
Imbibition
(d)
33
Figure 4. Dependence of the relative electrical conductivity r on the water saturation Sw during
the draiange process in the packings of glass beads under, (a) water- , and (b) oil-wet conditions
reported by Knackstedt et al. (2007). Open circles denote the simulation results computed by
using the image of the glass beads, while the red line represents the predictions of Eq. (1) with a
zero saturation threshold (Swc = 0), negligible surface conductivity (𝜎𝑠 = 0), and conductivity
exponent t = 2.
0
0.2
0.4
0.6
0.8
1
0 0.2 0.4 0.6 0.8 1
r
Sw
Water-wet
(a)0
0.2
0.4
0.6
0.8
1
0 0.2 0.4 0.6 0.8 1
r
Sw
Oil-wet
(b)
34
Figure 5. Dependence of the relative electrical conductivity r on the water saturation Sw with,
(a) n-decane, and (b) naphtha as the non-wetting phase in a water-wet packing of uniform glass
beads reported by Sharma et al. (1991). Open and solid circles denote, respectively, the
experimental measurements during drainage and imbibition. Red line represents the predictions
of Eq. (1) with a zero saturation threshold (Swc = 0), negligible surface conductivity (𝜎𝑠 = 0), and
the conductivity exponent t = 2.
0
0.2
0.4
0.6
0.8
1
0 0.2 0.4 0.6 0.8 1
r
Sw
Drainage
Imbibition
(a)0
0.2
0.4
0.6
0.8
1
0 0.2 0.4 0.6 0.8 1
r
Sw
Drainage
Imbibition
(b)


![Dynamics of a Hysteretic Relay Oscillator with Periodic Forcing · · 2017-10-24(1) ¨x(t)+F[x(t)] =Acos(ωt+φ),A≥0 ... convenient to introduce a Poincar´emap[25, 31] and studythis](https://static.fdocument.org/doc/165x107/5ad5be1b7f8b9a5d058d8e05/dynamics-of-a-hysteretic-relay-oscillator-with-periodic-forcing-1-xtfxt.jpg)