Human Vision and Color - biomachina.org · Human Vision and Color ... Many visual properties obey...
100
Human Vision and Color For students of HI 5323 “Image Processing” Willy Wriggers, Ph.D. School of Health Information Sciences http://biomachina.org/courses/processing/12.html T H E U N I V E R S I T Y of T E X A S H E A L T H S C I E N C E C E N T E R A T H O U S T O N S C H O O L of H E A L T H I N F O R M A T I O N S C I E N C E S
Transcript of Human Vision and Color - biomachina.org · Human Vision and Color ... Many visual properties obey...

Human Vision and ColorFor students of HI 5323 “Image Processing”
Willy Wriggers, Ph.D.School of Health Information Sciences
http://biomachina.org/courses/processing/12.html
T H E U N I V E R S I T Y of T E X A S
H E A L T H S C I E N C E C E N T E R A T H O U S T O N
S C H O O L of H E A L T H I N F O R M A T I O N S C I E N C E S

Human Vision

Human VisionSome properties of human vision that affect image perception:
Linear and non-linear partsNon-linear (approx. logarithmic) encoding of inputAdaptationRelative-contrast encodingVarying sensitivity to spatial frequenciesGenerally treats brightness and color separately
© http://web.engr.oregonstate.edu/~enm/cs519

Discrimination ExperimentsMany vision experiments involve comparisons
“Two alternative, forced choice” (2-AFC) experiments:Is there a difference? (yes/no)Which is brighter, farther apart, etc. (top/bottom, left/right, etc.)
Random guessing without bias: 50% correct
Pick some percentage above which the observer must get it right:often 75% (half the time they “see it”, half the time they guess)
Vary experimental parameter to determine the threshold T above which the observer reaches this desired level of confidence
This is called the just noticeable difference (JND)
Sensitivity: 1/T
© http://web.engr.oregonstate.edu/~enm/cs519

Weber’s LawMany visual properties obey Weber’s Law
For intensity discrimination:
for some constant c
In other words, the JND ∆I for intensity is proportional to the intensity itself
Also applies to distance judgments, spatial frequency discrimination, and many others
Example: 1 mile vs. 2 miles; 51 miles vs. 52 miles!
cII=
∆
© http://web.engr.oregonstate.edu/~enm/cs519

Weber’s Law and Logarithmic Encoding
Differences of logarithmic encoding produces Weber’s Law
The human intensity sensitivity function isn’t exactly logarithmic, but it’s close enough to be a useful model
( )
( )constant
1log
logloglog
=+=
⎟⎠
⎞⎜⎝
⎛ ∆+=−∆+
cI
IIIII
© http://web.engr.oregonstate.edu/~enm/cs519

AdaptationOur eyes have an incredible ability to adapt to lighting conditions
Total JND steps for the eye is about 1000
Total JND steps for fixed adaptation is about 200
© http://web.engr.oregonstate.edu/~enm/cs519

Contrast EncodingThe response of the eye to light isn’t absolute – it’s relative to the surrounding intensities
This causes the Mach effect at strong intensity transitions:
Even our color perception seems to be, to a degree, based on relative differences
Intensity: measurable light
Brightness: the perceived illumination© http://web.engr.oregonstate.edu/~enm/cs519
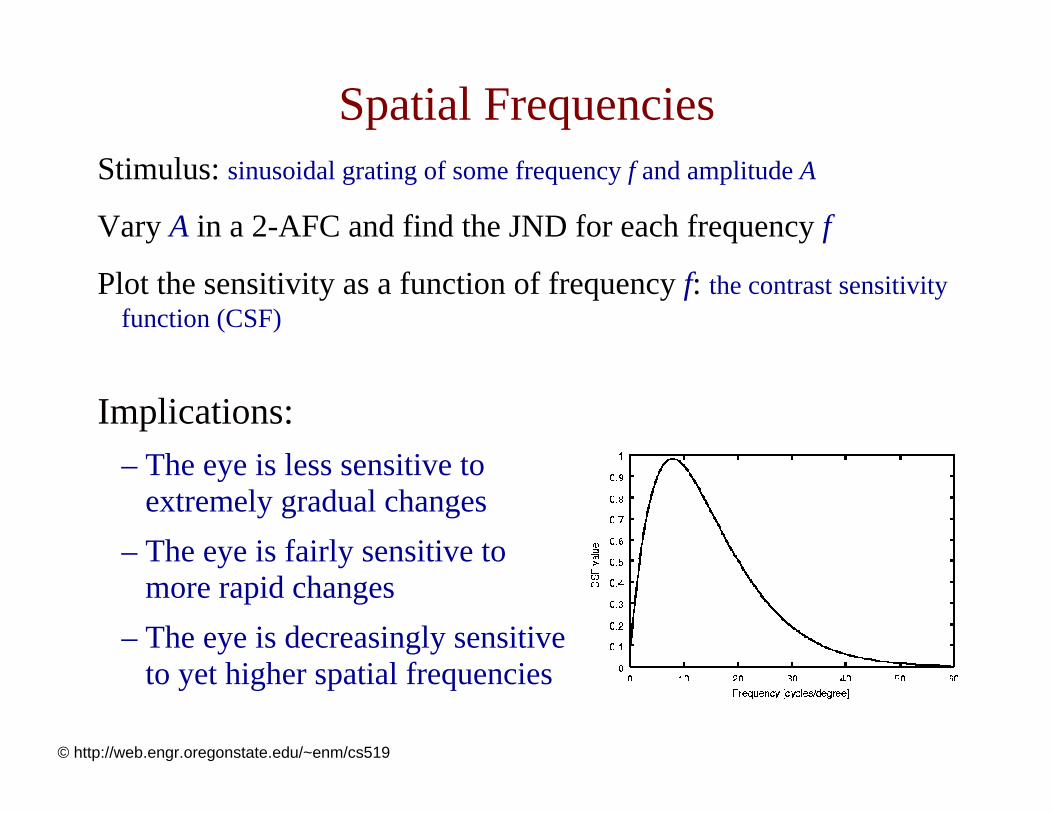
Spatial FrequenciesStimulus: sinusoidal grating of some frequency f and amplitude A
Vary A in a 2-AFC and find the JND for each frequency f
Plot the sensitivity as a function of frequency f: the contrast sensitivity function (CSF)
Implications:– The eye is less sensitive to
extremely gradual changes– The eye is fairly sensitive to
more rapid changes– The eye is decreasingly sensitive
to yet higher spatial frequencies
© http://web.engr.oregonstate.edu/~enm/cs519

Brightness vs. Color• The human visual system seems to treat brightness and color
separately
• Physically separate pathways in the visual cortex (brain)Some crossover, but weak
• Perception of shape and form seems to be based on brightness, not color
• Much more sensitive to changes in brightness than to changes in color
© http://web.engr.oregonstate.edu/~enm/cs519

Time-Dependent LimitationsIncomplete capture of time-dependent images or scenes:
• Change blindness:
http://www.usd.edu/psyc301/ChangeBlindness.htm
• Motion induced blindness:
http://www.michaelbach.de/ot/mot_mib
• More visual illusions:
http://www.michaelbach.de/ot

DisplaysWhen building visual displays you have to consider properties ofhuman vision:
Exponential encoding for perceptual linearizationBe careful of Mach effectsConsider adaptationMake it bright!Consider the human CSFBe careful with color
© http://web.engr.oregonstate.edu/~enm/cs519

Color

What is Color?• Color is the spectrum of light being perceived by the human
visual system
• Visible light is electromagnetic energy in the 400 to 700 nm wavelength range of the spectrum
• Why discuss color?Many ways to talk about color: tint, shade, hue, brightness, luminance, color, chromaticity, …Useful to understand how the eye perceives color
© http://web.engr.oregonstate.edu/~enm/cs519

600 nm
Wavelength in meters (m)
Gamma X rays Infrared Radar FM TV AMUltra-violet
10 -12 10 -8 10 -4 10 41 10 8
electricityACShort-
wave
400 nm 500 nm 700 nmWavelength in nanometers (nm)
Visible light
Electromagnetic Radiation - Spectrum
© http://web.engr.oregonstate.edu/~enm/cs519

The Interaction of Light and Matter• Some or all of the light may be absorbed depending on the
pigmentation of the object.
© http://web.engr.oregonstate.edu/~enm/cs519

Wavelength (λ)400 500 600 700
0
0.5
1
Rel
ativ
e P
ower
Spectral Power Distribution• The Spectral Power Distribution (SPD) of a light is a
function P(λ) which defines the power in the light at each wavelength
© http://web.engr.oregonstate.edu/~enm/cs519

Examples
© http://web.engr.oregonstate.edu/~enm/cs519

Color Receptors and the Eye

The Physiology of Human Vision
© http://web.engr.oregonstate.edu/~enm/cs519

The Human Eye
© http://web.engr.oregonstate.edu/~enm/cs519

The Human Retina
rods cones
light
bipolar
ganglion
horizontal
amacrine
© http://web.engr.oregonstate.edu/~enm/cs519
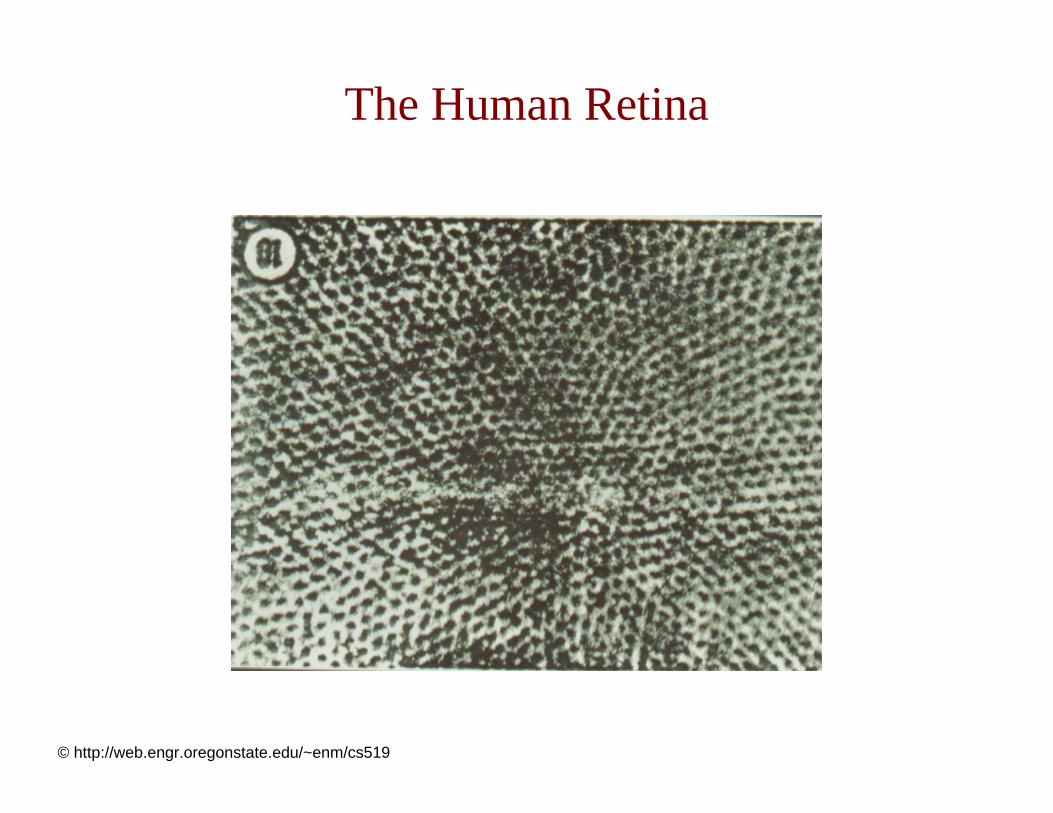
The Human Retina
© http://web.engr.oregonstate.edu/~enm/cs519

Retinal Photoreceptors
• Outer segments contain the photopigment rhodopsin• Light absorption induces conformational changes in rhodopsin• Second messenger cascade (reduced cGMP concentration)• Closing of cation channels leads to hyperpolarization of photoreceptor• Receptor currents evoked by decreased neurotransmitter at synaptic terminals

Cones• High illumination levels (Photopic vision)
• Less sensitive than rods.
• 5 million cones in each eye.
• Density decreases with distance from fovea.
© http://web.engr.oregonstate.edu/~enm/cs519

3 Types of Cones
• L-cones, most sensitive to red light (610 nm)
• M-cones, most sensitive to green light (560 nm)
• S-cones, most sensitive to blue light (430 nm)
© http://web.engr.oregonstate.edu/~enm/cs519

Color Receptors• Cones have three kinds of color-sensitive pigments, each
responding to a different range of wavelengths
• These are roughly “red”, “green” and “blue” in their peak response but each responds to a wide range of wavelengths
• The combination of the responses of these different receptors gives us our color perception
• This is called the tri-stimulus model of color vision
© http://web.engr.oregonstate.edu/~enm/cs519

Cones Spectral Sensitivity
© http://web.engr.oregonstate.edu/~enm/cs519

Metamers
• Two lights that appear the same visually. They might have different SPDs (spectral power distributions)
© http://web.engr.oregonstate.edu/~enm/cs519

Color Spaces

History
• Thomas Young (1773-1829)
“A few different retinal receptors operating with different wavelength sensitivities will allow humans to perceive the number of colors that they do. “
• James Clerk Maxwell (1872)
“We are capable of feeling three different color sensations. Light of different kinds excites three sensations in different proportions, and it is by the different combinations of these three primary sensations that all the varieties of visible colorare produced. “
• Trichromatic: “Tri”=three “chroma”=color
© http://web.engr.oregonstate.edu/~enm/cs519

R
G
B
Brightness
Hue
black-white
red-green
blue-yellow
Cubic Color Spaces Polar Color Spaces Opponent Color Spaces
3D Color SpacesThree types of cones suggests color is a 3D quantity. How to define 3D color space?
© http://web.engr.oregonstate.edu/~enm/cs519

• The simplest color model is to attempt to model these three stimulus values: red, green, blue
• 24-bit color: one byte each for red, green, and blue
• Each is called a channel
The RGB Color Model
© http://web.engr.oregonstate.edu/~enm/cs519

126141113636 111
36111
36 1212 17
17 11114
12617
36
12111
3636200 1214
126 1736 36
111
12
143636200 12
14126 1736 36
11136200
2001214111
14126
12617
36
36
36
361214
111
111
361261736
36200
11172
7212
12 17
10 1283617
200 1111214
126
126126
126
17 1717
17
36
36
36
3636
200200
20012
12
12
1414
111
111
72
7272 106 155
10 128
3617
200 11112
14
126
126
126
126
17 17
17
17
36
36
36
36
36
200
200
200
12
12
12
14
14
111
111
72
72
72 106 155
14
126 17
36 36
111
36200
200
12
14111
14
126
126
17
36
36
36
36
12
14
111
111
36
12617
36
36200
111
72
72
12
12 17
12614111
3636 111
36
111
36 12
12 17
17 111
14
126
17
36
12
111
3636200 12
14
126 17
36 36
111
12
14
3636200 12
RGB Image
© http://web.engr.oregonstate.edu/~enm/cs519

Luminance and ChromaticityRGB isn’t the most intuitive model of color
Artists usually think of dark/light and color as two different things:
LuminanceChromaticity
© http://web.engr.oregonstate.edu/~enm/cs519

LuminanceLuminanceIntensityBrightnessLightnessLumaValue
• All refer to the light/dark properties of the stimulus
• Some models use linear, non-linear, or perceptually linear encoding
© http://web.engr.oregonstate.edu/~enm/cs519

ChromaticityRequires two parameters
Example:Hue The dominant wavelengthSaturation How pure/deep that color is relative to gray
Note: Some models use different chromaticity parameters
© http://web.engr.oregonstate.edu/~enm/cs519

CIE XYZ• CIE:
In French: Commission Internationale de l'EclairageIn English: International Commission on Illumination
• Not the same as RGB and not tied to hardware
• Describes the entire visible gamutTwo chromaticity (similar to hue or color) values: X and ZOne luminous efficiency (similar to intensity) value: Y
• Provides a standard for sharing color information between disciplines
Computer graphics and fabric design
© http://web.engr.oregonstate.edu/~enm/cs519

The CIE Chromaticity DiagramCIE uses three primaries, X, Y, and Z, to replace red, green, and blue
XYZ primaries computed from RGB (Rec. 709) through a linear transform:
Normalized CIE primaries:
ZYXZz
ZYXYy
ZYXXx
++=
++=
++=
⎥⎥⎥
⎦
⎤
⎢⎢⎢
⎣
⎡
⎥⎥⎥
⎦
⎤
⎢⎢⎢
⎣
⎡=
⎥⎥⎥
⎦
⎤
⎢⎢⎢
⎣
⎡
709
709
709
0.9502270.1191930.0193340.072169715160.0212671.0
180423.0357580.0412453.0
BGR
ZYX
© http://web.engr.oregonstate.edu/~enm/cs519

The CIE Chromaticity DiagramConsider the plane
x + y + z = 1
Every point on this plane can be characterized by unique x and y(z = 1 – x – y)
Plotting on this plane the color of each wavelength gives the CIE chromaticity diagram
© http://web.engr.oregonstate.edu/~enm/cs519

The CIE Chromaticity Diagram

Color Gamuts• The color space spanned by a set of primary (base) colors is
called a color gamut
• Example: the space of all colors that can be displayed by a device with three color phosphors is the gamut of that device
• No three-primary color (with positive weights) spans the full space of perceivable colors!
• The CIE chromaticity diagram spans the gamut of human color vision
Recall that cones in the eye integrate over a wide range of wavelengths
© http://web.engr.oregonstate.edu/~enm/cs519

The RGB ModelWhen light is mixed, wavelengths combine (add)
The Red-Green-Blue (RGB) model is used most often for additive models
Adding a color and its complement create white
YellowBlue
MagentaGreen
CyanRed
ComplementPrimary
© http://web.engr.oregonstate.edu/~enm/cs519

RGB Space• Can’t produce all visible colors
• Contained within CIE XYZ
• Additive to produce other colors
• Perfect for imaging since hardware uses three color phosphors
© http://web.engr.oregonstate.edu/~enm/cs519

Various RGB Color Spaces
© http://www.aim-dtp.net/aim/photoshop

RGB Color SpaceSubset of 3-D Cartesian space
G
B
R
White
Cyan
Black
Yellow
Magenta
Grays
© http://web.engr.oregonstate.edu/~enm/cs519

Additive Colors: RGB
Green
BlueRed
White
Yellow Cyan
Magenta
© http://web.engr.oregonstate.edu/~enm/cs519

Subtractive Colors
Green
BlueRed
Black
Yellow Cyan
Magenta
© http://web.engr.oregonstate.edu/~enm/cs519

The CMY Model• Paint/ink/dye subtracts color from white light and reflects the
rest
• Mixing paint pigments subtracts multiple colors
• The Cyan-Magenta-Yellow (CMY) model is the most common subtractive model
Same as RGB except white is at the origin and black is at the extent of the diagonal
• Very important for hardcopy devices
© http://web.engr.oregonstate.edu/~enm/cs519

CMY vs. RGB
⎥⎥⎥
⎦
⎤
⎢⎢⎢
⎣
⎡−
⎥⎥⎥
⎦
⎤
⎢⎢⎢
⎣
⎡=
⎥⎥⎥
⎦
⎤
⎢⎢⎢
⎣
⎡
BGR
YMC
111
White minus Blue minus Green = Red
© http://web.engr.oregonstate.edu/~enm/cs519

CMY Color Model
CMY = Cyan, Magenta, Yellow
Magenta – removes Green
B G R
Black – removes all
Yellow – removes Blue
B G R
B G R
trans
mit
Cyan – removes Red
© http://web.engr.oregonstate.edu/~enm/cs519

Combining ColorsAdditive (RGB) Subtractive (CMY)

yellow
B G R
+
B G R
redR
=
magenta
B G R
B G R
Example: Red = Magenta + Yellow
© http://web.engr.oregonstate.edu/~enm/cs519

The CMYK Model• Black created by:
Adding a subtractive color and its complementAdding all three subtractive colors
• Problem: paints/inks/dyes are imperfect, so it’s hard to make pure black (especially a problem in print where black is used so often)
• C+M+Y = dark brown not black
• Solution: add black (K) as a fourth primary CMYK color model
© http://web.engr.oregonstate.edu/~enm/cs519

C + M + Y = K (black)
100 50 70
=
50 0 2050
+
C M Y C M YK
CMY + Black
• Using separate ink for black is more economical
• Black instead of C+M+Y is crisper with more contrast
© http://web.engr.oregonstate.edu/~enm/cs519

Example
© http://web.engr.oregonstate.edu/~enm/cs519

Example
© http://web.engr.oregonstate.edu/~enm/cs519

Example
© http://web.engr.oregonstate.edu/~enm/cs519

Example
© http://web.engr.oregonstate.edu/~enm/cs519

Example
© http://web.engr.oregonstate.edu/~enm/cs519

Various CMY & RGB Gamuts
Simplified:
RGB
CMY
© http://www.mlab.nl/GtoDSA/05_Techniques/02_Colour/Colour_Gamut.htm
© http://www.phototests.com/Photoshop/help.html

Printing Color Transfer
Although the color gamuts for different devices overlap, they don't match exactly, so colors available on video monitor may not be printable on a press.
© http://www.beezlebugbit.com/school/color/colorspace.htm

Printing Color Transfer
When colors are translated from the RGB gamut of the computer monitor to CMYK gamut of process printing inks, the CMYK range does a better job of reproducing some colors than it does with others.
© http://www.mlab.nl/GtoDSA/05_Techniques/02_Colour/Colour_Gamut.htm

YIQ Color Model• YIQ is the color model used for color TV in America
(NTSC= National Television Systems Committee)
• Y is luminance, I & Q are color (I=red/green,Q=blue/yellow)Note: Y is the same as CIE’s Y Result: backwards compatibility with B/W TV!
• Convert from RGB to YIQ:
• The YIQ model exploits properties of our visual system, which allows to assign different bandwidth for each of the primaries.
⎥⎥⎥
⎦
⎤
⎢⎢⎢
⎣
⎡
⎥⎥⎥
⎦
⎤
⎢⎢⎢
⎣
⎡
−−−=
⎥⎥⎥
⎦
⎤
⎢⎢⎢
⎣
⎡
BGR
QIY
31.052.021.032.028.060.0
11.059.030.0
© http://web.engr.oregonstate.edu/~enm/cs519

YIQ BandwithWhy separates luminance or brightness from color?
We perceive brightness ranges better than color so we can give it more bandwidth:
Y: 4.5 MHzI: 1.5 MHzQ: 0.6 MHz
© http://web.engr.oregonstate.edu/~enm/cs519

YUV Color ModelYUV is the color model used for color TV in Europe (PAL), and in video. Also called YCbCr.Y is luminance as in YIQ.U and V are blue and red (Cb and Cr).The YUV uses the same benefits as YIQ,(5.5 MHz for Y, 1.3 for U and V). Converting from RGB to YUV: • Y = 0.299R + 0.587G + 0.114B• U = 0.492(B – Y)• V = 0.877(R – Y)
© http://web.engr.oregonstate.edu/~enm/cs519

YUV - Example
U VY
© http://web.engr.oregonstate.edu/~enm/cs519

Tints and Shades
Tint: adding more white to a color
Shade: adding more black to a color
Tints and shades are not inverses! Why? Hint: Saturation…
© http://web.engr.oregonstate.edu/~enm/cs519

HSV Color Space
Brightness Scale
Saturation Scale
HSV = Hue Saturation Value a.k.a. HSB = Hue Saturation Brightness
© http://web.engr.oregonstate.edu/~enm/cs519

HSV
ValueSaturation
Hue
© http://web.engr.oregonstate.edu/~enm/cs519

HSV
• Much more intuitive for specifying colors!
• Hue: the color
• Saturation: the depth of the color
• Value: the brightness of the color
• Results from a non-linear distortion of the RGB cube
• Singularities at pure black and pure white
© http://web.engr.oregonstate.edu/~enm/cs519

HSV
0 ≤ s ≤ 10 ≤ v ≤ 10 ≤ h ≤ 360
Value (v)
Saturation (s)
Hue (h)
G
B
R
White
Cyan
Black
Yellow
MagentaGrays
Red
YellowGreen
Cyan
Blue Magenta
Black
White
GraysNon-linear
distortion
© http://web.engr.oregonstate.edu/~enm/cs519

HLS Color Space
red0°
green120° yellow
Blue240°
cyan
magenta
V
black0.0
0.5
HS
HLS = Hue Lightness Saturation
© http://web.engr.oregonstate.edu/~enm/cs519

The Artist Point of View• Hue - The color we see (red, green, purple)
• Saturation - How far is the color from gray (pink is less saturated than red, sky blue is less saturated than royal blue)
• Brightness/Lightness (Luminance) - How bright is the color
white
© http://web.engr.oregonstate.edu/~enm/cs519

Munsell Color System
Equal perceptual steps in Hue Saturation Value.Hue: R, YR, Y, GY, G, BG, B, PB, P, RP
(each subdivided into 10)Value: 0 ... 10 (dark ... pure white)Chroma: 0 ... 20 (neutral ... saturated) Example:
5YR 8/4
© http://web.engr.oregonstate.edu/~enm/cs519

Munsell Book of Colors
© http://web.engr.oregonstate.edu/~enm/cs519

Munsell Book of Colors
© http://web.engr.oregonstate.edu/~enm/cs519

Color-Encoding

Pseudo ColorColor can make information visualization more interesting, but be careful using color to convey information
Specific color meanings: useful, but keep them limited
Color scales are harder to interpret than intensity scales(Heat scale is one of the few that partially works)
http://asapdata.arc.nasa.gov
Atchafalya Bay Thermal Pseudocolor Image

Color Image ProcessingPick a color space that makes sense for your application
To manipulate intensity without changing chromaticity (or to manipulate chromaticity without affecting intensity), use an intensity-chromaticity based model
For perceptual linearity (interpolation, etc.) use CIE Luv or CIE Lab(or similar) color space
For user interaction, try HSV or something similar
Point: Don’t just think that RGB is the only way to manipulate color
© http://web.engr.oregonstate.edu/~enm/cs519

Color-ReductionMany color-encoding schemes use some finite number of colors from a larger palette
Example: 8-bit color uses a 256-element look-up table (LUT) to map pixel values (indices) to 24-bit color values
Problem: how to convert 24-bit image to 8-bit pseudo-color
Answer: Color Quantization
© http://web.engr.oregonstate.edu/~enm/cs519

Color Quantization
Common color resolution for high quality images is 256 levels for each Red, Green, Blue channels, or 2563 = 16777216 colors.
How can an image be displayed with fewer colors than it contains?
Select a subset of colors (the colormap or pallet) and map the rest of the colors to them.
With e.g. 8 bits per pixel and color look up table we can display at most 256 distinct colors at a time.
To do that we need to choose an appropriate set of representative colors and map the image into these colors
© www.math.tau.ac.il/~dcor/Graphics/cg-slides/color-quantization04.ppt

Color Quantization
2 colors
256 colors
16 colors
4 colors
© www.math.tau.ac.il/~dcor/Graphics/cg-slides/color-quantization04.ppt

Quantization Phases
Sample the original image for color statistics
Select color map based on those statistics
Map the colors to their representative in the color map
Redraw the image, quantizing each pixel Vector Quantization
Mapping…
© www.math.tau.ac.il/~dcor/Graphics/cg-slides/color-quantization04.ppt

The reds are not that popular (but needed)
Naive Color Quantization (I)Retaining the 16 most popular RGB colors.
© www.math.tau.ac.il/~dcor/Graphics/cg-slides/color-quantization04.ppt

Naive Color Quantization (II)24 bit to 8 bit:
Retaining 3-3-2 most significant bits of the R,G and B components.
© www.math.tau.ac.il/~dcor/Graphics/cg-slides/color-quantization04.ppt

3-3-2
© www.math.tau.ac.il/~dcor/Graphics/cg-slides/color-quantization04.ppt

3-3-2
© www.math.tau.ac.il/~dcor/Graphics/cg-slides/color-quantization04.ppt

3-3-2
© www.math.tau.ac.il/~dcor/Graphics/cg-slides/color-quantization04.ppt

3-3-2
© www.math.tau.ac.il/~dcor/Graphics/cg-slides/color-quantization04.ppt

Median Cut
© www.math.tau.ac.il/~dcor/Graphics/cg-slides/color-quantization04.ppt

Original Image
© www.math.tau.ac.il/~dcor/Graphics/cg-slides/color-quantization04.ppt

Threshholding
© www.math.tau.ac.il/~dcor/Graphics/cg-slides/color-quantization04.ppt

Median Cut (4 Gray levels)
© www.math.tau.ac.il/~dcor/Graphics/cg-slides/color-quantization04.ppt

Median Cut (8 Gray levels)
© www.math.tau.ac.il/~dcor/Graphics/cg-slides/color-quantization04.ppt

A Better Solution: k-Means
© www.math.tau.ac.il/~dcor/Graphics/cg-slides/color-quantization04.ppt

24 bit
© www.math.tau.ac.il/~dcor/Graphics/cg-slides/color-quantization04.ppt

8 bit
© www.math.tau.ac.il/~dcor/Graphics/cg-slides/color-quantization04.ppt

4 bit
© www.math.tau.ac.il/~dcor/Graphics/cg-slides/color-quantization04.ppt

Resources
Textbook:
Kenneth R. Castleman, Digital Image Processing, Chapter 15, 21, 22