
homology modeling of larger proteins guided by de novo … · C. α, C. β, 13. C′, 15 ... This...
8
BRIEF COMMUNICATIONS NATURE METHODS | VOL.12 NO.8 | AUGUST 2015 | 747 data with backbone residual dipolar couplings, sparse 1 H N - 1 H N NOE data 9 or distance restraints extracted from remote homology models 10 can extend the size limit of the de novo structure genera- tion approach, but the steeply increasing computational cost with increasing protein size poses serious challenges. Here we introduce a more direct approach for integrating chemical shift and sparse NOE data into existing, powerful comparative modeling algorithms. We modified the Rosetta comparative modeling method, RosettaCM 11,12 , to take advantage of the NMR data when filling in the missing parts and for energetically refining the final structures. Comparative modeling of a protein structure from a sequence principally consists of two steps: first, finding related templates from known structures that have some sequence similarity to the query sequence and optimally aligning the query sequence with the sequence of the templates, and second, generating full 3D models guided by information from the aligned templates. Best alignment between two sequences is usually obtained through optimization of an alignment scoring function consisting of two components: a matrix of pairwise substitution scores for matching each residue in the database protein to every residue in the query sequence, and a gap penalty function. Once an optimized scoring function has been obtained, efficient dynamic programming is used to search for the optimal alignment between any pair of sequences. Many excellent comparative modeling methods are available, including the widely used MODELLER program 13 and I-TASSER 14 . Backbone torsion angles are encoded in NMR chemical shifts, and even though they are strictly local in character and often not unique, these chemical shifts contain far more information about structural homology than sequence alone. Much of the success of the popular chemical shift–based Rosetta (CS-Rosetta) method stems from the fact that chemical shifts facilitate the finding of structurally homologous peptide fragments in the protein structure database (PDB) 7,15 . The protocol we introduce here relies on a novel chemical shift–guided protein-alignment procedure, POMONA (protein alignments obtained by matching of NMR assignments), fol- lowed by adaptation of RosettaCM 12 to take advantage of the available chemical shifts. In the first step in the POMONA-based CS-RosettaCM structure-determination protocol ( Fig. 1a), experimental 13 C α , 13 C β , 13 C′, 15 N, 1 H α and 1 H N chemical shifts are analyzed to generate a φ/ψ probability map for each residue. This map, calculated using the neural network–based TALOS-N program 16 , assigns a normalized probability to each 20° × 20° voxel of the Ramachandran map. POMONA uses these residue- specific Ramachandran probability maps to search the PDB for structures that are compatible with these φ/ψ probabilities, Homology modeling of larger proteins guided by chemical shifts Yang Shen & Ad Bax We describe an approach to the structure determination of large proteins that relies on experimental NMR chemical shifts, plus sparse nuclear Overhauser effect (NOE) data if available. Our alignment method, POMONA (protein alignments obtained by matching of NMR assignments), directly exploits pre-existing bioinformatics algorithms to match experimental chemical shifts to values predicted for the crystallographic database. Protein templates generated by POMONA are subsequently used as input for chemical shift–based Rosetta comparative modeling (CS-RosettaCM) to generate reliable full-atom models. High-resolution protein structures, obtained by either X-ray crystallography or NMR spectroscopy, are available for only a small fraction of all known proteins. Computational methods are commonly used to model structures for the remainder. Current protein-structure prediction methods can be broadly separated into two classes: comparative modeling and de novo methods. Comparative modeling methods rely on detectable similarity between the query sequence and at least one protein of known structure and can be used to generate models for all proteins in a family using a single representative structure as the starting point 1,2 . De novo methods, which use only the amino acid sequence and no structural template, rely on an effective con- formation-searching algorithm and good energy functions and can be used to build structural models from scratch. However, because of computational bottlenecks in the sampling of a conformational space that increase exponentially with the number of residues, this method remains restricted to small proteins 3 . NMR chemical shifts of proteins encode important structural information and are obtained at the early stage of any NMR structural study, even for large proteins 4 . It has long been recog- nized that integration of these data or other very limited, ‘sparse’ restraints into structural modeling can be highly beneficial 5 . This idea led to the development of powerful and popular de novo protein-structure prediction programs, including CHESHIRE 6 , CS-Rosetta 7 and CS23D 8 , which can generate good-quality, all-atom models for proteins with up to approximately 125 resi- dues and a variety of folds. Supplementing the input chemical shift Laboratory of Chemical Physics, National Institute of Diabetes and Digestive and Kidney Diseases, US National Institutes of Health, Bethesda, Maryland, USA. Correspondence should be addressed to Y.S. ([email protected]) or A.B. ([email protected]). RECEIVED 27 OCTOBER 2014; ACCEPTED 25 MARCH 2015; PUBLISHED ONLINE 8 JUNE 2015; DOI:10.1038/NMETH.3437 npg © 2015 Nature America, Inc. All rights reserved.
Transcript of homology modeling of larger proteins guided by de novo … · C. α, C. β, 13. C′, 15 ... This...
brief communications
nature methods | VOL.12 NO.8 | AUGUST 2015 | 747
data with backbone residual dipolar couplings, sparse 1HN-1HN NOE data9 or distance restraints extracted from remote homology models10 can extend the size limit of the de novo structure genera-tion approach, but the steeply increasing computational cost with increasing protein size poses serious challenges.
Here we introduce a more direct approach for integrating chemical shift and sparse NOE data into existing, powerful comparative modeling algorithms. We modified the Rosetta comparative modeling method, RosettaCM11,12, to take advantage of the NMR data when filling in the missing parts and for energetically refining the final structures. Comparative modeling of a protein structure from a sequence principally consists of two steps: first, finding related templates from known structures that have some sequence similarity to the query sequence and optimally aligning the query sequence with the sequence of the templates, and second, generating full 3D models guided by information from the aligned templates.
Best alignment between two sequences is usually obtained through optimization of an alignment scoring function consisting of two components: a matrix of pairwise substitution scores for matching each residue in the database protein to every residue in the query sequence, and a gap penalty function. Once an optimized scoring function has been obtained, efficient dynamic programming is used to search for the optimal alignment between any pair of sequences. Many excellent comparative modeling methods are available, including the widely used MODELLER program13 and I-TASSER14.
Backbone torsion angles are encoded in NMR chemical shifts, and even though they are strictly local in character and often not unique, these chemical shifts contain far more information about structural homology than sequence alone. Much of the success of the popular chemical shift–based Rosetta (CS-Rosetta) method stems from the fact that chemical shifts facilitate the finding of structurally homologous peptide fragments in the protein structure database (PDB)7,15.
The protocol we introduce here relies on a novel chemical shift–guided protein-alignment procedure, POMONA (protein alignments obtained by matching of NMR assignments), fol-lowed by adaptation of RosettaCM12 to take advantage of the available chemical shifts. In the first step in the POMONA-based CS-RosettaCM structure-determination protocol (Fig. 1a), experimental 13Cα, 13Cβ, 13C′, 15N, 1Hα and 1HN chemical shifts are analyzed to generate a φ/ψ probability map for each residue. This map, calculated using the neural network–based TALOS-N program16, assigns a normalized probability to each 20° × 20° voxel of the Ramachandran map. POMONA uses these residue-specific Ramachandran probability maps to search the PDB for structures that are compatible with these φ/ψ probabilities,
homology modeling of larger proteins guided by chemical shiftsYang Shen & Ad Bax
We describe an approach to the structure determination of large proteins that relies on experimental nmr chemical shifts, plus sparse nuclear overhauser effect (noe) data if available. our alignment method, Pomona (protein alignments obtained by matching of nmr assignments), directly exploits pre-existing bioinformatics algorithms to match experimental chemical shifts to values predicted for the crystallographic database. Protein templates generated by Pomona are subsequently used as input for chemical shift–based rosetta comparative modeling (cs-rosettacm) to generate reliable full-atom models.
High-resolution protein structures, obtained by either X-ray crystallography or NMR spectroscopy, are available for only a small fraction of all known proteins. Computational methods are commonly used to model structures for the remainder. Current protein-structure prediction methods can be broadly separated into two classes: comparative modeling and de novo methods. Comparative modeling methods rely on detectable similarity between the query sequence and at least one protein of known structure and can be used to generate models for all proteins in a family using a single representative structure as the starting point1,2. De novo methods, which use only the amino acid sequence and no structural template, rely on an effective con-formation-searching algorithm and good energy functions and can be used to build structural models from scratch. However, because of computational bottlenecks in the sampling of a conformational space that increase exponentially with the number of residues, this method remains restricted to small proteins3.
NMR chemical shifts of proteins encode important structural information and are obtained at the early stage of any NMR structural study, even for large proteins4. It has long been recog-nized that integration of these data or other very limited, ‘sparse’ restraints into structural modeling can be highly beneficial5. This idea led to the development of powerful and popular de novo protein-structure prediction programs, including CHESHIRE6, CS-Rosetta7 and CS23D8, which can generate good-quality, all-atom models for proteins with up to approximately 125 resi-dues and a variety of folds. Supplementing the input chemical shift
Laboratory of Chemical Physics, National Institute of Diabetes and Digestive and Kidney Diseases, US National Institutes of Health, Bethesda, Maryland, USA. Correspondence should be addressed to Y.S. ([email protected]) or A.B. ([email protected]).Received 27 OctObeR 2014; accepted 25 MaRch 2015; published Online 8 June 2015; dOi:10.1038/nMeth.3437
npg
© 2
015
Nat
ure
Am
eric
a, In
c. A
ll rig
hts
rese
rved
.
748 | VOL.12 NO.8 | AUGUST 2015 | nature methods
brief communications
allowing for gaps and inserts in the residue sequence. After an automated clustering and selection procedure, the representative homologs identified by POMONA are used as structural tem-plates for a modified comparative modeling protocol, based on the RosettaCM program12, to generate all-atom structures. Further details are presented in the Online Methods.
To evaluate POMONA’s accuracy and coverage, we relied on the widely used MaxSub score17, which ranges from 1.0 for two aligned structures that have a Cα r.m.s. deviation of 0 Å for the full length of the query sequence to ~0.0 for sequences that lack
detectable similarity. Typically, a MaxSub score greater than ~0.3 is indicative of notable structural similarity (Fig. 2a and Supplementary Fig. 1).
When one is evaluating the performance of POMONA in identifying suitable homologous structures in the PDB, a key question is, “How many suitable structures exist?” This can be answered with the program DALI, which is designed to identify structurally similar proteins, regardless of residue sequence18. A comparison of DALI alignments and POMONA-identified structural homologs was carried out for a set of 16 test proteins
Cα r.m.s. deviation (Å)
Cα r.m.s. deviation (Å)
Cα r.m.s. deviation (Å)
110b
c
d
e
100908070
PO
MO
NA
alig
nmen
t sco
re
605040
0 5 10
NSP1
15 20
100
50
0
Ros
etta
all-a
tom
ene
rgy
–50
–100
0 5 10 15 20
100
50
0
Ros
etta
all-a
tom
ene
rgy
–50
–100
0 5 10 15 20
400
300
200
100
00 5 10
Maxacal
15 20 25
300200
0100
–100–200
0 5 10 15 20 25
300200
0100
–100–200
0 5 10 15 20 25
600
400500
300200100
0 5 10
MBP
15 20 25 30 35
200
0100
–100–200–300–400
0 5 10 15 20 25 30 35
200
0100
–100–200–300–400
0 5 10 15 20 25 30 35
350
300
250
200
150
0 5 10
Sensory rhodopsin
15 20 25 30 35
–100–150–200–250–300–350
0 5 10 15 20 25 30 35
–100–150–200–250–300–350
0 5 10 15 20 25 30 35
a
Noprediction
Converged?No
Predictedstructure
RosettaCMmodeling
Representativealignments
Clustering
POMONA structurealignment
TALOS-Npredicted φ/ψ
NOEs(Sparse)
PDBSequence, φ/ψ
angles from~252,000 chains
Yes
Chemical shifts13Cα, 13Cβ, 13C′.
1Hα,1HN, 15N
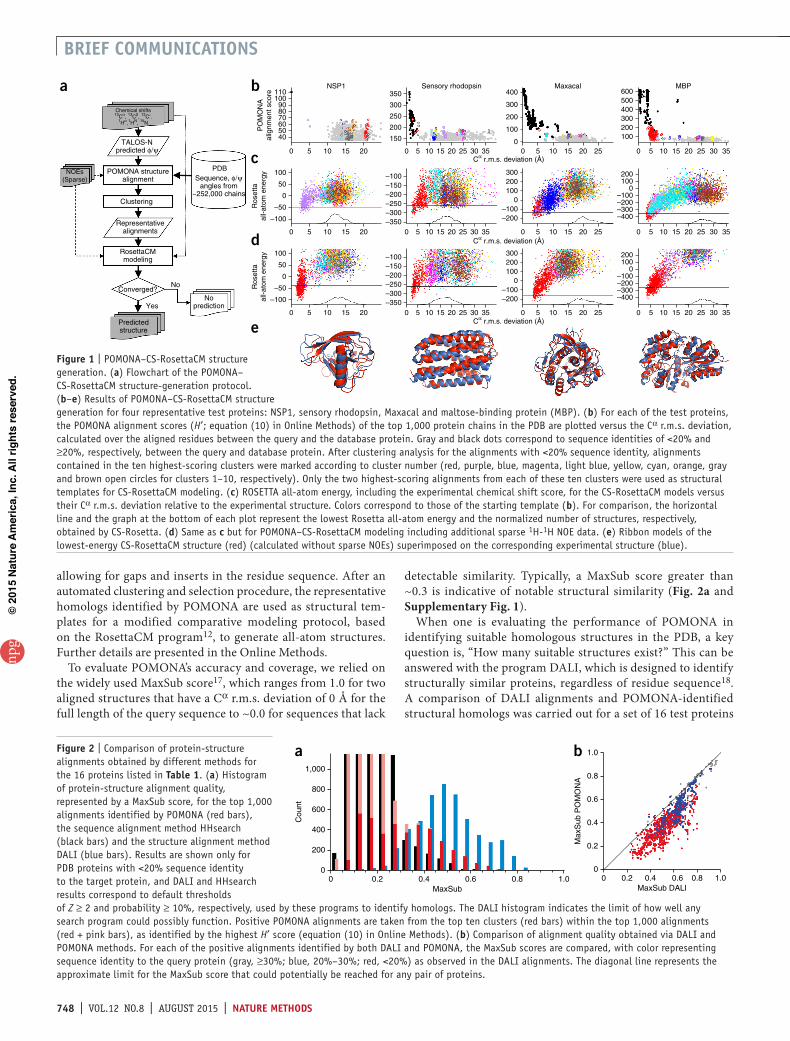
figure 1 | POMONA–CS-RosettaCM structure generation. (a) Flowchart of the POMONA– CS-RosettaCM structure-generation protocol. (b–e) Results of POMONA–CS-RosettaCM structure generation for four representative test proteins: NSP1, sensory rhodopsin, Maxacal and maltose-binding protein (MBP). (b) For each of the test proteins, the POMONA alignment scores (H′; equation (10) in Online Methods) of the top 1,000 protein chains in the PDB are plotted versus the Cα r.m.s. deviation, calculated over the aligned residues between the query and the database protein. Gray and black dots correspond to sequence identities of <20% and ≥20%, respectively, between the query and database protein. After clustering analysis for the alignments with <20% sequence identity, alignments contained in the ten highest-scoring clusters were marked according to cluster number (red, purple, blue, magenta, light blue, yellow, cyan, orange, gray and brown open circles for clusters 1–10, respectively). Only the two highest-scoring alignments from each of these ten clusters were used as structural templates for CS-RosettaCM modeling. (c) ROSETTA all-atom energy, including the experimental chemical shift score, for the CS-RosettaCM models versus their Cα r.m.s. deviation relative to the experimental structure. Colors correspond to those of the starting template (b). For comparison, the horizontal line and the graph at the bottom of each plot represent the lowest Rosetta all-atom energy and the normalized number of structures, respectively, obtained by CS-Rosetta. (d) Same as c but for POMONA–CS-RosettaCM modeling including additional sparse 1H-1H NOE data. (e) Ribbon models of the lowest-energy CS-RosettaCM structure (red) (calculated without sparse NOEs) superimposed on the corresponding experimental structure (blue).
1,000
a b
Cou
nt
800
600
400
200
00 0.2 0.4 0.6
MaxSub0.8 1.0
1.0
0.8
0.6
Max
Sub
PO
MO
NA
0.4
0.2
00 0.2 0.4
MaxSub DALI0.6 0.8 1.0
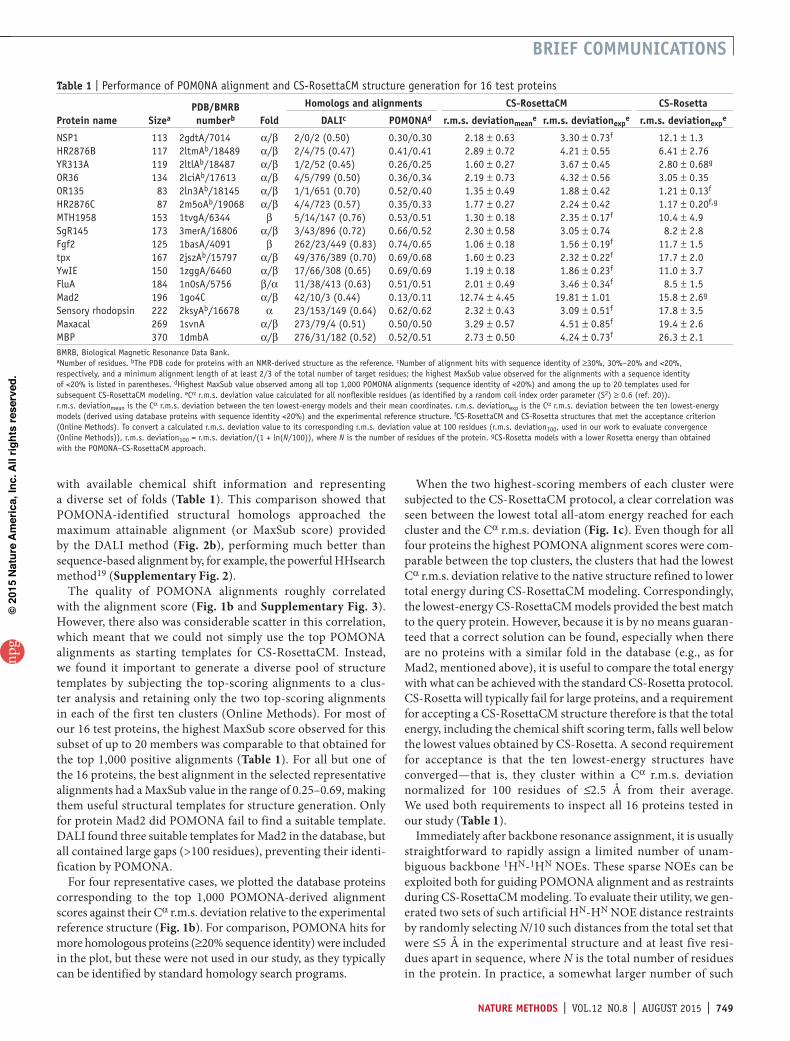
figure 2 | Comparison of protein-structure alignments obtained by different methods for the 16 proteins listed in table 1. (a) Histogram of protein-structure alignment quality, represented by a MaxSub score, for the top 1,000 alignments identified by POMONA (red bars), the sequence alignment method HHsearch (black bars) and the structure alignment method DALI (blue bars). Results are shown only for PDB proteins with <20% sequence identity to the target protein, and DALI and HHsearch results correspond to default thresholds of Z ≥ 2 and probability ≥ 10%, respectively, used by these programs to identify homologs. The DALI histogram indicates the limit of how well any search program could possibly function. Positive POMONA alignments are taken from the top ten clusters (red bars) within the top 1,000 alignments (red + pink bars), as identified by the highest H′ score (equation (10) in Online Methods). (b) Comparison of alignment quality obtained via DALI and POMONA methods. For each of the positive alignments identified by both DALI and POMONA, the MaxSub scores are compared, with color representing sequence identity to the query protein (gray, ≥30%; blue, 20%–30%; red, <20%) as observed in the DALI alignments. The diagonal line represents the approximate limit for the MaxSub score that could potentially be reached for any pair of proteins.
npg
© 2
015
Nat
ure
Am
eric
a, In
c. A
ll rig
hts
rese
rved
.
nature methods | VOL.12 NO.8 | AUGUST 2015 | 749
brief communications
with available chemical shift information and representing a diverse set of folds (Table 1). This comparison showed that POMONA-identified structural homologs approached the maximum attainable alignment (or MaxSub score) provided by the DALI method (Fig. 2b), performing much better than sequence-based alignment by, for example, the powerful HHsearch method19 (Supplementary Fig. 2).
The quality of POMONA alignments roughly correlated with the alignment score (Fig. 1b and Supplementary Fig. 3). However, there also was considerable scatter in this correlation, which meant that we could not simply use the top POMONA alignments as starting templates for CS-RosettaCM. Instead, we found it important to generate a diverse pool of structure templates by subjecting the top-scoring alignments to a clus-ter analysis and retaining only the two top-scoring alignments in each of the first ten clusters (Online Methods). For most of our 16 test proteins, the highest MaxSub score observed for this subset of up to 20 members was comparable to that obtained for the top 1,000 positive alignments (Table 1). For all but one of the 16 proteins, the best alignment in the selected representative alignments had a MaxSub value in the range of 0.25–0.69, making them useful structural templates for structure generation. Only for protein Mad2 did POMONA fail to find a suitable template. DALI found three suitable templates for Mad2 in the database, but all contained large gaps (>100 residues), preventing their identi-fication by POMONA.
For four representative cases, we plotted the database proteins corresponding to the top 1,000 POMONA-derived alignment scores against their Cα r.m.s. deviation relative to the experimental reference structure (Fig. 1b). For comparison, POMONA hits for more homologous proteins (≥20% sequence identity) were included in the plot, but these were not used in our study, as they typically can be identified by standard homology search programs.
When the two highest-scoring members of each cluster were subjected to the CS-RosettaCM protocol, a clear correlation was seen between the lowest total all-atom energy reached for each cluster and the Cα r.m.s. deviation (Fig. 1c). Even though for all four proteins the highest POMONA alignment scores were com-parable between the top clusters, the clusters that had the lowest Cα r.m.s. deviation relative to the native structure refined to lower total energy during CS-RosettaCM modeling. Correspondingly, the lowest-energy CS-RosettaCM models provided the best match to the query protein. However, because it is by no means guaran-teed that a correct solution can be found, especially when there are no proteins with a similar fold in the database (e.g., as for Mad2, mentioned above), it is useful to compare the total energy with what can be achieved with the standard CS-Rosetta protocol. CS-Rosetta will typically fail for large proteins, and a requirement for accepting a CS-RosettaCM structure therefore is that the total energy, including the chemical shift scoring term, falls well below the lowest values obtained by CS-Rosetta. A second requirement for acceptance is that the ten lowest-energy structures have converged—that is, they cluster within a Cα r.m.s. deviation normalized for 100 residues of ≤2.5 Å from their average. We used both requirements to inspect all 16 proteins tested in our study (Table 1).
Immediately after backbone resonance assignment, it is usually straightforward to rapidly assign a limited number of unam-biguous backbone 1HN-1HN NOEs. These sparse NOEs can be exploited both for guiding POMONA alignment and as restraints during CS-RosettaCM modeling. To evaluate their utility, we gen-erated two sets of such artificial HN-HN NOE distance restraints by randomly selecting N/10 such distances from the total set that were ≤5 Å in the experimental structure and at least five resi-dues apart in sequence, where N is the total number of residues in the protein. In practice, a somewhat larger number of such
table 1 | Performance of POMONA alignment and CS-RosettaCM structure generation for 16 test proteins
Protein name sizeaPdb/bmrb numberb fold
homologs and alignments cs-rosettacm cs-rosetta
daLic Pomonad r.m.s. deviationmeane r.m.s. deviationexp
e r.m.s. deviationexpe
NSP1 113 2gdtA/7014 α/β 2/0/2 (0.50) 0.30/0.30 2.18 ± 0.63 3.30 ± 0.73f 12.1 ± 1.3HR2876B 117 2ltmAb/18489 α/β 2/4/75 (0.47) 0.41/0.41 2.89 ± 0.72 4.21 ± 0.55 6.41 ± 2.76YR313A 119 2ltlAb/18487 α/β 1/2/52 (0.45) 0.26/0.25 1.60 ± 0.27 3.67 ± 0.45 2.80 ± 0.68g
OR36 134 2lciAb/17613 α/β 4/5/799 (0.50) 0.36/0.34 2.19 ± 0.73 4.32 ± 0.56 3.05 ± 0.35OR135 83 2ln3Ab/18145 α/β 1/1/651 (0.70) 0.52/0.40 1.35 ± 0.49 1.88 ± 0.42 1.21 ± 0.13f
HR2876C 87 2m5oAb/19068 α/β 4/4/723 (0.57) 0.35/0.33 1.77 ± 0.27 2.24 ± 0.42 1.17 ± 0.20f,g
MTH1958 153 1tvgA/6344 β 5/14/147 (0.76) 0.53/0.51 1.30 ± 0.18 2.35 ± 0.17f 10.4 ± 4.9SgR145 173 3merA/16806 α/β 3/43/896 (0.72) 0.66/0.52 2.30 ± 0.58 3.05 ± 0.74 8.2 ± 2.8Fgf2 125 1basA/4091 β 262/23/449 (0.83) 0.74/0.65 1.06 ± 0.18 1.56 ± 0.19f 11.7 ± 1.5tpx 167 2jszAb/15797 α/β 49/376/389 (0.70) 0.69/0.68 1.60 ± 0.23 2.32 ± 0.22f 17.7 ± 2.0YwIE 150 1zggA/6460 α/β 17/66/308 (0.65) 0.69/0.69 1.19 ± 0.18 1.86 ± 0.23f 11.0 ± 3.7FluA 184 1n0sA/5756 β/α 11/38/413 (0.63) 0.51/0.51 2.01 ± 0.49 3.46 ± 0.34f 8.5 ± 1.5Mad2 196 1go4C α/β 42/10/3 (0.44) 0.13/0.11 12.74 ± 4.45 19.81 ± 1.01 15.8 ± 2.6g
Sensory rhodopsin 222 2ksyAb/16678 α 23/153/149 (0.64) 0.62/0.62 2.32 ± 0.43 3.09 ± 0.51f 17.8 ± 3.5Maxacal 269 1svnA α/β 273/79/4 (0.51) 0.50/0.50 3.29 ± 0.57 4.51 ± 0.85f 19.4 ± 2.6MBP 370 1dmbA α/β 276/31/182 (0.52) 0.52/0.51 2.73 ± 0.50 4.24 ± 0.73f 26.3 ± 2.1BMRB, Biological Magnetic Resonance Data Bank. aNumber of residues. bThe PDB code for proteins with an NMR-derived structure as the reference. cNumber of alignment hits with sequence identity of ≥30%, 30%–20% and <20%, respectively, and a minimum alignment length of at least 2/3 of the total number of target residues; the highest MaxSub value observed for the alignments with a sequence identity of <20% is listed in parentheses. dHighest MaxSub value observed among all top 1,000 POMONA alignments (sequence identity of <20%) and among the up to 20 templates used for subsequent CS-RosettaCM modeling. eCα r.m.s. deviation value calculated for all nonflexible residues (as identified by a random coil index order parameter (S2) ≥ 0.6 (ref. 20)). r.m.s. deviationmean is the Cα r.m.s. deviation between the ten lowest-energy models and their mean coordinates. r.m.s. deviationexp is the Cα r.m.s. deviation between the ten lowest-energy models (derived using database proteins with sequence identity <20%) and the experimental reference structure. fCS-RosettaCM and CS-Rosetta structures that met the acceptance criterion (Online Methods). To convert a calculated r.m.s. deviation value to its corresponding r.m.s. deviation value at 100 residues (r.m.s. deviation100, used in our work to evaluate convergence (Online Methods)), r.m.s. deviation100 = r.m.s. deviation/(1 + ln(N/100)), where N is the number of residues of the protein. gCS-Rosetta models with a lower Rosetta energy than obtained with the POMONA–CS-RosettaCM approach.
npg
© 2
015
Nat
ure
Am
eric
a, In
c. A
ll rig
hts
rese
rved
.
750 | VOL.12 NO.8 | AUGUST 2015 | nature methods
brief communications
NOEs is often obtained, particularly in work with perdeuterated proteins4. The inclusion of sparse NOEs enables POMONA to find improved alignments, resulting in better convergence and lower energies during the subsequent CS-RosettaCM modeling stage (Fig. 1d and Supplementary Table 1).
Whereas conventional CS-Rosetta approaches its convergence limits for proteins larger than about 100 residues, CS-RosettaCM remains robust in generating converged results, largely because it is inherently a comparative modeling method. Note, however, that the POMONA–CS-RosettaCM protocol is not aimed at reaching maximum convergence; rather, the clustering approach used by POMONA emphasizes diversity in the input templates to avoid false convergence to a wrong solution. As a result, the conver-gence rate for small structures can actually be higher for standard CS-Rosetta than for our new protocol.
For proteins larger than approximately 20 kDa, standard protein NMR structure determination typically remains quite labor inten-sive, even though chemical shift assignment and the collection of amide-amide NOEs are relatively straightforward. Considering that similar structures are already present in the PDB for ~90% of the newly deposited structures, we believe that the POMONA–CS-RosettaCM approach could dramatically reduce the workload required for protein-structure determination while extending the size of proteins that can readily be studied by NMR. The approach will fail, however, when no adequate structural template exists in the PDB, or when the only good potential templates have large alignment gaps.
Finding suitable templates is an efficient process that can be completed in a matter of hours, but subsequent CS-RosettaCM modeling is far more computationally intensive. Nevertheless, when suitable input templates are used, CS-RosettaCM does not suffer from the combinatorial explosion that restricts conventional Rosetta and CS-Rosetta applications. For large, multidomain proteins, it is important to note that the NMR chemical shifts do not contain information on relative domain orientation or position, and that this information stems strictly from the PDB template used for modeling. However, the measurement of resid-ual dipolar couplings is often straightforward for larger systems and can be readily integrated into the modeling procedure to resolve such issues.
The POMONA software and server are at http://spin.niddk.nih.gov/bax/software/POMONA.
methodsMethods and any associated references are available in the online version of the paper.
Note: Any Supplementary Information and Source Data files are available in the online version of the paper.
acknoWLedgmentsThis work was funded by the Intramural Research Program of the NIDDK, US National Institutes of Health (NIH). We thank Y. Song, N. Sgourakis and D. Baker for help and advice on the use of RosettaCM. We also gratefully acknowledge use of the NIH high-performance computational Biowulf Linux cluster.
author contributionsY.S. and A.B. designed the methods and protocol and wrote the manuscript. Y.S. developed the code, optimized the parameterization of the protocol and analyzed the resulting data.
comPeting finanicaL interestsThe authors declare no competing financial interests.
reprints and permissions information is available online at http://www.nature.com/reprints/index.html.
1. Martí-Renom, M.A. et al. Annu. Rev. Biophys. Biomol. Struct. 29, 291–325 (2000).
2. Pieper, U. et al. Nucleic Acids Res. 37, D347–D354 (2009).3. Das, R. & Baker, D. Annu. Rev. Biochem. 77, 363–382 (2008).4. Tugarinov, V., Choy, W.Y., Orekhov, V.Y. & Kay, L.E. Proc. Natl. Acad. Sci.
USA 102, 622–627 (2005).5. Bowers, P.M., Strauss, C.E.M. & Baker, D. J. Biomol. NMR 18, 311–318
(2000).6. Cavalli, A., Salvatella, X., Dobson, C.M. & Vendruscolo, M. Proc. Natl.
Acad. Sci. USA 104, 9615–9620 (2007).7. Shen, Y. et al. Proc. Natl. Acad. Sci. USA 105, 4685–4690 (2008).8. Wishart, D.S. et al. Nucleic Acids Res. 36, W496–W502 (2008).9. Raman, S. et al. Science 327, 1014–1018 (2010).10. Thompson, J.M. et al. Proc. Natl. Acad. Sci. USA 109, 9875–9880
(2012).11. Misura, K.M.S., Chivian, D., Rohl, C.A., Kim, D.E. & Baker, D. Proc. Natl.
Acad. Sci. USA 103, 5361–5366 (2006).12. Song, Y. et al. Structure 21, 1735–1742 (2013).13. Webb, B. & Sali, A. Curr. Protoc. Bioinform. 47, 5.6.1–5.6.32 (2014).14. Xu, D., Zhang, J., Roy, A. & Zhang, Y. Proteins 79, 147–160 (2011).15. Vernon, R., Shen, Y., Baker, D. & Lange, O.F. J. Biomol. NMR 57, 117–127
(2013).16. Shen, Y. & Bax, A. J. Biomol. NMR 56, 227–241 (2013).17. Siew, N., Elofsson, A., Rychiewski, L. & Fischer, D. Bioinformatics 16,
776–785 (2000).18. Holm, L. & Sander, C. J. Mol. Biol. 233, 123–138 (1993).19. Söding, J. Bioinformatics 21, 951–960 (2005).20. Berjanskii, M. & Wishart, D.S. Nat. Protoc. 1, 683–688 (2006).
npg
© 2
015
Nat
ure
Am
eric
a, In
c. A
ll rig
hts
rese
rved
.
doi:10.1038/nmeth.3437 nature methods
As seen in equation (1), our local structure-similarity score between residues i and j includes terms for its two immediate neighbors, that is, between residues i – 1 and j – 1 and between residues i + 1 and j + 1. The weights wtorsion and wSS of these terms have been optimized empirically, together with other para-meters used by the POMONA alignment method, such that the calculated substitution scores S(i,j) range from −2.0 to 3.0. The maximum contribution to S(i,j) from residue-type similarity (term 2 in equation (1)) is less than approximately 10% when chemical shifts are available. For query residues that lack chemical shifts, only the sequence similarity and secondary-structure matching term in equation (1), with a comparable weight, are used to calculate an S(i,j) score, which is then scaled to the same range of −2.0 to 3.0.
Gap penalty function used for protein alignment. An important element in evaluations of the alignment of two protein sequences is the concept of alignment gaps, or the presence of insertions or deletions in the sequence of either protein, which are counted as a penalty to the overall alignment score. For POMONA, a varied gap penalty (VGP) function23 with a conformation-specific form is used as outlined below.
For opening a gap that extends from positions i′ to i in the sequence of the query protein (referred to as the sequence block) and from j′ to j in the sequence of the database protein of known structure (referred to as the structure block), as illustrated below for an example of aligned segments,
i’ iSequence block: KT-------LTGStructure block: EKAPKARIG-DL
j’ j
the varied gap penalty function G(i, j, i′, j′) of Madhusudhan et al.23 is used.
G i j i jl l
R u l l v( , , , )
( )′ ′ =
= ′ =× + + ′ ×
0 0 0 and otherwise
l i i= − ′ −1
′ = − ′ −l j j 1
R W j j i i W D j jd= + × ′ + ′ + × ′1 HS HS HS[ ( , ) ( , )] ( , )
where l and l′ are the lengths of the insertions in the sequence and the structure blocks, respectively, v is the gap-extension penalty, u is the gap-opening penalty, and R is the function that modulates the gap-opening penalty depending on the secondary structure at the position of the insertion in the sequence and structure blocks. R is at least 1 and can be larger to make the opening of gaps more difficult in the following circumstances: within elements of regu-lar secondary structure (helices or strands), and between two spa-tially distant database residues. W denotes the weight of various properties in R. HS(i,i′) and HS( j,j′) are the consensus values for helical (or β-strand) content at position i in the sequence block and at position j in the structure block, respectively. The binary value of HS( j,j′) is either 1 or 0 depending on whether
(3)(3)
(4)(4)
(5)(5)
(6)(6)
onLine methodsMeasurement of local structure similarity. The optimal align-ment between two protein sequences typically is based on a resi-due-substitution score for all residue pairs of the two sequences. Such substitution scores, which normally are derived from the amino acid similarity scores, are then used for guiding the alignment procedure to find a set of aligned residues along two sequences that have an optimal overall alignment score. Unlike in sequence-based alignment, POMONA aims to align residues of a query protein with known NMR chemical shifts to residues of a database protein with known structure. Structural informa-tion encoded in the NMR chemical shifts of the query protein, specifically the φ/ψ backbone torsion angles and the secondary structure predicted by TALOS-N16, is much more definitive than the amino acid type alone in searches for structural similarity between query and database proteins. Therefore, these backbone torsion angles and the secondary structure derived from chemical shifts are used as the main terms when substitution scores are derived for the alignment procedure.
In POMONA, a substitution score S(i,j) between residue i in the query protein and residue j in the database protein is defined as
S i j w w B ADi n k j n Di n
Di nn
( , ) (, ( )( )
, ,= ++ + − +
+
−∑torsion residues
1 0 1
ii j
i n j nn
A
w P
, )
( , ), ,
+ + +
−∑ss SS SS1 0 1
S(i, j) contains three terms: (1) The φ/ψ fitness score, which has a weighting factor wtorsion, reflects how well the angles of query residue i match to the observed φ/ψ angles of database residue j. Here, Di,k (k = 1–324) is the TALOS-N–predicted density of voxel k in the 324-voxel φ/ψ density map of query residue i, and k(j) is the index number in the 324-voxel Ramachandran map that corresponds to the φ/ψ angles of residue j of the database protein. One calculates the φ/ψ fitness score from Di,k(j) by first subtracting the average of the predicted densities <Di> and then normalizing according to the s.d., σ(Di), of the predicted densi-ties, which then represents the likelihood that the φ/ψ torsion angles of residues i match those of j. (2) The amino acid similarity score between residue i (of amino acid type Ai) and residue j (of type Aj), B(Ai,Aj), is taken from the BLOSUM62 matrix21. (3) The third term is the secondary-structure similarity score between the TALOS-N–predicted three-state secondary structure SSi (H, E and L, respectively) for residue i and the observed secondary structure SSj (as assigned by the program DSSP)22 for residue j.
Piii j
i j
i j( , )
( )( )SS SS
conf SS SSconf SS SS=
=− ≠
where conf(i) is the confidence of the TALOS-N–predicted secondary structure SSi.
Note that terms 2 and 3 are the principal terms used in conventional, sequence-based homology search procedures. In our search, term 2 has a very low weight factor, and term 3 is derived from experimental chemical shifts, which have been shown to considerably increase the accuracy of predicted secondary structures16.
(1)(1)
(2)(2)
npg
© 2
015
Nat
ure
Am
eric
a, In
c. A
ll rig
hts
rese
rved
.
doi:10.1038/nmeth.3437nature methods
the conformation from positions j to j′ is helical (or β-strand). HS(i,i′) is a similar measure but is based on the TALOS-N–predicted secondary structure for query residues i′ to i. D( j,j′) is the value derived from the distance of the two database residues spanning the gap.
D j j d d( , ) max( , )′ = −0 0g
where d is the distance between Cα atoms at positions j′ and j in the structure block and d0 is an empirical constant of 6.5 Å. For less than 6.5 Å, there is no increase in the gap-opening penalty. The exponent γ was optimized by trial and error, and best values for all parameters (u = 3.0, v = 0.3, WHS = 1.0, Wd = 2.0, d0 = 6.5 and γ = 2.0) were obtained by means of a grid search.
Protein-alignment algorithm. The problem of finding the opti-mal alignment of two amino acid sequences has been extensively studied and most commonly is solved by means of a dynamic pro-gramming algorithm24,25. POMONA essentially uses the standard Smith-Waterman dynamic programming algorithm23 to find the best alignment between a query protein with φ/ψ angle information derived from chemical shifts and a database protein of known structure. Specifically, given a query protein and a database pro-tein of sequence lengths M and N, a substitution scoring matrix S of dimensions M × N is constructed. Each element of this scoring matrix S(i,j) (equation (1)) is derived from the local structural similarity between residue i in the query protein and residue j in the database protein. The aim is to align residues with matching local structure in the two proteins while optimizing the overall alignment score, which is a sum of the substitution scores of all aligned residue pairs (also referred to as equivalent residues) and gap penalties for residues lacking an equivalent residue in either sequence. The recursive dynamic programming equation used here for the local alignment of the two proteins is
H i j H i j G i j i j S i jM i i N j j( , ) [ ( , ) ( , , , )] ( , ),= ′ ′ + ′ ′ ++ ≥ ′> + ≥ ′>Max 1 1
with the initial conditions for the recursion defined by H(M + 1, j) = 0 and H(i, N + 1) = 0, where M and N again are the sequence lengths of the query and the database protein, G is the VGP function (equation (3)), and S(i, j) is the residue substitution score for residues i and j in the query and the database proteins, respectively (equation (1)). The dynamic programming maximum scoring matrix H is calculated for i = M + 1 to 1 and j = N + 1 to 1. For each position [i, j] in H, all previously iterated positions [i′, j′], with i′ = [i + 1:M] and j′ = [j + 1:N], are evaluated for a maximum value based on the previously calculated H(i′, j′) value for position [i′, j′], using a gap penalty G(i, j, i′, j′) for opening a gap between positions [i, j] and [i′, j′]. After its residue substitution score S(i, j) has been added, this maximum value is assigned to the current position as score H(i, j). After the calculation of all elements of the H matrix, the largest element, referred to as max(H), will corre-spond to the optimal alignment score. One can obtain the residue equivalence assignments by backtracking in matrix H, starting from the element with the max(H) score and ending with the first element of zero value24. Equivalent residues in this optimal alignment are further evaluated in terms of fitness between the
(7)(7)
(8)(8)
experimental secondary chemical shifts (of the query residues) and those predicted by SPARTA+26 (for the database residues) in terms of a χ2 value.
c d d sCSobs pred2 2 2= −∑∑ ( ) /, , ,
[ , ]k i k j k j
i jk
where dk j,pred is the backbone chemical shift predicted by SPARTA+
(k = 13Cα, 13Cβ, 13C′, 15N, 1Hα and 1HN) for a given database residue j, which is aligned to query residue i with experimental chemical shift dk i,
obs , and σk,j is the uncertainty of dk j,pred reported
by SPARTA+. This cCS2 value, after being scaled by a factor
c = 1/30, is then added to the optimal alignment score as a penalty to derive a final alignment score for any given alignment of
′ = − ×H H cmax( ) cCS2
Structure alignment with additional NOE data. Some types of NOE data, in particular HN-HN NOEs, often can be obtained relatively easily and unambiguously once the backbone amide signals have been assigned, even for large perdeuterated proteins. Unfortunately, there is no straightforward method for directly integrating such sparse NOE distance information into the Smith-Waterman algorithm. However, the typically very sparse NOE data can be useful to aid the above-described chemical shift–guided POMONA protein-alignment scheme if one pre-filters possible solutions on the basis of these distance constraints and subsequently evaluates these possible matches using the above-described algorithm to generate optimally aligned sequences. The NOE-guided part corresponds to the general problem of finding the optimal alignment of protein-structure distance matrices (or protein contact maps)18,27,28, as both the NOEs detected for the query protein and the actual distances measured for the database protein can be converted to contact maps.
Here we used the method of Wohlers et al.28 to find the optimal overlap between two contact maps derived from the query and the database protein. For the query protein with a NOE list (NOE), a contact map X of size M × M is constructed.
X i ii i
( , )( , )
′ =′ ⊂
10
if NOEotherwise
where i and i′ = [1, . . ., M] and M is the size of the query protein. For the database protein, an analogous contact map Y of size N × N is constructed.
Y j jd j j
( , )( , ) .
′ =′ ≤
1 6 50
Åotherwise
where j and j′ = [1, . . ., N], N is the size of the database protein, and d(j, j′) is the actual HN-HN distance between residues j and j′ in the database protein. Contacting residues i and i′ with X(i, i′) = 1 and j and j′ for Y(j, j′) = 1 are stored as lists x and y, respectively. Optimal alignment then corresponds to finding a maximum set of matching [ik, jk] pairs (k = 1 to L, ik x and jk y, where L is the lesser of the two numbers of contacting residues, usually the size of list x) between the pairs of contacting residues
(9)(9)
(10)(10)
(11)(11)
(12)(12)
npg
© 2
015
Nat
ure
Am
eric
a, In
c. A
ll rig
hts
rese
rved
.
doi:10.1038/nmeth.3437 nature methods
in the query and database proteins. The largest set of common contacts is based on the objective function
f X Y C i j i jr r s ss L r sr L
( , ) max [ , ],[ , ],
= ( )
≤ ≤ ≠≤ ≤∑∑
11
C i j i jX i i Y j j
r r s sr s r s([ , ],[ , ])
( , ) ( , )=
= =
1 1 10
andotherwise
After the optimal match between the query and the database con-tact maps has been found, the second step of the structure align-ment, based on chemical shift data, is restricted to the regions identified by this optimal contact map. For the query and the database proteins with a set of optimally aligned contacting residues [ik, jk], where k = 1 to L, ik x and jk y, ik < ik+1 and jk < jk+1, the query and the database sequences are divided into L – 1 fragment pairs, each of which has a range from ik to ik+1 and from jk to jk+1, respectively. The above-described POMONA protein-alignment scheme is then applied for each possible pair of query fragment (ik, ik+1) and database fragment (jk, jk+1) [k = 1 to L – 1], now using equation (1) as the scoring term. The final overall alignment is then obtained through combination of each of the ‘subalignments’, and the final alignment score is taken as the sum of the POMONA alignment scores from each of the subalignments, augmented by the penalizing, scaled chemical shift fitness score cCS
2 (equation (9)).
Training and testing of POMONA. We obtained values for the parameters used by POMONA iteratively by evaluating the out-put results for a set of 16 test proteins of varying size and fold complexity (Table 1). POMONA was used to find optimal align-ment between a test protein and each of approximately 252,000 protein chains in the PDB. POMONA initially retained the 1,000 PDB protein chains that exhibited the highest alignment scores. We performed parameter optimization of POMONA iteratively by monitoring the top 1,000 selected proteins in terms of (1) the ratio of the real structural homologs, as identified by the DALI structure alignment method18 with the actual structure of the target protein, and (2) the accuracy of the POMONA-identified alignment to the target protein, expressed in terms of a coordinate r.m.s. deviation value calculated between the Cα atoms of the equivalent residues in the target and database protein.
Evaluation of POMONA structure alignment. We evaluated the accuracy and coverage achieved by POMONA by using the MaxSub score17. We calculated the MaxSub score for two aligned structures (i.e., the query and database proteins) by first identifying the maximum substructure for which the distances between equivalent residues of two structures after superposition were below a threshold value of 3.5 Å and then computing a normal-ized score of Σ[1/(1 + (di /3.5)2)]/N, where di are the distances between equivalent Cα pairs of two structures in the maximum substructure (after best-fit superposition of the Cα pairs in the maximum substructure) and N is the total length of the query sequence. The spatial information of the aligned structures out-side the maximum substructure was not taken into account. MaxSub scores range from 1.0, for perfect alignment, to near zero for sequences lacking structural similarity. Two aligned structures
(13)(13)
(14)(14)
with a 0-Å Cα r.m.s. deviation for half of the query sequence length and two aligned structures with a Cα r.m.s. deviation of ~3.5 Å for the full length of the query sequence will have the same MaxSub value of 0.5, and a score greater than ~0.3 is usually indicative of meaningful structural similarity (Fig. 2a and Supplementary Fig. 1). A detailed evaluation of the performance of POMONA structure alignment is included in the Supplementary Results.
Clustering and selection of POMONA alignments. Among the top 1,000 alignments identified by POMONA for any given query protein, there will be many that are very similar to one another. Therefore, before using these proteins as input for the time- consuming RosettaCM comparative modeling, it is useful to separate this set into a much smaller number of distinct clus-ters (typically ten) and then use only the two best-scoring (see equation (10)) models in each cluster as RosettaCM input. Specifically, a hierarchical clustering procedure is used to group the top 1,000 database protein chains, using the normalized Cα r.m.s. deviation as a metric. The normalized Cα r.m.s. deviation between two database protein chains is calculated only over residues that are commonly aligned to a residue in the query protein (i.e., that do not correspond to inserts or gaps). Subsequently the Cα r.m.s. deviation is normalized to the r.m.s. deviation100 value29. A single-linkage algorithm is used for generating the clusters with a cutoff of Cα r.m.s. deviation100 ≤ 4 Å, and results are sorted by the high-est alignment score observed in each cluster. The ten clusters with highest alignment scores are retained, and the top two alignments (or one, if there is only a single member in the cluster) are selected as representatives from each of the first ten clusters. Therefore, up to 20 representative alignments are selected from the first ten clusters, and these are used to prepare a pool of structural templates for the subsequent RosettaCM modeling procedure.
Structure generation using CS-RosettaCM. The recent RosettaCM protocol12 offers a powerful comparative modeling module within the Rosetta software suite for generating accurate protein models. The inputs to RosettaCM comprise (1) sequence alignments between the query protein and database proteins that serve as structural templates and (2) standard Rosetta de novo modeling fragments, needed to model the unaligned regions and to explore deviations from the templates in the aligned regions. In our protocol, RosettaCM is used to build 3D protein models, starting from the up to 20 structural templates identified by POMONA.
The generation of complete, all-atom models involves three steps. First, RosettaCM assembles protein backbone topologies by recombining the aligned segments of the query protein and the database template in Cartesian space while building the una-ligned regions de novo in torsion angle space. This process uses long fragments (corresponding to secondary-structure elements) derived from all template inputs and CS-Rosetta de novo fragments (with sizes of three and nine residues), respectively. In the standard RosettaCM implementation, these de novo fragments are selected on the basis of residue sequence, whereas in our work they were picked on the basis of the NMR chemical shifts, using the recently improved chemical shift–based Rosetta3 fragment picker15, again excluding all proteins with ≥20% sequence identity from the library. In the second stage, all broken backbone seg-ments are closed by means of a standard loop-closure method that
npg
© 2
015
Nat
ure
Am
eric
a, In
c. A
ll rig
hts
rese
rved
.
doi:10.1038/nmeth.3437nature methods
combines fragment superposition and structure minimization. The probabilistic distance restraints derived from the alignments, used in standard RosettaCM30, are removed, but experimental NOE distance restraints, if available, are included during this stage. Third, the resulting backbone models are optimized using the final all-atom refinement step of standard CS-Rosetta7, but using the most recent parameter set (talaris2013.wts) for scoring the energy.
Selection of all-atom models using energies and chemical shifts. Using the above protocol, for each query protein, CS-RosettaCM is parameterized to generate 500 all-atom models from each starting template, for a total of up to 10,000 models. Those models are further evaluated for fitness with respect to their experimental NMR chemical shifts using the same method developed for the standard CS-Rosetta protocol7. Specifically, for each all-atom model, a χ2 value is calculated between the experi-mental chemical shifts and values predicted by SPARTA+26, and this value is added to the Rosetta all-atom energy. This chemical shift re-scored Rosetta all-atom energy is used to evaluate and select the final models.
Criteria for convergence and model acceptance. The ten models with the lowest chemical shift re-scored Rosetta all-atom energies are retained for inspection of their convergence relative to the lowest-energy model and are accepted as the predicted structure only if (1) these models cluster within less than 2.5 Å, in terms of Cα r.m.s. deviation100, from the model with the lowest energy, and (2) the average Rosetta energy of the ten lowest-energy models is at least two s.d. lower than that of the ten lowest-energy models
obtained by standard CS-Rosetta (provided with the same inputs and the same all-atom energy scoring scheme).
Software availability. The POMONA software, including clus-tering scripts, all required databases and a complete example for ubiquitin, together with the scripts used for the RosettaCM comparative modeling and structure-selection procedure, can be freely downloaded from http://spin.niddk.nih.gov/bax/software/POMONA. A public Web server (http://spin.niddk.nih.gov/bax/nmrserver/pomona) is also provided, but only for performing the less time-consuming POMONA alignment method for a protein with experimental chemical shift data. Such a search procedure typically takes approximately 0.5 h on a 10-CPU desktop work station. By default, this server also generates all inputs and scripts required for running the RosettaCM compara-tive modeling structure generation. For this purpose, RosettaCM can be downloaded with the Rosetta Software Suite from http://www.rosettacommons.org/software.
21. Koonin, E.V. & Galperin, M.Y. (eds.). Sequence - Evolution - Function: Computational Approaches in Comparative Genomics (Kluwer Academic, 2003).
22. Kabsch, W. & Sander, C. Biopolymers 22, 2577–2637 (1983).23. Madhusudhan, M.S., Marti-Renom, M.A., Sanchez, R. & Sali, A. Protein
Eng. Des. Sel. 19, 129–133 (2006).24. Needleman, S.B. & Wunsch, C.D. J. Mol. Biol. 48, 443–453 (1970).25. Smith, T.F. & Waterman, M.S. J. Mol. Biol. 147, 195–197 (1981).26. Shen, Y. & Bax, A. J. Biomol. NMR 48, 13–22 (2010).27. Caprara, A., Carr, R., Istrail, S., Lancia, G. & Walenz, B. J. Comput. Biol.
11, 27–52 (2004).28. Wohlers, I., Domingues, F.S. & Klau, G.W. Bioinformatics 26, 2273–2280
(2010).29. Carugo, O. & Pongor, S. Protein Sci. 10, 1470–1473 (2001).30. Thompson, J. & Baker, D. Proteins 79, 2380–2388 (2011).
npg
© 2
015
Nat
ure
Am
eric
a, In
c. A
ll rig
hts
rese
rved
.


![Index [luthuli.cs.uiuc.edu]luthuli.cs.uiuc.edu/~daf/CV2E-site/indexalgs.pdfINDEX 740 divisive, 281–283 normalized cuts, 284, 285 group average clustering, 270 grouping and agglomeration,](https://static.fdocument.org/doc/165x107/5f3da939408c571e2576f9ce/index-dafcv2e-siteindexalgspdf-index-740-divisive-281a283-normalized-cuts.jpg)
![arXiv:1111.0965v1 [cs.DS] 3 Nov 2011people.eecs.berkeley.edu/~prasad/Files/highercheeger.pdf · i is the ith smallest eigenvalue of the normalized Laplacian and c0 are](https://static.fdocument.org/doc/165x107/5f7025cbc2e59c51ca4fa3a2/arxiv11110965v1-csds-3-nov-prasadfileshighercheegerpdf-i-is-the-ith-smallest.jpg)


![LM:,/)(/)+E3F 1'* · 2021. 5. 10. · =BKBM=BLMKB;NMBHG Pkbm^ Ma^gp^\Zgk^&pkbm^ma^i]_leb`amerZl Ikhi^kmb^l3 C C ```BOE```Cù C C , JC Ã ```C ``GPSBMM`` C C](https://static.fdocument.org/doc/165x107/61490da59241b00fbd674f75/lme3f-1-2021-5-10-bkbmblmkbnmbhg-pkbm-magpzgkpkbmmailebamerzl.jpg)