FunctionalStatusofPancreatic αand βCellsinType2Diabetes ...
6
Research Article Functional Status of Pancreatic α and β Cells in Type 2 Diabetes Mellitus Patients with Different Plasma Triglyceride Levels: A Retrospective Analysis Hang Guo , 1 Chunlei Ma, 2 Xiaoming Wu, 1 and Congqing Pan 1 1 NHC Key Laboratory of Hormones and Development, Tianjin Key Laboratory of Metabolic Diseases, Chu Hsien-I Memorial Hospital & Tianjin Institute of Endocrinology, Tianjin Medical University, Tianjin, China 2 Department of Urology, Tianjin 4th Center Hospital, e Fourth Central Hospital Affiliated to Nankai University, Tianjin 300140, China Correspondence should be addressed to Congqing Pan; [email protected] Received 18 March 2021; Revised 19 July 2021; Accepted 31 July 2021; Published 18 August 2021 Academic Editor: Reinhard Depping Copyright © 2021 Hang Guo et al. is is an open access article distributed under the Creative Commons Attribution License, which permits unrestricted use, distribution, and reproduction in any medium, provided the original work is properly cited. Objective. To investigate the functional status of pancreatic α and β cells in Type 2 diabetes mellitus (T2DM) patients with different plasma triglyceride (TG) levels. TG levels can be prognostic markers for T2DM. Methods. A total of 328 patients with T2DM were divided into three groups according to different TG levels: the TGL group: TG < 1.7 mmol/L; TGM group: 1.7 mmol/ L ≤ TG < 2.3 mmol/L; and TGH group: TG ≥ 2.3 mmol/L. An oral glucose tolerance test (OGTT), insulin release test, and glucagon release test were performed in each patient. e changes of glucagon, glucagon/insulin ratio, early insulin secretion index (ΔI 30 /ΔG 30 ), and area under the insulin curve (AUC I ) were compared among each group. Also, the correlations between glucagon and pancreatic β-cell function, glycosylated hemoglobin (HbA1c), and other indices were analyzed. Results. With the increase of TG, the fasting and postprandial glucagon levels, the glucagon/insulin ratio, and the area under the glucagon curve (AUC G ) presented an increasing trend. e homeostasis model assessment of insulin resistance (HOMA–IR) of the TGH group was significantly increased compared to the TGL and TGM groups. In addition to the increase in TG levels, the insulin sensitivity index (ISI), homeostasis model assessment for β-cell function index (HOMA-β), ΔI 30 /ΔG 30 , and AUC I displayed a reducing trend. Glucagon was negatively correlated with ΔI 30 /ΔG 30 , high-density lipoprotein (HDL), HOMA-β, body mass index (BMI), ISI, and AUC I (P < 0.05) and positively correlated with fasting blood glucose (FPG), AUC G , HOMA-IR, HbA1c, duration, TG, low-density lipoprotein (LDL), and total cholesterol (TC) (P < 0.05). Conclusion. Hypertriglyceridemia aggravated the dysfunction of pancreatic α and β cells. A reasonable control of the TG level makes it easier for blood glucose to reach the standard. 1.Background Diabetes has become a global chronic noninfectious disease and a public health problem of worldwide concern [1]. e prevalence of T2DM is increasing year by year. e number of people with diabetes worldwide was estimated at almost 400 million in 2013 and is projected to increase approxi- mately up to 600 million by 2035 [2]. In 2017, the prevalence of diabetes in China was 11.2%, making it the country with the largest number of diabetes patients [3]. As we all know, the complications of diabetes will involve multiple organs of the body and increase the risk of death. Diabetes not only reduces the quality of life of patients but also causes huge economic burden. As a result, the country’s medical resources are consumed greatly, making diabetes a huge burden for people all over the world [4]. Insulin resistance (IR) and impaired secretion of pan- creatic β cells are the main pathophysiological mechanisms of T2DM [5]. Unger et al. put forward the “bihormonal theory,” which believed that not only abnormal function of pancreatic islet β cells but also abnormal function of α cells existed in diabetic patients and insulin resistance/lack and absolute/relative increase of glucagon jointly lead to diabetes Hindawi International Journal of Endocrinology Volume 2021, Article ID 9976067, 6 pages https://doi.org/10.1155/2021/9976067
Transcript of FunctionalStatusofPancreatic αand βCellsinType2Diabetes ...
Research ArticleFunctional Status of Pancreatic α and β Cells in Type 2 DiabetesMellitus Patients with Different Plasma Triglyceride Levels: ARetrospective Analysis
Hang Guo ,1 Chunlei Ma,2 Xiaoming Wu,1 and Congqing Pan 1
1NHC Key Laboratory of Hormones and Development, Tianjin Key Laboratory of Metabolic Diseases,Chu Hsien-I Memorial Hospital & Tianjin Institute of Endocrinology, Tianjin Medical University, Tianjin, China2Department of Urology, Tianjin 4th Center Hospital, )e Fourth Central Hospital Affiliated to Nankai University,Tianjin 300140, China
Correspondence should be addressed to Congqing Pan; [email protected]
Received 18 March 2021; Revised 19 July 2021; Accepted 31 July 2021; Published 18 August 2021
Academic Editor: Reinhard Depping
Copyright © 2021 Hang Guo et al. *is is an open access article distributed under the Creative Commons Attribution License,which permits unrestricted use, distribution, and reproduction in any medium, provided the original work is properly cited.
Objective. To investigate the functional status of pancreatic α and β cells in Type 2 diabetes mellitus (T2DM) patients with differentplasma triglyceride (TG) levels. TG levels can be prognostic markers for T2DM.Methods. A total of 328 patients with T2DMweredivided into three groups according to different TG levels: the TGL group: TG< 1.7mmol/L; TGM group: 1.7mmol/L≤TG< 2.3mmol/L; and TGH group: TG≥ 2.3mmol/L. An oral glucose tolerance test (OGTT), insulin release test, and glucagonrelease test were performed in each patient. *e changes of glucagon, glucagon/insulin ratio, early insulin secretion index(ΔI30/ΔG30), and area under the insulin curve (AUCI) were compared among each group. Also, the correlations between glucagonand pancreatic β-cell function, glycosylated hemoglobin (HbA1c), and other indices were analyzed. Results. With the increase ofTG, the fasting and postprandial glucagon levels, the glucagon/insulin ratio, and the area under the glucagon curve (AUCG)presented an increasing trend. *e homeostasis model assessment of insulin resistance (HOMA–IR) of the TGH group wassignificantly increased compared to the TGL and TGM groups. In addition to the increase in TG levels, the insulin sensitivityindex (ISI), homeostasis model assessment for β-cell function index (HOMA-β),ΔI30/ΔG30, and AUCI displayed a reducing trend.Glucagon was negatively correlated with ΔI30/ΔG30, high-density lipoprotein (HDL), HOMA-β, body mass index (BMI), ISI, andAUCI (P< 0.05) and positively correlated with fasting blood glucose (FPG), AUCG, HOMA-IR, HbA1c, duration, TG, low-densitylipoprotein (LDL), and total cholesterol (TC) (P< 0.05). Conclusion. Hypertriglyceridemia aggravated the dysfunction ofpancreatic α and β cells. A reasonable control of the TG level makes it easier for blood glucose to reach the standard.
1. Background
Diabetes has become a global chronic noninfectious diseaseand a public health problem of worldwide concern [1]. *eprevalence of T2DM is increasing year by year. *e numberof people with diabetes worldwide was estimated at almost400 million in 2013 and is projected to increase approxi-mately up to 600 million by 2035 [2].
In 2017, the prevalence of diabetes in China was 11.2%,making it the country with the largest number of diabetespatients [3]. As we all know, the complications of diabeteswill involve multiple organs of the body and increase the risk
of death. Diabetes not only reduces the quality of life ofpatients but also causes huge economic burden. As a result,the country’s medical resources are consumed greatly,making diabetes a huge burden for people all over the world[4].
Insulin resistance (IR) and impaired secretion of pan-creatic β cells are the main pathophysiological mechanismsof T2DM [5]. Unger et al. put forward the “bihormonaltheory,” which believed that not only abnormal function ofpancreatic islet β cells but also abnormal function of α cellsexisted in diabetic patients and insulin resistance/lack andabsolute/relative increase of glucagon jointly lead to diabetes
HindawiInternational Journal of EndocrinologyVolume 2021, Article ID 9976067, 6 pageshttps://doi.org/10.1155/2021/9976067
[6]. Glycemic balance is regulated by the glucagon secretedby pancreatic α cells and insulin secreted by pancreatic βcells [7]. In recent years, the effects of glucagon on T2DMhave attracted much attention from medical researchers [8].
Previous studies have found that T2DM is associatedwith abnormalities in lipid metabolism such as high fastingand postprandial blood levels of TG, high concentrations ofnonesterified fatty acids, and lowHDL concentrations [9]. Inaddition, a study has reported that hyperlipidemia can in-crease glucagon in patients with T2DM [10]. However, therelationship between blood lipid levels and the function ofpancreatic α and β cells has been rarely studied. *is studyretrospectively analyzed the functional changes occurring inpancreatic α and β cells in T2DM patients with differentplasma TG levels.
2. Participants and Methods
2.1. Participants. A total of 328 patients with T2DM ad-mitted to Tianjin Medical University Chu Hsien-I MemorialHospital between August 2018 and August 2020 were en-rolled for the study. *e study was approved by the EthicsCommittee of Chu Hsien-I Memorial Hospital of TianjinMedical University (No. DXBYYhMEC2020-35). *is pa-tient group included 168 males and 160 females with anaverage age of 54.9± 10.4 years. T2DM was diagnosedaccording to the diagnostic criteria laid by the World HealthOrganization (1999): (FBG≥ 7.0mmol/L and 2-hour post-prandial blood glucose (2hPBG)≥ 11.1mmol/L). *e en-rolled patients were devoid of using lipid-regulating drugs orinsulin preparations from six months prior to hospitaliza-tion. *e patients were also inhibited from insulin secre-tagogues three days before the OGTT test.
2.1.1. Exclusion Criteria. Patients suffering from severe liverand kidney dysfunction, tumor, anemia, acute cardiovas-cular and cerebrovascular events, acute and chronic in-flammation, stress state, ketosis or hypertonic coma,gestational diabetes, secondary diabetes, and other endo-crine, metabolic diseases were excluded from the study.
2.1.2. Grouping. According to the Guidelines for the Pre-vention and Treatment of Dyslipidemia in Chinese Adults(2010), the subjects were divided into three groups accordingto different TG levels: the TGL group: TG< 1.7mmol/L;TGM group: 1.7mmol/L≤TG< 2.3mmol/L; and TGHgroup: TG≥ 2.3mmol/L.
2.2. Methods
2.2.1. Sampling Strategy. *e venous blood was collectedfrom the peripheral forearm of the enrolled patients after anovernight fast of 8–12 hours. TC, TG, HDL, LDL, liver,kidney function tests, and other biochemical indices weremeasured using the Hitachi 7180 automatic biochemicalanalyzer. HBA1c was determined by high-pressure liquidchromatography. An OGTT, insulin release test, and glu-cagon release test were performed. Patients were inhibited
from using insulin secretagogue three day before the blooddraw. 75 g glucose was administered orally after an overnightfast of 12 hours. Venous blood from the forearm was col-lected at 0, 30, 60, 120, and 180mins, respectively, to evaluatethe FBG and 2hPBG, insulin and glucagon levels. *eglucose oxidase method was used to assess glucose levels.Insulin was measured by electrochemical luminescence(Roche, Germany), and glucagon was measured by non-equilibrium radioimmunity.
2.2.2. Indicators and Measurements. *e area under thecurve of insulin and area under the curve of glucagon werecalculated using the following formula: AUCI � 15× fastinginsulin level + 30× (insulin level at 30mins + insulin level at180mins) + 45× insulin level at 60mins + 60× insulin level at120mins; AUCG � 15× fasting glucagon level + 30× (gluca-gon level at 30mins + glucagon level at 180mins) + 45×
glucagon level at 60mins + 60× glucagon level at 120mins.Homeostasis model assessment of insulin resistance (HOMA-IR� FPG× fasting insulin (FI)/22.5) was used to evaluate IR,insulin sensitivity index (ISI� ln (FI× (fasting glucagon) FG))was used to evaluate insulin sensitivity, and homeostasismodel assessment for β-cell function index (HOMA-β� 20× FI/(FPG-3.5)) was used to reflect the basal insulinsecretion. Early-phase insulin secretion was evaluated by theratio of the net increase in insulin and glucose after 30mins ofglucose load (ΔI30/ΔG30), and the AUCI was used to evaluatethe second-phase insulin secretion.
2.3. Statistical Processing. SPSS 18.0 software was used forstatistical analysis. Normal distribution data were expressedas x± s, and nonnormal distributions were normalized bynatural logarithmic transformation before statistical analy-sis. *e comparison between different groups and differenttime points used repeated-measurement data analysis ofvariance. *e comparison among multiple groups wasperformed by one-way analysis of variance (ANOVA) andthe least significant difference (LSD) test. Pearson correla-tion analysis was used to analyze the correlation betweenglucagon and other parameters. P< 0.05 was consideredstatistically significant.
3. Results
3.1.ComparisonofPatients’General Information. *ere wereno significant differences in age, gender composition, courseof the disease, BMI, systolic blood pressure, diastolic bloodpressure, and hemoglobin among the three groups. HbA1c,LDL, and FPG levels of the TGH group were significantlyhigher than those of the TGL group and TGM group. *ehigh-density lipoprotein cholesterol was significantly in-creased in the TGM and TGH groups (P< 0.05) compared tothe TGL group. A significant difference (P< 0.05) was ob-served for TC among the three groups (Table 1).
3.2. Glucagon Levels (in Fasting State and after Glucose Load)and Glucagon/Insulin Ratio in Patients with Different TGLevels. With the increase in TG levels, the three groups’
2 International Journal of Endocrinology
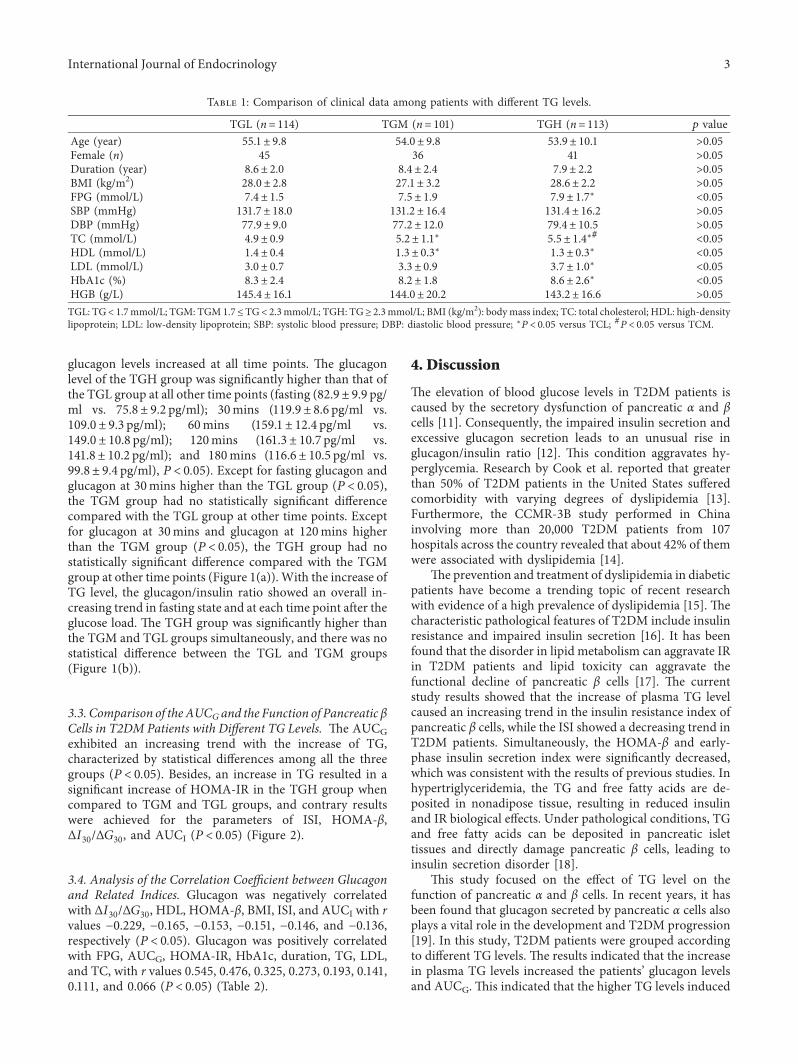
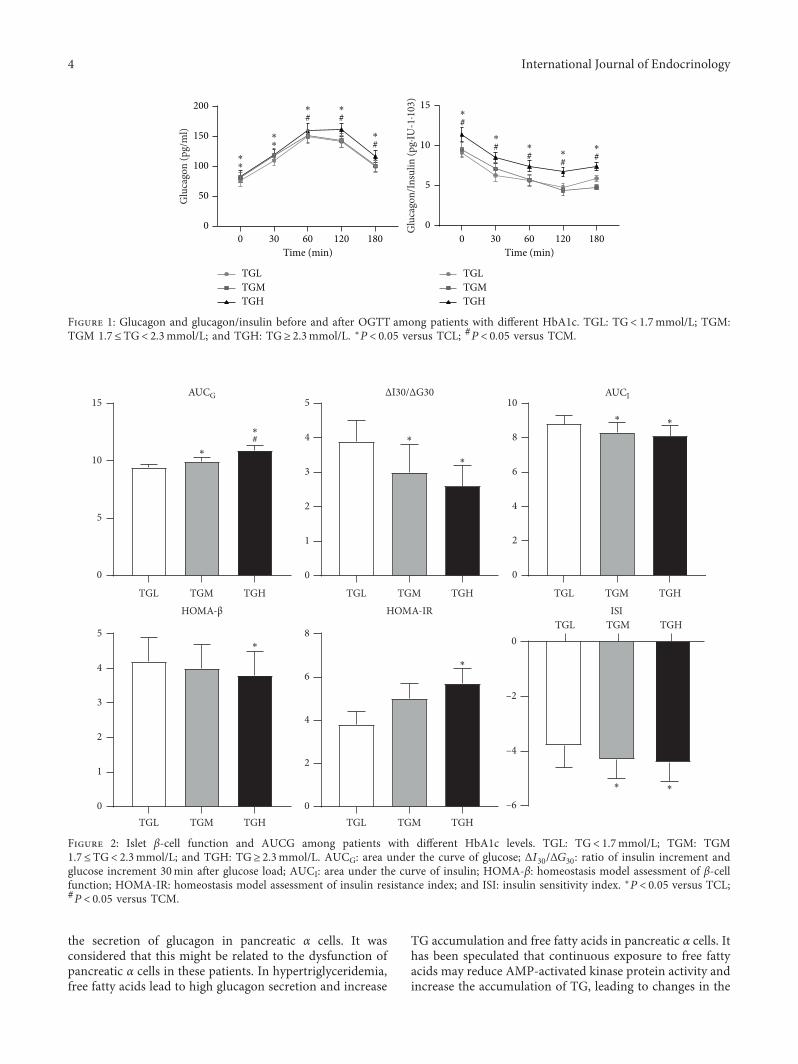
glucagon levels increased at all time points. *e glucagonlevel of the TGH group was significantly higher than that ofthe TGL group at all other time points (fasting (82.9± 9.9 pg/ml vs. 75.8± 9.2 pg/ml); 30mins (119.9± 8.6 pg/ml vs.109.0± 9.3 pg/ml); 60mins (159.1± 12.4 pg/ml vs.149.0± 10.8 pg/ml); 120mins (161.3± 10.7 pg/ml vs.141.8± 10.2 pg/ml); and 180mins (116.6± 10.5 pg/ml vs.99.8± 9.4 pg/ml), P< 0.05). Except for fasting glucagon andglucagon at 30mins higher than the TGL group (P< 0.05),the TGM group had no statistically significant differencecompared with the TGL group at other time points. Exceptfor glucagon at 30mins and glucagon at 120mins higherthan the TGM group (P< 0.05), the TGH group had nostatistically significant difference compared with the TGMgroup at other time points (Figure 1(a)). With the increase ofTG level, the glucagon/insulin ratio showed an overall in-creasing trend in fasting state and at each time point after theglucose load. *e TGH group was significantly higher thanthe TGM and TGL groups simultaneously, and there was nostatistical difference between the TGL and TGM groups(Figure 1(b)).
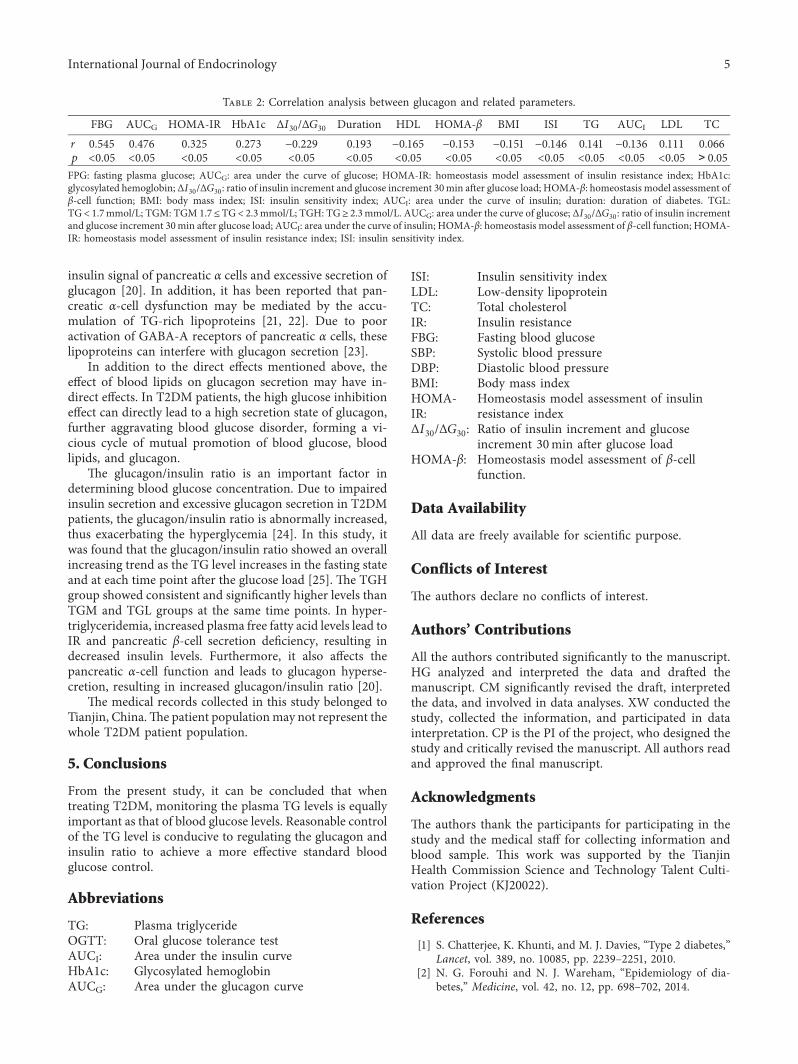
3.3. Comparison of the AUCG and the Function of Pancreatic βCells in T2DM Patients with Different TG Levels. *e AUCGexhibited an increasing trend with the increase of TG,characterized by statistical differences among all the threegroups (P< 0.05). Besides, an increase in TG resulted in asignificant increase of HOMA-IR in the TGH group whencompared to TGM and TGL groups, and contrary resultswere achieved for the parameters of ISI, HOMA-β,ΔI30/ΔG30, and AUCI (P< 0.05) (Figure 2).
3.4. Analysis of the Correlation Coefficient between Glucagonand Related Indices. Glucagon was negatively correlatedwith ΔI30/ΔG30, HDL, HOMA-β, BMI, ISI, and AUCI with rvalues −0.229, −0.165, −0.153, −0.151, −0.146, and −0.136,respectively (P< 0.05). Glucagon was positively correlatedwith FPG, AUCG, HOMA-IR, HbA1c, duration, TG, LDL,and TC, with r values 0.545, 0.476, 0.325, 0.273, 0.193, 0.141,0.111, and 0.066 (P< 0.05) (Table 2).
4. Discussion
*e elevation of blood glucose levels in T2DM patients iscaused by the secretory dysfunction of pancreatic α and βcells [11]. Consequently, the impaired insulin secretion andexcessive glucagon secretion leads to an unusual rise inglucagon/insulin ratio [12]. *is condition aggravates hy-perglycemia. Research by Cook et al. reported that greaterthan 50% of T2DM patients in the United States sufferedcomorbidity with varying degrees of dyslipidemia [13].Furthermore, the CCMR-3B study performed in Chinainvolving more than 20,000 T2DM patients from 107hospitals across the country revealed that about 42% of themwere associated with dyslipidemia [14].
*e prevention and treatment of dyslipidemia in diabeticpatients have become a trending topic of recent researchwith evidence of a high prevalence of dyslipidemia [15]. *echaracteristic pathological features of T2DM include insulinresistance and impaired insulin secretion [16]. It has beenfound that the disorder in lipid metabolism can aggravate IRin T2DM patients and lipid toxicity can aggravate thefunctional decline of pancreatic β cells [17]. *e currentstudy results showed that the increase of plasma TG levelcaused an increasing trend in the insulin resistance index ofpancreatic β cells, while the ISI showed a decreasing trend inT2DM patients. Simultaneously, the HOMA-β and early-phase insulin secretion index were significantly decreased,which was consistent with the results of previous studies. Inhypertriglyceridemia, the TG and free fatty acids are de-posited in nonadipose tissue, resulting in reduced insulinand IR biological effects. Under pathological conditions, TGand free fatty acids can be deposited in pancreatic islettissues and directly damage pancreatic β cells, leading toinsulin secretion disorder [18].
*is study focused on the effect of TG level on thefunction of pancreatic α and β cells. In recent years, it hasbeen found that glucagon secreted by pancreatic α cells alsoplays a vital role in the development and T2DM progression[19]. In this study, T2DM patients were grouped accordingto different TG levels. *e results indicated that the increasein plasma TG levels increased the patients’ glucagon levelsand AUCG. *is indicated that the higher TG levels induced
Table 1: Comparison of clinical data among patients with different TG levels.
TGL (n� 114) TGM (n� 101) TGH (n� 113) p valueAge (year) 55.1± 9.8 54.0± 9.8 53.9± 10.1 >0.05Female (n) 45 36 41 >0.05Duration (year) 8.6± 2.0 8.4± 2.4 7.9± 2.2 >0.05BMI (kg/m2) 28.0± 2.8 27.1± 3.2 28.6± 2.2 >0.05FPG (mmol/L) 7.4± 1.5 7.5± 1.9 7.9± 1.7∗ <0.05SBP (mmHg) 131.7± 18.0 131.2± 16.4 131.4± 16.2 >0.05DBP (mmHg) 77.9± 9.0 77.2± 12.0 79.4± 10.5 >0.05TC (mmol/L) 4.9± 0.9 5.2± 1.1∗ 5.5± 1.4∗# <0.05HDL (mmol/L) 1.4± 0.4 1.3± 0.3∗ 1.3± 0.3∗ <0.05LDL (mmol/L) 3.0± 0.7 3.3± 0.9 3.7± 1.0∗ <0.05HbA1c (%) 8.3± 2.4 8.2± 1.8 8.6± 2.6∗ <0.05HGB (g/L) 145.4± 16.1 144.0± 20.2 143.2± 16.6 >0.05TGL: TG< 1.7mmol/L; TGM: TGM 1.7≤TG< 2.3mmol/L; TGH: TG≥ 2.3mmol/L; BMI (kg/m2): bodymass index; TC: total cholesterol; HDL: high-densitylipoprotein; LDL: low-density lipoprotein; SBP: systolic blood pressure; DBP: diastolic blood pressure; ∗P< 0.05 versus TCL; #P< 0.05 versus TCM.
International Journal of Endocrinology 3
the secretion of glucagon in pancreatic α cells. It wasconsidered that this might be related to the dysfunction ofpancreatic α cells in these patients. In hypertriglyceridemia,free fatty acids lead to high glucagon secretion and increase
TG accumulation and free fatty acids in pancreatic α cells. Ithas been speculated that continuous exposure to free fattyacids may reduce AMP-activated kinase protein activity andincrease the accumulation of TG, leading to changes in the
TGL TGM TGH
0
5
10
15AUCG
TGL TGM TGH
0
1
2
3
4#
5ΔI30/ΔG30
TGL TGM TGH
0
2
4
6
8
10AUCI
TGL TGM TGH TGL TGM TGH0
1
2
3
4
5
HOMA-β
* 0
2
4
6
8
HOMA-IRTGL TGM TGH
–6
–4
–2
0
ISI
∗
∗
∗
∗
∗
∗
∗ ∗
∗∗
Figure 2: Islet β-cell function and AUCG among patients with different HbA1c levels. TGL: TG< 1.7mmol/L; TGM: TGM1.7≤TG< 2.3mmol/L; and TGH: TG≥ 2.3mmol/L. AUCG: area under the curve of glucose; ΔI30/ΔG30: ratio of insulin increment andglucose increment 30min after glucose load; AUCI: area under the curve of insulin; HOMA-β: homeostasis model assessment of β-cellfunction; HOMA-IR: homeostasis model assessment of insulin resistance index; and ISI: insulin sensitivity index. ∗P< 0.05 versus TCL;#P< 0.05 versus TCM.
0 30 60 120 1800
50
100
150
200#
Time (min)
*
0 30 60 120 1800
5
10
15
Time (min)
Glu
cago
n (p
g/m
l)
Glu
cago
n/In
sulin
(pg·
IU-1
·103
)
TGLTGMTGH
TGLTGMTGH
∗
∗
∗
∗
∗
#∗
#∗
#∗
#∗
#∗ #
∗#∗
Figure 1: Glucagon and glucagon/insulin before and after OGTT among patients with different HbA1c. TGL: TG< 1.7mmol/L; TGM:TGM 1.7≤TG< 2.3mmol/L; and TGH: TG≥ 2.3mmol/L. ∗P< 0.05 versus TCL; #P< 0.05 versus TCM.
4 International Journal of Endocrinology
insulin signal of pancreatic α cells and excessive secretion ofglucagon [20]. In addition, it has been reported that pan-creatic α-cell dysfunction may be mediated by the accu-mulation of TG-rich lipoproteins [21, 22]. Due to pooractivation of GABA-A receptors of pancreatic α cells, theselipoproteins can interfere with glucagon secretion [23].
In addition to the direct effects mentioned above, theeffect of blood lipids on glucagon secretion may have in-direct effects. In T2DM patients, the high glucose inhibitioneffect can directly lead to a high secretion state of glucagon,further aggravating blood glucose disorder, forming a vi-cious cycle of mutual promotion of blood glucose, bloodlipids, and glucagon.
*e glucagon/insulin ratio is an important factor indetermining blood glucose concentration. Due to impairedinsulin secretion and excessive glucagon secretion in T2DMpatients, the glucagon/insulin ratio is abnormally increased,thus exacerbating the hyperglycemia [24]. In this study, itwas found that the glucagon/insulin ratio showed an overallincreasing trend as the TG level increases in the fasting stateand at each time point after the glucose load [25]. *e TGHgroup showed consistent and significantly higher levels thanTGM and TGL groups at the same time points. In hyper-triglyceridemia, increased plasma free fatty acid levels lead toIR and pancreatic β-cell secretion deficiency, resulting indecreased insulin levels. Furthermore, it also affects thepancreatic α-cell function and leads to glucagon hyperse-cretion, resulting in increased glucagon/insulin ratio [20].
*e medical records collected in this study belonged toTianjin, China.*e patient populationmay not represent thewhole T2DM patient population.
5. Conclusions
From the present study, it can be concluded that whentreating T2DM, monitoring the plasma TG levels is equallyimportant as that of blood glucose levels. Reasonable controlof the TG level is conducive to regulating the glucagon andinsulin ratio to achieve a more effective standard bloodglucose control.
Abbreviations
TG: Plasma triglycerideOGTT: Oral glucose tolerance testAUCI: Area under the insulin curveHbA1c: Glycosylated hemoglobinAUCG: Area under the glucagon curve
ISI: Insulin sensitivity indexLDL: Low-density lipoproteinTC: Total cholesterolIR: Insulin resistanceFBG: Fasting blood glucoseSBP: Systolic blood pressureDBP: Diastolic blood pressureBMI: Body mass indexHOMA-IR:
Homeostasis model assessment of insulinresistance index
ΔI30/ΔG30: Ratio of insulin increment and glucoseincrement 30min after glucose load
HOMA-β: Homeostasis model assessment of β-cellfunction.
Data Availability
All data are freely available for scientific purpose.
Conflicts of Interest
*e authors declare no conflicts of interest.
Authors’ Contributions
All the authors contributed significantly to the manuscript.HG analyzed and interpreted the data and drafted themanuscript. CM significantly revised the draft, interpretedthe data, and involved in data analyses. XW conducted thestudy, collected the information, and participated in datainterpretation. CP is the PI of the project, who designed thestudy and critically revised the manuscript. All authors readand approved the final manuscript.
Acknowledgments
*e authors thank the participants for participating in thestudy and the medical staff for collecting information andblood sample. *is work was supported by the TianjinHealth Commission Science and Technology Talent Culti-vation Project (KJ20022).
References
[1] S. Chatterjee, K. Khunti, and M. J. Davies, “Type 2 diabetes,”Lancet, vol. 389, no. 10085, pp. 2239–2251, 2010.
[2] N. G. Forouhi and N. J. Wareham, “Epidemiology of dia-betes,” Medicine, vol. 42, no. 12, pp. 698–702, 2014.
Table 2: Correlation analysis between glucagon and related parameters.
FBG AUCG HOMA-IR HbA1c ΔI30/ΔG30 Duration HDL HOMA-β BMI ISI TG AUCI LDL TC
r 0.545 0.476 0.325 0.273 −0.229 0.193 −0.165 −0.153 −0.151 −0.146 0.141 −0.136 0.111 0.066p <0.05 <0.05 <0.05 <0.05 <0.05 <0.05 <0.05 <0.05 <0.05 <0.05 <0.05 <0.05 <0.05 >0.05FPG: fasting plasma glucose; AUCG: area under the curve of glucose; HOMA-IR: homeostasis model assessment of insulin resistance index; HbA1c:glycosylated hemoglobin; ΔI30/ΔG30: ratio of insulin increment and glucose increment 30min after glucose load; HOMA-β: homeostasis model assessment ofβ-cell function; BMI: body mass index; ISI: insulin sensitivity index; AUCI: area under the curve of insulin; duration: duration of diabetes. TGL:TG< 1.7mmol/L; TGM: TGM 1.7≤TG< 2.3mmol/L; TGH: TG≥ 2.3mmol/L. AUCG: area under the curve of glucose; ΔI30/ΔG30: ratio of insulin incrementand glucose increment 30min after glucose load; AUCI: area under the curve of insulin; HOMA-β: homeostasis model assessment of β-cell function; HOMA-IR: homeostasis model assessment of insulin resistance index; ISI: insulin sensitivity index.
International Journal of Endocrinology 5
[3] C. Hu and W. Jia, “Diabetes in China: epidemiology andgenetic risk factors and their clinical utility in personalizedmedication,” Diabetes, vol. 67, no. 1, pp. 3–11, 2018.
[4] P. Zimmet, K. G. Alberti, D. J. Magliano, and P. H. Bennett,“Diabetes mellitus statistics on prevalence and mortality: factsand fallacies,” Nature Reviews Endocrinology, vol. 12, no. 10,pp. 616–622, 2016.
[5] M. Kasuga, “Insulin resistance and pancreatic cell failure,”Journal of Clinical Investigation, vol. 116, no. 7, pp. 1756–1760,2006.
[6] R. H. Unger, “Role of glucagon in the pathogenesis of diabetes:the status of the controversy,” Metabolism, vol. 27, no. 11,pp. 1691–1709, 1978.
[7] J. E. Campbell and C. B. Newgard, “Mechanisms controllingpancreatic islet cell function in insulin secretion,” NatureReviews Molecular Cell Biology, vol. 22, no. 2, pp. 142–158,2021.
[8] A. Lund, J. I. Bagger, M. Christensen, F. K. Knop, andT. Vilsbøll, “Glucagon and type 2 diabetes: the return of thealpha cell,” Current Diabetes Reports, vol. 14, no. 12, p. 555,2014.
[9] S. Pastromas, A. B. Terzi, D. Tousoulis, and S. Koulouris,“Postprandial lipemia: an under-recognized atherogenicfactor in patients with diabetes mellitus,” InternationalJournal of Cardiology, vol. 126, no. 1, pp. 3–12, 2008.
[10] I. Pozuelo-Sanchez, A. Villasanta-Gonzalez, J. F. Alcala-Diazet al., “Postprandial lipemia modulates pancreatic alpha-cellfunction in the prediction of type 2 diabetes development: theCORDIOPREV study,” Journal of Agricultural and FoodChemistry, vol. 68, no. 5, pp. 1266–1275, 2020.
[11] B. Goke, “Islet cell function: α and β cells-partners towardsnormoglycaemia,” International Journal of Clinical Practice,vol. 62, no. 159, pp. 2–7, 2008.
[12] H.-Z. Ren, M.-Y. Zheng, C.-Y. Shan et al., “Relationshipbetween circadian blood pressure variability and function ofislet α and β cell in type 2 diabetes with dyssomnia,” Journal ofDiabetes and Its Complications, vol. 29, no. 5, pp. 675–678,2015.
[13] C. B. Cook, D. M. Erdman, G. J. Ryan et al., “*e pattern ofdyslipidemia among urban African-Americans with type 2diabetes,” Diabetes Care, vol. 23, no. 3, pp. 319–324, 2000.
[14] L. Ji, D. Hu, C. Pan et al., “Betes patients,” )e AmericanJournal of Medicine, vol. 126, no. 10, pp. 925.e911–925.e922,2013.
[15] R. Bitzur, H. Cohen, Y. Kamari, A. Shaish, and D. Harats,“Triglycerides and HDL cholesterol: stars or second leads indiabetes?” Diabetes Care, vol. 32, no. 2, pp. S373–S377, 2009.
[16] J. Yan, D. Peng, F. Jiang et al., “Impaired pancreatic beta cellcompensatory function is the main cause of type 2 diabetes inindividuals with high genetic risk: a 9 year prospective cohortstudy in the Chinese population,” Diabetologia, vol. 59, no. 7,pp. 1458–1462, 2016.
[17] M. Prentki, M.-L. Peyot, P. Masiello, and S. R. M. Madiraju,“Nutrient-induced metabolic stress, adaptation, detoxifica-tion, and toxicity in the pancreatic β-cell,” Diabetes, vol. 69,no. 3, pp. 279–290, 2020.
[18] N. Stefan and H.-U. Haring, “Circulating fetuin-A and freefatty acids interact to predict insulin resistance in humans,”Nature Medicine, vol. 19, no. 4, pp. 394-395, 2013.
[19] D. D’Alessio, “*e role of dysregulated glucagon secretion intype 2 diabetes,” Diabetes, Obesity and Metabolism, vol. 13,no. Suppl 1, pp. 126–132, 2011.
[20] H. Manell, H. Kristinsson, J. Kullberg et al., “Hyper-glucagonemia in youth is associated with high plasma free
fatty acids, visceral adiposity, and impaired glucose toler-ance,” Pediatric Diabetes, vol. 20, no. 7, pp. 880–891, 2019.
[21] J. Hong, P. B. Jeppesen, I. Nordentoft, and K. Hermansen,“Fatty acid-induced effect on glucagon secretion is mediatedvia fatty acid oxidation,” Diabetes/Metabolism Research andReviews, vol. 23, no. 3, pp. 202–210, 2017.
[22] H. Kristinsson, E. Sargsyan, H. Manell, D. M. Smith,S. O. Gopel, and P. Bergsten, “Basal hypersecretion of glu-cagon and insulin from palmitate-exposed human islets de-pends on FFAR1 but not decreased somatostatin secretion,”Scientific Reports, vol. 7, no. 1, p. 4657, 2017.
[23] A. Niederwanger, C. Ciardi, T. Tatarczyk et al., “Postprandiallipemia induces pancreatic α cell dysfunction characteristic oftype 2 diabetes: studies in healthy subjects, mouse pancreaticislets, and cultured pancreatic α cells,” American Journal ofClinical Nutrition, vol. 100, no. 5, pp. 1222–1231, 2014.
[24] M. Lee, M. Kim, J. S. Park et al., “Higher glucagon-to-insulinratio is associated with elevated glycated hemoglobin levels intype 2 diabetes patients,” )e Korean Journal of InternalMedicine, vol. 34, no. 5, pp. 1068–1077, 2019.
[25] M. Seghieri, D. Trico, and A. Natali, “*e impact of tri-glycerides on glucose tolerance: lipotoxicity revisited,” Dia-betes and Metabolism, vol. 43, no. 4, pp. 314–322, 2017.
6 International Journal of Endocrinology