Fluid Release and the Deformation of Subducting Crust€¦ · 10. Spear F.S., “Metamorphic Phase...
1
Parameter Value / Range slab age 10, 20, 40 Ma Mantle temperature 1350K slab velocity 5 cm/yr A0 (ref. viscosity) 10 20 Pas Ac (crust) 1 → 0.0001 Am (melt) 1 Aw (water) 1 Eact mantle 360 KJ/mol [7] Eact crust 260 KJ/mol [7] thickness crust 10, 15, 20 km Thickness ovr-rdg plate 80 km density(ρ) crust - 500 kg/m 3 Min / Max Viscosity 10 19 / 10 24 Pas References 1. Martin H. et al. 2005. Lithos 79, 1–24 2. Foley et al. 2002. Nature 417, 637 – 640 3. Moresi L.N., Gurnis, M., 1996. EPSL 138, 15–28; 5. Zhong S.J. et al. 2000. Geophys Res 105, 11,063–11,082 4. Connolly J.A.D. 2005. EPSL 236, 524-541 5. Bouilhol et al. Submitted. 6. Gerya T.V., Yuen 2003. EPSL 212, 47-62 7. Ranalli G., “Rheology of the Earth”, ch. 10.4 & 10.5 8. Karato S., 2010. Tectonophysics 481, 82-98 9.Kohlstedt D.L., Zimmerman M.E., 1996. Annu. Rev. EPS 24, 41-62 10. Spear F.S., “Metamorphic Phase Equilibria and Pressure-Temperature-Time Paths” ch. 11 11. Wain A.L. et al. 2001. Journal of Metamorphic Geology, 19 (5), 607-623 References 1. Martin H. et al. 2005. Lithos 79, 1–24 2. Foley et al. 2002. Nature 417, 637 – 640 3. Moresi L.N., Gurnis, M., 1996. EPSL 138, 15–28; 5. Zhong S.J. et al. 2000. Geophys Res 105, 11,063–11,082 4. Connolly J.A.D. 2005. EPSL 236, 524-541 5. Bouilhol et al. Submitted. 6. Gerya T.V., Yuen 2003. EPSL 212, 47-62 7. Ranalli G., “Rheology of the Earth”, ch. 10.4 & 10.5 8. Karato S., 2010. Tectonophysics 481, 82-98 9.Kohlstedt D.L., Zimmerman M.E., 1996. Annu. Rev. EPS 24, 41-62 10. Spear F.S., “Metamorphic Phase Equilibria and Pressure-Temperature-Time Paths” ch. 11 11. Wain A.L. et al. 2001. Journal of Metamorphic Geology, 19 (5), 607-623 Fluid Release and the Deformation of Subducting Crust Introduction Ben Maunder, Jeroen van Hunen, Valentina Magni, Pierre Bouilhol Durham University, UK. Email: [email protected] Method Preliminary Study Future Plan Figure 4 (above) Two examples of models where significant crustal deformation took place. The pink region is crustal material and beige is the over-riding lithosphere. ● The model is built on [3], Citcom a finite element code for solving . thermal convection ● A tracer method keeps . track of composition ● Stable slab geometry and temperature profile is first determined Conducted to gain insight into approximately how weak the subducting crust . needs to be to deform and how it deforms Crust is uniformly buoyant and , . weakened without yet considering fluid release melting or metamorphism Figure 5 (below) Viscosity profile snapshots of case (A). When crustal deformation occurs in 20Ma and 40Ma slabs it does so because it has been heated from above. This creates a thin weak layer which can become unstable. The resulting behaviour is similar to the “cold plumes” investigated by Gerya and Yuen (2003) [6] and leads to brief (~1Ma) ponding of crustal material beneath the lithosphere. Figure 2 A sketch to illustrate how delamination can lead to high pressure melting of basaltic crust. Fluid Release The primary effect of fluid is to lower the solidus but its presence may result in extra weakening or its release may actually result in strengthening ( . 8) [8]. of the residual fig Table 1 Values of fixed parameters and the range explored for varied parameters used in the preliminary study, with references given. ( = / ; η viscosity Pas = / ; =8.31 ; T temperature K R see 1 ) Table for other definitions Metamorphism ~40 Below km eclogite is the [10] stable facies which is . , negatively buoyant in the mantle However evidence from UHPM terranes suggest that the crust can remain granulitic beyond this depth and the eclogitisation reaction ( . 9) [11]. is strongly controlled by the presence of fluid fig ● - . Incoming temperature is calculated using a half space cooling profile ● , The effects of temperature compositional and hydrolytic : weakening on the rheology in this model is summarised as follows ● [4] Fluid release is handled by PerpleX and any free water in the ( ) [5]. model is moved upwards instantly to react with the material above Figure 3 The basic model setup for a crustal width of 20km and a slab age of 40Ma. The weak zone decouples the two plates but material below the over-riding lithosphere is unaffected by this. The bottom boundary condition is imposed as a first order approximation to the slab pull force which drives the subduction system. Figure 9 An example of partial eclogitisation from the western marginal zone in the Norwegian UHPM region. The degree of hydration and eclogitisation in the granulite increases towards the eclogite band. Figure is sourced from [11]. The aim of this study is to constrain the conditions required for significant , deformation of subducting crust in the , presence of fluid in a modern and an , Archean setting and investigate how this affects melt generation. ( ) It has been suggested that the adakitic geochemical signatures observed in many Archean rocks are a result of melting of basaltic ( . 1) [1,2]. crust at high pressure Fig Several processes can account for such geochemical , signatures one of these being the delamination ( . 2). and melting of subducting crust Fig Partial Melting Partial melting is expected to play a large role in the dynamics of the system by weakening [7,9]. material exponentially Figure 1 Trace element signatures for: crust older than 2.5Ga (blue), an average adakite (purple) and a typical Cenozoic arc-related batholith (black). Depletion of the heavy rare earth elements (towards the right of the plot) is indicative of the melting having taken place in the stability field of garnet (i.e. at >15Kbar or >50 km). Figure 7 The results of the preliminary study. “delaminated” is defined as any ponding of crustal material beneath the lithosphere (case A and B). It appears as though crustal deformation is most sensitive to the incoming slab age and the weakening prefactor with crustal thickness playing less of a role. Figure 8 Sourced from [8]. Partial melting reduces the water content from the yellow to the orange region. Large increases in viscosity can occur if the activation volume (V*) is sufficiently high. Ranalli [7], for example, gives V* ≈ 5 which implies a factor of 5-10 increase. 0Ma 1.3Ma 3.9Ma 2.6Ma Case (B) 10Ma old 20km crust 10x weaker 80 0 160 Case (A) 20Ma old 10km crust 100x weaker 80 0 160 Figure 6 (below) Viscosity profile snapshots of case (B). When crustal deformation occurs in 10Ma, the mantle lithosphere is thin enough for the crust to be heated from both above and below. This leads almost whole crustal delamination and extensive and more long lived ponding of crustal material beneath the lithosphere. 0Ma 1.0Ma 2.0Ma 3.0Ma Case (A) Case (B) Log ( (η-10 20 ) / Pa s)
Transcript of Fluid Release and the Deformation of Subducting Crust€¦ · 10. Spear F.S., “Metamorphic Phase...
Parameter Value / Range
slab age 10, 20, 40 Ma
Mantle temperature 1350K
slab velocity 5 cm/yr
A0 (ref. viscosity) 1020 Pas
Ac (crust) 1 → 0.0001
Am (melt) 1
Aw (water) 1
Eact mantle 360 KJ/mol [7]
Eact crust 260 KJ/mol [7]
thickness crust 10, 15, 20 km
Thickness ovr-rdg plate 80 km
density(ρ) crust - 500 kg/m3
Min / Max Viscosity 1019 / 1024 Pas
References1. Martin H. et al. 2005. Lithos 79, 1–242. Foley et al. 2002. Nature 417, 637 – 6403. Moresi L.N., Gurnis, M., 1996. EPSL 138, 15–28; 5. Zhong S.J. et al. 2000. Geophys Res 105, 11,063–11,0824. Connolly J.A.D. 2005. EPSL 236, 524-5415. Bouilhol et al. Submitted.6. Gerya T.V., Yuen 2003. EPSL 212, 47-627. Ranalli G., “Rheology of the Earth”, ch. 10.4 & 10.58. Karato S., 2010. Tectonophysics 481, 82-989.Kohlstedt D.L., Zimmerman M.E., 1996. Annu. Rev. EPS 24, 41-6210. Spear F.S., “Metamorphic Phase Equilibria and Pressure-Temperature-Time Paths” ch. 1111. Wain A.L. et al. 2001. Journal of Metamorphic Geology, 19 (5), 607-623
References1. Martin H. et al. 2005. Lithos 79, 1–242. Foley et al. 2002. Nature 417, 637 – 6403. Moresi L.N., Gurnis, M., 1996. EPSL 138, 15–28; 5. Zhong S.J. et al. 2000. Geophys Res 105, 11,063–11,0824. Connolly J.A.D. 2005. EPSL 236, 524-5415. Bouilhol et al. Submitted.6. Gerya T.V., Yuen 2003. EPSL 212, 47-627. Ranalli G., “Rheology of the Earth”, ch. 10.4 & 10.58. Karato S., 2010. Tectonophysics 481, 82-989.Kohlstedt D.L., Zimmerman M.E., 1996. Annu. Rev. EPS 24, 41-6210. Spear F.S., “Metamorphic Phase Equilibria and Pressure-Temperature-Time Paths” ch. 1111. Wain A.L. et al. 2001. Journal of Metamorphic Geology, 19 (5), 607-623
Fluid Release and the Deformation of Subducting Crust
Introduction
Ben Maunder, Jeroen van Hunen, Valentina Magni, Pierre BouilholDurham University, UK.
Email: [email protected]
Method
Preliminary Study
Future Plan
Figure 4 (above) Two examples of models where significant crustal deformation took place. The pink region is crustal material and beige is the over-riding lithosphere.
● The model is built on
[3], Citcom a finite
element code for solving
.thermal convection
● A tracer method keeps
.track of composition
● Stable slab geometry
and temperature profile
is first determined
Conducted to gain insight into approximately how weak the subducting crust
. needs to be to deform and how it deforms Crust is uniformly buoyant and
, .weakened without yet considering fluid release melting or metamorphism
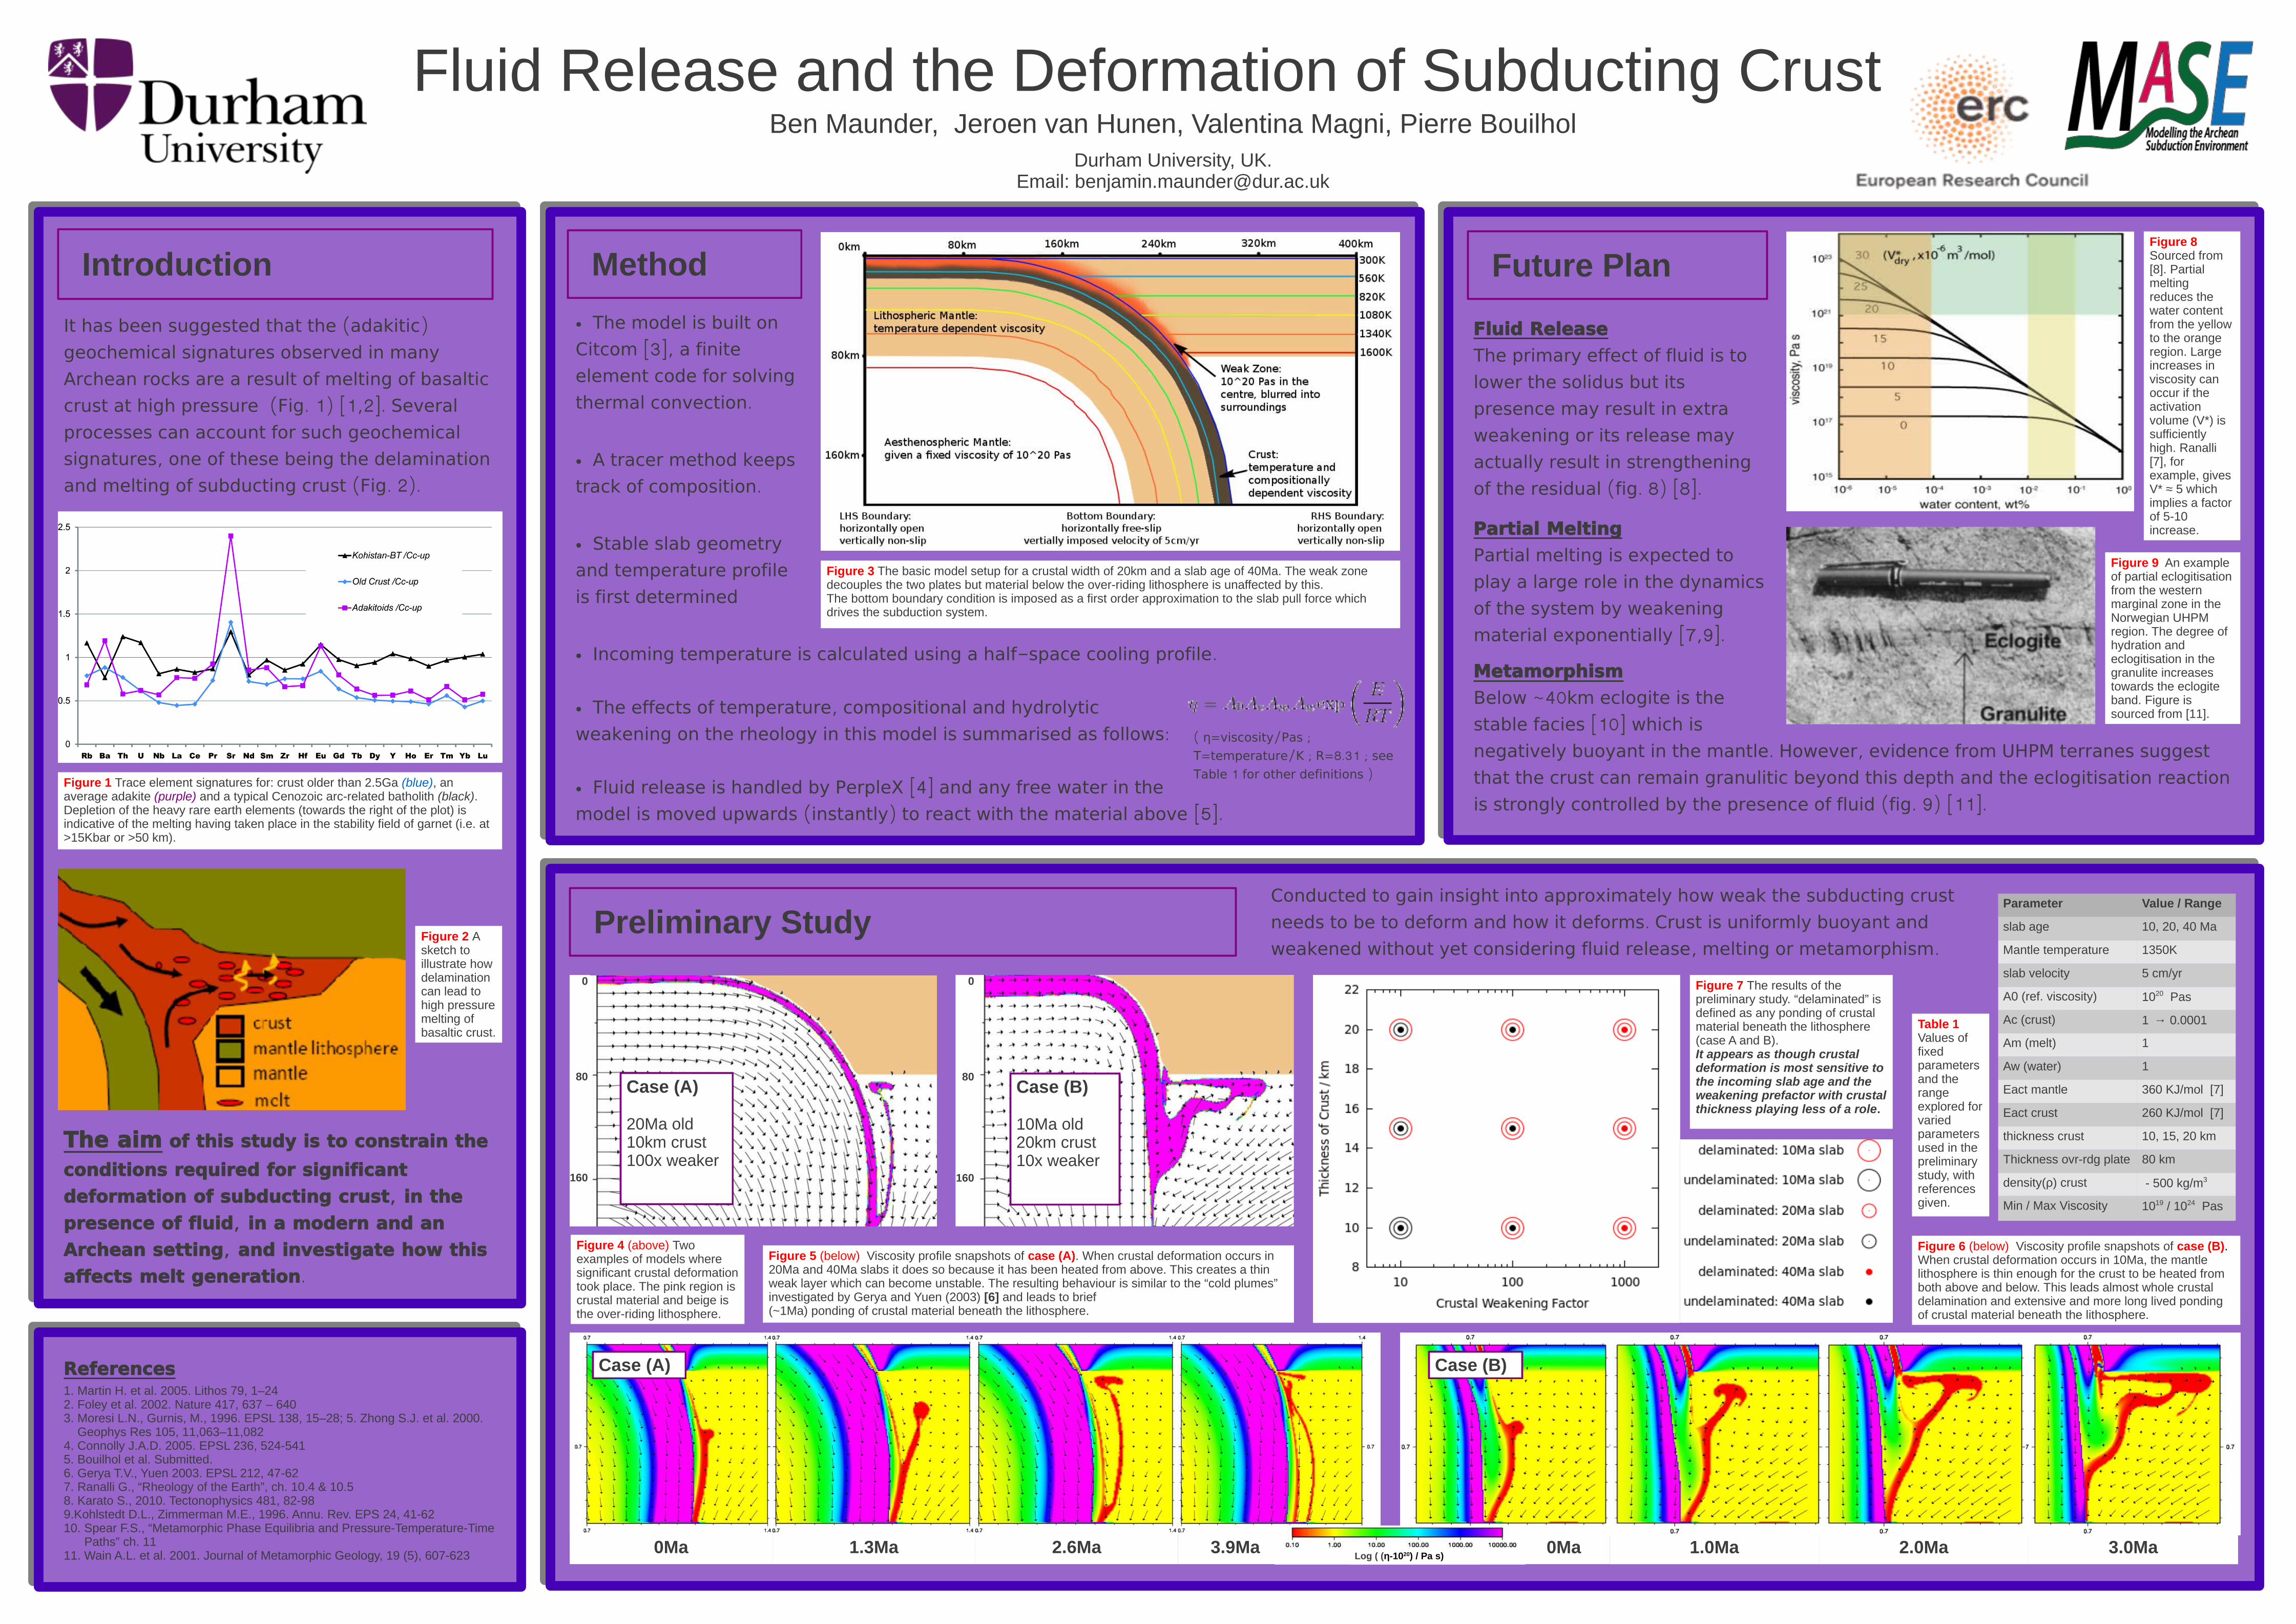
Figure 5 (below) Viscosity profile snapshots of case (A). When crustal deformation occurs in 20Ma and 40Ma slabs it does so because it has been heated from above. This creates a thin weak layer which can become unstable. The resulting behaviour is similar to the “cold plumes” investigated by Gerya and Yuen (2003) [6] and leads to brief (~1Ma) ponding of crustal material beneath the lithosphere.
Figure 2 A sketch to illustrate how delamination can lead to high pressure melting of basaltic crust.
Fluid Release
The primary effect of fluid is to
lower the solidus but its
presence may result in extra
weakening or its release may
actually result in strengthening
( . 8) [8]. of the residual fig
Table 1 Values of fixed parameters and the range explored for varied parameters used in the preliminary study, with references given.
( = / ; η viscosity Pas
= / ; =8.31 ; T temperature K R see
1 )Table for other definitions
Metamorphism
~40 Below km eclogite is the
[10] stable facies which is
. , negatively buoyant in the mantle However evidence from UHPM terranes suggest
that the crust can remain granulitic beyond this depth and the eclogitisation reaction
( . 9) [11].is strongly controlled by the presence of fluid fig
● - . Incoming temperature is calculated using a half space cooling profile
● , The effects of temperature compositional and hydrolytic
:weakening on the rheology in this model is summarised as follows
● [4] Fluid release is handled by PerpleX and any free water in the
( ) [5]. model is moved upwards instantly to react with the material above
Figure 3 The basic model setup for a crustal width of 20km and a slab age of 40Ma. The weak zone decouples the two plates but material below the over-riding lithosphere is unaffected by this.The bottom boundary condition is imposed as a first order approximation to the slab pull force which drives the subduction system.
Figure 9 An example of partial eclogitisation from the western marginal zone in the Norwegian UHPM region. The degree of hydration and eclogitisation in the granulite increases towards the eclogite band. Figure is sourced from [11].
The aim of this study is to constrain the
conditions required for significant
, deformation of subducting crust in the
, presence of fluid in a modern and an
, Archean setting and investigate how this
affects melt generation.
( ) It has been suggested that the adakitic
geochemical signatures observed in many
Archean rocks are a result of melting of basaltic
( . 1) [1,2]. crust at high pressure Fig Several
processes can account for such geochemical
, signatures one of these being the delamination
( . 2).and melting of subducting crust Fig
Partial Melting
Partial melting is expected to
play a large role in the dynamics
of the system by weakening
[7,9].material exponentially
Figure 1 Trace element signatures for: crust older than 2.5Ga (blue), an average adakite (purple) and a typical Cenozoic arc-related batholith (black).Depletion of the heavy rare earth elements (towards the right of the plot) is indicative of the melting having taken place in the stability field of garnet (i.e. at >15Kbar or >50 km).
Figure 7 The results of the preliminary study. “delaminated” is defined as any ponding of crustal material beneath the lithosphere (case A and B). It appears as though crustal deformation is most sensitive to the incoming slab age and the weakening prefactor with crustal thickness playing less of a role.
Figure 8 Sourced from [8]. Partial melting reduces the water content from the yellow to the orange region. Large increases in viscosity can occur if the activation volume (V*) is sufficiently high. Ranalli [7], for example, gives V* ≈ 5 which implies a factor of 5-10 increase.
0Ma 1.3Ma 3.9Ma 2.6Ma
Case (B)
10Ma old20km crust10x weaker
80
0
160
Case (A)
20Ma old10km crust100x weaker
80
0
160
Figure 6 (below) Viscosity profile snapshots of case (B). When crustal deformation occurs in 10Ma, the mantle lithosphere is thin enough for the crust to be heated from both above and below. This leads almost whole crustal delamination and extensive and more long lived ponding of crustal material beneath the lithosphere.
0Ma 1.0Ma 2.0Ma 3.0Ma
Case (A) Case (B)
Log ( (η-1020) / Pa s)