

Exploratory Mediation Analysis with Many Potential Mediators · Exploratory Mediation Analysis with...
42
Exploratory Mediation Analysis with Many Potential Mediators Erik-Jan van Kesteren Daniel Oberski Utrecht University, Netherlands Department of Methodology & Statistics
Transcript of Exploratory Mediation Analysis with Many Potential Mediators · Exploratory Mediation Analysis with...

Exploratory Mediation Analysis with ManyPotential Mediators
Erik-Jan van KesterenDaniel Oberski
Utrecht University, NetherlandsDepartment of Methodology & Statistics

Outline
Exploratory Mediation
Current options
Coordinate-wise mediation filter
Implementation
Simulation
Conclusion
1

Exploratory Mediation

Single mediator model
Q: When is M a mediator?
βα
X Y
M
τ
2
Single mediator model
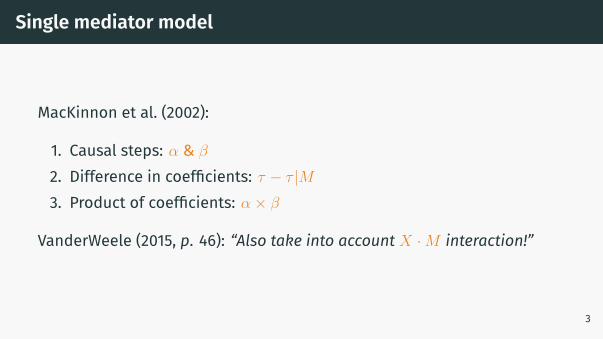
MacKinnon et al. (2002):
1. Causal steps: α & β
2. Difference in coefficients: τ − τ |M3. Product of coefficients: α× β
VanderWeele (2015, p. 46): “Also take into account X ·M interaction!”
3
Single mediator model
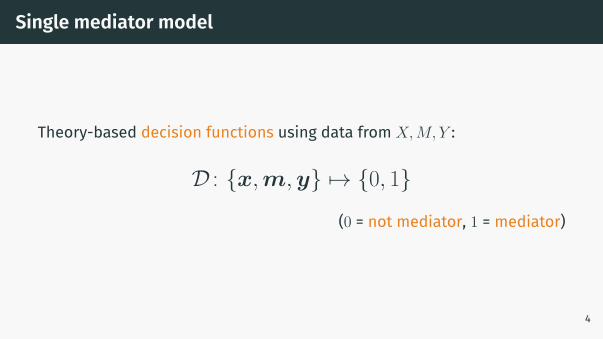
Theory-based decision functions using data from X,M, Y :
D : {x,m,y} 7→ {0, 1}
(0 = not mediator, 1 = mediator)
4

Many Mediators
Q: When is Genei a mediator?
β1α1
...
α2 β2
αp βp
X Y
Gene1
Gene2
Genep
2
5
Many Mediators
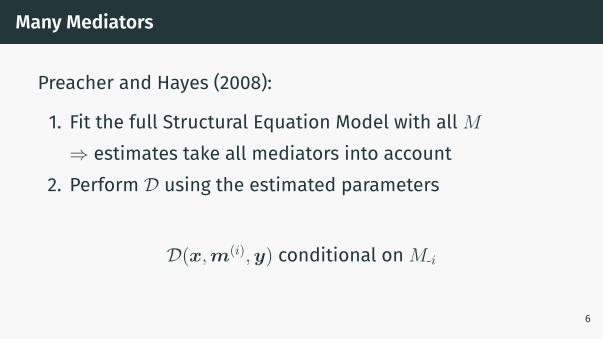
Preacher and Hayes (2008):
1. Fit the full Structural Equation Model with all M⇒ estimates take all mediators into account
2. Perform D using the estimated parameters
D(x,m(i),y) conditional on M-i
6

Many Mediators
With many mediators (p > n) SEM is unavailable!
7

Current options

Three options
• Filter• XMed• HIMA
8
Filter
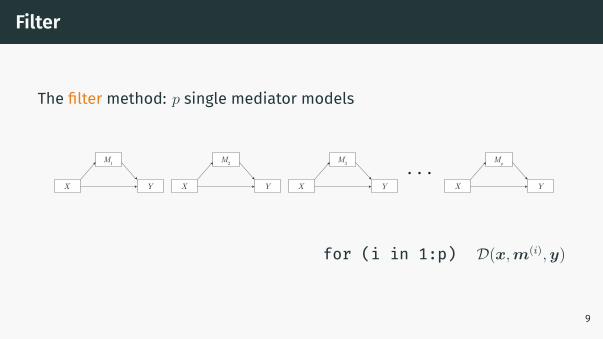
The filter method: p single mediator models
X Y
M1
X Y
M2
Y
Mp
XX Y
M3 . . .
for (i in 1:p) D(x,m(i),y)
9

Filter
Good Bad
• Simple• Quick• Flexible
• Assumes uncorrelatedmediators: won’t work ifmediation only visibleconditionally
10

XMed
Jacobucci et al. (2016): We can now penalise SEM parameters
Fregsem = FML + λP (·)
Serang et al. (2017): We can use this to select mediators! Put a lassopenalty on α and β
The XMed method
11
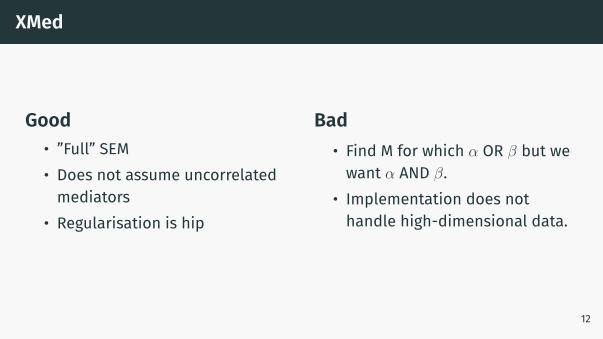
XMed
Good Bad• ”Full” SEM• Does not assume uncorrelatedmediators
• Regularisation is hip
• Find M for which α OR β but wewant α AND β.
• Implementation does nothandle high-dimensional data.
12
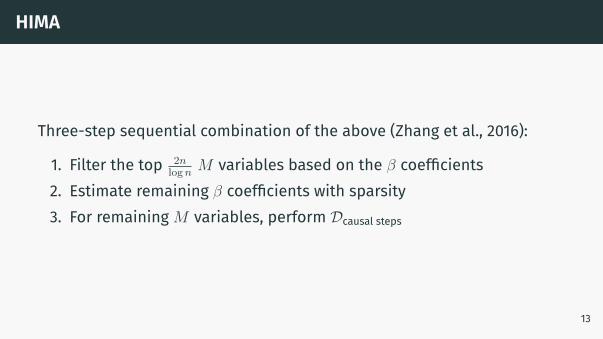
HIMA
Three-step sequential combination of the above (Zhang et al., 2016):
1. Filter the top 2nlogn
M variables based on the β coefficients2. Estimate remaining β coefficients with sparsity3. For remaining M variables, perform Dcausal steps
13

HIMA
Good Bad• Very fast implementation• Promising performance• Regularisation is hip
• Very focused on M → Y
• Fixed Dcausal steps
14
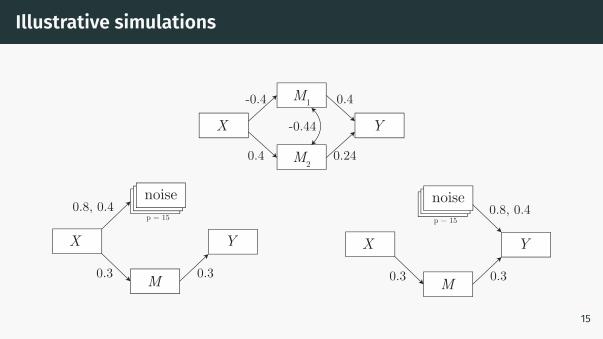
Illustrative simulations
0.8, 0.4noisep = 15
0.3 0.3
X Y
M
0.8, 0.4noisep = 15
0.3 0.3
X Y
M
-0.4
0.4
-0.44
0.24
0.4M1
M2
X Y
15

Coordinate-wise mediation filter
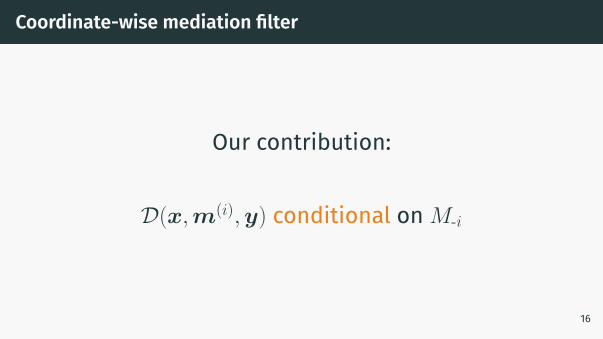
Coordinate-wise mediation filter
Our contribution:
D(x,m(i),y) conditional on M-i
16
Coordinate-wise mediation filter
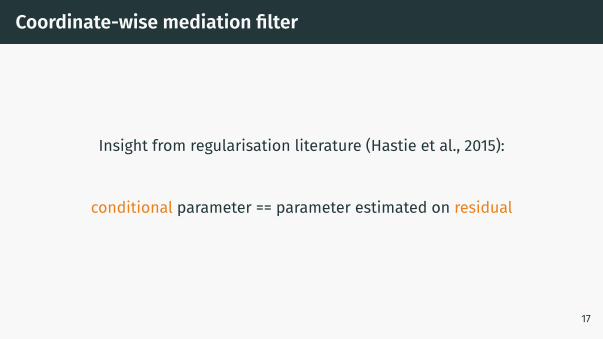
Insight from regularisation literature (Hastie et al., 2015):
conditional parameter == parameter estimated on residual
17
Coordinate-wise mediation filter
18

Coordinate-wise mediation filter
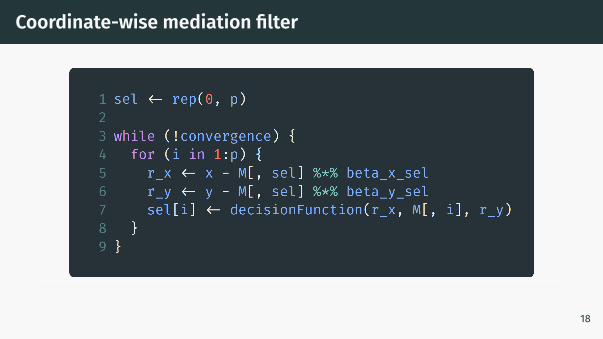
for each mediatorperform the decision function
throw it out if 0
Coordinate-wiseMediationFilter
conditional on the other selected mediators
repeat until convergence
19

Coordinate-wise mediation filter
Good Bad• Uses theoretically relevant D• Does not assume uncorrelatedmediators
• Nonconvergence⇒ weak learner
20
Nonconvergence
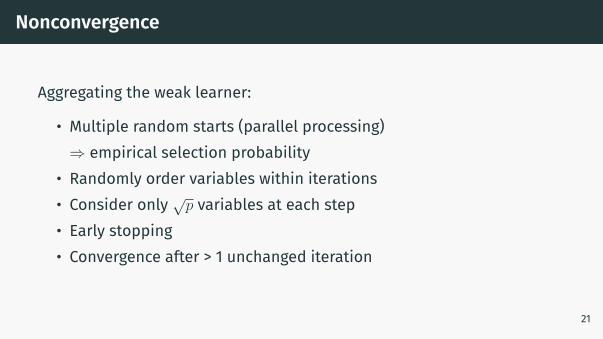
Aggregating the weak learner:
• Multiple random starts (parallel processing)⇒ empirical selection probability
• Randomly order variables within iterations• Consider only √
p variables at each step• Early stopping• Convergence after > 1 unchanged iteration
21

Implementation
Implementation
22

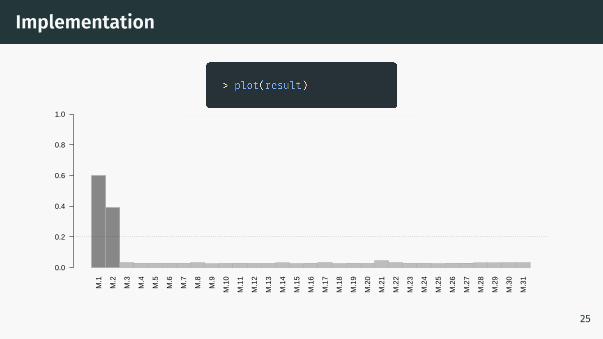
Implementation
0.00
0.05
0.10
0.15
0.20
0.25
0.30
0.35
0.40
0.45
0.50
0.55
0.60
23
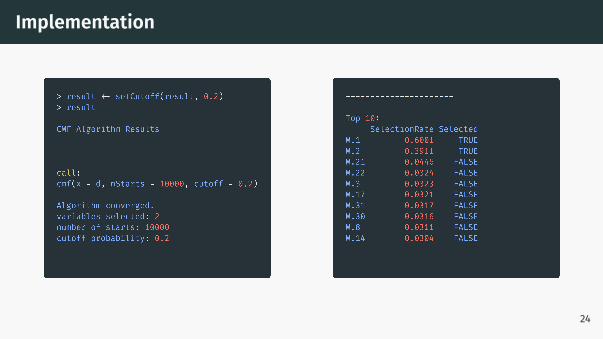
Implementation
24
Implementation
M.1
M.2
M.3
M.4
M.5
M.6
M.7
M.8
M.9
M.1
0
M.1
1
M.1
2
M.1
3
M.1
4
M.1
5
M.1
6
M.1
7
M.1
8
M.1
9
M.2
0
M.2
1
M.2
2
M.2
3
M.2
4
M.2
5
M.2
6
M.2
7
M.2
8
M.2
9
M.3
0
M.3
1
0.0
0.2
0.4
0.6
0.8
1.0
25

Simulation

Illustrative simulations
0.8, 0.4noisep = 15
0.3 0.3
X Y
M
0.8, 0.4noisep = 15
0.3 0.3
X Y
M
-0.4
0.4
-0.44
0.24
0.4M1
M2
X Y
26
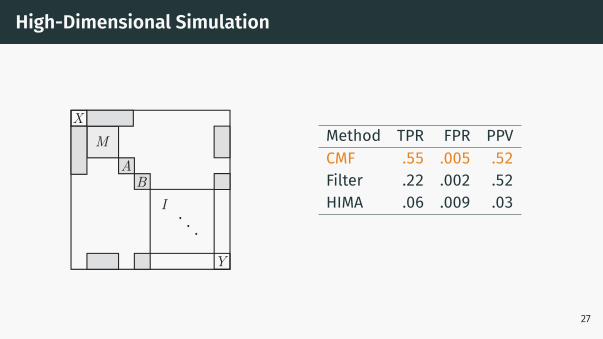
High-Dimensional Simulation
MA
I. . .
X
Y
B
Method TPR FPR PPVCMF .55 .005 .52Filter .22 .002 .52HIMA .06 .009 .03
27

Conclusion
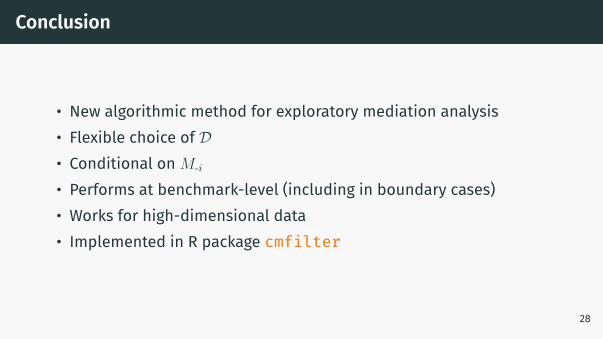
Conclusion
• New algorithmic method for exploratory mediation analysis• Flexible choice of D• Conditional on M-i
• Performs at benchmark-level (including in boundary cases)• Works for high-dimensional data• Implemented in R package cmfilter
28
References
Guyon, I. and Elisseeff, A. (2003). An Introduction to Variable and Feature Selection. Journal of MachineLearning Research (JMLR), 3(3):1157–1182.
Hastie, T., Tibshirani, R., and Wainwright, M. (2015). Statistical Learning with Sparsity: The Lasso andGeneralizations. CRC Press, Boca Raton.
Jacobucci, R., Grimm, K. J., and McArdle, J. J. (2016). Regularized Structural Equation Modeling. StructuralEquation Modeling, 23(4):555–566.
MacKinnon, D. P., Lockwood, C. M., Hoffman, J. M., West, S. G., and Sheets, V. (2002). A comparison of methodsto test mediation and other intervening variable effects. Psychological methods, 7(1):83–104.
Preacher, K. J. and Hayes, A. F. (2008). Asymptotic and resampling strategies for assessing and comparingindirect effects in multiple mediator models. Behavior Research Methods, 40(3):879–891.
Serang, S., Jacobucci, R., Brimhall, K. C., and Grimm, K. J. (2017). Exploratory Mediation Analysis viaRegularization. Structural Equation Modeling, 24(5):733–744.
VanderWeele, T. J. (2015). Explanation in Causal Inference: Methods for Mediation and Interaction. OxfordUniversity Press, New York.
Zhang, H., Zheng, Y., Zhang, Z., Gao, T., Joyce, B., Yoon, G., Zhang, W., Schwartz, J., Just, A., Colicino, E., Vokonas,P., Zhao, L., Lv, J., Baccarelli, A., Hou, L., and Liu, L. (2016). Estimating and testing high-dimensionalmediation effects in epigenetic studies. Bioinformatics, 32(20):3150–3154.
29

Single mediator model
Weak mediation Strong mediation
X Y
M
X Y
M
30
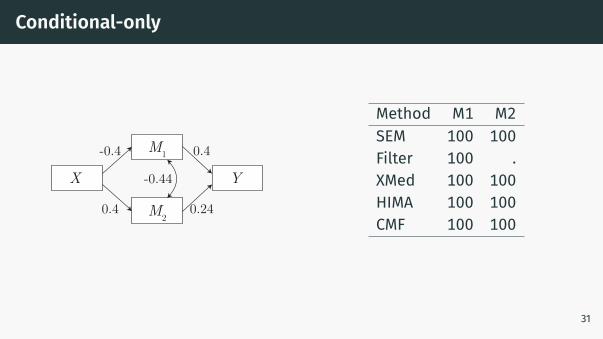
Conditional-only
-0.4
0.4
-0.44
0.24
0.4M1
M2
X Y
Method M1 M2SEM 100 100Filter 100 .XMed 100 100HIMA 100 100CMF 100 100
31
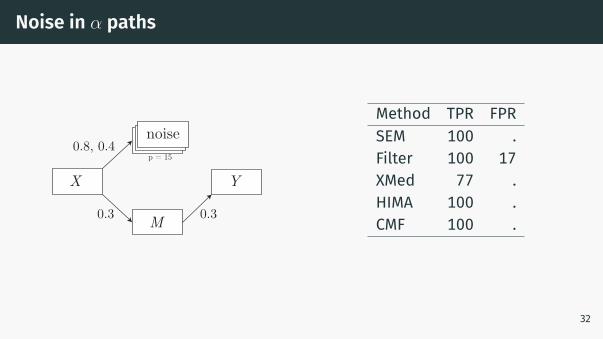
Noise in α paths
0.8, 0.4noisep = 15
0.3 0.3
X Y
M
Method TPR FPRSEM 100 .Filter 100 17XMed 77 .HIMA 100 .CMF 100 .
32
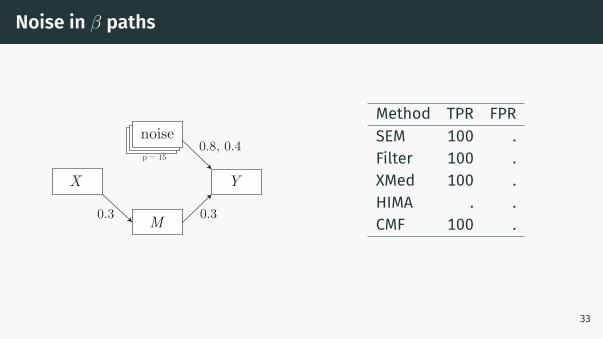
Noise in β paths
0.8, 0.4noisep = 15
0.3 0.3
X Y
M
Method TPR FPRSEM 100 .Filter 100 .XMed 100 .HIMA . .CMF 100 .
33
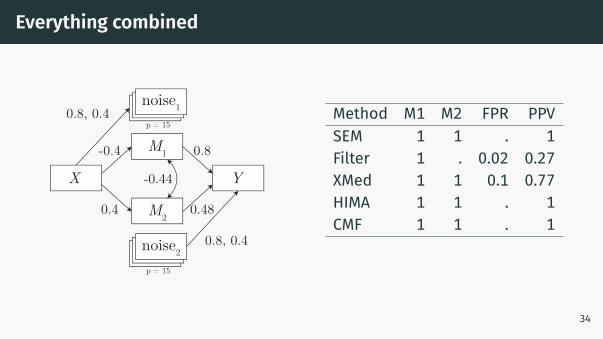
Everything combined
-0.4
0.4
-0.44
0.48
0.8
p = 15
p = 15
X Y
noise1
noise2
M1
M2
0.8, 0.4
0.8, 0.4
Method M1 M2 FPR PPVSEM 1 1 . 1Filter 1 . 0.02 0.27XMed 1 1 0.1 0.77HIMA 1 1 . 1CMF 1 1 . 1
34


![· Web viewglycolysis and tumor growth[22]. PKM2 is essential for TGF-induced EMT in several human cancers [16, 23]. The HIF-1α and c-Myc-hnRNP cascades are essential mediators](https://static.fdocument.org/doc/165x107/5e63c210f9d8e019e876dc5f/web-view-glycolysis-and-tumor-growth22-pkm2-is-essential-for-tgf-induced-emt.jpg)