
Experimental Design in Systems Biology, Based on Parameter …dgalvis/journalclub/papers/11... ·...
14
Experimental Design in Systems Biology, Based on Parameter Sensitivity Analysis Using a Monte Carlo Method: A Case Study for the TNFα -Mediated NF-κ B Signal Transduction Pathway Kwang-Hyun Cho Sung-Young Shin School of Electrical Engineering University of Ulsan Ulsan, 680-749, Korea [email protected] Walter Kolch Beatson Institute for Cancer Research Cancer Research UK Beatson Laboratories Switchback Road, Glasgow, G61 1BD, United Kingdom Institute of Biomedical and Life Sciences University of Glasgow University Avenue, Glasgow, G12 8QQ, United Kingdom Olaf Wolkenhauer Department of Computer Science University of Rostock, Albert Einstein Str. 21 18059 Rostock, Germany [email protected] Mathematical modeling and dynamic simulation of signal transduction pathways is a central theme in systems biology and is increasingly attracting attention in the postgenomic era. The estimation of model parameters from experimental data remains a bottleneck for a major breakthrough in this area. This study’s aim is to introduce a new strategy for experimental design based on parameter sensitivity analysis. The approach identifies key parameters/variables in a signal transduction pathway model and can thereby provide experimental biologists with guidance on which proteins to consider for measurement. The article focuses on applying this approach to the TNFα-mediated NF-κB pathway, which plays an important role in immunity and inflammation and in the control of cell proliferation, differentiation, and apoptosis. A mathematical model of this pathway is proposed, and the sensitivity analysis of model parameters is illustrated for this model by employing the Monte Carlo method over a broad range of parameter values. Keywords: Systems biology, experimental design, signal transduction pathway, mathematical mod- eling, parametric sensitivity, Monte Carlo method, TNFα, NF-κB 1. Introduction Systems biology is attracting increasing numbers of re- searchers from various disciplines. The current interest is | | | | SIMULATION, Vol. 79, Issue 12, December 2003 726-739 © 2003 The Society for Modeling and Simulation International DOI: 10.1177/0037549703040943 not due to particular biological breakthroughs facilitated by mathematical models but is largely based on the promise that signal- and systems-oriented approaches have. One area in which mathematical modeling and simulation has been considered for some time is the inter- and intrady- namics of cell signaling. Once a reasonable mathematical model for even a small part of the pathway is established, then the potential benefits are considerable—supporting at FLORIDA STATE UNIV LIBRARY on November 20, 2015 sim.sagepub.com Downloaded from
Transcript of Experimental Design in Systems Biology, Based on Parameter …dgalvis/journalclub/papers/11... ·...
Experimental Design in Systems Biology,Based on Parameter Sensitivity AnalysisUsing a Monte Carlo Method: A CaseStudy for the TNFααα-Mediated NF-κκκBSignal Transduction PathwayKwang-Hyun ChoSung-Young ShinSchool of Electrical EngineeringUniversity of UlsanUlsan, 680-749, [email protected]
Walter KolchBeatson Institute for Cancer ResearchCancer Research UKBeatson LaboratoriesSwitchback Road, Glasgow, G61 1BD, United KingdomInstitute of Biomedical and Life SciencesUniversity of GlasgowUniversity Avenue, Glasgow, G12 8QQ, United Kingdom
Olaf WolkenhauerDepartment of Computer ScienceUniversity of Rostock, Albert Einstein Str. 2118059 Rostock, [email protected]
Mathematical modeling and dynamic simulation of signal transduction pathways is a central themein systems biology and is increasingly attracting attention in the postgenomic era. The estimation ofmodel parameters from experimental data remains a bottleneck for a major breakthrough in this area.This study’s aim is to introduce a new strategy for experimental design based on parameter sensitivityanalysis. The approach identifies key parameters/variables in a signal transduction pathway modeland can thereby provide experimental biologists with guidance on which proteins to consider formeasurement. The article focuses on applying this approach to the TNFα-mediated NF-κB pathway,which plays an important role in immunity and inflammation and in the control of cell proliferation,differentiation, and apoptosis. A mathematical model of this pathway is proposed, and the sensitivityanalysis of model parameters is illustrated for this model by employing the Monte Carlo method overa broad range of parameter values.Keywords: Systems biology, experimental design, signal transduction pathway, mathematical mod-eling, parametric sensitivity, Monte Carlo method, TNFα, NF-κB
1. IntroductionSystems biology is attracting increasing numbers of re-searchers from various disciplines. The current interest is
||||
SIMULATION, Vol. 79, Issue 12, December 2003 726-739©2003 The Society for Modeling and Simulation InternationalDOI: 10.1177/0037549703040943
not due to particular biological breakthroughs facilitated bymathematical models but is largely based on the promisethat signal- and systems-oriented approaches have. Onearea in which mathematical modeling and simulation hasbeen considered for some time is the inter- and intrady-namics of cell signaling. Once a reasonable mathematicalmodel for even a small part of the pathway is established,then the potential benefits are considerable—supporting
at FLORIDA STATE UNIV LIBRARY on November 20, 2015sim.sagepub.comDownloaded from
EXPERIMENTAL DESIGN IN SYSTEMS BIOLOGY
experimental design, generating hypotheses, and suggest-ing experiments to test them. Building such amathematicalpathway model comprises mainly two aspects: (1) decid-ing on the model structure and (2) estimating the involvedparameter values. In general, it is difficult to formalizethe derivation of a suitable model structure since signaltransduction pathways almost certainly have nonlinear dy-namics. However, one possible systematic way to decideon a model structure was proposed [1–3] by consideringthe fact that a protein involved in the pathway has, in mostcases, a catalytic role. Given a model structure, parameterestimation remains the limiting step in the modeling andsimulation of signal transduction pathways [4].Most prob-lems are due to a lack of quantitative measurements anddata sets covering all variables involved. Another, maybeeven greater, complication is posed by the fact that mea-surements of protein activities are done with purified pro-teins in vitro. The parameters measured may not reflect the“true” activity in the cell. However, for technical reasons,it is very difficult to measure accurate protein activities incells. For all of those reasons, the experiments will con-tinue to challenge the methodologies that are being devel-oped for dynamic pathway modeling and simulation. Withparameter estimation being the most pressing problem inmodeling, the principal aim of this study is introducinga new strategy for experimental design based on parame-ter sensitivity analysis and providing guidance on whichproteins to measure and why.Signal transduction pathways enable the cell to receive,
process, and respond to biochemical stimuli (information).The components of a pathway interact not only with eachother but also with components of other pathways, result-ing in complex signaling networks. Cellular signal trans-duction pathways can be constructed with experimentallydetermined coefficients and analyzed by computationalmethods to understand their role in complex biological pro-cesses [5, 6]. Mathematical modeling of signal transduc-tion pathways can support quantitative hypothesis testing.Simulation can be further used to detect unexpected statecomponents and to predict concentration profiles for dif-ferent experimental designs. Ultimately, the developmentof computational models and the integration of these mod-els with experiments can provide valuable insight into thecomplex systems-level behavior of pathways [7–9]. Bhallaand Iyengar [5] proposed a computational model of thecAMP signal transduction pathway by using the generalneural simulation system, GENESIS. Schoeberl et al. [10]developed a mathematical model describing the dynamicsof the epidermal growth factor (EGF) signal transductionpathway by using ordinary differential equations (ODEs),implemented usingMatlab libraries. Schoeberl, Gilles, andScheurich [11] also investigated a mathematical model ofthe TNFα receptor interaction by using the simulation toolDIVA, and the computational simulation illustrated thatthe apoptotic cross-talk of TNFR1 and TNFR2 dependson TRAF2 depletion and that RIP plays a key role in thecross-talk.
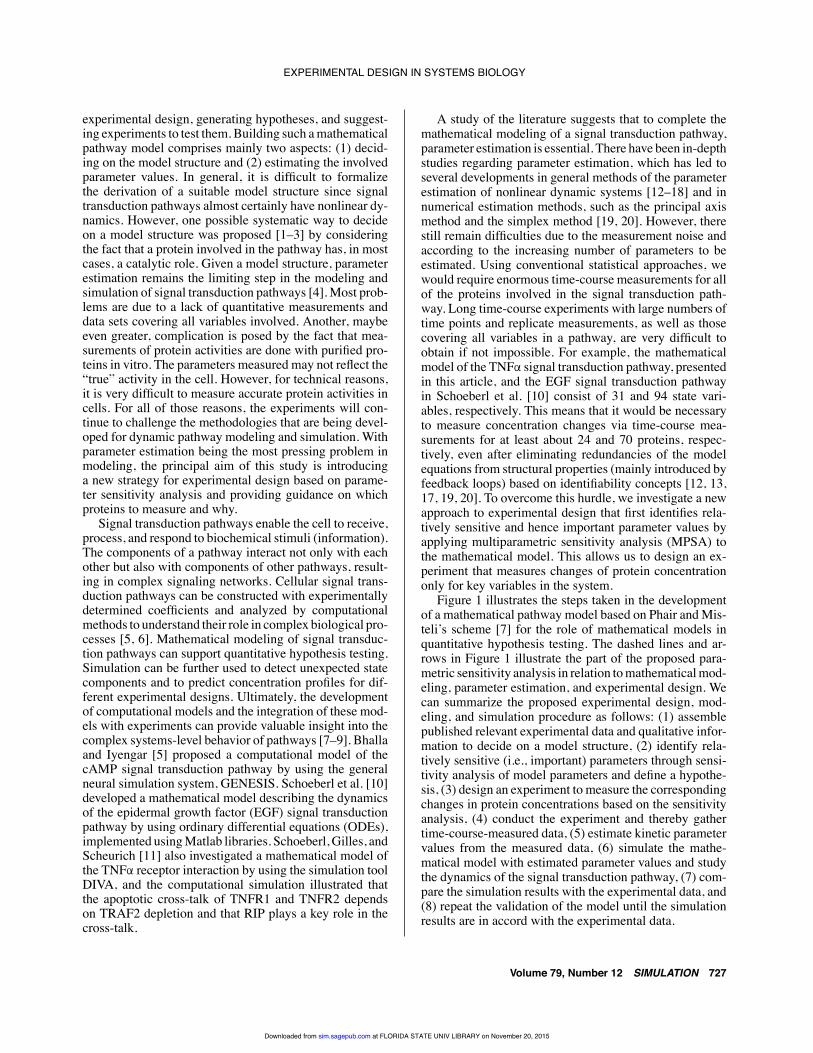
A study of the literature suggests that to complete themathematical modeling of a signal transduction pathway,parameter estimation is essential. There have been in-depthstudies regarding parameter estimation, which has led toseveral developments in general methods of the parameterestimation of nonlinear dynamic systems [12–18] and innumerical estimation methods, such as the principal axismethod and the simplex method [19, 20]. However, therestill remain difficulties due to the measurement noise andaccording to the increasing number of parameters to beestimated. Using conventional statistical approaches, wewould require enormous time-course measurements for allof the proteins involved in the signal transduction path-way. Long time-course experiments with large numbers oftime points and replicate measurements, as well as thosecovering all variables in a pathway, are very difficult toobtain if not impossible. For example, the mathematicalmodel of the TNFα signal transduction pathway, presentedin this article, and the EGF signal transduction pathwayin Schoeberl et al. [10] consist of 31 and 94 state vari-ables, respectively. This means that it would be necessaryto measure concentration changes via time-course mea-surements for at least about 24 and 70 proteins, respec-tively, even after eliminating redundancies of the modelequations from structural properties (mainly introduced byfeedback loops) based on identifiability concepts [12, 13,17, 19, 20]. To overcome this hurdle, we investigate a newapproach to experimental design that first identifies rela-tively sensitive and hence important parameter values byapplying multiparametric sensitivity analysis (MPSA) tothe mathematical model. This allows us to design an ex-periment that measures changes of protein concentrationonly for key variables in the system.Figure 1 illustrates the steps taken in the development
of a mathematical pathway model based on Phair andMis-teli’s scheme [7] for the role of mathematical models inquantitative hypothesis testing. The dashed lines and ar-rows in Figure 1 illustrate the part of the proposed para-metric sensitivity analysis in relation tomathematicalmod-eling, parameter estimation, and experimental design. Wecan summarize the proposed experimental design, mod-eling, and simulation procedure as follows: (1) assemblepublished relevant experimental data and qualitative infor-mation to decide on a model structure, (2) identify rela-tively sensitive (i.e., important) parameters through sensi-tivity analysis of model parameters and define a hypothe-sis, (3) design an experiment to measure the correspondingchanges in protein concentrations based on the sensitivityanalysis, (4) conduct the experiment and thereby gathertime-course-measured data, (5) estimate kinetic parametervalues from the measured data, (6) simulate the mathe-matical model with estimated parameter values and studythe dynamics of the signal transduction pathway, (7) com-pare the simulation results with the experimental data, and(8) repeat the validation of the model until the simulationresults are in accord with the experimental data.
Volume 79, Number 12 SIMULATION 727
at FLORIDA STATE UNIV LIBRARY on November 20, 2015sim.sagepub.comDownloaded from
Cho, Shin, Kolch, and Wolkenhauer
Hypothesizedmechanistic
diagram
Parametricsensitivity analysis
Parameterestimation
Predictions
Experimentalmethods
Time coursemeasured data
Match ?
Experimentaldesign
MathematicalmodelingTranslation
Simulation
No
Yes
Figure 1. Modified Phair’s scheme for mathematical modeling, parameter sensitivity analysis, and experimental design. Thedashed lines and arrows indicate the role of the proposed parametric sensitivity analysis in relation to mathematical modeling,parameter estimation, and experimental design.
Sensitivity analysis is a general-purpose technique thatis often used to analyze how sensitive a system is withrespect to (w.r.t.) the change of parameter values. Thisparameter sensitivity analysis can be used to validate themodel’s response and to design experiments that supportthe estimation of parameters. Shi [21] presented a sta-tistical mechanic model for cell receptors’ enhancementof clustering and oligomerization. To explore the extentof clustering and to calculate the signaling, Monte Carlosimulations using the Metropolis algorithm were studied.Keasling, Kuo, and Vahanian [22] proposed a mathemati-cal model for the Escherichia coli cell cycle and employeda Monte Carlo simulation method to study the initiation ateach increment in cell mass growth, which can account forthe initiation of chromosome replication. Sensitivity analy-sis was also used to identify relatively sensitive parametersin the multiparametric system of the natural attenuation ofmining constraints and volatile organic compounds [23,24] and was referred to as MPSA based on Monte Carlosimulation.
This article investigates the TNFα-mediated NF-κB sig-nal transduction pathway using MPSA. TNFα is a potentproinflammatory cytokine that plays an important role inimmunity and inflammation, as well as in the control of cellproliferation, differentiation, and apoptosis [25–28]. Afterwe identify the most sensitive parameters, we analyze howsensitive the TNFα-mediated NF-κB signal transductionpathway is w.r.t. the changes of these parameter values.
The article is organized as follows. Section 2 brieflyintroduces the multiparametric sensitivity analysis tech-nique, together with an illustrative example. Section 3 de-scribes the mathematical modeling of the TNFα signal
transduction pathway. Section 4 shows the application ofMPSA to the TNFα signal transduction pathway. Section 5summarizes the results from sensitivity analysis and thecorresponding simulations. Finally, conclusions and sug-gestions for further studies are made in section 6. The de-tailed mathematical model of the TNFα signal transductionpathway, the nominal values and the range of parametersfor the simulation, and the initial value of each protein forsimulation are summarized in the appendix.
2. Parametric Sensitivity Analysis
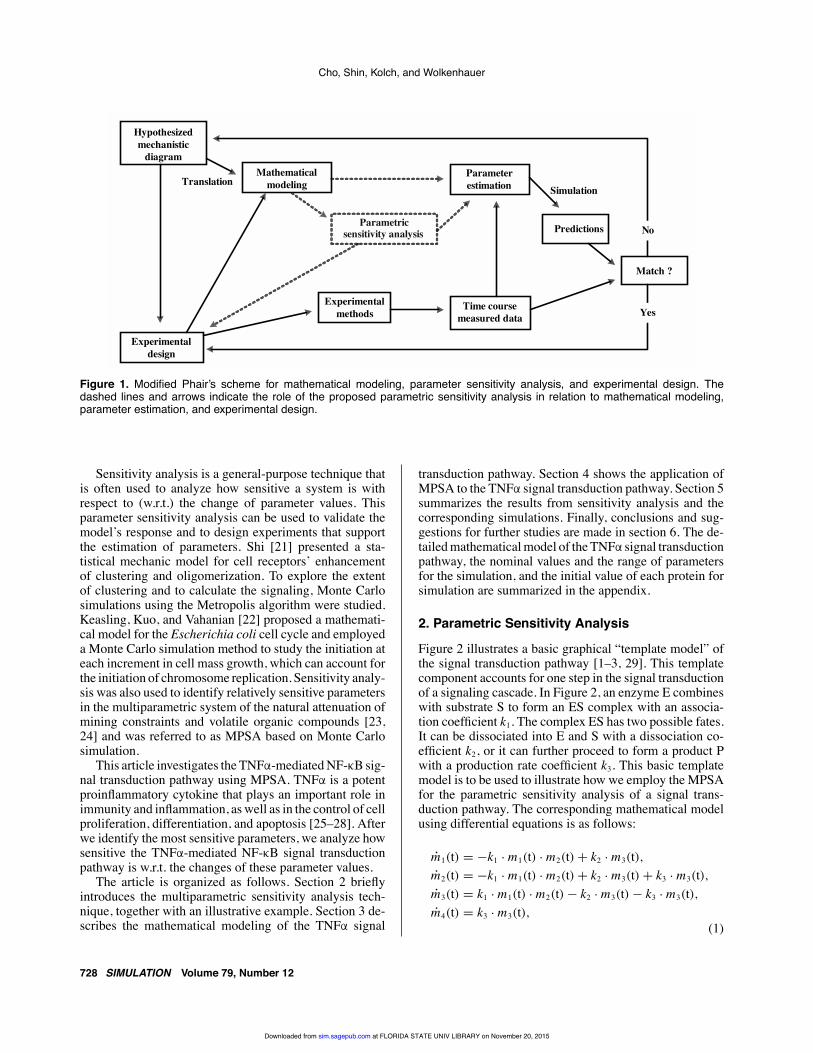
Figure 2 illustrates a basic graphical “template model” ofthe signal transduction pathway [1–3, 29]. This templatecomponent accounts for one step in the signal transductionof a signaling cascade. In Figure 2, an enzyme E combineswith substrate S to form an ES complex with an associa-tion coefficient k1. The complex ES has two possible fates.It can be dissociated into E and S with a dissociation co-efficient k2, or it can further proceed to form a product Pwith a production rate coefficient k3. This basic templatemodel is to be used to illustrate how we employ the MPSAfor the parametric sensitivity analysis of a signal trans-duction pathway. The corresponding mathematical modelusing differential equations is as follows:
m1(t) = −k1 · m1(t) · m2(t) + k2 · m3(t),m2(t) = −k1 · m1(t) · m2(t) + k2 · m3(t) + k3 · m3(t),m3(t) = k1 · m1(t) · m2(t) − k2 · m3(t) − k3 · m3(t),m4(t) = k3 · m3(t),
(1)
728 SIMULATION Volume 79, Number 12
at FLORIDA STATE UNIV LIBRARY on November 20, 2015sim.sagepub.comDownloaded from
EXPERIMENTAL DESIGN IN SYSTEMS BIOLOGY
“Substrate” (S) “Enzyme” (E)
“Product” (P)
“Complex” (ES)
1m 2m
3m
4m
1 2k /k
3k
Figure 2. A graphical basic template model of a single step inthe signal transduction pathway. A circle represents a statevariable (protein concentration), a rectangle represents therelevant kinetic parameter(s), solid arrows indicate the forwardreactions, and dotted arrows indicate the inverse reactions.
where mi with i = 1, 2, 3, 4 are the state variables (m1 forS, m2 for E, m3 for ES, and m4 for P, respectively); kj withj = 1, 2, 3 are the system parameters; and mi(t) = dmi(t)
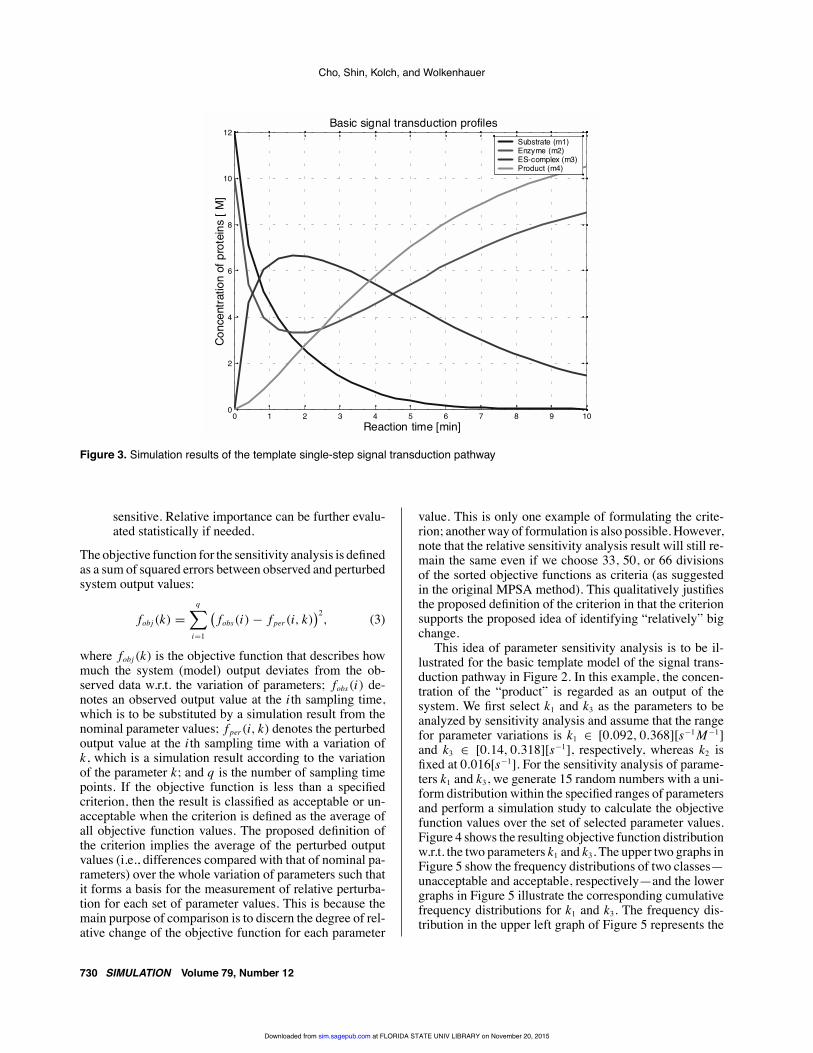
dtdenotes derivatives w.r.t. time. Figure 3 shows the compu-tational simulation results of the basic signal transductionpathway. At an early stage, the substrate and the enzyme de-crease, but the ES complex and the product increase alongwith time. However, the ES complex is turned over anddissociates within around 1.5 minutes. This is because theenzyme first binds to the substrate to catalyze its conver-sion to product. After catalysis the product is released andthe enzyme returns to the initial state.
In general, the system parameters k1, k2, and k3 of thetemplate signal transduction pathway in Figure 2 can beregarded as random variables since the parameter valuesdepend on unknown variations in the cell environment.Furthermore, the dynamics of the system can be changedin turn according to the variation of the parameter val-ues. However, we note that the dynamics must be differen-tially influenced by the variation of each parameter. Start-ing from this point of view, we consider the following prob-lems: (1) How can we build a “core” mathematical modelof the given signal transduction pathway given the lim-ited experimental data available? (2) How can we provideguidance for an experimental design that generates exper-imental data for the “core”mathematical model? Here, the“core”model means a simplified mathematical model thatstill captures the main (i.e., the most important) character-istics of the pathway. To tackle these problems, we proposefirst a sensitivity analysis of the model w.r.t. parameters,providing a ranked list that is used to select those variablesfor which to measure changes in protein concentrations.
These data are then used for the estimation of parametervalues of the model.
The sensitivity analysis is a general technique that iswidely used to analyze how sensitive a system is w.r.t.the changes in parameter values and is usually defined asthe ratio of the change in the system transfer function tothe change of a parameter value [30]. This concept alsocan be extended to nonlinear systems, such as a cellularsignal transduction pathway, by introducing a sensitivityfunction and sensitivity equation [31]. Hence, without lossof generality, the sensitivity gain can be written as
SMP =
∂M!
M∂P
!
P
= Percentage change in MPercentage change in P
, (2)
where M represents the system (output) function, and Pdenotes one of the system parameters. MPSA is employedto identify the parameters for which the system is most sen-sitive. The approach is based on the Monte Carlo method[23, 32–34] over a broad range of each parameter value.The procedure of MPSA includes the following steps:
Step 1: Select the parameters to be tested.
Step 2: Set the range of each selected parametervalue large enough to cover all feasible variations,guided by experience, measurements, and the litera-ture. We suggest here to set the range between one-fifth of a nominal value and five times the nominalvalue.
Step 3: Generate a series of independent randomnumbers with a uniform distribution within therange.
Step 4: Simulate the model for each set of parame-ter values and calculate the corresponding objectivefunction.
Step 5: Determine whether the chosen set of param-eter values is acceptable or unacceptable by compar-ing the objective function value to a given criterion.If the objective function for a specific set of parame-ters is greater than the criterion, the set of parametervalues is classified as unacceptable; otherwise, it isclassified as acceptable. Here the criterion is definedas the average of the objective functions for the entirerange of parameters.
Step 6: Evaluate the parametric sensitivity by com-paring two distributions of the parameter values as-sociated with the acceptable and the unacceptableresults. Here we consider simply “cumulative fre-quencies,” respectively, for each parameter via cor-responding correlation coefficients. If the two distri-butions are not similar (w.r.t. a relatively large cor-relation coefficient), the parameter is classified asinsensitive; otherwise, the parameter is classified as
Volume 79, Number 12 SIMULATION 729
at FLORIDA STATE UNIV LIBRARY on November 20, 2015sim.sagepub.comDownloaded from
Cho, Shin, Kolch, and Wolkenhauer
0 1 2 3 4 5 6 7 8 9 100
2
4
6
8
10
12Basic signal transduction profiles
Conc
entra
tion
of p
rote
ins
[M]
Reaction time [min]
Substrate (m1)Enzyme (m2)ES-complex (m3)Product (m4)
Figure 3. Simulation results of the template single-step signal transduction pathway
sensitive. Relative importance can be further evalu-ated statistically if needed.
The objective function for the sensitivity analysis is definedas a sum of squared errors between observed and perturbedsystem output values:
fobj (k) =q
"
i=1
#
fobs(i) − fper(i, k)$2
, (3)
where fobj (k) is the objective function that describes howmuch the system (model) output deviates from the ob-served data w.r.t. the variation of parameters; fobs(i) de-notes an observed output value at the ith sampling time,which is to be substituted by a simulation result from thenominal parameter values; fper(i, k) denotes the perturbedoutput value at the ith sampling time with a variation ofk, which is a simulation result according to the variationof the parameter k; and q is the number of sampling timepoints. If the objective function is less than a specifiedcriterion, then the result is classified as acceptable or un-acceptable when the criterion is defined as the average ofall objective function values. The proposed definition ofthe criterion implies the average of the perturbed outputvalues (i.e., differences compared with that of nominal pa-rameters) over the whole variation of parameters such thatit forms a basis for the measurement of relative perturba-tion for each set of parameter values. This is because themain purpose of comparison is to discern the degree of rel-ative change of the objective function for each parameter
value. This is only one example of formulating the crite-rion; another way of formulation is also possible. However,note that the relative sensitivity analysis result will still re-main the same even if we choose 33, 50, or 66 divisionsof the sorted objective functions as criteria (as suggestedin the original MPSA method). This qualitatively justifiesthe proposed definition of the criterion in that the criterionsupports the proposed idea of identifying “relatively” bigchange.
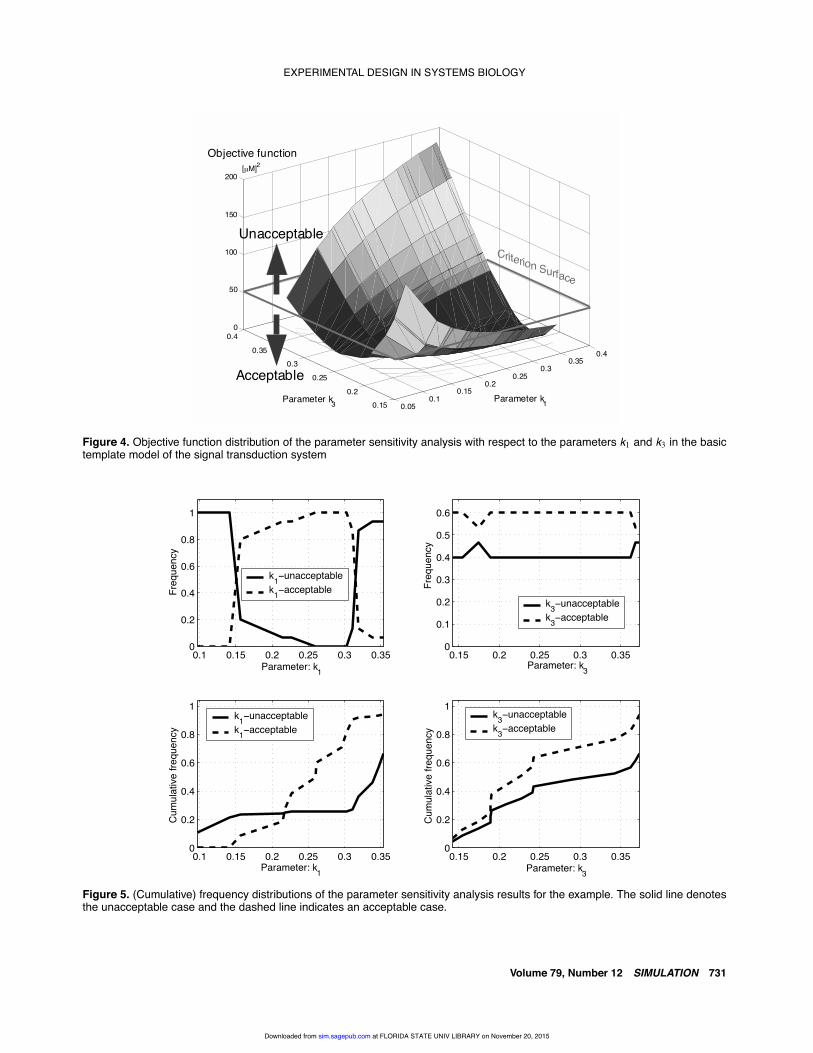
This idea of parameter sensitivity analysis is to be il-lustrated for the basic template model of the signal trans-duction pathway in Figure 2. In this example, the concen-tration of the “product” is regarded as an output of thesystem. We first select k1 and k3 as the parameters to beanalyzed by sensitivity analysis and assume that the rangefor parameter variations is k1 ∈ [0.092, 0.368][s−1M−1]and k3 ∈ [0.14, 0.318][s−1], respectively, whereas k2 isfixed at 0.016[s−1]. For the sensitivity analysis of parame-ters k1 and k3, we generate 15 random numbers with a uni-form distribution within the specified ranges of parametersand perform a simulation study to calculate the objectivefunction values over the set of selected parameter values.Figure 4 shows the resulting objective function distributionw.r.t. the two parameters k1 and k3. The upper two graphs inFigure 5 show the frequency distributions of two classes—unacceptable and acceptable, respectively—and the lowergraphs in Figure 5 illustrate the corresponding cumulativefrequency distributions for k1 and k3. The frequency dis-tribution in the upper left graph of Figure 5 represents the
730 SIMULATION Volume 79, Number 12
at FLORIDA STATE UNIV LIBRARY on November 20, 2015sim.sagepub.comDownloaded from
EXPERIMENTAL DESIGN IN SYSTEMS BIOLOGY
0.050.1
0.150.2
0.250.3
0.350.4
0.150.2
0.25
0.30.35
0.40
50
100
150
200
Parameter k1Parameter k3
Objective function
Unacceptable
Acceptable
Criterion Surface
[µM]2
Figure 4. Objective function distribution of the parameter sensitivity analysis with respect to the parameters k1 and k3 in the basictemplate model of the signal transduction system
0.15 0.2 0.25 0.3 0.350
0.1
0.2
0.3
0.4
0.5
0.6
Freq
uenc
y
Parameter: k3
k3−unacceptablek3−acceptable
0.1 0.15 0.2 0.25 0.3 0.350
0.2
0.4
0.6
0.8
1
Freq
uenc
y
Parameter: k1
k1−unacceptablek1−acceptable
0.15 0.2 0.25 0.3 0.350
0.2
0.4
0.6
0.8
1
Cum
ulat
ive
frequ
ency
Parameter: k3
k3−unacceptablek3−acceptable
0.1 0.15 0.2 0.25 0.3 0.350
0.2
0.4
0.6
0.8
1
Cum
ulat
ive
frequ
ency
Parameter: k1
k1−unacceptablek1−acceptable
Figure 5. (Cumulative) frequency distributions of the parameter sensitivity analysis results for the example. The solid line denotesthe unacceptable case and the dashed line indicates an acceptable case.
Volume 79, Number 12 SIMULATION 731
at FLORIDA STATE UNIV LIBRARY on November 20, 2015sim.sagepub.comDownloaded from
Cho, Shin, Kolch, and Wolkenhauer
frequency of the objective function value to be classified asunacceptable and acceptable, according to the variation ofk3 at each value of k1 and, similarly, to the variation of k1 ateach value of k3 (see upper right graph, Fig. 5). The cumu-lative frequency distributions in the lower plots of Figure 5represent the accumulation of the frequencies for k1 and k3,respectively. For the purpose of a quantitative comparisonof the differences of cumulative frequency distributions,the corresponding correlation coefficients are computed.The correlation coefficient of the cumulative frequencydistributions for k1 is 0.7107 and that for k3 is 0.9995,respectively. We can therefore conclude that the resultingdistribution for the parameter k1 differs to a greater extentthan that of k3; in addition, the parameter k1 can be classi-fied as more sensitive, and the parameter k3 can be classifiedas insensitive. As the result of this analysis, we find thatthe association coefficient of the substrate and enzyme k1 isrelatively more sensitive (hence more important) than theproduction rate coefficient k3, which means that the outputof the system is more dependent on the association coef-ficient k1 for this system. This resembles and confirms theempirical observation that in classical Michaelis-Mentenenzyme kinetics, changes in the Km (i.e., the concentrationof reaction partners) have a relatively greater impact thanchanges in the Vmax , the maximal velocity of the reaction.
3. A Case Study for the TNFααα-Mediated NF-κκκBSig-nal Transduction Pathway: The Structure of theMathematical Model
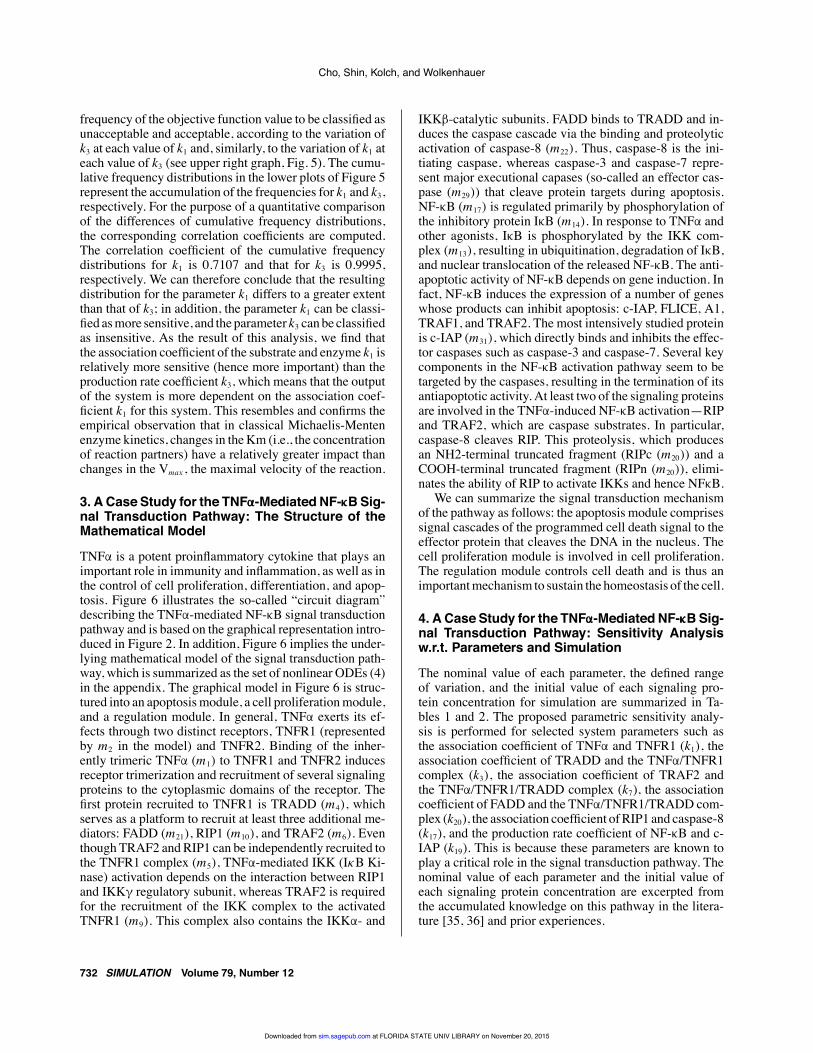
TNFα is a potent proinflammatory cytokine that plays animportant role in immunity and inflammation, as well as inthe control of cell proliferation, differentiation, and apop-tosis. Figure 6 illustrates the so-called “circuit diagram”describing the TNFα-mediated NF-κB signal transductionpathway and is based on the graphical representation intro-duced in Figure 2. In addition, Figure 6 implies the under-lying mathematical model of the signal transduction path-way, which is summarized as the set of nonlinear ODEs (4)in the appendix. The graphical model in Figure 6 is struc-tured into an apoptosis module, a cell proliferation module,and a regulation module. In general, TNFα exerts its ef-fects through two distinct receptors, TNFR1 (representedby m2 in the model) and TNFR2. Binding of the inher-ently trimeric TNFα (m1) to TNFR1 and TNFR2 inducesreceptor trimerization and recruitment of several signalingproteins to the cytoplasmic domains of the receptor. Thefirst protein recruited to TNFR1 is TRADD (m4), whichserves as a platform to recruit at least three additional me-diators: FADD (m21), RIP1 (m10), and TRAF2 (m6). Eventhough TRAF2 and RIP1 can be independently recruited tothe TNFR1 complex (m5), TNFα-mediated IKK (IκB Ki-nase) activation depends on the interaction between RIP1and IKKγ regulatory subunit, whereas TRAF2 is requiredfor the recruitment of the IKK complex to the activatedTNFR1 (m9). This complex also contains the IKKα- and
IKKβ-catalytic subunits. FADD binds to TRADD and in-duces the caspase cascade via the binding and proteolyticactivation of caspase-8 (m22). Thus, caspase-8 is the ini-tiating caspase, whereas caspase-3 and caspase-7 repre-sent major executional capases (so-called an effector cas-pase (m29)) that cleave protein targets during apoptosis.NF-κB (m17) is regulated primarily by phosphorylation ofthe inhibitory protein IκB (m14). In response to TNFα andother agonists, IκB is phosphorylated by the IKK com-plex (m13), resulting in ubiquitination, degradation of IκB,and nuclear translocation of the released NF-κB. The anti-apoptotic activity of NF-κB depends on gene induction. Infact, NF-κB induces the expression of a number of geneswhose products can inhibit apoptosis: c-IAP, FLICE, A1,TRAF1, and TRAF2. The most intensively studied proteinis c-IAP (m31), which directly binds and inhibits the effec-tor caspases such as caspase-3 and caspase-7. Several keycomponents in the NF-κB activation pathway seem to betargeted by the caspases, resulting in the termination of itsantiapoptotic activity. At least two of the signaling proteinsare involved in the TNFα-induced NF-κB activation—RIPand TRAF2, which are caspase substrates. In particular,caspase-8 cleaves RIP. This proteolysis, which producesan NH2-terminal truncated fragment (RIPc (m20)) and aCOOH-terminal truncated fragment (RIPn (m20)), elimi-nates the ability of RIP to activate IKKs and hence NFκB.
We can summarize the signal transduction mechanismof the pathway as follows: the apoptosis module comprisessignal cascades of the programmed cell death signal to theeffector protein that cleaves the DNA in the nucleus. Thecell proliferation module is involved in cell proliferation.The regulation module controls cell death and is thus animportant mechanism to sustain the homeostasis of the cell.
4. A Case Study for the TNFααα-Mediated NF-κκκBSig-nal Transduction Pathway: Sensitivity Analysisw.r.t. Parameters and Simulation
The nominal value of each parameter, the defined rangeof variation, and the initial value of each signaling pro-tein concentration for simulation are summarized in Ta-bles 1 and 2. The proposed parametric sensitivity analy-sis is performed for selected system parameters such asthe association coefficient of TNFα and TNFR1 (k1), theassociation coefficient of TRADD and the TNFα/TNFR1complex (k3), the association coefficient of TRAF2 andthe TNFα/TNFR1/TRADD complex (k7), the associationcoefficient of FADD and the TNFα/TNFR1/TRADD com-plex (k20), the association coefficient of RIP1 and caspase-8(k17), and the production rate coefficient of NF-κB and c-IAP (k19). This is because these parameters are known toplay a critical role in the signal transduction pathway. Thenominal value of each parameter and the initial value ofeach signaling protein concentration are excerpted fromthe accumulated knowledge on this pathway in the litera-ture [35, 36] and prior experiences.
732 SIMULATION Volume 79, Number 12
at FLORIDA STATE UNIV LIBRARY on November 20, 2015sim.sagepub.comDownloaded from
EXPERIMENTAL DESIGN IN SYSTEMS BIOLOGY
TNFa
TNFR1
m1 m2
m3
m4
TNF•
/TNFR1
TRADD
m5
m10
RIP1
TNF•
/TNFR1/TRA
DD
m11TN
F•/TNFR1/
TRADD/RIP1
FADDm21
m23
TNF•
/TNFR1/
TRADD/FAD
D
m22
Caspase-8
m24
TNF•
/TNFR1/TRA
DD/
FADD/Caspas-8
Caspase-8*
m25
Effector
m26
Capase-8*/Effector
m27
Effector*
m28
DNA
fragmentation
TRAF2
m6
m7
TNF•/TN
FR1/TRA
DD/TRAF2
m8
IKK
m9
TNF•
/TNFR1/TRAD
D/TRAF2/IKKm12
TNF•
/TNFR1/TRADD/
RIP1/TRAF2/IKK
m13
IKK*
m14
IkB/NF-kB
m15
IkB/NF-kB/IKK*
m17
NF-kB
m16
IkB-P
m31
c-IAP
m29
m30
Effector/c-IAP
m18
RIP1n
RIP1cm19 m20
RIP1/Caspase-8*
k1/k2
k3/k4
k5/k6
k7/k8
k9/k10
k11/k12
k13
k14/kl5
k16
k17
k18k19
k20/k21
k22/k23
k24
k25/k26
k27
k28
k29/k30
Cell proliferation moduleApoptosis module Regulation module
Figure 6. A graphical model (circuit diagram) of the TNFα-mediated NF-κB signal transduction pathway composed of an apoptosismodule, a regulation module, and a cell proliferation module
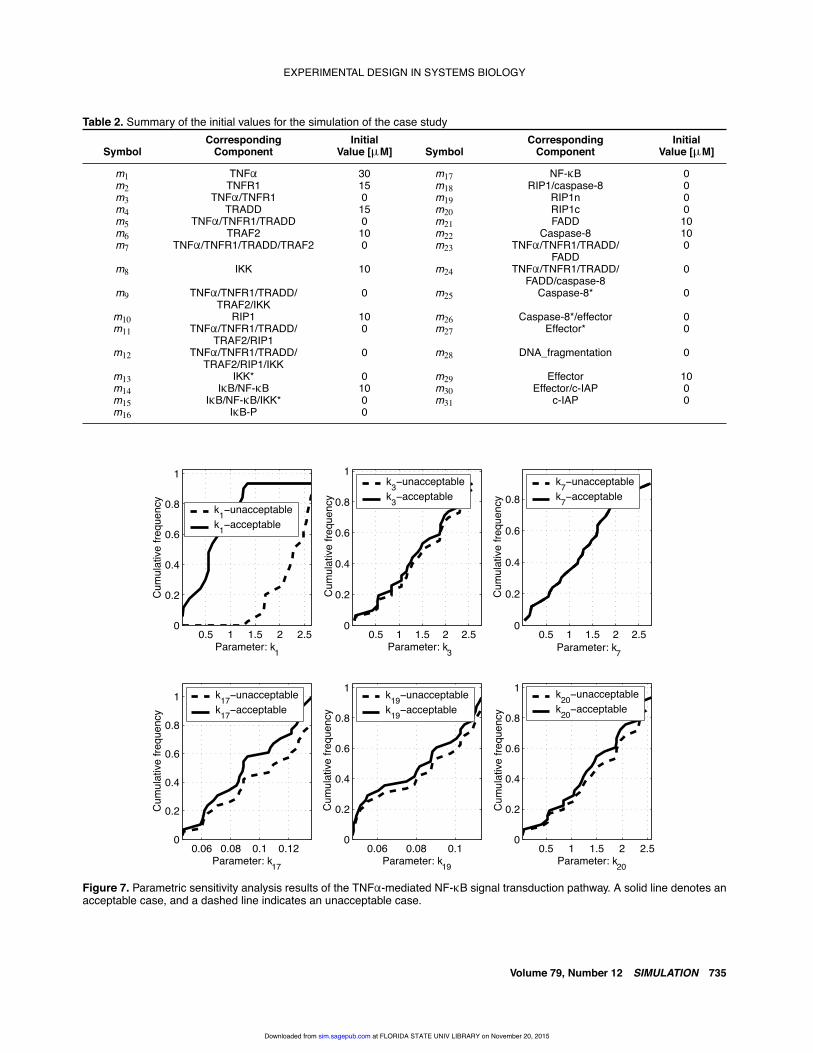
The resulting cumulative frequency distributions for theacceptable and unacceptable cases of the selected param-eters (30 samples are chosen from each parameter intervalin this case) are shown in Figure 7. The relative sensitivityis determined based on the statistical difference of thesedistributions. To do this in a quantitative manner, the cor-responding correlation coefficient of the cumulative fre-quency distributions for each selected parameter is com-puted as follows: the correlation coefficient is 0.061 for k1,0.9996 for k3, 1.0 for k7, 0.9994 for k17, 0.9995 for k19, and
0.9995 for k20. We can therefore conclude that the param-eter k1 is most different from the others and accordinglyclassify the parameter k1 as the most sensitive (important)parameter of the mathematical model in Figure 6. This im-plies that the output of the signal transduction system—theconcentration of NF-κB (m17), in this case—is mostly de-pendent on the association coefficient of TNFα and TNFR1(k1). This suggests an experimental design that measuresthe concentration change of the corresponding proteins forproper estimation of the key parameter. This, in turn, leads
Volume 79, Number 12 SIMULATION 733
at FLORIDA STATE UNIV LIBRARY on November 20, 2015sim.sagepub.comDownloaded from
Cho, Shin, Kolch, and Wolkenhauer
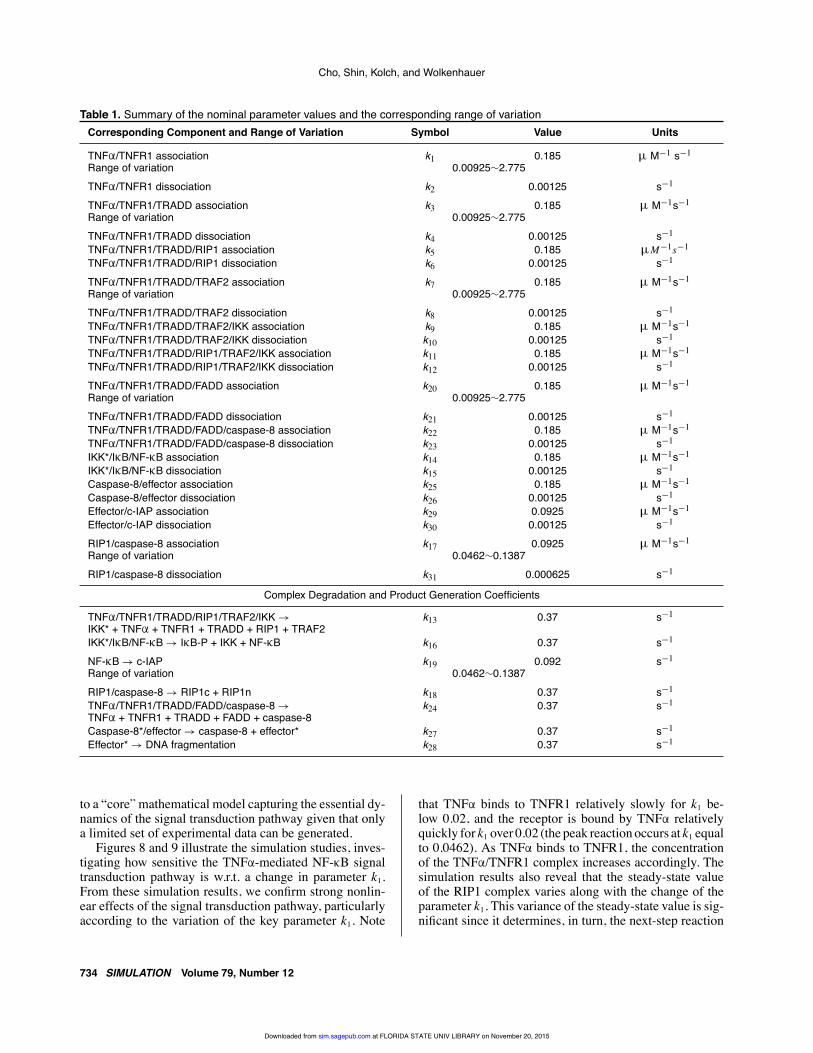
Table 1. Summary of the nominal parameter values and the corresponding range of variationCorresponding Component and Range of Variation Symbol Value Units
TNFα/TNFR1 association k1 0.185 µ M−1 s−1
Range of variation 0.00925∼2.775TNFα/TNFR1 dissociation k2 0.00125 s−1
TNFα/TNFR1/TRADD association k3 0.185 µ M−1s−1
Range of variation 0.00925∼2.775TNFα/TNFR1/TRADD dissociation k4 0.00125 s−1
TNFα/TNFR1/TRADD/RIP1 association k5 0.185 µM−1s−1
TNFα/TNFR1/TRADD/RIP1 dissociation k6 0.00125 s−1
TNFα/TNFR1/TRADD/TRAF2 association k7 0.185 µ M−1s−1
Range of variation 0.00925∼2.775TNFα/TNFR1/TRADD/TRAF2 dissociation k8 0.00125 s−1
TNFα/TNFR1/TRADD/TRAF2/IKK association k9 0.185 µ M−1s−1
TNFα/TNFR1/TRADD/TRAF2/IKK dissociation k10 0.00125 s−1
TNFα/TNFR1/TRADD/RIP1/TRAF2/IKK association k11 0.185 µ M−1s−1
TNFα/TNFR1/TRADD/RIP1/TRAF2/IKK dissociation k12 0.00125 s−1
TNFα/TNFR1/TRADD/FADD association k20 0.185 µ M−1s−1
Range of variation 0.00925∼2.775TNFα/TNFR1/TRADD/FADD dissociation k21 0.00125 s−1
TNFα/TNFR1/TRADD/FADD/caspase-8 association k22 0.185 µ M−1s−1
TNFα/TNFR1/TRADD/FADD/caspase-8 dissociation k23 0.00125 s−1
IKK*/IκB/NF-κB association k14 0.185 µ M−1s−1
IKK*/IκB/NF-κB dissociation k15 0.00125 s−1
Caspase-8/effector association k25 0.185 µ M−1s−1
Caspase-8/effector dissociation k26 0.00125 s−1
Effector/c-IAP association k29 0.0925 µ M−1s−1
Effector/c-IAP dissociation k30 0.00125 s−1
RIP1/caspase-8 association k17 0.0925 µ M−1s−1
Range of variation 0.0462∼0.1387RIP1/caspase-8 dissociation k31 0.000625 s−1
Complex Degradation and Product Generation Coefficients
TNFα/TNFR1/TRADD/RIP1/TRAF2/IKK →IKK* + TNFα + TNFR1 + TRADD + RIP1 + TRAF2
k13 0.37 s−1
IKK*/IκB/NF-κB → IκB-P + IKK + NF-κB k16 0.37 s−1
NF-κB → c-IAP k19 0.092 s−1
Range of variation 0.0462∼0.1387RIP1/caspase-8 → RIP1c + RIP1n k18 0.37 s−1
TNFα/TNFR1/TRADD/FADD/caspase-8 →TNFα + TNFR1 + TRADD + FADD + caspase-8
k24 0.37 s−1
Caspase-8*/effector → caspase-8 + effector* k27 0.37 s−1
Effector* → DNA fragmentation k28 0.37 s−1
to a “core”mathematical model capturing the essential dy-namics of the signal transduction pathway given that onlya limited set of experimental data can be generated.
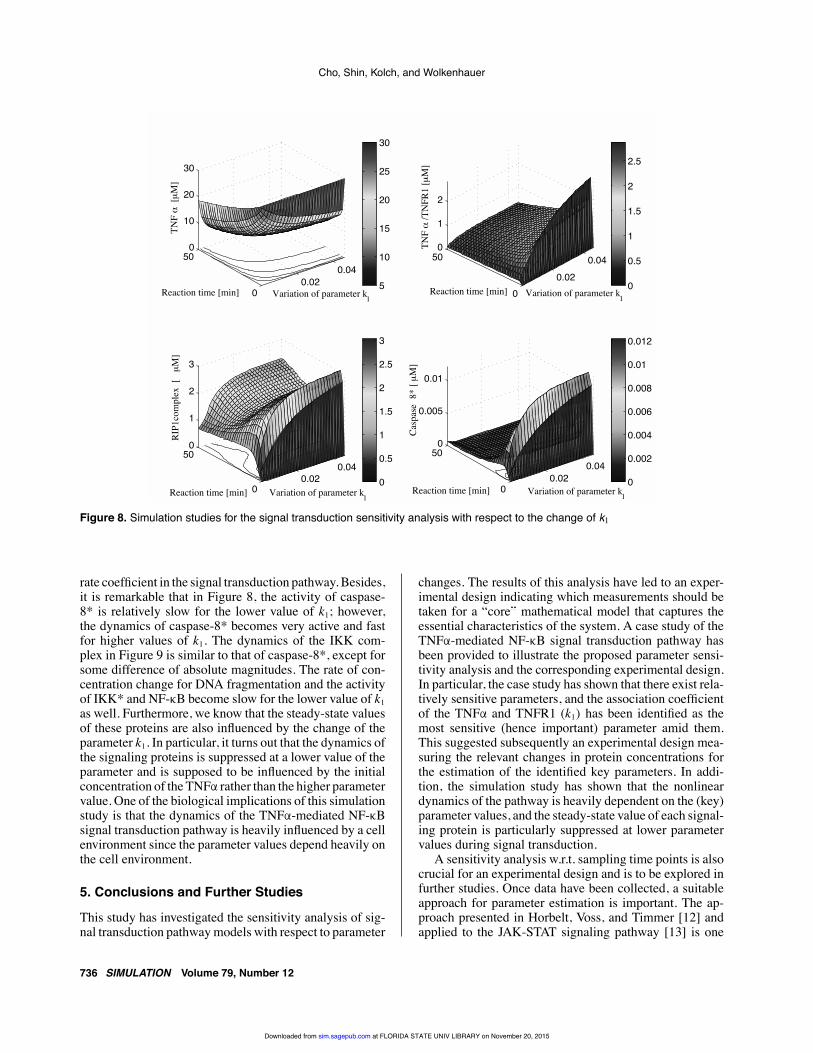
Figures 8 and 9 illustrate the simulation studies, inves-tigating how sensitive the TNFα-mediated NF-κB signaltransduction pathway is w.r.t. a change in parameter k1.From these simulation results, we confirm strong nonlin-ear effects of the signal transduction pathway, particularlyaccording to the variation of the key parameter k1. Note
that TNFα binds to TNFR1 relatively slowly for k1 be-low 0.02, and the receptor is bound by TNFα relativelyquickly for k1 over 0.02 (the peak reaction occurs at k1 equalto 0.0462). As TNFα binds to TNFR1, the concentrationof the TNFα/TNFR1 complex increases accordingly. Thesimulation results also reveal that the steady-state valueof the RIP1 complex varies along with the change of theparameter k1. This variance of the steady-state value is sig-nificant since it determines, in turn, the next-step reaction
734 SIMULATION Volume 79, Number 12
at FLORIDA STATE UNIV LIBRARY on November 20, 2015sim.sagepub.comDownloaded from
EXPERIMENTAL DESIGN IN SYSTEMS BIOLOGY
Table 2. Summary of the initial values for the simulation of the case studyCorresponding Initial Corresponding Initial
Symbol Component Value [µM] Symbol Component Value [µM]
m1 TNFα 30 m17 NF-κB 0m2 TNFR1 15 m18 RIP1/caspase-8 0m3 TNFα/TNFR1 0 m19 RIP1n 0m4 TRADD 15 m20 RIP1c 0m5 TNFα/TNFR1/TRADD 0 m21 FADD 10m6 TRAF2 10 m22 Caspase-8 10m7 TNFα/TNFR1/TRADD/TRAF2 0 m23 TNFα/TNFR1/TRADD/
FADD0
m8 IKK 10 m24 TNFα/TNFR1/TRADD/FADD/caspase-8
0
m9 TNFα/TNFR1/TRADD/TRAF2/IKK
0 m25 Caspase-8* 0
m10 RIP1 10 m26 Caspase-8*/effector 0m11 TNFα/TNFR1/TRADD/
TRAF2/RIP10 m27 Effector* 0
m12 TNFα/TNFR1/TRADD/TRAF2/RIP1/IKK
0 m28 DNA_fragmentation 0
m13 IKK* 0 m29 Effector 10m14 IκB/NF-κB 10 m30 Effector/c-IAP 0m15 IκB/NF-κB/IKK* 0 m31 c-IAP 0m16 IκB-P 0
0.5 1 1.5 2 2.50
0.2
0.4
0.6
0.8
1
Cum
ulat
ive
frequ
ency
Parameter: k1
k1−unacceptablek1−acceptable
0.5 1 1.5 2 2.50
0.2
0.4
0.6
0.8
1
Cum
ulat
ive
frequ
ency
Parameter: k3
k3−unacceptablek3−acceptable
0.5 1 1.5 2 2.50
0.2
0.4
0.6
0.8C
umul
ativ
e fre
quen
cy
Parameter: k7
k7−unacceptablek7−acceptable
0.06 0.08 0.1 0.120
0.2
0.4
0.6
0.8
1
Cum
ulat
ive
frequ
ency
Parameter: k17
k17−unacceptablek17−acceptable
0.06 0.08 0.10
0.2
0.4
0.6
0.8
1
Cum
ulat
ive
frequ
ency
Parameter: k19
k19−unacceptablek19−acceptable
0.5 1 1.5 2 2.50
0.2
0.4
0.6
0.8
1
Cum
ulat
ive
frequ
ency
Parameter: k20
k20−unacceptablek20−acceptable
Figure 7. Parametric sensitivity analysis results of the TNFα-mediated NF-κB signal transduction pathway. A solid line denotes anacceptable case, and a dashed line indicates an unacceptable case.
Volume 79, Number 12 SIMULATION 735
at FLORIDA STATE UNIV LIBRARY on November 20, 2015sim.sagepub.comDownloaded from
Cho, Shin, Kolch, and Wolkenhauer
0.020.04
0
500
10
20
30
Variation of parameter k1Reaction time [min]
TNF α
[µ
M]
5
10
15
20
25
30
0.020.04
0
500
1
2
Variation of parameter k1Reaction time [min]
TNF α
/TN
FR1
[µM
]
0
0.5
1
1.5
2
2.5
0.020.04
0
500
1
2
3
Variation of parameter k1Reaction time [min]
RIP1
com
plex
[ µ
M]
0
0.5
1
1.5
2
2.5
3
0.020.04
0
500
0.005
0.01
Variation of parameter k1Reaction time [min]
Casp
ase
8* [ µ
M]
0
0.002
0.004
0.006
0.008
0.01
0.012
Figure 8. Simulation studies for the signal transduction sensitivity analysis with respect to the change of k1
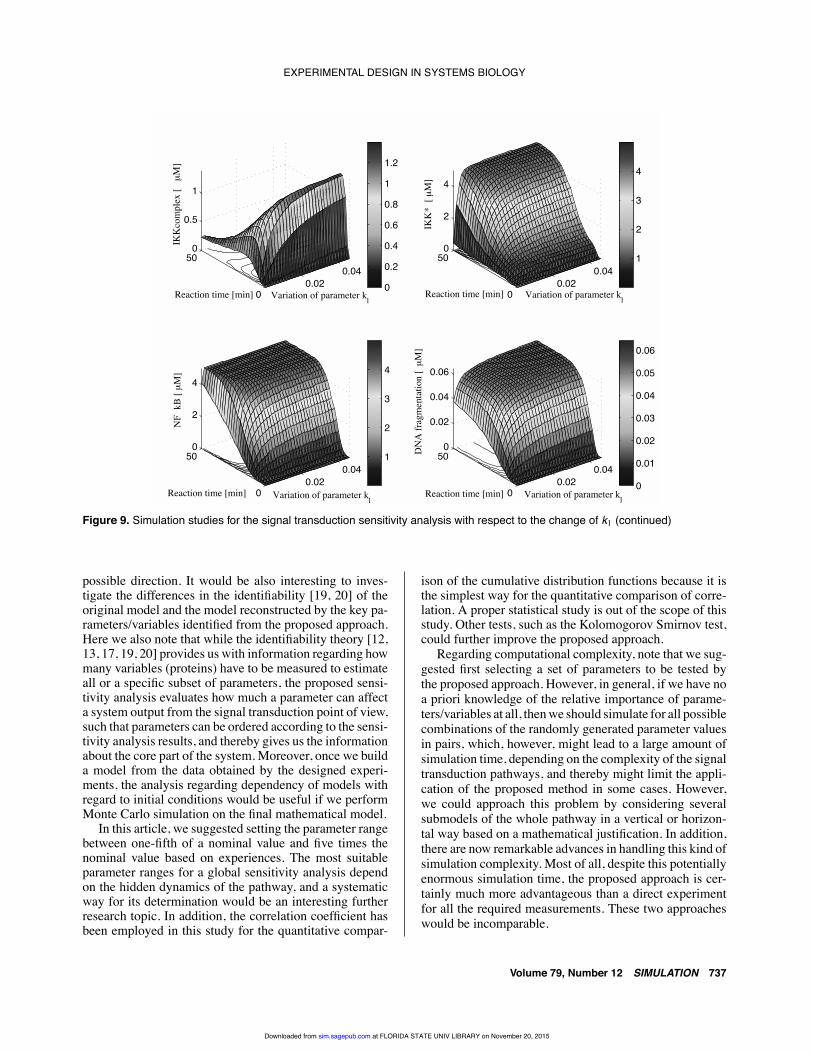
rate coefficient in the signal transduction pathway. Besides,it is remarkable that in Figure 8, the activity of caspase-8* is relatively slow for the lower value of k1; however,the dynamics of caspase-8* becomes very active and fastfor higher values of k1. The dynamics of the IKK com-plex in Figure 9 is similar to that of caspase-8*, except forsome difference of absolute magnitudes. The rate of con-centration change for DNA fragmentation and the activityof IKK* and NF-κB become slow for the lower value of k1as well. Furthermore, we know that the steady-state valuesof these proteins are also influenced by the change of theparameter k1. In particular, it turns out that the dynamics ofthe signaling proteins is suppressed at a lower value of theparameter and is supposed to be influenced by the initialconcentration of the TNFα rather than the higher parametervalue. One of the biological implications of this simulationstudy is that the dynamics of the TNFα-mediated NF-κBsignal transduction pathway is heavily influenced by a cellenvironment since the parameter values depend heavily onthe cell environment.
5. Conclusions and Further Studies
This study has investigated the sensitivity analysis of sig-nal transduction pathway models with respect to parameter
changes. The results of this analysis have led to an exper-imental design indicating which measurements should betaken for a “core” mathematical model that captures theessential characteristics of the system. A case study of theTNFα-mediated NF-κB signal transduction pathway hasbeen provided to illustrate the proposed parameter sensi-tivity analysis and the corresponding experimental design.In particular, the case study has shown that there exist rela-tively sensitive parameters, and the association coefficientof the TNFα and TNFR1 (k1) has been identified as themost sensitive (hence important) parameter amid them.This suggested subsequently an experimental design mea-suring the relevant changes in protein concentrations forthe estimation of the identified key parameters. In addi-tion, the simulation study has shown that the nonlineardynamics of the pathway is heavily dependent on the (key)parameter values, and the steady-state value of each signal-ing protein is particularly suppressed at lower parametervalues during signal transduction.
A sensitivity analysis w.r.t. sampling time points is alsocrucial for an experimental design and is to be explored infurther studies. Once data have been collected, a suitableapproach for parameter estimation is important. The ap-proach presented in Horbelt, Voss, and Timmer [12] andapplied to the JAK-STAT signaling pathway [13] is one
736 SIMULATION Volume 79, Number 12
at FLORIDA STATE UNIV LIBRARY on November 20, 2015sim.sagepub.comDownloaded from
EXPERIMENTAL DESIGN IN SYSTEMS BIOLOGY
0.020.04
0
500
0.5
1
Variation of parameter k1Reaction time [min]
IKK
com
plex
[ µ
M]
0
0.2
0.4
0.6
0.8
1
1.2
0.020.04
0
500
2
4
Variation of parameter k1Reaction time [min]
IKK
* [ µ
M]
1
2
3
4
0.020.04
0
500
2
4
Variation of parameter k1Reaction time [min]
NF
kB [ µ
M]
1
2
3
4
0.020.04
0
500
0.02
0.04
0.06
Variation of parameter k1Reaction time [min]
DN
A fr
agm
enta
tion
[ µ
M]
0
0.01
0.02
0.03
0.04
0.05
0.06
Figure 9. Simulation studies for the signal transduction sensitivity analysis with respect to the change of k1 (continued)
possible direction. It would be also interesting to inves-tigate the differences in the identifiability [19, 20] of theoriginal model and the model reconstructed by the key pa-rameters/variables identified from the proposed approach.Here we also note that while the identifiability theory [12,13, 17, 19, 20] provides us with information regarding howmany variables (proteins) have to be measured to estimateall or a specific subset of parameters, the proposed sensi-tivity analysis evaluates how much a parameter can affecta system output from the signal transduction point of view,such that parameters can be ordered according to the sensi-tivity analysis results, and thereby gives us the informationabout the core part of the system. Moreover, once we builda model from the data obtained by the designed experi-ments, the analysis regarding dependency of models withregard to initial conditions would be useful if we performMonte Carlo simulation on the final mathematical model.
In this article, we suggested setting the parameter rangebetween one-fifth of a nominal value and five times thenominal value based on experiences. The most suitableparameter ranges for a global sensitivity analysis dependon the hidden dynamics of the pathway, and a systematicway for its determination would be an interesting furtherresearch topic. In addition, the correlation coefficient hasbeen employed in this study for the quantitative compar-
ison of the cumulative distribution functions because it isthe simplest way for the quantitative comparison of corre-lation. A proper statistical study is out of the scope of thisstudy. Other tests, such as the Kolomogorov Smirnov test,could further improve the proposed approach.
Regarding computational complexity, note that we sug-gested first selecting a set of parameters to be tested bythe proposed approach. However, in general, if we have noa priori knowledge of the relative importance of parame-ters/variables at all, then we should simulate for all possiblecombinations of the randomly generated parameter valuesin pairs, which, however, might lead to a large amount ofsimulation time, depending on the complexity of the signaltransduction pathways, and thereby might limit the appli-cation of the proposed method in some cases. However,we could approach this problem by considering severalsubmodels of the whole pathway in a vertical or horizon-tal way based on a mathematical justification. In addition,there are now remarkable advances in handling this kind ofsimulation complexity. Most of all, despite this potentiallyenormous simulation time, the proposed approach is cer-tainly much more advantageous than a direct experimentfor all the required measurements. These two approacheswould be incomparable.
Volume 79, Number 12 SIMULATION 737
at FLORIDA STATE UNIV LIBRARY on November 20, 2015sim.sagepub.comDownloaded from

Cho, Shin, Kolch, and Wolkenhauer
6. Appendix
The following set of nonlinear ODEs represents the devel-oped mathematical model of the TNFα-mediated NF-κBsignal transduction pathway shown in Figure 6.
dm1
dt= – k1 · m1 · m2+k2 · m3 (4)
dm2
dt= – k1 · m1 · m2+k2 · m3+k24 · m24+k13 · m12
dm3
dt= k1 · m1 · m2 – k2 · m3 – k3 · m3 · m4+k4 · m5
dm4
dt= – k3 · m3 · m4+k4 · m5+k13 · m12+k24 · m24
dm5
dt= k3 · m3 · m4 – k4 · m5 – k5 · m5 · m10+k6 · m11 – k7
· m5 · m6+k8 · m7 – k20 · m5 · m20+k21 · m23
dm6
dt= – k7 · m5 · m6+k8 · m7+k13 · m12+k24 · m24
dm7
dt= k7 · m5 · m6 – k8 · m7 – k9 · m7 · m8+k10 · m9
dm8
dt= – k9 · m7 · m8+k10 · m9+k16 · m15
dm9
dt= k9 · m7 · m8 – k10 · m9- k11 · m11 · m9+k12 · m12
dm10
dt= – k5 · m5 · m10+k6 · m11- k17 · m10 · m25+k31
· m18+k13 · m12+k24 · m24
dm11
dt= k5 · m5 · m10 – k6 · m11- k11 · m9 · m11+k12 · m12
dm12
dt= k11 · m9 · m11 – k12 · m12 – k13 · m12
dm13
dt= k13 · m12 – k14 · m13 · m14+k15 · m15
dm14
dt= – k14 · m13 · m14+k15 · m15
dm15
dt= k14 · m13 · m14 – k15 · m15 – k16 · m15
dm16
dt= k16 · m15
dm17
dt= k16 · m15 – k19 · m17
dm18
dt= k17 · m10 · m25 – k31 · m18 – k18 · m18
dm19
dt= k18 · m18
dm20
dt= k18 · m18
dm21
dt= – k20 · m5 · m21+k21 · m23+k24 · m24
dm22
dt= – k22 · m22 · m23+k23 · m24+k18 · m18+k27 · m26
dm23
dt= – k22 · m22 · m23+k23 · m24+k20 · m5 · m21 – k21 · m23
dm24
dt= k22 · m22 · m23 – k23 · m24 – k24 · m24
dm25
dt= k24 · m24 – k17 · m10 · m25+k31 · m18– k25 · m25
· m29+k26 · m26
dm26
dt= k25 · m25 · m29 – k26 · m26 – k27 · m26
dm27
dt= k27 · m26 – k28 · m27
dm28
dt= k28 · m27
dm29
dt= – k25 · m25 · m29+k26 · m26– k29 · m29 · m31+k30 · m30
dm30
dt= k29 · m29 · m31 – k30 · m30
dm31
dt= – k29 · m29 · m30+k30 · m30+k19 · m17
7. AcknowledgmentThis work was supported by a grant from the Korean Min-istry of Science and Technology (Korean Systems BiologyResearch Grant, M10309000006-03B5000-00211). OlafWolkenhauer’s work was supported by a post-genomicsgrant of the UK Department for the Environment, Food,and Rural Affairs (DEFRA), conducted in collabora-tion with the Veterinary Laboratories Agency (VLA),Weybridge.
8. References[1] Cho, K.-H., S.-Y. Shin, H.-Y. Lee, and O. Wolkenhauer. 2003. Forth-
coming. Investigations into the analysis and modeling of theTNFα mediated NF-κB signaling pathway. Genome Research13:2413-22.
738 SIMULATION Volume 79, Number 12
at FLORIDA STATE UNIV LIBRARY on November 20, 2015sim.sagepub.comDownloaded from
EXPERIMENTAL DESIGN IN SYSTEMS BIOLOGY
[2] Cho, K.-H., S.-Y. Shin, H.-Y. Kim, O. Wolkenhauer, B. McFerran,and W. Kolch. 2003. Mathematical modeling of the influence ofRKIP on the ERK signaling pathway. In Computational methodsin systems biology, edited by C. Priami, 127-41. Berlin: SpringerVerlag.
[3] Wolkenhauer, O., W. Kolch, and K.-H. Cho. 2003. Mathematical sys-tems biology: Genomic cybernetics. InComputations in cells andtissues: Perspectives and tools of thought, edited by R. Paton.London: Springer Verlag.
[4] Voit, E. O. 2000. Computational analysis of biochemical systems.Cambridge, UK: Cambridge University Press.
[5] Bhalla, U. S., and R. Iyengar. 1999. Emergent properties of networksof biological signaling pathways. Science 283:381-7.
[6] Weng, G., U. S. Bhalla, and R. Iyengar. 1999. Complexity in biolog-ical signaling systems. Science 284:93-6.
[7] Phair, R. D., and T. Misteli. 2001. Kinetic modeling approaches toin vivo imaging. Nature Reviews: Molecular Cell Biology 2:898-907.
[8] Phair, R. D. 1997. Development of kinetic models in the nonlinearworld of molecular cell biology. Metabolism 46:1489-95.
[9] Neves, S. R., and R. Iyengar. 2002. Modeling of signaling networks.BioEssays 24:1110-7.
[10] Schoeberl, B., C. Eichler-Jonsson, E. D. Gilles, and G. Muller. 2002.Computational modeling of the dynamics of MAP kinase cas-cade activated by surface and internalized EGF receptors. NatureBiotechnology 20:370-5.
[11] Schoeberl, B., E. D. Gilles, and P. Scheurich. 2001. A mathematicalvision of TNF receptor interaction. In Proceedings of 2nd Inter-national Conference on Systems Biology (ICSB2001), Pasadena,pp. 158-67.
[12] Horbelt, W., H. U. Voss, and J. Timmer. 2002. Parameter estimationin nonlinear delayed feedback systems from noisy data. PhysicalLetters A 299:513-21.
[13] Swameye, I., T. G. Müller, J. Timmer, O. Sandra, and U. Klingmüller.2003. Identification of nucleocytoplasmic cycling as a remote sen-sor in cellular signaling by databased modeling. Proceedings ofthe National Academy of Science 100:1028-33.
[14] Schittkowski, K. 1994. Parameter estimation in systems of nonlinearequations. Numerical Mathematics 68:129-42.
[15] Hegger, R., H. Kantz, F. Schmüser, M. Diestelhorst, R.-P. Kapsch,and H. Beige. 1998. Dynamical properties of a ferroelectric ca-pacitor observed through nonlinear time series analysis. Chaos8:727-36.
[16] Müller, T. G., N. Noykova, M. Gyllenberg, and J. Timmer. 2002.Parameter identification in a dynamical model of anaerobicwaste water treatment processes.Mathematics in Bioscience 177-178:147-60.
[17] Timmer, J., T. Müller, I. Swameye, O. Sandra, and U. Klingmüller.Forthcoming. Modeling the non-linear dynamics of cellular sig-nal transduction. International Journal of Bifurcation and Chaos14.
[18] Fomina, T., K. Holmström, and V. B. Melas. 2000. Nonlin-ear parameter estimation for inorganic chemical equilibriumanalysis. Research Report 2000-3, Department of Mathemat-ics and Physics, Mälardalen University [Online]. Available:www.ima.mdh.se/forskning/research-reports.ima.mdh.e.shtml
[19] Ljung, L. 1999. System identification. Englewood Cliffs, NJ: Pren-tice Hall.
[20] Audoly, S., L. D’Angio, M. P. Saccomani, and C. Cobelli. 1998.
Global identifiability of linear compartmental models: A com-puter algebra algorithm. IEEE Transactions on Biomedical Engi-neering 45:36-47.
[21] Shi, Y. 2002. Clustering and signaling of cell receptors. Physica A311:199-212.
[22] Keasling, J. D., H. Kuo, and G. Vahanian. 1995. A Monte Carlo sim-ulation of the Escherichia coli cell cycle. Journal of TheoreticalBiology 176:411-30.
[23] Choi, J., J. W. Harvey, and M. H. Conklin. 1999. Use of multi- para-metric sensitivity analysis to determine relative importance of fac-tors influencing natural attenuation of mining contaminants. U.S.Geological Survey Water-Resources Investigations Report 99-4018A [Online]. Available: http://toxics.usgs.gov/pubs/wri99-4018/Volume1/sectionC/ 1405_Choi/pdf/1405_Choi.pdf
[24] Paker, W. J. 1997. A multi-parametric sensitivity analysis of a modeldescribing the fate of volatile organic compounds in tricking fil-ters. Journal of Air &Water Management Association 47:871-80.
[25] Baud, V., and M. Karin. 2001. Signal transduction by tumor necrosisfactor and its relatives. Trends in Cell Biology 11:372-7.
[26] Karin, M., and A. Lin. 2002. NF-κB at the crossroads of life anddeath. Nature Immunology 3:221-7.
[27] Ting, A. T., and D. Endy. 2002. Decoding NF-κB signaling. Science298:1189-90.
[28] Kyriakis, J. M. 2001. Life-or-death decisions. Nature 414:265-6.[29] Stryer, L. 1988. Biochemistry. New York: W. H. Freeman.[30] Kuo, B. C. 1995. Automatic control system. Englewood Cliffs, NJ:
Prentice Hall.[31] Khalil, K. K. 2002. Nonlinear systems. Englewood Cliffs, NJ: Pren-
tice Hall.[32] Law, A. M., and W. D. Kelton. 2000. Simulation, modeling and
analysis. New York: McGraw-Hill.[33] Woolfson, M. M., and G. J. Pert. 1999. An introduction to computer
simulation. New York: Oxford University Press.[34] Newman, M. E. J., and G. T. Barkema. 1999. Monte Carlo methods
in statistical physics. New York: Oxford University Press.[35] Hoffmann, A., A. Levchenko, M. L. Scott, and D. Baltimore. 2002.
The IκB-NF-κB signaling module: Temporal control and selec-tive gene activation. Science 298:1241-5.
[36] Fussenegger, M., J. E. Bailey, and J. Varner. 2000. A mathemati-cal model of caspase function in apoptosis. Nature Biotechnology18:768-74.
Kwang-Hyun Cho is an assistant professor in the School of Elec-trical Engineering, University of Ulsan, Ulsan, Korea.
Sung-Young Shin is a PhD student in the School of ElectricalEngineering, University of Ulsan, Ulsan, Korea.
Walter Kolch is a group leader at the Beatson Institute for CancerResearch and a professor at the Institute of Biomedical and LifeSciences, University of Glasgow, Glasgow, United Kingdom.
OlafWolkenhauer holds the chair in Systems Biology and Bioin-formatics in the Department of Computer Science at the Univer-sity of Rostock, Germany.
Volume 79, Number 12 SIMULATION 739
at FLORIDA STATE UNIV LIBRARY on November 20, 2015sim.sagepub.comDownloaded from