Evaluation of cocoa (Theobroma cacao) bean processing ...
141
Evaluation of cocoa (Theobroma cacao) bean processing strategies to enhance α-glucosidase inhibitory activity of dietary cocoa Kathryn C. Racine Thesis submitted to the faculty of the Virginia Polytechnic Institute and State University in partial fulfillment of the requirements for the degree of Master of Science in Life Science In Food Science and Technology Andrew P. Neilson, Co-Chair Amanda C. Stewart, Co-Chair Haibo Huang Joshua D. Lambert April 25 th , 2019 Blacksburg, Virginia Keywords: fermentation, roasting, flavanols, procyanidins, UPLC-MS/MS, bioactivity, Maillard reaction, melanoidins Copyright 2019
Transcript of Evaluation of cocoa (Theobroma cacao) bean processing ...
Evaluation of cocoa (Theobroma cacao) bean processing strategies to enhance α-glucosidase
inhibitory activity of dietary cocoa
Kathryn C. Racine
Thesis submitted to the faculty of the Virginia Polytechnic Institute and State University in
partial fulfillment of the requirements for the degree of
Master of Science in Life Science
In
Food Science and Technology
Andrew P. Neilson, Co-Chair
Amanda C. Stewart, Co-Chair
Haibo Huang
Joshua D. Lambert
April 25th, 2019
Blacksburg, Virginia
Keywords: fermentation, roasting, flavanols, procyanidins, UPLC-MS/MS, bioactivity, Maillard
reaction, melanoidins
Copyright 2019
Evaluation of cocoa (Theobroma cacao) bean processing strategies to enhance α-glucosidase
inhibitory activity of dietary cocoa
Kathryn C. Racine
ABSTRACT
Cocoa beans (Theobroma cacao) are a highly concentrated source of dietary flavanols- bioactive
compounds associated with the health protective properties of cocoa. Cocoa beans undergo
processing steps, such as fermentation, roasting, winnowing, grinding, pressing, etc., to produce
a final product with specific desirable sensory attributes. It is well established that these
processing steps, specifically fermentation and roasting, result in dramatic degradation of
cocoa’s native flavanols, but it is possible that these processing steps may generate compounds
with novel activities, potentially preserving or enhancing bioactivity. Raw unfermented cocoa
beans were processed by way of a partial factorial approach to produce cocoa powders from the
same batch of raw beans using various combinations of fermentation [unfermented, cool
fermented (maximum 46°C), hot fermented (maximum 60°C))] and roasting [unroasted, cool
roasted (120°C), hot roasted (170°C)]. To simulate cocoa fermentation in a highly controlled
environment, a pilot-scale fermentation model system was employed to eliminate many external
unknowns and ensure that the differences between our cocoa powders were due to our various
treatments, rather than unknown factors occurring during fermentation and roasting. Low and
high molecular weight fractions (8-10 kDa cutoff) were produced from cocoa powder extracts
(CPE) of each treatment to quantify Maillard reaction products (MRP). A HILIC-UPLC MS/MS
method was developed to more efficiently and sensitively quantify cocoa flavanols with high
degrees of polymerization (DP) produced during processing. Overall, cocoa processing
significantly (p<0.05) decreased the total phenolic and total flavanol concentrations of CPEs. Hot
roasting had the greatest impact on native flavanol degradation yet produced CPEs with the
highest mean degree of polymerization (mDP). All CPEs dose-dependently inhibited α-
glucosidase enzyme activity, with cool fermented/cool roasted cocoa powder exhibiting the best
inhibition (IC50 of 62.2 µg/mL). Increasing flavanol mDP was correlated with decreasing IC50
values, suggesting that the complex flavanols produced during processing enhance cocoa’s
bioactivity (or their production is associated with other products that enhance bioactivity).
Alternatively, high molecular weight CPE fractions were correlated with increasing IC50 values,
suggesting that MRPs interfere with enzyme inhibition or are associated with other products
(polyphenols, macronutrients, etc.) that interfere with enzyme inhibition. Overall, the data
presented within this work indicate that the components of processed cocoa powders are
promising inhibitors of α-glucosidase, despite a significant reduction in native flavanol
composition induced by processing, and moreover that fermentation and roasting conditions can
positively influence the bioactivity of cocoa despite losses of native flavanols.
Evaluation of cocoa (Theobroma cacao) bean processing strategies to enhance α-glucosidase
inhibitory activity of dietary cocoa
Kathryn C. Racine
GENERAL AUDIENCE ABSTRACT
According to the Centers for Disease Control and Prevention, obesity-related chronic conditions
such as cardiovascular disease and type 2 diabetes mellitus (T2D) are the leading cause of
preventable and/or premature death, with 51% of the American population predicted to be obese
by 2030. Cocoa (Theobroma cacao) is a highly concentrated source of polyphenols, and these
compounds have been shown to interact with and inhibit digestive enzymes responsible for
carbohydrate breakdown. By inhibiting the activity of these digestive enzymes, it is possible to
slow down carbohydrate absorption after a meal and ultimately reduce large spikes in blood
glucose levels, being a promising strategy in the prevention and maintenance of T2D. Cocoa
beans undergo processing steps to produce a final product, such as cocoa powder, and it is
known that these processing steps reduce the levels of beneficial polyphenols. Yet, how this
processing-induced degradation effects the health protective activities of cocoa is still widely
unknown and is the focus of this work. Through highly controlled cocoa bean processing, cocoa
powders of different processing conditions were produced and used to assess how various
processing parameters impacted digestive enzyme activity. Overall, processing steps did reduce
levels of native polyphenols. However, these losses did not demonstrate a reduction in enzyme
inhibition and certain processing conditions actually enhanced digestive enzyme inhibition. This
research shows promise for the potential use of processed cocoa powder as an effective strategy
in the prevention and maintenance of T2D and further work must be done to understand the
mechanisms behind this relationship.

iv
Acknowledgements
I would like to thank my advisors, Drs. Andrew Neilson and Amanda Stewart. Thank you for
constantly pushing me beyond my limits and molding me into a better scientist. Your support
over the past two years has been unconditional, and for that I am extremely grateful.
Thank you to the rest of my committee, Dr. Haibo Huang and Dr. Josh Lambert, for your
investment into my success, and Brian Wiersema for helping with my many cocoa fermentations
(at all hours of the evening) and for your advice over the past two years.
Thank you to my parents, sisters, and friends for continuing to support my educational career,
wherever it may take me. To Peter, for having the courage to leave Texas with me and for always
encouraging me to achieve my goals. Laura Griffin, thank you for your wise words and
friendship. And Gary, for being my constant writing companion.
Finally, I would like to thank Wyatt Elder at Cargill Inc for his generous donation of raw
unfermented cocoa beans, Arlen Moser, Matt Mastrog, and the Blommer Chocolate Research
and Development team in East Greenville, PA for their time and guidance in processing my
cocoa powders, this project would not have been possible without you.
v
Table of Contents
Acknowledgements ...................................................................................................................................... iv
Table of Contents .......................................................................................................................................... v
List of Figures ............................................................................................................................................. vii
List of Tables .............................................................................................................................................. xii
List of Abbreviations ................................................................................................................................. xiii
Attributions ................................................................................................................................................ xiv
Chapter 1. Introduction and Justification .................................................................................... 1
References ............................................................................................................................................. 3
Chapter 2. Review of Literature .................................................................................................. 5
2.1 Theobroma Cacao ........................................................................................................................... 5
2.2 Polyphenols ..................................................................................................................................... 8
2.3 Flavanols and Bioavailability .......................................................................................................... 9
2.4 Cocoa Processing and Impact on Flavanol Composition .............................................................. 12
2.5 Maillard Reaction Products ........................................................................................................... 15
2.6 Digestive Enzyme Inhibition ........................................................................................................ 18
2.7 Characterization of Polyphenols by Mass Spectrometry .............................................................. 21
2.8 Conclusions ................................................................................................................................... 24
References ........................................................................................................................................... 25
Chapter 3. Development of a Rapid HILIC UPLC-MS/MS Method for Procyanidins with
Enhanced Ionization Efficiency ................................................................................................ 31
3.1 Introduction ................................................................................................................................... 32
3.2 Materials and Methods .................................................................................................................. 35
3.3 Results and Discussion.................................................................................................................. 38
3.4 Conclusions ................................................................................................................................... 52
References ........................................................................................................................................... 53
Chapter 4. Development and Characterization of a Pilot-Scale Model Cocoa Fermentation
System Suitable for Studying the Impact of Fermentation on Putative Bioactive Compounds
and Bioactivity of Cocoa ........................................................................................................... 55
4.1 Introduction ................................................................................................................................... 56
4.2 Materials and Methods .................................................................................................................. 58
4.3 Results ........................................................................................................................................... 65
4.4 Discussion ..................................................................................................................................... 72
References ........................................................................................................................................... 78
vi
Chapter 5. Modulation of α-glucosidase activity results from changes in flavanol mean degree
of polymerization imparted through controlled fermentation and roasting .............................. 83
5.1 Introduction ................................................................................................................................... 84
5.2 Materials and Methods .................................................................................................................. 86
5.3 Results ........................................................................................................................................... 93
5.4 Discussion ................................................................................................................................... 103
5.5 Conclusion .................................................................................................................................. 109
References ......................................................................................................................................... 110
Chapter 6. Conclusions and Future Work ............................................................................... 114
Appendix A: Supplementary Information for Chapter 5 .......................................................................... 116
A1. Supplementary Materials and Methods ...................................................................................... 116
A2. Supplementary Results ............................................................................................................... 120
Appenedix B: Copyright Release .............................................................................................................. 126
vii
List of Figures
Figure 2.1 Cocoa processing flow diagram7 ................................................................................... 7
Figure 2.2 Basic skeletal structures of polyphenols........................................................................ 8
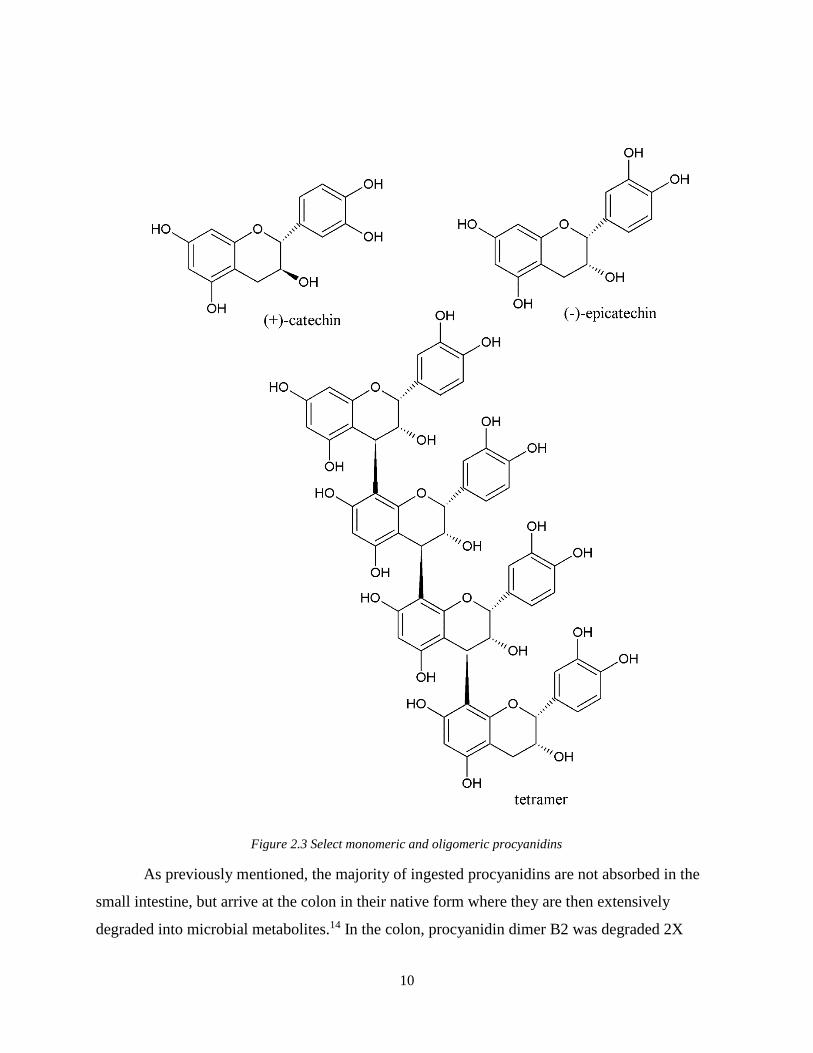
Figure 2.3 Select monomeric and oligomeric procyanidins……………………………………..10
Figure 2.4 Proposed MRP formation…………………………………………………………….16
Figure 2.5 Chemical structure of acarbose………………………………………………………19
Figure 2.6 Scheme of tandem mass spectrometry, where two or more mass analyzers are in
sequence to analyze components of a mixture. Starting at the inlet, analytes are ionized in the ion
source and the subject ion then moves through MS1 for a precursor ion mass selection. The
collision cell is the cite of fragmentation before the product ion is then analyzed in MS2,
followed by detection…………………………………………………………………………….23
Figure 3.1. Structures of monomeric cocoa flavanols (C, EC), and select representative flavanol
oligomers (dimer, heptamer). Note that raw cocoa beans contain primarily (−)-C, but
epimerization during processing results in (+)-C being the predominant epimer in finished cocoa
products and cocoa powder. .......................................................................................................... 32
Figure 3.2. Peak areas of cocoa flavanols resulting from post-column infusion of potential ESI
enhancer compounds. ESI enhancers (1 M) were infused at 10 µL/min into the flow path after
column elution but before ionization, through the built-in syringe pump of the LC-MS/MS
instrument: no infusion, water (LC-MS grade), ammonium formate (1M), sodium carbonate
(1M), sodium acetate (1M), sodium citrate (1M), ammonium bicarbonate (1M). A 40 mg/mL
cocoa extract was injected into the column at a volume of 1 µL. Each bar represents the peak
areas of a different analyte, progressing from EGC, DP1 – DP10. Samples were analyzed in
triplicate and values are presented as the mean ± SEM. ............................................................... 40
Figure 3.3. Optimization of ammonium formate infusion rate. 1.0 M ammonium formate was
infused at various rates from 0-30 µL/min. Injections were performed using a highly
concentrated 40 mg/mL CE at an injection volume of 1 µL/min. All values have been normalized
to 100% using a no infusion baseline (0 µL). Samples were analyzed in triplicate and values are
presented as the mean ± SEM. Significance between time points within each compound was
determined by one-way ANOVA and Tukey’s HSD post-hoc test (P<0.05) Time points with
superscripts are significantly different and those with no superscripts indicate no significant
difference between treatments…………………………………………………………………...42
Figure 3.4. Optimization of ammonium formate infusion concentrations. Ammonium formate
was infused at various concentrations from 0-2.0 M at 5 µL/min. Injections were performed
during analysis of a highly concentrated 40 mg/mL CE at an injection volume of 1 µL. All
values have been normalized to 100% using a no infusion baseline (0 uL). Note broken x-axis for
ease of interpretation. Samples were analyzed in triplicate and values are presented as the mean ±
SEM. Significance between time points was determined by one-way ANOVA and Tukey’s HSD
post-hoc test (P<0.05) Time points with superscripts are significantly different and those with no
superscripts indicate no significant difference between treatments……………………………...43
viii
Figure 3.5. Net effect of optimized infusion and MS tune (i.e. source) settings. Samples were run
with and without the infusion solution (.04 M ammonium formate infused at 5 µL/min) at
original (org) and optimized (opt) tune settings. Injections were performed using a 5 mg/mL CE
at an injection volume of 2 µL. Samples were analyzed in triplicate and values are presented as
the mean ± SEM………………………………………………………………………………….45
Figure 3.6. (A) MRM chromatograms of flavanol monomers, representing the impact of injection
volume on peak intensity. A 5 mg/mL CE was injected at (A) 0.5 µL, (B) 1 µL, (C) 2 µL, (D) 5
µL, (E) 10 µL, (F) 20 µL, (G) 30 µL, (H) 40 µL, and (I) 50 µL. A 40 mg/mL CE was injected at
1 µL (J), 20 mg/mL CE at 2 µL (K), 10 mg/mL CE at 4 µL (L), 5 mg/mL at 8 µL (M), 2.5
mg/mL CE at 16 µL (N), and 1 mg/mL CE at 40 µL (O). (B) Decamer MRM chromatograms
representing the impact of injection volume on peak intensity. A 5 mg/mL CE was injected at
(A) 0.5 µL, (B) 1 µL, (C) 2 µL, (D) 5 µL, (E) 10 µL, (F) 20 µL, (G) 30 µL, (H) 40 µL, and (I) 50
µL. A 40 mg/mL CE was injected at 1 µL (J), 20 mg/mL CE at 2 µL (K), 10 mg/mL CE at 4 µL
(L), 5 mg/mL at 8 µL (M), 2.5 mg/mL CE at 16 µL (N), and 1 mg/mL CE at 40 µL (O)………47
Figure 3.7. LC-MS/MS overlay chromatogram of non-smoothed peaks of each compound
analyzed from cocoa extract (left), as well as hexamer and nonamer chromatograms, obtained
from analysis of the respective authentic standards separately………………………………….52
Figure 4.1. (A) pH measurements for both simulated pulp media and bean nib. It is important to
note that, for bean nib measurements, these values do not quantify the pH of the cocoa bean
itself, but rather of the acidity derived when bean acids are diluted in water. These nib values are
useful for comparison between the pH of the solution produced by beans at different time points.
Dissolved oxygen (DO) measurements within the simulated pulp media are expressed in mg/L.
(B) Fermentation index (FI) expressed as a ratio of absorbance at 460 and 530 nm. (C) Cut test
of six randomly selected beans per each timepoint. Beans were selected from both fermentation
treatments to form one composite representation. Values are presented as the mean ± SEM of
fermentation replicates. Significance between time points for each value was determined by one-
way ANOVA and Tukey’s HSD post-hoc test (p < 0.05). Time points with different letters are
significantly different within values. ............................................................................................ 66
Figure 4.2. Enumeration of (A) yeast, (B) lactic acid bacteria (LAB) and (C) acetic acid bacteria
(AAB) in simulated pulp media, expressed in log colony-forming units (CFU)/mL. Values are
presented as the mean ± SEM of fermentation replicates. Significance between time points was
determined by one-way ANOVA and Tukey’s HSD post-hoc test (p < 0.05). Time points with
different letters are significantly different within values. ............................................................. 67
Figure 4.3. Concentration of fermentation substrates and metabolites in simulated pulp media
across 168 h. Values are presented as the mean ± SEM of fermentation replicates. Significance
between time points was determined by one-way ANOVA and Tukey’s HSD post-hoc test (p <
0.05). Time points with different letters are significantly different within values. ...................... 68
Figure 4.4. Concentration of fermentation substrates and metabolites in cocoa beans across 168
h. Values are presented as the mean ± SEM of fermentation replicates. Significance between
time points was determined by one-way ANOVA and Tukey’s HSD post-hoc test (p < 0.05).
Time points with different letters are significantly different values. ............................................ 69
ix
Figure 4.5. (A) Concentration of total polyphenols over the 168-h fermentation, as quantified by
the Folin–Ciocalteu colorimetric assay, expressed in mg GAE/g cocoa bean. (B) Concentration
of total flavanols over the 168-h fermentation, as quantified by the 4-
dimethylaminocinnamaldehyde (DMAC) colorimetric assay, expressed in mg PCB2/g bean. (C–
G) Individual polyphenol concentrations (C, EC, PCB2, PCC1, CinA2) over the 168-h
fermentation, as quantified by reversed phase UPLC-MS, and expressed as mg/g cocoa bean.
Values are presented as the mean ± SEM of fermentation replicates. Significance between time
points was determined by one-way ANOVA and Tukey’s HSD post-hoc test (p < 0.05). Time
points with different letters are significantly different within values. .......................................... 70
Figure 4.6. Individual polyphenol concentrations by mean degree of polymerization (mDP) over
the 168-h fermentation as quantified by HILIC UPLC-MS/MS and expressed as mg/g cocoa
bean. Values are presented as the mean ± SEM of fermentation replicates. Significance between
time points was determined by one-way ANOVA and Tukey’s HSD post-hoc test (p < 0.05).
Time points with different letters are significantly different within values. ................................. 72
Figure 4.7. Polyphenol-rich cocoa extracts (CE) prepared at each point throughout the 168-h
fermentation. See Section 2.8 for methodology. It is important to note the change in color and
texture towards the final hours of fermentation. ........................................................................... 75
Figure 5.1. Multivariate approach to evaluating the impact of combined fermentation and
roasting parameters, producing 7 total cocoa powders: unfermented/unroasted (UF/UR),
unfermented/cool roast (UF/CR), unfermented/hot roast (UF/HR), cool fermentation/unroasted
(CF/UR), cool fermentation/cool roast (CF/CR), hot fermentation/unroasted (HF/UR), hot
fermentation/hot roast (HF/HR). ................................................................................................... 87
Figure 5.2. A. pH of simulated pulp media/bean nib and dissolved oxygen (DO). It is important
to note that for bean nib measurements, these values do not quantify the pH of the cocoa bean
itself, but rather the acidity derived from bean acids diluted in water. These nib values are useful
for comparison between the pH of the solution produced by beans at different time points. B. Cut
test for all fermentations performed. C. Fermentation index as a ratio of 460 nm:530 nm, with
values ≥1 indicating a complete fermentation. Note broken axes for ease of interpretation on
select graphs. Values are presented as the mean ± SEM of fermentation replicates within
treatments. Significant between time points for each value was determined by one-way ANOVA
and Tukey’s HSD post-hoc test (p<0.05). Time points with different letters are significantly
different within values. No letters indicate no statistical difference within values. ..................... 94
Figure 5.3. Total polyphenols in each cocoa powder (A) and cocoa bean (B) expressed in gallic
acid equivalents. Total flavanols from cocoa powder (C) and cocoa bean (D) expressed in
procyanidin B2 equivalents. (E) Overall mean flavanol degree of polymerization for the total
flavanols in cocoa powder- native monomers were accounted for in calculation. (F) Mean
flavanol degree of polymerization for oligomers and polymers in cocoa powder (not including
native monomers); Note broken axes (B,D,E) for ease of interpretation. Raw bean (B,D)
indicates the extract prepared from the cocoa beans as received from the supplier and is different
from UF/UR (-/-) as these beans were rehydrated and dried. All values are presented as the mean
± SEM. Significance between treatments was determined by one-way ANOVA and Tukey’s
HSD post-hoc test (p<0.05). Treatments with different letters are significantly different within
values. ........................................................................................................................................... 96
x
Figure 5.4. Levels of individual procyanidin compounds in cocoa powders. Values are
normalized to the fat-free mass of each treatment to account to varying fat content. All values are
presented as the mean ± SEM. Significance between treatments was determined by one-way
ANOVA and Tukey’s HSD post-hoc test (p<0.05). Treatments with different letters are
significantly different within values. ............................................................................................ 97
Figure 5.5. Total procyanidins (DP 1-10) per cocoa powder treatment as measured by HILIC
UPLC-MS/MS. Each segment represents the mean ± SEM. Significance between treatments was
determined by one-way ANOVA and Tukey’s HSD post-hoc test (p<0.05). Treatments with
different letters are significantly different within values. ............................................................. 98
Figure 5.6. Analysis of LMW and HMW CPE fractions and the starting 40 mg/mL CPE for
early, intermediate, and late MRP. Early MRP were quantified at 0.15625 mg/mL at 280 nm ,
intermediate MRP were quantified at 2.5-1.25 mg/mL at 360 nm, and late MRP were quantified
at 5 mg/mL (<8-10 kDa), 2.5 mg/mL (>8-10 kDa), and 10 mg/mL (unfractionated CPE) at 420.
Due to the lack of standard response at 420 nm, absolute absorbance of these compounds is
reported, but this absorbance is relative to concentration. Each bar represents the mean ± SEM.
Significance between treatments was determined by one-way ANOVA and Tukey’s HSD post-
hoc test (p<0.05). Treatments with different letters are significantly different within values. No
letters indicate no statistical difference within values. ................................................................. 99
Figure 5.7. α-glucosidase activity (%A compared to no inhibitor) for cocoa powder extracts (A)
and soluble digesta fractions (B) with Acarbose positive control (extracts only). IC50 values are
representative of cocoa powder extract inhibitory activity (C) with R2 values for each treatment
as follows: 0.9625 (UF/UR), 0.9539 (UF/CR), 0.9593 (UF/HR), 0.9511 (CF/UR), 0.9543
(CF/CR), 0.9702 (HF/UR), 0.9777 (HF/HR), 0.9476 (Acarbose (A)). Specific cocoa powder
extract concentrations (62.5-500 µg/mL) at %A above and below IC50 value (D-G). Note that
IC50 values do not have error bars, as values were interpolated from inhibition curves. All values
are presented as the mean ± SEM. Significance between treatments was determined by one-way
ANOVA and Tukey’s HSD post-hoc test (p<0.05). Treatments with different letters are
significantly different within values. .......................................................................................... 101
Figure 5.8. Correlations between cocoa powder extract composition and enzyme IC50 values.
Note the x-axis for mDP (All) and mDP (O+P) has a minimum value of 1 mDP because there
cannot be a mDP value of zero. Note that late MRP are presented as absolute absorbance.
Individual points represent mean composition values and calculated IC50 values for each
treatment. Lines represent the least-squares regression line for each plot. Note that composition
values are for the cocoa extract, not powders, since the extract was evaluated for enzyme
activity......................................................................................................................................... 103
Figure A1. Progression of one cool fermentation batch from 0 h-168 h, followed by bean oven
drying. Fermentation started at 25°C and concluded at 46°C, increasing 3.5°C/24 h………….122
Figure A2. Levels of individual procyanidin compounds in cocoa beans, as quantified by HILIC
UPLC-MS/MS. Raw bean indicates the extract prepared from the cocoa beans as received from
the supplier and is different from UF/UR (-/-) as these beans were rehydrated and dried. All
values are presented as the mean ±SEM. Significance between treatments was determined by
one-way ANOVA and Tukey’s HSD post-hoc test (p<0.05). Treatments with different letters are
significantly different within values……………………………………………………………123
xi
Figure A3. Levels of individual procyanidin compounds in cocoa powders, as quantified by
HILIC UPLC-MS/MS. All values are presented as the mean ±SEM. Significance between
treatments was determined by one-way ANOVA and Tukey’s HSD post-hoc test (p<0.05).
Treatments with different letters are significantly different within values……………………..124
Figure A4. Analysis of LMW and HMW CPE fractions and the starting 40 mg/mL CPE for
early, intermediate, and late MRP. Early MRP were quantified at 0.15625 mg/mL at 280 nm,
intermediate MRP were quantified at 2.5 mg/mL at 360 nm, and late MRP were quantified at 5
mg/mL (<8-10 kDa), 2.5 mg/mL (>8-10 kDa), and 10 mg/mL (unfractionated CPE) at 420. Note
that absolute absorbance of these compounds is reported, but this absorbance is relative to
concentration. Each bar represents the mean ± SEM. Significance between treatments was
determined by one-way ANOVA and Tukey’s HSD post-hoc test (p<0.05). Treatments with
different letters are significantly different within values……………………………………….125
xii
List of Tables
Table 1.1. Metabolic syndrome risk factors……………………………………………………….1
Table 3.1. MS/MS settings for MRM detection of monomer-decamer………………………….36
Table 3.2. Calibration curve slope and intercept, coefficient of determination (R2), lower limit of
detection (LLOD), and lower limit of quantification (LLOQ). Standards were run in triplicate
and values were determined from the mean of those triplicates…………………………………48
Table 3.3. Coefficient of variation (CV) of retention time (RT) and peak areas for intraday and
interday replication of compounds. Nine injections of a 5 mg/mL CE at 5 µL were run each day
for three consecutive days. A fresh aliquot of CE was used each day…………………………...50
Table 4.1. MS settings for individual polyphenol analysis by reverse-phase (RP)-UPLC-MS…63
Table 4.2. Tandem MS/MS settings for multi-reaction monitoring (MRM) detection of
monomeric-decameric flavanols…………………………………………………………………64
Table 5.1. Specifications for cocoa liquors and cakes of each treatment………………………..89
Table 5.2. Total and soluble digesta yields from three-stage in vitro digestion………………..100
Table A1. MS/MS settings for MRM detection of monomer-decamer flavanols……………...121
Table A2. Preliminary melanoidin identification………………………………………………121
xiii
List of Abbreviations
T2D; type 2 diabetes, MS; mass spectrometry, ESI; electrospray ionization, MALDI; matrix-
assisted laser desorption/ionization, LC; liquid chromatography, TOF; time of flight, DC; direct
current; rf; radio-frequency, MS/MS; tandem mass spectrometry, QqQ; triple quadrupole, HPLC;
high performance liquid chromatography, RP; reversed phase, NP; normal phase, FLD;
fluorescence detector, HILIC; hydrophilic interaction liquid chromatography, DP; degree of
polymerization, TNF-α; tumor necrosis factor-alpha, IL-6; interleukin-6, HOMA-IR;
homeostasis model assessment of insulin resistance, QUICKI; quantitative insulin sensitivity
check index, MR; Maillard reaction, UPLC; ultra performance liquid chromatography, C;
catechin, E; epicatechin, PCB2; procyanidin B2, PCC1; procyanidin C1, CinA2; cinnamtannin
A2, CE; cocoa extract, MRM; multi-reaction monitoring, EGCG; epigallocatechin-3-gallate,
EGC; epigallocatechin, LLOD; lower limit of detection, LLOQ; lower limit of quantification,
CV; coefficient of variation, RT; retention time, LAB; lactic acid bacteria, AAB; acetic acid
bacteria, MRS; de Man-Rogosa-Sharpe agar, FI; fermentation index, DMAC; 4-
dimethylaminocinnamaldehyde, DO; dissolved oxygen, GAE; gallic acid equivalent, MRP;
Maillard reaction products, CF; cool fermentation, HF; hot fermentation, UF; unfermented, CR;
cool roast, HR; hot roast, UR; unroasted, CBE; cocoa bean extract, CPE; cocoa powder extract,
HMW; high molecular weight, LMW; low molecular weight
xiv
Attributions
Several colleagues contributed to Chapters 3-5 of this thesis. A brief explanation of their
contributions is listed below.
Chapter 3: Development of a Rapid HILIC UPLC-MS/MS Method for Procyanidins with
Enhanced Ionization Efficiency
Andrew H. Lee, PhD, a formal doctoral student in the Department of Food Science and
Technology at Virginia Tech assisted with the sample preparation and data collection of
individual procyanidins.
Amanda C. Stewart, PhD, a current faculty member in the Department of Food Science and
Technology at Virginia Tech assisted in the design of the method and compilation of the
manuscript.
Kenneth W. Blakeslee, PhD, an employee at Waters Corporation, provided the authentic
standards used in the method and assisted with the completion of the manuscript.
Andrew P. Neilson, PhD, a current faculty member at the Plants for Human Health Institute in
the Department of Food, Bioprocessing, and Nutrition Sciences at North Carolina State
University assisted with the study design, data collection, compilation, and completion of the
manuscript.
Chapter 4: Development and Characterization of a Pilot-Scale Model Cocoa Fermentation
System Suitable for Studying the Impact of Fermentation and Putative Bioactive Compounds and
Bioactivity of Cocoa
Andrew H. Lee, PhD, a formal doctoral student in the Department of Food Science and
Technology at Virginia Tech assisted with the model fermentation system, sample preparation,
data collection, and data interpretation of fermentation products and metabolites.
Brian D. Wiersema, MS, the pilot plant manager in the Department of Food Science and
Technology at Virginia Tech assisted with the model fermentation system preparation and
equipment needed to complete the study.
Haibo Huang, PhD, a current faculty member in the Department of Food Science and
Technology at Virginia Tech assisted with the data collection and interpretation of the
fermentation metabolites via HPLC.
Joshua D. Lambert, PhD, a current faculty member in the Department of Food Science at
Pennsylvania State University contributed to the study design, compilation, and completion of
the manuscript.
xv
Amanda C. Stewart, PhD, a current faculty member in the Department of Food Science at
Virginia Tech contributed to the study design, fermentation model system, compilation, and
completion of the manuscript.
Andrew P. Neilson, PhD, a current faculty member at the Plants for Human Health Institute in
the Department of Food, Bioprocessing, and Nutrition Sciences at North Carolina State
University contributed to the study design, compilation, and completion of the manuscript.
Chapter 5: Controlled Fermentation and Roasting of Cocoa Beans Suggests that Flavanol
Degree of Polymerization is the Key Parameter Dictating the α-glucosidase Inhibitory Activity
of Cocoa
Brian D. Wiersema, MS, the pilot plant manager in the Department of Food Science and
Technology at Virginia Tech assisted with the model fermentation system, processing of cocoa
beans, and supplied necessary equipment needed.
Laura E. Griffin, PhD, a post-doctoral scholar at the Plants for Human Health Institute of North
Carolina State University assisted with sample preparation and conduction of thiolysis and
digestive enzyme assays.
Lauren A. Essenmacher, a current graduate student in the Department of Food Science and
Technology at Virginia Tech assisted with the extraction of cocoa powder and cocoa beans.
Amy N. Moore, a current graduate student in the Department of Food Science and Technology at
Virginia Tech assisted with the preparation of simulated pulp media and conduction of
fermentation model systems.
Andrew H. Lee, PhD, a former doctoral student in the Department of Food Science and
Technology at Virginia Tech assisted with the design of the model fermentation system.
Joshua D. Lambert, PhD, a current faculty member in the Department of Food Science at
Pennsylvania State University contributed to the study design, compilation, and completion of
the manuscript.
Amanda C. Stewart, PhD, a current faculty member in the Department of Food Science and
Technology at Virginia Tech contributed to the study design and completion of the manuscript.
Andrew P. Neilson, PhD, a current faculty member at the Plants for Human Health Institute in
the Department of Food, Bioprocessing, and Nutrition Sciences at North Carolina State
University contributed to the study design, data interpretation, compilation and completion of the
manuscript.
1
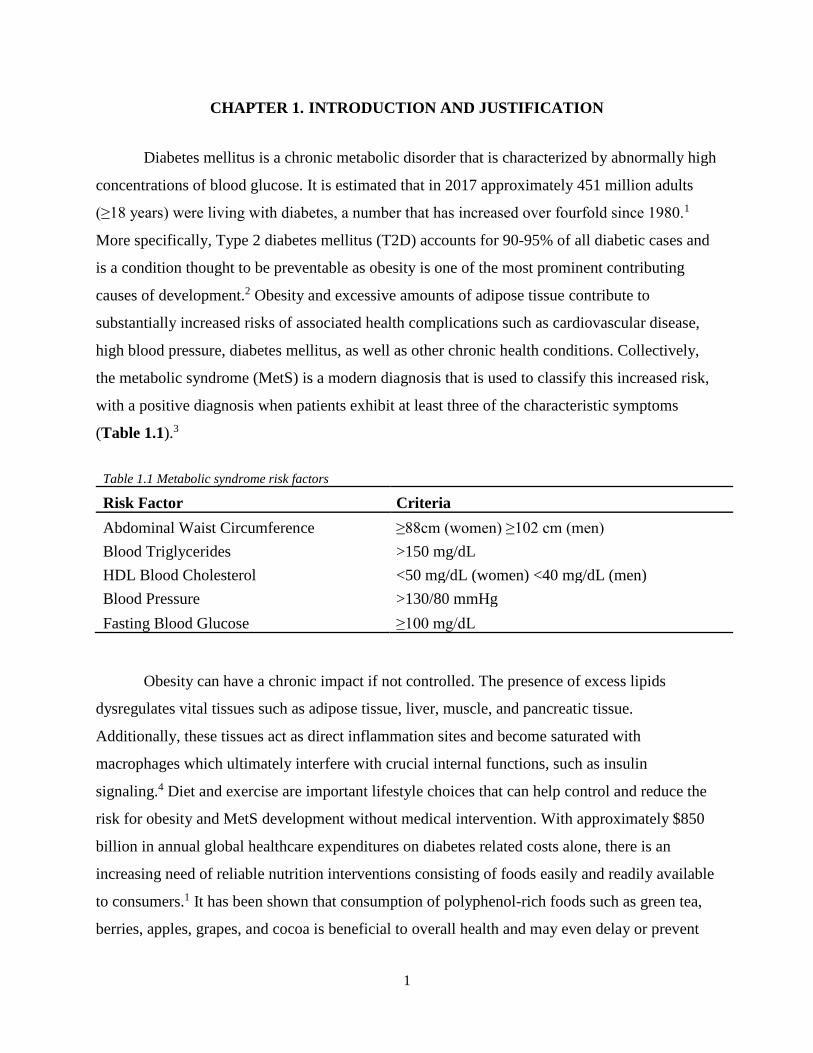
CHAPTER 1. INTRODUCTION AND JUSTIFICATION
Diabetes mellitus is a chronic metabolic disorder that is characterized by abnormally high
concentrations of blood glucose. It is estimated that in 2017 approximately 451 million adults
(≥18 years) were living with diabetes, a number that has increased over fourfold since 1980.1
More specifically, Type 2 diabetes mellitus (T2D) accounts for 90-95% of all diabetic cases and
is a condition thought to be preventable as obesity is one of the most prominent contributing
causes of development.2 Obesity and excessive amounts of adipose tissue contribute to
substantially increased risks of associated health complications such as cardiovascular disease,
high blood pressure, diabetes mellitus, as well as other chronic health conditions. Collectively,
the metabolic syndrome (MetS) is a modern diagnosis that is used to classify this increased risk,
with a positive diagnosis when patients exhibit at least three of the characteristic symptoms
(Table 1.1).3
Table 1.1 Metabolic syndrome risk factors
Risk Factor Criteria
Abdominal Waist Circumference ≥88cm (women) ≥102 cm (men)
Blood Triglycerides >150 mg/dL
HDL Blood Cholesterol <50 mg/dL (women) <40 mg/dL (men)
Blood Pressure >130/80 mmHg
Fasting Blood Glucose ≥100 mg/dL
Obesity can have a chronic impact if not controlled. The presence of excess lipids
dysregulates vital tissues such as adipose tissue, liver, muscle, and pancreatic tissue.
Additionally, these tissues act as direct inflammation sites and become saturated with
macrophages which ultimately interfere with crucial internal functions, such as insulin
signaling.4 Diet and exercise are important lifestyle choices that can help control and reduce the
risk for obesity and MetS development without medical intervention. With approximately $850
billion in annual global healthcare expenditures on diabetes related costs alone, there is an
increasing need of reliable nutrition interventions consisting of foods easily and readily available
to consumers.1 It has been shown that consumption of polyphenol-rich foods such as green tea,
berries, apples, grapes, and cocoa is beneficial to overall health and may even delay or prevent
2
the onset of obesity and MetS, as well as associated chronic conditions.5–8 Furthermore, digestive
enzymes like α-glucosidase play a key role in the breakdown of carbohydrates. α-glucosidase is
located on the brush border of the small intestines and influences the rate of post-prandial
hyperglycemia, thus serving as a potential target in the management of T2D.
Per weight, cocoa (Theobroma cacao) is the most concentrated source of dietary
flavanols, a flavonoid subclass, and contains other putative bioactives. Fermentation, drying,
roasting, and other further processing steps (winnowing, grinding, pressing, etc.) are performed
to achieve desirable cocoa flavors and characteristics. Although it is understood that these
processing steps can negatively impact the overall total flavanol composition of cocoa beans, the
impact of processing on cocoa’s health-protective activities, and ultimately bioactivity, is yet to
be elucidated, though it is generally accepted that these losses are likely to reduce the potential
bioactivities and health benefits of cocoa.8–10 Despite this flavanol reduction, it is possible that
the chemical reactions occurring during cocoa processing result in the formation of new
bioactives, which may potentially preserve or enhance the bioactivity of cocoa. Heat-induced
high molecular weight compounds like melanoidins have potential health protective activities,
with melanoidins exerting prebiotic activity and enhancing the antioxidant capacity of cocoa.11,12
Additionally, α-glucosidase inhibition has been associated with flavanols within processed cocoa
(fermented/roasted liquor).8 By targeting enzyme inhibition through dietary interventions such as
cocoa consumption, undesirable side effects and costs associated with available pharmaceuticals
that possess similar activities are mitigated.
The overall objective of this research is to determine how processing impacts the
chemical composition and α-glucosidase inhibitory activity of cocoa, and to identify optimal
processing approaches that maximize the α-glucosidase inhibitory activities of cocoa. The central
hypothesis is that cocoa bean fermentation and roasting parameters can be tailored to specifically
enhance cocoa’s chemical composition and α-glucosidase inhibitory activity. In order to test the
central hypothesis and achieve the overall objective, the following specific aims were proposed:
1. Conduct a model cocoa production under a range of processing parameters (fermentation,
roasting).
2. Characterize potentially bioactive components (including native polyphenols and
melanoidins) in each cocoa powder following processing.
3
3. Determine the impact of cocoa fermentation and roasting on cocoa’s capability to inhibit
α-glucosidase activity.
4. Correlate α-glucosidase inhibitory activity with various compositional factors and
processing conditions to identify processes and predictors that can be used to develop
cocoa with enhanced activity.
References
(1) Cho, N. H.; Shaw, J. E.; Karuranga, S.; Huang, Y.; da Rocha Fernandes, J. D.; Ohlrogge,
A. W.; Malanda, B. IDF Diabetes Atlas: Global Estimates of Diabetes Prevalence for 2017
and Projections for 2045. Diabetes Res. Clin. Pract. 2018, 138, 271–281.
https://doi.org/10.1016/j.diabres.2018.02.023.
(2) Bullard, K. M.; Cowie, C. C.; Lessem, S. E.; Saydah, S. H.; Menke, A.; Geiss, L. S.;
Orchard, T. J.; Rolka, D. B.; Imperatore, G. Prevalence of Diagnosed Diabetes in Adults
by Diabetes Type—United States, 2016. Morb. Mortal. Wkly. Rep. 2018, 67 (12), 359.
(3) Haffner, S.; Taegtmeyer, H. Epidemic Obesity and the Metabolic Syndrome. Circulation
2003, 108 (13), 1541–1545. https://doi.org/10.1161/01.CIR.0000088845.17586.EC.
(4) Esser, N.; Legrand-Poels, S.; Piette, J.; Scheen, A. J.; Paquot, N. Inflammation as a Link
between Obesity, Metabolic Syndrome and Type 2 Diabetes. Diabetes Res. Clin. Pract.
2014, 105 (2), 141–150. https://doi.org/10.1016/j.diabres.2014.04.006.
(5) Gu, Y.; Hurst, W. J.; Stuart, D. A.; Lambert, J. D. Inhibition of Key Digestive Enzymes by
Cocoa Extracts and Procyanidins. J. Agric. Food Chem. 2011, 59 (10), 5305–5311.
https://doi.org/10.1021/jf200180n.
(6) Bitzer, Z. T.; Glisan, S. L.; Dorenkott, M. R.; Goodrich, K. M.; Ye, L.; O’Keefe, S. F.;
Lambert, J. D.; Neilson, A. P. Cocoa Procyanidins with Different Degrees of
Polymerization Possess Distinct Activities in Models of Colonic Inflammation. J. Nutr.
Biochem. 2015, 26 (8), 827–831. https://doi.org/10.1016/j.jnutbio.2015.02.007.
(7) Ou, K.; Gu, L. Absorption and Metabolism of Proanthocyanidins. J. Funct. Foods 2014, 7
(Supplement C), 43–53. https://doi.org/10.1016/j.jff.2013.08.004.
(8) Ryan, C. M.; Khoo, W.; Ye, L.; Lambert, J. D.; O’Keefe, S. F.; Neilson, A. P. Loss of
Native Flavanols during Fermentation and Roasting Does Not Necessarily Reduce
Digestive Enzyme-Inhibiting Bioactivities of Cocoa. J. Agric. Food Chem. 2016, 64 (18),
3616–3625. https://doi.org/10.1021/acs.jafc.6b01725.
(9) Wollgast, J.; Anklam, E. Review on Polyphenols in Theobroma Cacao: Changes in
Composition during the Manufacture of Chocolate and Methodology for Identification and
Quantification. Food Res. Int. 2000, 33 (6), 423–447. https://doi.org/10.1016/S0963-
9969(00)00068-5.
(10) Dorenkott, M. R.; Griffin, L. E.; Goodrich, K. M.; Thompson-Witrick, K. A.; Fundaro, G.;
Ye, L.; Stevens, J. R.; Ali, M.; O’Keefe, S. F.; Hulver, M. W.; et al. Oligomeric Cocoa
Procyanidins Possess Enhanced Bioactivity Compared to Monomeric and Polymeric
Cocoa Procyanidins for Preventing the Development of Obesity, Insulin Resistance, and
Impaired Glucose Tolerance during High-Fat Feeding. J. Agric. Food Chem. 2014, 62
(10), 2216–2227. https://doi.org/10.1021/jf500333y.
4
(11) Wang, H.-Y.; Qian, H.; Yao, W.-R. Melanoidins Produced by the Maillard Reaction:
Structure and Biological Activity. Food Chem. 2011, 128 (3), 573–584.
https://doi.org/10.1016/j.foodchem.2011.03.075.
(12) Mesías, M.; Delgado-Andrade, C. Melanoidins as a Potential Functional Food Ingredient.
Curr. Opin. Food Sci. 2017, 14 (Supplement C), 37–42.
https://doi.org/10.1016/j.cofs.2017.01.007.
(13) Ozturk, G.; Young, G. M. Food Evolution: The Impact of Society and Science on the
Fermentation of Cocoa Beans. Compr. Rev. Food Sci. Food Saf. 2017, 16 (3), 431–455.
https://doi.org/10.1111/1541-4337.12264.
5
CHAPTER 2. REVIEW OF LITERATURE
2.1 Theobroma Cacao
Cocoa beans are the seeds of Theobroma cacao, an evergreen tree endemic to tropical
areas, growing at approximately 20° N and 20° S of the equator. The trees grow best in areas of
high humidity, dense shade, and prolonged rain. Cocoa cultivation is believed to have originated
as early as 1500 BC in Mesoamerica by the ancient Aztec and Mayan populations.1 Historically
regarded to guarantee health and power, beans were most commonly roasted and consumed as a
beverage, mixed with water and chili peppers, and served during religious ceremonies or times of
celebration. It was not until the early 15th century that the modern chocolate industry began to
flourish, exchanging bitterness and astringency for a well-known delicacy. Mexico remained the
predominant cocoa market until the 17th century where the growth of trade expanded cocoa
planting to areas of South American, the Caribbean, as well as across the Pacific to the
Philippines where it is thought to have reached parts of Sri Lanka and India.2 Following the
independence of Brazil in the mid-1800s, cocoa established a presence in Ghana and Nigeria to
begin its cultivation in West Africa.2
The three main varieties of cocoa, Criollo, Forastero, and Trinitario, each have unique
flavor and cultivation characteristics. Criollo beans of Central and South America are
characterized by their pale color and mild flavor. These beans are typically used to produce the
finest chocolate but have a high susceptibility to disease and thus comprise only 5-10% of the
world’s cocoa production.3 Forastero beans are known for their dark purple color and originated
in the Amazonian region. Due to their high disease and pest resistance, as well as their traditional
cocoa flavors, these beans make up about 80% of the world’s cocoa production.3 Trinitario beans
are the hybrid of Criollo and Forastero plants. Their variable flavor and color are highly
dependent upon the regions in which they grow and make up 10-15% of the world’s chocolate
production.3
Cocoa pods contain 30-40 beans encapsulated in a viscous pulp. Within each bean there
are two main parts, the testa and the embryo/cotyledon, and are approximately 55% lipid, 16%
fiber, 10% protein, and 3% ash.4 Cocoa pulp consists of 82-87% water, 10-15% sugar, 2-3%
pentosans, 1-3% citric acid, and 1-1.5% pectin and is essential during fermentation, providing
the substrate for microbial growth.5 The modern processing chain for cocoa beans is a complex
6
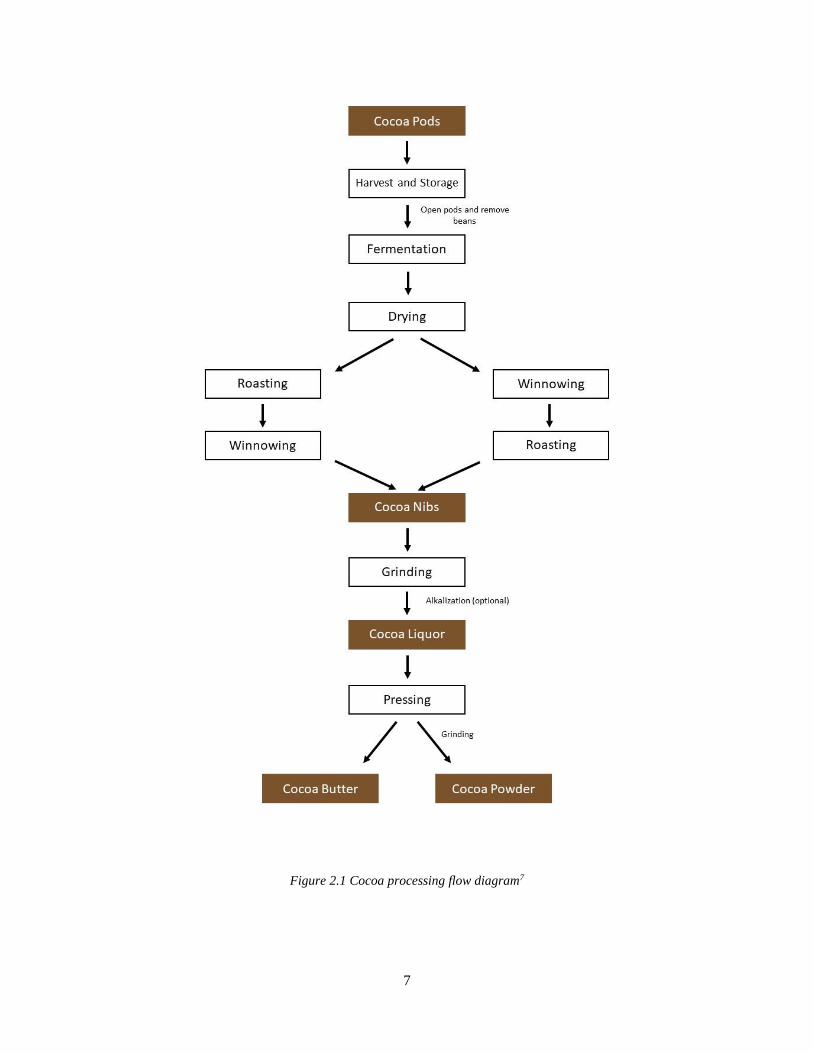
and lacks traceability (Figure 2.1). From farm to processed cocoa powder/butter, beans from
various farmers, areas, and countries are comingled into large batch sizes, with one batch often
containing beans from over 70 different farmers.6 According to the World Cocoa Foundation,
634,000 tons of cocoa is consumed in the United States each year, with 2014 global production
rising to 4.3 million tons.1 Further understanding of bean composition before and after the
fermentation process could potentially enhance dietary attributes of beans without sacrificing
desirable sensory characteristics.
7
Figure 2.1 Cocoa processing flow diagram7
8
2.2 Polyphenols
Polyphenols are plant-based secondary metabolites that are comprised of multiple phenol
structures, the largest classification of phytochemicals.8 These strong antioxidants have gained
significant interest among researchers due to their positive implications on human health with
potential preventative role in chronic diseases, especially those associated with oxidative stress
like cancer, cardiovascular disease, and neurodegenerative diseases, as well as other biological
characteristics that have yet to be elucidated.9,10 Polyphenols are extremely abundant in the
human diet, with over 8,000 structural variations, most commonly present in fruits, coffee, tea,
wine, and cocoa products.8–10
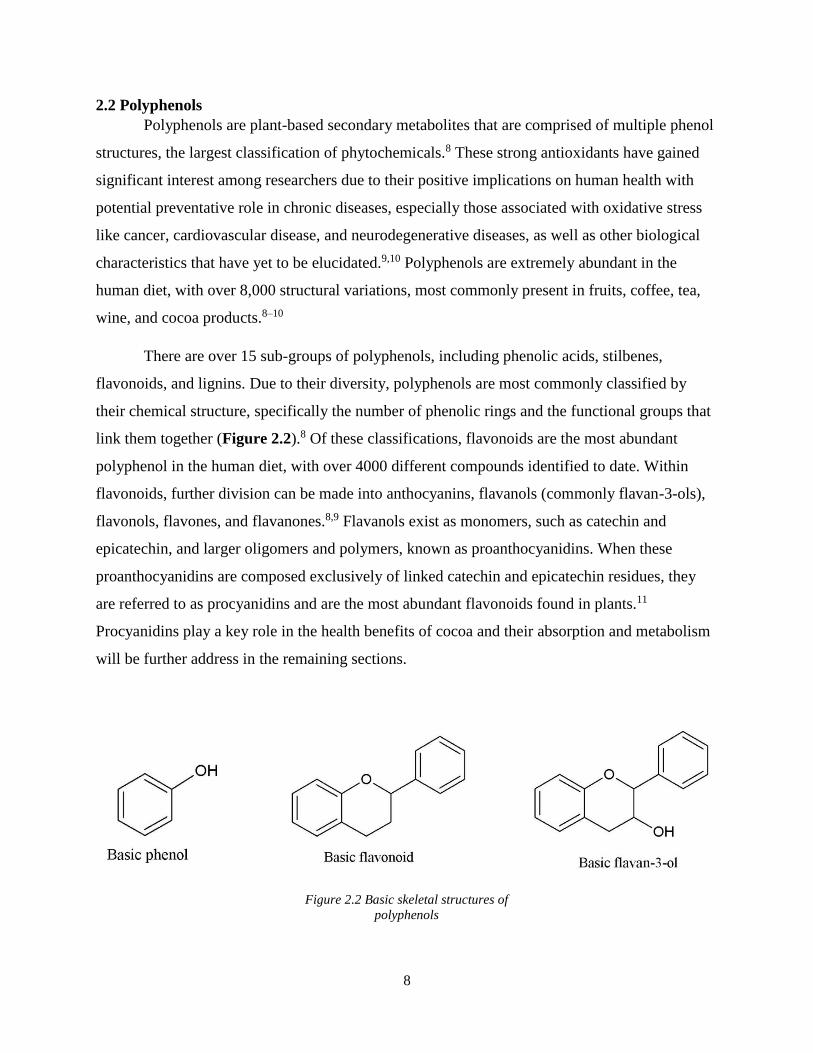
There are over 15 sub-groups of polyphenols, including phenolic acids, stilbenes,
flavonoids, and lignins. Due to their diversity, polyphenols are most commonly classified by
their chemical structure, specifically the number of phenolic rings and the functional groups that
link them together (Figure 2.2).8 Of these classifications, flavonoids are the most abundant
polyphenol in the human diet, with over 4000 different compounds identified to date. Within
flavonoids, further division can be made into anthocyanins, flavanols (commonly flavan-3-ols),
flavonols, flavones, and flavanones.8,9 Flavanols exist as monomers, such as catechin and
epicatechin, and larger oligomers and polymers, known as proanthocyanidins. When these
proanthocyanidins are composed exclusively of linked catechin and epicatechin residues, they
are referred to as procyanidins and are the most abundant flavonoids found in plants.11
Procyanidins play a key role in the health benefits of cocoa and their absorption and metabolism
will be further address in the remaining sections.
Figure 2.2 Basic skeletal structures of
polyphenols
9
2.3 Flavanols and Bioavailability
Procyanidins from nuts, fruits, wine, and cocoa have been shown to possess beneficial
physiological activities like anti-carcinogenic, cardioprotective, antimicrobial, and neuro-
protective.12 The mechanisms of these activities have attracted attention in recent investigations
as the majority of ingested flavanols are not absorbed by the small intestine. Degree of
polymerization (DP) has a major influence on the absorption and bioavailability of flavanols.12–14
Additionally, the composition of the food matrix in which these compounds are present can
impact their absorption and pharmacokinetics. Macronutrients and physical state (solid vs.
liquid) can also influence flavanol absorption and bioavailability.14
Flavanol absorption occurs in four major steps. First, immediately after ingestion,
compounds must be released from their food or beverage matrix before being solubilized in the
gut lumen. These stable solubilized compounds are then transported by the intestinal epithelial
cells where they are diffused across the unstirred water layer, absorbed, and metabolized.14 To be
absorbed, these compounds must endure a variety of gastrointestinal conditions and extreme pH
changes. Despite these physiological obstacles, monomeric and oligomeric flavanols appear to
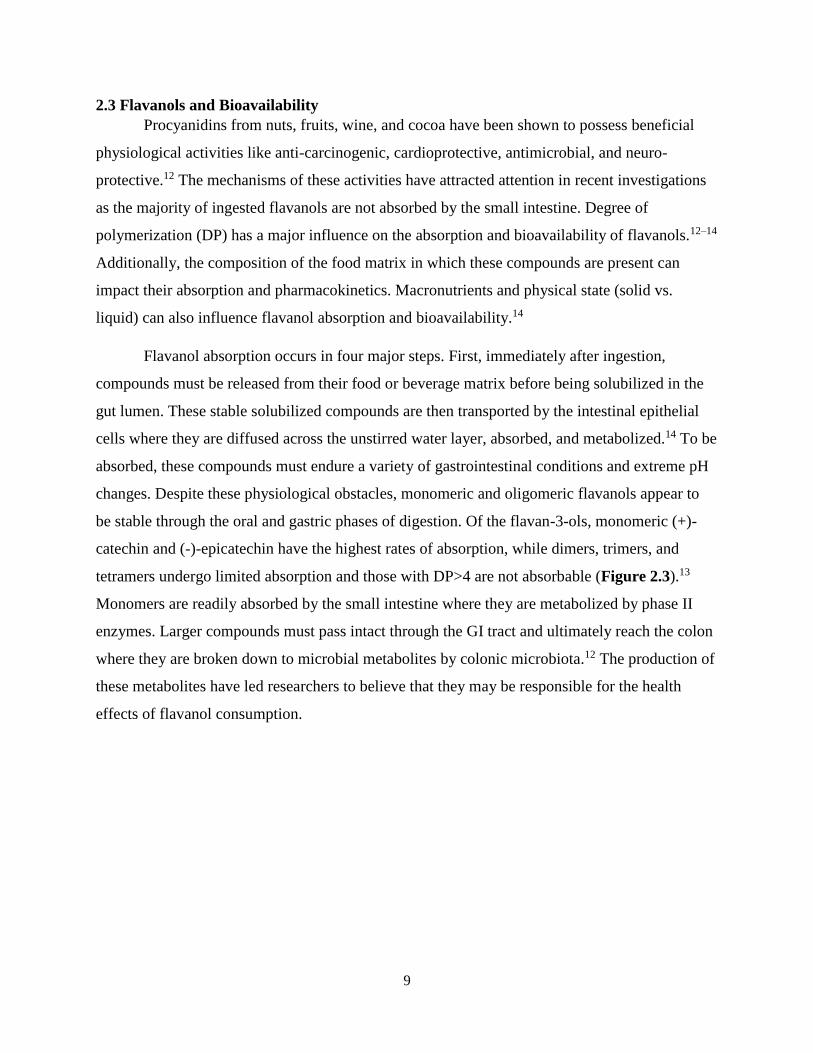
be stable through the oral and gastric phases of digestion. Of the flavan-3-ols, monomeric (+)-
catechin and (-)-epicatechin have the highest rates of absorption, while dimers, trimers, and
tetramers undergo limited absorption and those with DP>4 are not absorbable (Figure 2.3).13
Monomers are readily absorbed by the small intestine where they are metabolized by phase II
enzymes. Larger compounds must pass intact through the GI tract and ultimately reach the colon
where they are broken down to microbial metabolites by colonic microbiota.12 The production of
these metabolites have led researchers to believe that they may be responsible for the health
effects of flavanol consumption.
10
As previously mentioned, the majority of ingested procyanidins are not absorbed in the
small intestine, but arrive at the colon in their native form where they are then extensively
degraded into microbial metabolites.14 In the colon, procyanidin dimer B2 was degraded 2X
Figure 2.3 Select monomeric and oligomeric procyanidins
11
faster than monomeric (-)-epicatechin, supporting the notion that the bioavailability of
procyanidins decrease as molecular weight (and therefore DP) increases.13 With expanding
research on the gut microbiota and bacterial populations, it has been hypothesized that absorption
may not be a prerequisite to bioactivity and is thus not necessarily a determinant of the health
protective activities of flavanols against many chronic conditions.
As mentioned in Chapter 1, metabolic syndrome diagnosis involves many metabolic
abnormalities (Table 1.1). Chronic low-grade inflammation is often associated with the
development and consequences of these abnormalities, originating as dysfunctional visceral
adipose tissue. The overconsumption of macronutrients often leads to the growing size of
adipocytes and increased recruitment of macrophages, ultimately triggering the secretion of free
fatty acids and pro-inflammatory cytokines such as tumor necrosis factor-alpha (TNF-α) and
interleukin-6 (IL-6).15,16 In an in vitro study performed with cocoa procyanidins of differing
degrees of polymerization, polymeric fractions exhibited the highest inhibitory effect of pro-
inflammatory cytokine release (TNF-α) when stimulating macrophages compared to oligomeric
fractions.17 Animal studies have demonstrated similar results, that in a high fat diet long-term
cocoa supplementation alleviates adipose tissue inflammation. High fat fed mice had
significantly increased levels of pro-inflammatory cytokines compared to low fat lean mice, and
when supplemented with cocoa, mice exhibited a 40-60% decrease in adipose tissue DNA levels
of pro-inflammatory cytokines, a 40% decrease in plasma endotoxin levels, improved gut barrier
function, and decreased plasma levels of IL-6 with increased adiponectin levels when compared
to high fat fed mice.16,18 Furthermore, long term supplementation of dietary cocoa also reduced
the presence of pro-inflammatory genes in white adipose tissue.18
Additionally, suppression of low-grade inflammation through consumption of dietary
cocoa flavanols can also protect against insulin resistance. In parallel with decreased levels of
many pro-inflammatory cytokines in animal models with cocoa supplemented high fat diets, this
18 w supplementation was also effective at reducing fasting plasma insulin levels by 14.8%,
reducing fasting plasma triglycerides, and also reducing fasting plasma free fatty acid levels
when compared to high fat fed animals.16 In a shorter feeding model, cocoa extract
supplementation was dose-dependently effective at significantly lowering serum glucose levels
and total cholesterol levels in diabetic rats.19 At all dietary doses, cocoa extract was effective at
12
decreasing total triglyceride levels. In vitro studies have also examined the impact that cocoa
flavanols have on glucose tolerance and insulin sensitivity. Specifically, epicatechin and a total
cocoa powder extract were used on glucose treated human HepG2 cells and findings suggest that
the supplementation of these compounds improve insulin sensitivity.20 Finally, a human clinical
trial examined the implications of dark vs. white chocolate supplementation on healthy subjects
for 15 d. Although this study did not look at the mechanisms underlying their reported results,
there was significantly lower homeostasis model assessment of insulin resistance (HOMA-IR)
values and significantly higher quantitative insulin sensitivity check index (QUICKI) values after
supplementation with dark vs. white chocolate.21 In addition to improved insulin sensitivity, dark
chocolate supplementation was also effective at reducing blood pressure.
Although it is clear that cocoa flavanols have the potential to reduce the risk for chronic
inflammation and metabolic syndrome diagnosis, the mechanisms underlying these beneficial
implications remain uncertain. The association between cocoa processing, mDP, and subsequent
health benefits is an area where more research is needed to fully understand the link between
dietary cocoa flavanols and bioactivity.
2.4 Cocoa Processing and Impact on Flavanol Composition
The polyphenolic content of cocoa is highly dependent on fermentation and subsequent
processing steps, as various biochemical reactions and high roasting temperatures degrade native
polyphenols to limit astringent flavors in final cocoa products.22–25 By better understanding the
polyphenolic changes that are taking place within the bean during cocoa processing, the health
protective activities and bioactive potential of dietary cocoa can be better characterized.
Complete cocoa processing steps are shown in Figure 2.1.
Fermentation is the chemical breakdown of a substrate involving microorganisms such as
bacteria and yeasts. Historically, fermentation was regarded as an easy and inexpensive method
of removing the viscous pulp from beans to facilitate drying, but only in the last century has the
relationship between these processing conditions and cocoa flavor development been established.
Desirable flavor and aroma precursors are generated through a series of biochemical
transformations during cocoa fermentation. On farm there is a great amount of variability
between fermentations as the environment, climate, ambient microorganisms, as well as tools
13
and surfaces used can influence the native microbial composition of a fermentation, and the
fermentation conditions (e.g. temperature, dissolved oxygen, substrate availability).
Cocoa fermentation traditionally occurs in 25-2000 kg batches over 5-7 days in large
heaps on the ground or in wooden boxes covered with banana leaves.5 During the initial hours of
fermentation, low pH creates a suitable environment for anaerobic yeast proliferation. Yeasts use
the high sugar content of pulp (sucrose, glucose, fructose) as fuel to facilitate the production of
alcohols and to metabolize citric acid. This results in a rise in pH and oxygen levels, favoring
lactic acid bacteria. At this stage, pulp begins to lose viscosity and drain off, introducing oxygen
into the heap and raising the temperature to 45-50°C, creating the optimal environment for the
oxidation of ethanol into acetic acid, and dominating the remainder of the fermentation.26–28
Towards the final hours of fermentation, heat and acids penetrate through the bean testa,
stimulating enzymatic reactions as cellular components freely mix within the seed.2 Ultimately,
this results in bean death where endogenous chemical reactions allow for the development of
flavor, aromatic, and color precursors.29 As oxygen infiltrates the dead seed, polyphenol oxidase
reactions utilize monomeric flavanols, like (-)-epicatechin, to initiate the browning of the
cotyledon, a visual representation that fermentation is complete.
Drying is considered the second phase of fermentation, as enzymatic and non-enzymatic
reactions continue with sufficient moisture. On farm, drying takes place in the sun over the span
of one to four weeks with regular rotation until the moisture falls below 8%.30 In the case of
artificial drying, extreme care must be exercised in that the bean temperature does not exceed
60°C, as at these high temperatures enzymatic reactions can be deactivated and cause harsh off
flavors, lowering the quality of the beans. After fermentation is complete, the dead seed loses
membrane integrity which allows for increased aeration into the cotyledon. The presence of
oxygen then drives polyphenol oxidation reactions, ultimately resulting in brown color formation
and volatile aroma precursors.31 Although they involve relatively minor chemical constituents,
these reactions are crucial to the avoidance of off-flavors and spoilage organisms. When done
slowly and under appropriate conditions, drying will produce desirable sensory characteristics at
safe moisture levels that will limit the risk of spoilage during subsequent transport and further
processing of cocoa.
14
Before fermentation, polyphenol content of cocoa beans in made up of approximately
58% procyanidins.32 Fermentation can cause anywhere from 0-80% loss of native polyphenols,
likely influenced by a variety of factors including pod storage and pre-harvest conditions, the
diffusion of soluble polyphenols into the fermentation ‘sweating’ (pulp draining), the enzymatic
oxidation and non-enzymatic oxidation occurring during drying, and even the season and
weather conditions during the fermentation time frame.33–35 These losses are ultimately
responsible for the reduction in bitterness and astringency following fermentation. Bitterness and
stringency are characteristics associated with raw unfermented beans. The most significant losses
occur in the first 48-72 h of fermentation, as polyphenols diffuse out of the bean cotyledon and
bean death is initiated during this time.36 Bean variety is an important factor to consider when
accounting for total polyphenol losses. Criollo beans contain few or no anthocyanins and are
known to have about 2/3 the total polyphenol content of Forastero beans, yet other studies have
reported consistent total polyphenol quantities among Criollo, Forastero, Trinitario, and other
hybrid bean species.37,38 However, Criollo beans have demonstrated a much faster polyphenol
degradation than other varieties. This early and rapid loss of polyphenols could possibly lead to
misinterpretation of distinct cultivar identification, and contribute to the wide range of reported
Criollo bean polyphenol content.38 Regardless, this extreme degradation of native polyphenols
has often been assumed to result in a subsequent reduction in bioactivity. This widely accepted
paradigm has come under scrutiny as more recent investigations have suggested that reactions
occurring throughout cocoa processing may produce compounds with novel activities,
potentially preserving or enhancing bioactivity compared to raw unfermented beans.39–41
After beans have been fermented and dried, they undergo a roasting process, essential for
flavor and aroma development. Depending on the desired characteristics of the final product,
beans are often roasted at 120°C-150°C for 5-120 min.5 Polyphenols that are still within the nib,
specifically flavanols, are heat sensitive, and thus roasting will result in further losses. Roasting
has become a processing step of increased research interest, as it is hypothesized that large
procyanidins have increased biological activities and this flavan-3-ol polymerization is time and
temperature dependent.42,43 Roasting, although causing further degradation of native
polyphenols, defines the sensory characteristics of the finished cocoa product. Roasting
introduces the beans to elevated temperatures and increased oxygen flow, readily degrading
and/or binding flavanols to polymer structures like proteins, polysaccharides, and Maillard
15
reaction products (MRP), ultimately leading to the possible formation of insoluble
complexes.25,44 Roasting with increased air humidity and lower temperature has shown to
decrease the intensity of phenolic degradation within roasted beans, but the sensory implications
of this process have yet to be determined.45 Development and potential activities of roasting-
induced high molecular weight compounds, such as melanoidins, will be further discussed in the
next section.
To be further processed, beans are first winnowed, which is simply the removal of husks
to expose the nib. Beans can be winnowed prior to roasting (nib roasting) or roasted whole and
then winnowed. Because the husk contains trace amounts of fermented pulp, it must be removed
to prevent off flavors in the final product. The cocoa nibs are then milled and refined into a
homogenous fluid paste, or cocoa liquor, and then pressed at elevated temperatures and under
high pressure so that the cocoa butter drains off and a solid cocoa cake is left behind. This cake is
finally ground into a fine powder, cocoa powder, and sold for confectionary use.
2.5 Maillard Reaction Products
The Maillard reaction (MR) is arguably the most important reaction that takes place
during roasting. This non-enzymatic chemical reaction takes place within a food matrix and
involves the interaction between carbonyl groups of reducing sugars and amino groups of
peptides, proteins, or amino acids.46 It is the reaction that takes place under high temperatures
and is responsible for the development of flavor, aroma, and color precursors. There are different
steps to the MR, each producing unique compounds. Stage one is the formation of early
compounds, or Amadori products, then intermediate products such as hydroxymethylfurfural are
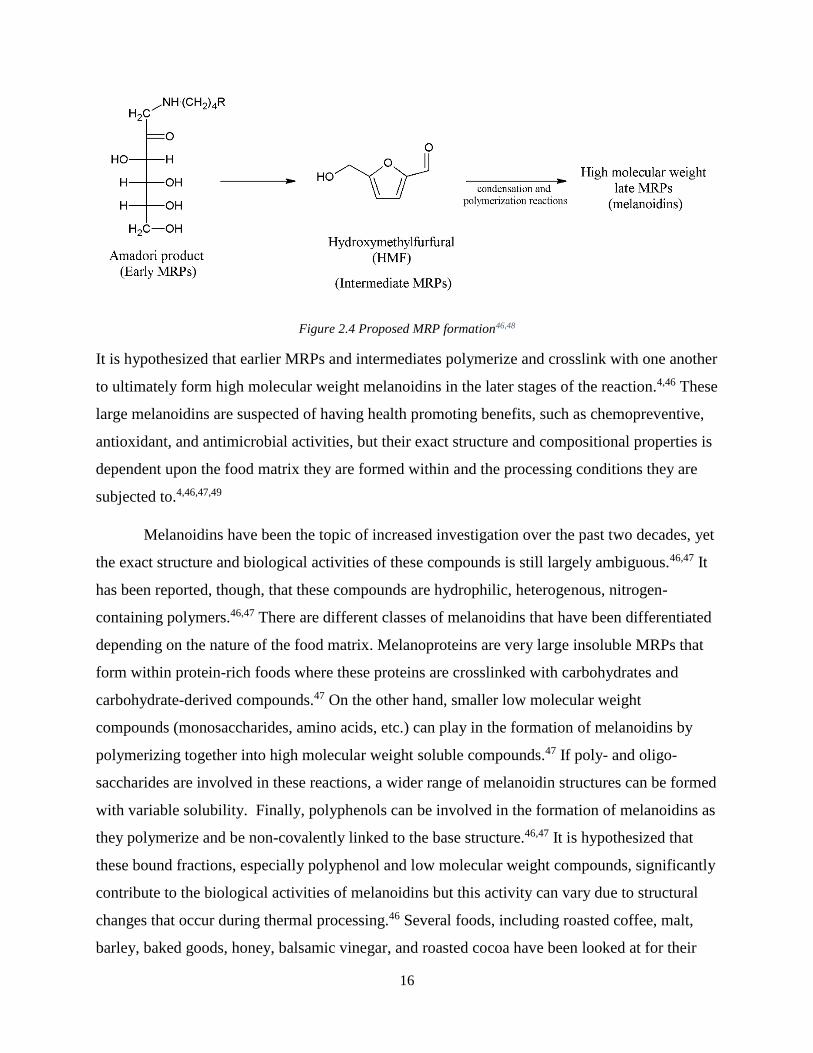
formed, and finally melanoidins, or the final products of the MR, are formed (Figure 2.4).47
16
Figure 2.4 Proposed MRP formation46,48
It is hypothesized that earlier MRPs and intermediates polymerize and crosslink with one another
to ultimately form high molecular weight melanoidins in the later stages of the reaction.4,46 These
large melanoidins are suspected of having health promoting benefits, such as chemopreventive,
antioxidant, and antimicrobial activities, but their exact structure and compositional properties is
dependent upon the food matrix they are formed within and the processing conditions they are
subjected to.4,46,47,49
Melanoidins have been the topic of increased investigation over the past two decades, yet
the exact structure and biological activities of these compounds is still largely ambiguous.46,47 It
has been reported, though, that these compounds are hydrophilic, heterogenous, nitrogen-
containing polymers.46,47 There are different classes of melanoidins that have been differentiated
depending on the nature of the food matrix. Melanoproteins are very large insoluble MRPs that
form within protein-rich foods where these proteins are crosslinked with carbohydrates and
carbohydrate-derived compounds.47 On the other hand, smaller low molecular weight
compounds (monosaccharides, amino acids, etc.) can play in the formation of melanoidins by
polymerizing together into high molecular weight soluble compounds.47 If poly- and oligo-
saccharides are involved in these reactions, a wider range of melanoidin structures can be formed
with variable solubility. Finally, polyphenols can be involved in the formation of melanoidins as
they polymerize and be non-covalently linked to the base structure.46,47 It is hypothesized that
these bound fractions, especially polyphenol and low molecular weight compounds, significantly
contribute to the biological activities of melanoidins but this activity can vary due to structural
changes that occur during thermal processing.46 Several foods, including roasted coffee, malt,
barley, baked goods, honey, balsamic vinegar, and roasted cocoa have been looked at for their
17
melanoidin and MRP contents.47 The quantification and molecular weight determination in
different food matrices, although growing within the literature, is widely under investigated,
primarily due to the analytical challenges these compounds present and the lack of standards and
reference materials available.
The bioavailability of melanoidins is suggested to be very limited but there is increasing
evidence that these compounds possess health protective activities. Absorption of high molecular
weight fractions has been suggested, but only after modification within the small intestine. On
the other hand, approximately 30% of lower molecular weight products, dependent upon
structure and dose, have been reportedly absorbed.50 In an early animal study with a 2% high
molecular weight melanoidin diet, there was limited fecal detection of small compounds,
suggesting that the ingested compounds were broken down by intestinal enzymes and/or
microorganisms, and then absorbed.51 Yet, the indigestible compounds are predicted to have
more beneficial effects, given that they survive the harsh conditions of the gastrointestinal tract.
As they pass through the intestine, they can exert powerful antioxidant and prebiotic effects,
often acting like dietary fiber. 46 Depending on the structure, polysaccharide-rich or protein-rich,
these compounds can be metabolized by Bifidobacteria spp. and enhance the growth of
beneficial bacteria in the upper intestinal tract, or serve as a substrate for harmful bacteria in the
colon.4,47 Regardless, there is a need to optimize food processing techniques to maximize the
production of beneficial melanoidin structures.
Food products like coffee and baked goods have been the subject of more thorough
investigation regarding MRPs, with cocoa compounds growing in interest across researchers.
Unlike these products, though, cocoa beans contain limited reducing sugars and polysaccharides,
but have high concentrations of lipids (50-57%) and proteins (10-15%).4 There are other sources
of reactive carbonyl compounds necessary for the MR and thermally processed foods, such as
cocoa, contain these compounds through lipid oxidation reactions that will ultimately interact
with amino acids and proteins. During cocoa processing, compounds other than MRPs contribute
to the characteristic brown color formation after roasting.52 These compounds include brown
procyanidins that naturally occur or are produced as a result of oxidation reactions throughout
fermentation and roasting. Color intensity is a common method for the quantification of MRPs,
but because of these additional color contributors, color intensity of roasted cocoa is not
18
necessarily the best indication of MRP concentration. There has been some evidence showing
cocoa processing, particularly roasting, increases bioactivity due to the formation of MRPs and
melanoidins. Specifically, separate studies have reported a decrease in phenolic activity and
antioxidant activity at shorter, cooler roasting parameters yet as roasting temperature increases
and time lengthens, the antioxidant activity of cocoa increases, with the MR favored under
higher temperatures.40,49,53 This observed decrease in MRPs after short roasting times could
potentially result from macromolecule (i.e. proteins, polysaccharides, proteins, polyphenols)
structural changes that can be induced by higher temperatures. Additionally epicatechin has been
shown to potentially inhibit the early products of the MR.4 Yet, increases in MRPs after
prolonged high temperature roasting is most likely from the polymerization and condensation
reactions that take place among MR intermediates in the final stages of the MR.4 By roasting for
longer times, further oxidation is occurring between intermediates and therefore forming more
complex products. In addition to composition, factors such as pH, water activity, variety, and
processing techniques can influence the rate of the MR and ultimately the amount of high
molecular weight MRPs within cocoa beans.52 Through increased investigation and
understanding of cocoa melanoidin structural characteristics and biological activities, processing
techniques and parameters can be optimized to maximize the health protective activities of
dietary cocoa.
2.6 Digestive Enzyme Inhibition
In the past century, most industrialized countries have seen an elimination of
undernutrition and various micro and macronutrient deficiencies due to nutrient fortification and
enrichment of foods, increased food supply, and more targeted medical interventions such as
vitamins and nutritional supplements.54,55 Within recent decades, though, macronutrient
overnutrition has emerged and does not show the same trends of decline as undernutrition.
Overnutrition is often a precursor to obesity and the chronic conditions that result from excessive
adipose tissue, like T2D, cardiovascular disease, and some cancers. Due to this public health
concern, prevention and management strategies to reduce macronutrient digestion and absorption
are being explored as possible solutions to mitigate the rising BMI of the global population.
With rising rates of obesity and obesity-related chronic conditions (i.e. T2D), prevention
strategies have started focusing on vehicles that can interfere with the breakdown and absorption
of dietary carbohydrates and lipids. α-glucosidase is a digestive enzyme located on the brush
19
border of the small intestine. Primarily responsible for the catalytic cleavage of oligosaccharides
into simple sugars, α-glucosidase is a key factor determining postprandial blood glucose levels.56
Through the inhibition of this enzyme, carbohydrate digestion is delayed and post-prandial
hyperglycemia is decreased, thus α-glucosidase inhibition by pharmaceutical intervention is
proving to be an effective prevention strategy in the management of T2D. Although there are
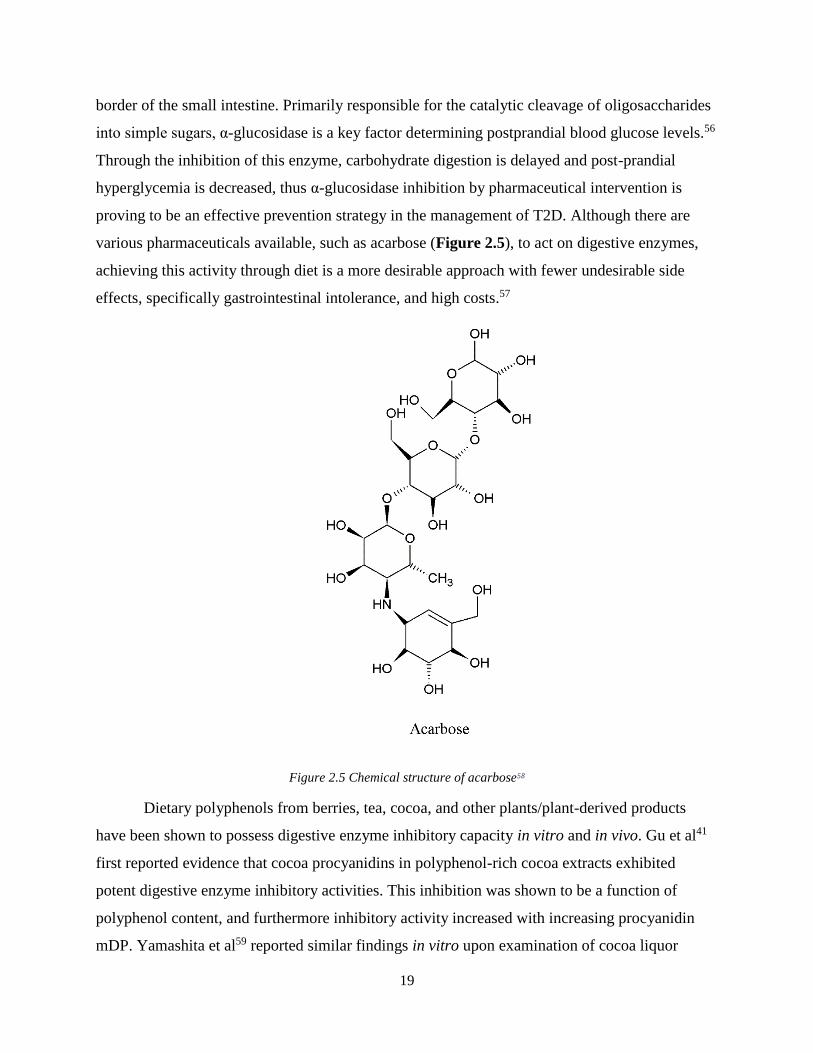
various pharmaceuticals available, such as acarbose (Figure 2.5), to act on digestive enzymes,
achieving this activity through diet is a more desirable approach with fewer undesirable side
effects, specifically gastrointestinal intolerance, and high costs.57
Figure 2.5 Chemical structure of acarbose58
Dietary polyphenols from berries, tea, cocoa, and other plants/plant-derived products
have been shown to possess digestive enzyme inhibitory capacity in vitro and in vivo. Gu et al41
first reported evidence that cocoa procyanidins in polyphenol-rich cocoa extracts exhibited
potent digestive enzyme inhibitory activities. This inhibition was shown to be a function of
polyphenol content, and furthermore inhibitory activity increased with increasing procyanidin
mDP. Yamashita et al59 reported similar findings in vitro upon examination of cocoa liquor
20
extract and α-glucosidase inhibition. Compared to a low DP extract fraction, the high DP fraction
had a stronger α-glucosidase inhibitory effect. A recent animal study examined the impact of a
diet supplemented with low and high grape seed procyanidins and concluded that procyanidins
with high mDP had a greater effect on digestive enzyme inhibition.60 On the other hand, others
have reported that procyanidin content and mDP may not influence cocoa inhibitory activity as
strongly as previously suggested, and that procyanidins with a lower mDP have stronger
inhibitory potential.39,61,62 Although these results are often conflicting and the mechanism behind
procyanidin activity on digestive enzyme inhibition has yet to be elucidated, Ryan et al39 is one
of the only studies to examine the impact of cocoa processing on digestive enzyme inhibition. At
physiologically relevant doses, cocoa extract was shown to effectively inhibit α-glucosidase and
furthermore, that unfermented cocoa liquor (cocoa mass resulting from roasting and grinding of
beans) had a great inhibitory effect on α-glucosidase compared to unfermented and fermented
cocoa beans (unroasted), and ultimately acarbose. These findings are especially novel in that
they suggest that cocoa processing strategies may be used to maximize α-glucosidase inhibition.
Other studies have looked at the implications of roasting time and temperature on enzymatic
inhibition- with longer roasting times increasing the inhibitory activity of pancreatic lipase, the
digestive enzyme that hydrolyzed triglycerides into glycerol and free fatty acids, but few have
examined subsequent cocoa processing steps (fermentation, roasting).42
Additionally, the contribution of MRPs to α-glucosidase inhibition has been under
minimal investigation. As described above, cocoa processing exposes beans to a series of high
temperatures, ultimately initiating the formation of complex high molecular weight compounds,
such as melanoidins. These large heterogenous polymers, as previously discussed, have the
potential to resemble lignin and fiber and when in the gut, can bind proteins and improve enzyme
inhibition imparted by cocoa flavanols.26,39,57 It has been reported that intermediate and high
molecular weight MRPs are more effective at inhibiting α-glucosidase than low molecular
weight compounds (˂10 kDa).57 Cocoa’s ability to inhibit digestive enzymes, and α-glucosidase
specifically, cannot be attributed to one single compound but rather the interactions and activities
between many compounds of various sizes and complexities. In summary, the current state of
research in this area points to the great health-promoting potential of the as-yet largely
unexplored chemical complexity of fermented and/or thermally processed cocoas. These
reported data further support the hypothesis that the remaining native cocoa compounds, when
21
exposed to long duration of high heat, undergo complex reactions that result in large, intricate
bioactive structures.
2.7 Characterization of Polyphenols by Mass Spectrometry
Mass spectrometry (MS) is a technique used to determine the mass of a molecule and can
provide essential information about a selected analyte, such as structure, purity, and
composition.63,64 The term MS in itself is often misleading, as mass is not what is analyzed. MS
bases its analysis on the mass to charge ratio (m/z), or the mass of an ion divided by its charge, of
a positively or negatively charged gas phase ion.63 Simply put, if an ion is singly charged, the m/z
is equivalent to the mass itself, whereas if an ion is doubly charged with a mass of 56, the m/z
ratio would be 28. This analysis is a sequence of basic, but essential, components- the ionization
source, mass analyzer, and detector.
Ionization is the first step in MS, where the analytes of interest are converted into gas
phase ions. These charged particles can then make their way through the remaining components
of analysis. There are many different ionization techniques, and selection will depend on the
nature of the analyte. Early ionization approaches limited analytes to small, thermally stable
compounds, but more recent advances have extended that to a variety of large biomolecules and
thermally labile organic and inorganic compounds.65 The primary ionization techniques used
today include electrospray ionization (ESI) and matrix-assisted laser desorption/ionization
(MALDI). In ESI, a solution is passed through a capillary to produce a continuous stream of ions
at atmospheric pressure.65 This technique often appeals to multi-disciplinary researchers as it
overcomes the problems of analyzing biomacromolecules and is easily paired with liquid
chromatography (LC). MALDI involves ion production via pulsed-laser irradiation from the co-
crystallization of a sample with a solid matrix.65 The main difference between these ionization
techniques is the state in which the sample is introduced to the MS. ESI utilizes a solvated
sample that must be infused into the instrument whereas MALDI samples are introduced in the
solid state. Additionally, MALDI often provides singly charged ions while ESI generates
multiply charged ions. Depending on the intended analysis and coupled mass analyzer, singly
charged ions can provide information regarding multiple ions but if working with a limited m/z
range, multiple charges can facilitate the analysis of higher molecular-weight compounds.63,65
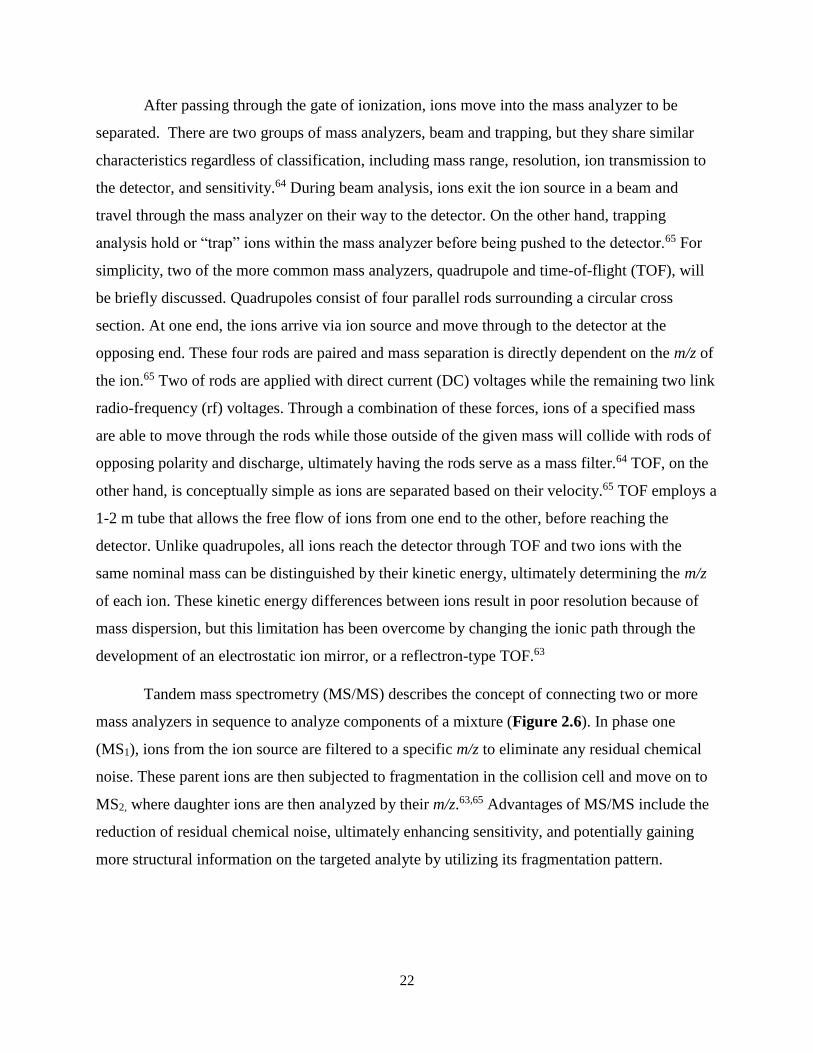
22
After passing through the gate of ionization, ions move into the mass analyzer to be
separated. There are two groups of mass analyzers, beam and trapping, but they share similar
characteristics regardless of classification, including mass range, resolution, ion transmission to
the detector, and sensitivity.64 During beam analysis, ions exit the ion source in a beam and
travel through the mass analyzer on their way to the detector. On the other hand, trapping
analysis hold or “trap” ions within the mass analyzer before being pushed to the detector.65 For
simplicity, two of the more common mass analyzers, quadrupole and time-of-flight (TOF), will
be briefly discussed. Quadrupoles consist of four parallel rods surrounding a circular cross
section. At one end, the ions arrive via ion source and move through to the detector at the
opposing end. These four rods are paired and mass separation is directly dependent on the m/z of
the ion.65 Two of rods are applied with direct current (DC) voltages while the remaining two link
radio-frequency (rf) voltages. Through a combination of these forces, ions of a specified mass
are able to move through the rods while those outside of the given mass will collide with rods of
opposing polarity and discharge, ultimately having the rods serve as a mass filter.64 TOF, on the
other hand, is conceptually simple as ions are separated based on their velocity.65 TOF employs a
1-2 m tube that allows the free flow of ions from one end to the other, before reaching the
detector. Unlike quadrupoles, all ions reach the detector through TOF and two ions with the
same nominal mass can be distinguished by their kinetic energy, ultimately determining the m/z
of each ion. These kinetic energy differences between ions result in poor resolution because of
mass dispersion, but this limitation has been overcome by changing the ionic path through the
development of an electrostatic ion mirror, or a reflectron-type TOF.63
Tandem mass spectrometry (MS/MS) describes the concept of connecting two or more
mass analyzers in sequence to analyze components of a mixture (Figure 2.6). In phase one
(MS1), ions from the ion source are filtered to a specific m/z to eliminate any residual chemical
noise. These parent ions are then subjected to fragmentation in the collision cell and move on to
MS2, where daughter ions are then analyzed by their m/z.63,65 Advantages of MS/MS include the
reduction of residual chemical noise, ultimately enhancing sensitivity, and potentially gaining
more structural information on the targeted analyte by utilizing its fragmentation pattern.
23
Common MS/MS instruments include the triple quadrupole (QqQ) and the hybrid quadrupole
orthogonal time-of-flight, of Q-TOF. 63
For quantification of cocoa procyanidins, reversed-phase (RP) or normal-phase (NP) high
performance liquid chromatography (HPLC) is coupled with ESI-MS. RP is the most common
form of HPLC ESI-MS due to its powerful separation ability, ease of operation, and wide
commercial availability of authentic standards. It operates on the principle that the flow path is
moving in increasing polarity, as the stationary phase is non-polar and the mobile phases are
polar (i.e. water, methanol, acetonitrile). Yet RP-HPLC has its limitations including the limited
retention of hydrophilic, ionic, and polar molecules, including but not limited to, high molecular
weight cocoa procyanidins.66 NP, although similar to RP in that there is a wide commercial
availability of authentic standards and its ease of operation, is the exact opposite of RP with the
flow path moving from more polar to less polar, as the stationary phase is polar and the mobile
phase is non-polar (i.e. hexane, diethyl ether). In NP-HPLC, analyte retention is inversely related
to the mobile phase polarity, with increased analyte retention as polarity decreases therefore
causing more polar analytes to have a higher degree of retention than non-polar analytes.67
Although NP-HPLC can overcome many of the limitations associated with RP, it is difficult to
interface with ESI-MS because of the non-polar solvents required.66
The quantification of high molecular weight procyanidins has proven to be difficult due
to their structural complexity.68 NP-HPLC coupled with fluorescence detectors (FLD) has been
the gold standard in the quantification of complex, high molecular weight cocoa procyanidins
despite long run times and limited sensitivity.68–73 Recent advancements in column technologies
and hydrophobic interaction liquid chromatography (HILIC) applications extend promise in the
Figure 2.6 Scheme of tandem mass spectrometry, where two or more mass analyzers are in sequence to analyze
components of a mixture. Starting at the inlet, analytes are ionized in the ion source and the subject ion then moves
through MS1 for a precursor ion mass selection. The collision cell is the cite of fragmentation before the product ion
is then analyzed in MS2, followed by detection.
24
improved quantification of these large procyanidins while coupling with MS/MS for mass
confirmation and fragmentation lost in HPLC-FLD. HILIC employs aspects of both RP and NP
chromatography, using a polar stationary phase and organic polar solvents, similar to those in
RP, along with the addition of water to serve as a stronger eluting solvent.66 HILIC eluent
gradients increase in polarity- beginning with low-polarity organic solvents and increasing as
compounds begin to elute.67,74 Mobile phase additives or post-column infusion are often utilized
to manipulate the solution pH and increase ion strength.67 Although complex, HILIC runs with
many advantages including up to a 10-fold increase in sensitivity compared to RP, improved on-
column retention, affluent pairing with MS/MS, and higher sample throughput/shorter run
times.67
2.8 Conclusions
Cocoa fermentation is a well investigated phenomenon but the relationship between
fermentation, further processing, and cocoa’s bioactive properties are not well understood.
Although it is widely known that fermentation and roasting significantly decrease the levels of
native polyphenols within cocoa beans, how this degradation impacts (or possibly preserves and
enhances) cocoa bioactivity is still under investigation. Furthermore, the mechanisms driving
these health protective activities are largely unknown and can depend on a variety of factors,
such as bean variety and composition, processing environment and harvest practices, as well as
processing parameters. The purpose of the work in the following chapters was to process raw
unfermented beans in a controlled environment so that a relationship between processing
techniques, chemical composition, and biological activity could be established. To effectively
and efficiently quantify the influential procyanidins within cocoa beans, a HILIC UPLC-MS/MS
method was developed. Cocoa beans were then fermented and dried on a large pilot-scale in a
fermentation model system to effectively determine the fermentation kinetics and success of our
model system. Finally, using this fermentation model system, cocoa beans of seven different
treatments were fermented, roasted, and further processed into powder to assess the α-
glucosidase inhibitory activity of cocoas produced under different processing parameters.
25
References
(1) Ozturk, G.; Young, G. M. Food Evolution: The Impact of Society and Science on the
Fermentation of Cocoa Beans. Compr. Rev. Food Sci. Food Saf. 2017, 16 (3), 431–455.
https://doi.org/10.1111/1541-4337.12264.
(2) Wood, G. A. R.; Lass, R. Cocoa; John Wiley & Sons, 2008.
(3) Quiroz-Reyes, C. N.; Fogliano, V. Design Cocoa Processing towards Healthy Cocoa
Products: The Role of Phenolics and Melanoidins. J. Funct. Foods 2018, 45, 480–490.
https://doi.org/10.1016/j.jff.2018.04.031.
(4) Oracz, J.; Nebesny, E. Effect of Roasting Parameters on the Physicochemical
Characteristics of High-Molecular-Weight Maillard Reaction Products Isolated from
Cocoa Beans of Different Theobroma Cacao L. Groups. Eur. Food Res. Technol. 2019,
245 (1), 111–128. https://doi.org/10.1007/s00217-018-3144-y.
(5) Schwan, R. F.; Wheals, A. E. The Microbiology of Cocoa Fermentation and Its Role in
Chocolate Quality. Crit. Rev. Food Sci. Nutr. 2004, 44 (4), 205–221.
https://doi.org/10.1080/10408690490464104.
(6) Saltini, R.; Akkerman, R.; Frosch, S. Optimizing Chocolate Production through
Traceability: A Review of the Influence of Farming Practices on Cocoa Bean Quality.
Food Control 2013, 29 (1), 167–187.
(7) Aprotosoaie, A. C.; Luca, S. V.; Miron, A. Flavor Chemistry of Cocoa and Cocoa
Products—an Overview. Compr. Rev. Food Sci. Food Saf. 2016, 15 (1), 73–91.
(8) Han, X.; Shen, T.; Lou, H. Dietary Polyphenols and Their Biological Significance. Int. J.
Mol. Sci. 2007, 8 (9), 950–988. https://doi.org/10.3390/i8090950.
(9) Tsao, R. Chemistry and Biochemistry of Dietary Polyphenols. Nutrients 2010, 2 (12),
1231–1246. https://doi.org/10.3390/nu2121231.
(10) Manach, C.; Scalbert, A.; Morand, C.; Remesy, C.; Jimenez, L. Polyphenols: Food
Sources and Bioavailability. Am. J. Clin. Nutr. 2004, 79 (5), 727–747.
(11) Martinez-Micaelo, N.; González-Abuín, N.; Ardèvol, A.; Pinent, M.; Blay, M. T.
Procyanidins and Inflammation: Molecular Targets and Health Implications. BioFactors
2012, 38 (4), 257–265. https://doi.org/10.1002/biof.1019.
(12) Monagas, M.; Urpi-Sarda, M.; Sánchez-Patán, F.; Llorach, R.; Garrido, I.; Gómez-
Cordovés, C.; Andres-Lacueva, C.; Bartolomé, B. Insights into the Metabolism and
Microbial Biotransformation of Dietary Flavan-3-Ols and the Bioactivity of Their
Metabolites. Food Funct. 2010, 1 (3), 233–253.
(13) Ou, K.; Gu, L. Absorption and Metabolism of Proanthocyanidins. J. Funct. Foods 2014, 7
(Supplement C), 43–53. https://doi.org/10.1016/j.jff.2013.08.004.
(14) Neilson, A. P.; Ferruzzi, M. G. Influence of Formulation and Processing on Absorption
and Metabolism of Flavan-3-Ols from Tea and Cocoa. Annu. Rev. Food Sci. Technol.
2011, 2 (1), 125–151. https://doi.org/10.1146/annurev-food-022510-133725.
(15) Gu, Y.; Lambert, J. D. Modulation of Metabolic Syndrome‐related Inflammation by
Cocoa. Mol. Nutr. Food Res. 2013, 57 (6), 948–961.
(16) Gu, Y.; Yu, S.; Park, J. Y.; Harvatine, K.; Lambert, J. D. Dietary Cocoa Reduces
Metabolic Endotoxemia and Adipose Tissue Inflammation in High-Fat Fed Mice. J. Nutr.
Biochem. 2014, 25 (4), 439–445. https://doi.org/10.1016/j.jnutbio.2013.12.004.
(17) Bitzer, Z. T.; Glisan, S. L.; Dorenkott, M. R.; Goodrich, K. M.; Ye, L.; O’Keefe, S. F.;
Lambert, J. D.; Neilson, A. P. Cocoa Procyanidins with Different Degrees of
26
Polymerization Possess Distinct Activities in Models of Colonic Inflammation. J. Nutr.
Biochem. 2015, 26 (8), 827–831. https://doi.org/10.1016/j.jnutbio.2015.02.007.
(18) Gu, Y.; Yu, S.; Lambert, J. D. Dietary Cocoa Ameliorates Obesity-Related Inflammation
in High Fat-Fed Mice. Eur. J. Nutr. 2014, 53 (1), 149–158.
https://doi.org/10.1007/s00394-013-0510-1.
(19) Ruzaidi, A.; Amin, I.; Nawalyah, A. G.; Hamid, M.; Faizul, H. A. The Effect of Malaysian
Cocoa Extract on Glucose Levels and Lipid Profiles in Diabetic Rats. J. Ethnopharmacol.
2005, 98 (1–2), 55–60.
(20) Cordero-Herrera, I.; Martín, M. A.; Bravo, L.; Goya, L.; Ramos, S. Cocoa Flavonoids
Improve Insulin Signalling and Modulate Glucose Production via AKT and AMPK in
HepG2 Cells. Mol. Nutr. Food Res. 2013, 57 (6), 974–985.
https://doi.org/10.1002/mnfr.201200500.
(21) Grassi, D.; Lippi, C.; Necozione, S.; Desideri, G.; Ferri, C. Short-Term Administration of
Dark Chocolate Is Followed by a Significant Increase in Insulin Sensitivity and a Decrease
in Blood Pressure in Healthy Persons. Am. J. Clin. Nutr. 2005, 81 (3), 611–614.
(22) Kothe, L.; Zimmermann, B. F.; Galensa, R. Temperature Influences Epimerization and
Composition of Flavanol Monomers, Dimers and Trimers during Cocoa Bean Roasting.
Food Chem. 2013, 141 (4), 3656–3663. https://doi.org/10.1016/j.foodchem.2013.06.049.
(23) D’Souza, R. N.; Grimbs, S.; Behrends, B.; Bernaert, H.; Ullrich, M. S.; Kuhnert, N.
Origin-Based Polyphenolic Fingerprinting of Theobroma Cacao in Unfermented and
Fermented Beans. Food Res. Int. 2017, 99, 550–559.
https://doi.org/10.1016/j.foodres.2017.06.007.
(24) Eyamo Evina, V. J.; De Taeye, C.; Niemenak, N.; Youmbi, E.; Collin, S. Influence of
Acetic and Lactic Acids on Cocoa Flavan-3-Ol Degradation through Fermentation-like
Incubations. LWT - Food Sci. Technol. 2016, 68, 514–522.
https://doi.org/10.1016/j.lwt.2015.12.047.
(25) Oracz, J.; Nebesny, E.; Żyżelewicz, D. Changes in the Flavan-3-Ols, Anthocyanins, and
Flavanols Composition of Cocoa Beans of Different Theobroma Cacao L. Groups
Affected by Roasting Conditions. Eur. Food Res. Technol. 2015, 241 (5), 663–681.
https://doi.org/10.1007/s00217-015-2494-y.
(26) Afoakwa, E. O.; Paterson, A.; Fowler, M.; Ryan, A. Flavor Formation and Character in
Cocoa and Chocolate: A Critical Review. Crit. Rev. Food Sci. Nutr. 2008, 48 (9), 840–
857. https://doi.org/10.1080/10408390701719272.
(27) De Vuyst, L.; Weckx, S. The Cocoa Bean Fermentation Process: From Ecosystem
Analysis to Starter Culture Development. J. Appl. Microbiol. 2016, 121 (1), 5–17.
https://doi.org/10.1111/jam.13045.
(28) Schwan, R. F. Cocoa Fermentations Conducted with a Defined Microbial Cocktail
Inoculum. Appl. Environ. Microbiol. 1998, 64 (4), 1477–1483.
(29) Ardhana, M. M.; Fleet, G. H. The Microbial Ecology of Cocoa Bean Fermentations in
Indonesia. Int. J. Food Microbiol. 2003, 86 (1), 87–99. https://doi.org/10.1016/S0168-
1605(03)00081-3.
(30) Wollgast, J.; Anklam, E. Review on Polyphenols in Theobroma Cacao: Changes in
Composition during the Manufacture of Chocolate and Methodology for Identification and
Quantification. Food Res. Int. 2000, 33 (6), 423–447. https://doi.org/10.1016/S0963-
9969(00)00068-5.
27
(31) Camu, N.; De Winter, T.; Addo, S. K.; Takrama, J. S.; Bernaert, H.; De Vuyst, L.
Fermentation of Cocoa Beans: Influence of Microbial Activities and Polyphenol
Concentrations on the Flavour of Chocolate. J. Sci. Food Agric. 2008, 88 (13), 2288–
2297. https://doi.org/10.1002/jsfa.3349.
(32) Andújar, I.; Recio, M. C.; Giner, R. M.; Ríos, J. L. Cocoa Polyphenols and Their Potential
Benefits for Human Health. Oxid. Med. Cell. Longev. 2012, 2012.
(33) Albertini, B.; Schoubben, A.; Guarnaccia, D.; Pinelli, F.; Della Vecchia, M.; Ricci, M.; Di
Renzo, G. C.; Blasi, P. Effect of Fermentation and Drying on Cocoa Polyphenols. J. Agric.
Food Chem. 2015, 63 (45), 9948–9953.
(34) Payne, M. J.; Hurst, W. J.; Miller, K. B.; Rank, C.; Stuart, D. A. Impact of Fermentation,
Drying, Roasting, and Dutch Processing on Epicatechin and Catechin Content of Cacao
Beans and Cocoa Ingredients. J. Agric. Food Chem. 2010, 58 (19), 10518–10527.
https://doi.org/10.1021/jf102391q.
(35) Camu, N.; González, A.; De Winter, T.; Van Schoor, A.; De Bruyne, K.; Vandamme, P.;
Takrama, J. S.; Addo, S. K.; De Vuyst, L. Influence of Turning and Environmental
Contamination on the Dynamics of Populations of Lactic Acid and Acetic Acid Bacteria
Involved in Spontaneous Cocoa Bean Heap Fermentation in Ghana. Appl. Environ.
Microbiol. 2008, 74 (1), 86–98.
(36) Kim, H.; Keeney, P. G. (-)-Epicatechin Content in Fermented and Unfermented Cocoa
Beans. J. Food Sci. 49 (4), 1090–1092. https://doi.org/10.1111/j.1365-
2621.1984.tb10400.x.
(37) Oracz, J.; Zyzelewicz, D.; Nebesny, E. The Content of Polyphenolic Compounds in Cocoa
Beans (Theobroma Cacao L.), Depending on Variety, Growing Region, and Processing
Operations: A Review. Crit. Rev. Food Sci. Nutr. 2015, 55 (9), 1176–1192.
https://doi.org/10.1080/10408398.2012.686934.
(38) Elwers, S.; Zambrano, A.; Rohsius, C.; Lieberei, R. Differences between the Content of
Phenolic Compounds in Criollo, Forastero and Trinitario Cocoa Seed (Theobroma Cacao
L.). Eur. Food Res. Technol. 2009, 229 (6), 937–948. https://doi.org/10.1007/s00217-009-
1132-y.
(39) Ryan, C. M.; Khoo, W.; Ye, L.; Lambert, J. D.; O’Keefe, S. F.; Neilson, A. P. Loss of
Native Flavanols during Fermentation and Roasting Does Not Necessarily Reduce
Digestive Enzyme-Inhibiting Bioactivities of Cocoa. J. Agric. Food Chem. 2016, 64 (18),
3616–3625. https://doi.org/10.1021/acs.jafc.6b01725.
(40) Ioannone, F.; Di Mattia, C. D.; De Gregorio, M.; Sergi, M.; Serafini, M.; Sacchetti, G.
Flavanols, Proanthocyanidins and Antioxidant Activity Changes during Cocoa
(Theobroma Cacao L.) Roasting as Affected by Temperature and Time of Processing.
Food Chem. 2015, 174 (Supplement C), 256–262.
https://doi.org/10.1016/j.foodchem.2014.11.019.
(41) Gu, Y.; Hurst, W. J.; Stuart, D. A.; Lambert, J. D. Inhibition of Key Digestive Enzymes by
Cocoa Extracts and Procyanidins. J. Agric. Food Chem. 2011, 59 (10), 5305–5311.
https://doi.org/10.1021/jf200180n.
(42) Stanley, T. H.; Van Buiten, C. B.; Baker, S. A.; Elias, R. J.; Anantheswaran, R. C.;
Lambert, J. D. Impact of Roasting on the Flavan-3-Ol Composition, Sensory-Related
Chemistry, and in Vitro Pancreatic Lipase Inhibitory Activity of Cocoa Beans. Food
Chem. 2018, 255, 414–420. https://doi.org/10.1016/j.foodchem.2018.02.036.
28
(43) Mojica, B. E.; Fong, L. E.; Biju, D.; Muharram, A.; Davis, I. M.; Vela, K. O.; Rios, D.;
Osorio-Camacena, E.; Kaur, B.; Rojas, S. M.; et al. The Impact of the Roast Levels of
Coffee Extracts on Their Potential Anticancer Activities. J. Food Sci. 2018, 83 (4), 1125–
1130. https://doi.org/10.1111/1750-3841.14102.
(44) Redgwell, R. J.; Trovato, V.; Curti, D. Cocoa Bean Carbohydrates: Roasting-Induced
Changes and Polymer Interactions. Food Chem. 2003, 80 (4), 511–516.
https://doi.org/10.1016/S0308-8146(02)00320-5.
(45) Żyżelewicz, D.; Krysiak, W.; Oracz, J.; Sosnowska, D.; Budryn, G.; Nebesny, E. The
Influence of the Roasting Process Conditions on the Polyphenol Content in Cocoa Beans,
Nibs and Chocolates. Food Res. Int. 2016, 89, 918–929.
(46) Wang, H.-Y.; Qian, H.; Yao, W.-R. Melanoidins Produced by the Maillard Reaction:
Structure and Biological Activity. Food Chem. 2011, 128 (3), 573–584.
https://doi.org/10.1016/j.foodchem.2011.03.075.
(47) Morales, F. J.; Somoza, V.; Fogliano, V. Physiological Relevance of Dietary Melanoidins.
Amino Acids 2012, 42 (4), 1097–1109. https://doi.org/10.1007/s00726-010-0774-1.
(48) Newton, A. E.; Fairbanks, A. J.; Golding, M.; Andrewes, P.; Gerrard, J. A. The Role of
the Maillard Reaction in the Formation of Flavour Compounds in Dairy Products – Not
Only a Deleterious Reaction but Also a Rich Source of Flavour Compounds. Food Funct.
2012, 3 (12), 1231–1241. https://doi.org/10.1039/C2FO30089C.
(49) Oliviero, T.; Capuano, E.; Cämmerer, B.; Fogliano, V. Influence of Roasting on the
Antioxidant Activity and HMF Formation of a Cocoa Bean Model Systems. J. Agric.
Food Chem. 2009, 57 (1), 147–152. https://doi.org/10.1021/jf802250j.
(50) Van Nguyen, C. Toxicity of the AGEs Generated from the Maillard Reaction: On the
Relationship of Food‐AGEs and Biological‐AGEs. Mol. Nutr. Food Res. 2006, 50 (12),
1140–1149.
(51) Finot, P. A.; Magnenat, E. Metabolic Transit of Early and Advanced Maillard Products.
Prog. Food Nutr. Sci. 1981, 5 (1–6), 193–207.
(52) Sacchetti, G.; Ioannone, F.; De Gregorio, M.; Di Mattia, C.; Serafini, M.; Mastrocola, D.
Non Enzymatic Browning during Cocoa Roasting as Affected by Processing Time and
Temperature. J. Food Eng. 2016, 169 (Supplement C), 44–52.
https://doi.org/10.1016/j.jfoodeng.2015.08.018.
(53) Summa, C.; McCourt, J.; Cämmerer, B.; Fiala, A.; Probst, M.; Kun, S.; Anklam, E.;
Wagner, K.-H. Radical Scavenging Activity, Anti-Bacterial and Mutagenic Effects of
Cocoa Bean Maillard Reaction Products with Degree of Roasting. Mol. Nutr. Food Res.
2008, 52 (3), 342–351. https://doi.org/10.1002/mnfr.200700403.
(54) Wells, J. C. Obesity as Malnutrition: The Role of Capitalism in the Obesity Global
Epidemic. Am. J. Hum. Biol. 2012, 24 (3), 261–276.
(55) Tanumihardjo, S. A.; Anderson, C.; Kaufer-Horwitz, M.; Bode, L.; Emenaker, N. J.;
Haqq, A. M.; Satia, J. A.; Silver, H. J.; Stadler, D. D. Poverty, Obesity, and Malnutrition:
An International Perspective Recognizing the Paradox. J. Am. Diet. Assoc. 2007, 107 (11),
1966–1972.
(56) Kumar, S.; Narwal, S.; Kumar, V.; Prakash, O. α-Glucosidase Inhibitors from Plants: A
Natural Approach to Treat Diabetes. Pharmacogn. Rev. 2011, 5 (9), 19.
(57) Bellesia, A.; Tagliazucchi, D. Cocoa Brew Inhibits in Vitro α-Glucosidase Activity: The
Role of Polyphenols and High Molecular Weight Compounds. Food Res. Int. 2014, 63
(Part C), 439–445. https://doi.org/10.1016/j.foodres.2014.03.047.
29
(58) PubChem. Acarbose https://pubchem.ncbi.nlm.nih.gov/compound/41774 (accessed Apr 2,
2019).
(59) Yamashita, Y.; Okabe, M.; Natsume, M.; Ashida, H. Comparison of Anti-Hyperglycemic
Activities between Low-and High-Degree of Polymerization Procyanidin Fractions from
Cacao Liquor Extract. J Food Drug Anal 2012, 20, 283–287.
(60) Zhong, H.; Xue, Y.; Lu, X.; Shao, Q.; Cao, Y.; Wu, Z.; Chen, G. The Effects of Different
Degrees of Procyanidin Polymerization on the Nutrient Absorption and Digestive Enzyme
Activity in Mice. Molecules 2018, 23 (11). https://doi.org/10.3390/molecules23112916.
(61) Kang, B.-H.; Racicot, K.; Pilkenton, S. J.; Apostolidis, E. Evaluation of Theobroma Cacao
(COCOA) Derived Phenolic Phytochemical Fractions on the In Vitro Inhibition of
Carbohydrate Hydrolyzing Enzymes. J. Food Biochem. 2016, 40 (4), 535–541.
(62) Vazquez‐Flores, A. A.; Martinez‐Gonzalez, A. I.; Alvarez‐Parrilla, E.; Díaz‐Sánchez, Á.
G.; de la Rosa, L. A.; González‐Aguilar, G. A.; Aguilar, C. N. Proanthocyanidins with a
Low Degree of Polymerization Are Good Inhibitors of Digestive Enzymes Because of
Their Ability to Form Specific Interactions: A Hypothesis. J. Food Sci. 2018, 83 (12),
2895–2902.
(63) El-Aneed, A.; Cohen, A.; Banoub, J. Mass Spectrometry, Review of the Basics:
Electrospray, MALDI, and Commonly Used Mass Analyzers. Appl. Spectrosc. Rev. 2009,
44 (3), 210–230. https://doi.org/10.1080/05704920902717872.
(64) Hoffmann, E. de. Mass Spectrometry. In Kirk-Othmer Encyclopedia of Chemical
Technology; American Cancer Society, 2005.
https://doi.org/10.1002/0471238961.1301191913151518.a01.pub2.
(65) Glish, G. L.; Vachet, R. W. The Basics of Mass Spectrometry in the Twenty-First
Century. Nat. Rev. Drug Discov. 2003, 2 (2), 140–150. https://doi.org/10.1038/nrd1011.
(66) Nguyen, H. P.; Schug, K. A. The Advantages of ESI‐MS Detection in Conjunction with
HILIC Mode Separations: Fundamentals and Applications. J. Sep. Sci. 2008, 31 (9), 1465–
1480.
(67) Buszewski, B.; Noga, S. Hydrophilic Interaction Liquid Chromatography (HILIC)—a
Powerful Separation Technique. Anal. Bioanal. Chem. 2012, 402 (1), 231–247.
https://doi.org/10.1007/s00216-011-5308-5.
(68) Robbins, R. J.; Leonczak, J.; Li, J.; Johnson, J. C.; Collins, T.; Kwik-Uribe, C.; Schmitz,
H. H. Determination of Flavanol and Procyanidin (by Degree of Polymerization
1–10) Content of Chocolate, Cocoa Liquors, Powder(s), and Cocoa Flavanol
Extracts by Normal Phase High-Performance Liquid Chromatography: Collaborative
Study
http://www.ingentaconnect.com/search/article?option1=tka&value1=Determination+of+fl
avanol+and+procyanidin+.by+degree+of+polymerization+1.10.+content+of+chocolate.+c
ocoa+liquors.+powder.s..+and+cocoa+flavanol+extracts+by+normal+phase+high.perform
ance+liquid+Chromatography.+collaborative+study.&pageSize=10&index=1 (accessed
Jul 31, 2018). https://doi.org/info:doi/10.5740/jaoacint.12-162.
(69) Robbins, R. J.; Leonczak, J.; Johnson, J. C.; Li, J.; Kwik-Uribe, C.; Prior, R. L.; Gu, L.
Method Performance and Multi-Laboratory Assessment of a Normal Phase High Pressure
Liquid Chromatography–Fluorescence Detection Method for the Quantitation of Flavanols
and Procyanidins in Cocoa and Chocolate Containing Samples. J. Chromatogr. A 2009,
1216 (24), 4831–4840.
30
(70) Machonis, P. R.; Jones, M. A.; Kwik-Uribe, C.; Dowell, D. Determination of Flavanols
and Procyanidins (DP 1–10) in Cocoa-Based Ingredients and Products by UHPLC:
First Action 2013.03
http://www.ingentaconnect.com.ezproxy.lib.vt.edu/content/aoac/jaoac/2014/00000097/000
00005/art00020?utm_source=TrendMD&utm_medium=cpc&utm_campaign=J_AOAC_I
nt_TrendMD_0# (accessed Jul 31, 2018). https://doi.org/info:doi/10.5740/jaoacint.14-112.
(71) Adamson, G. E.; Lazarus, S. A.; Mitchell, A. E.; Prior, R. L.; Cao, G.; Jacobs, P. H.;
Kremers, B. G.; Hammerstone, J. F.; Rucker, R. B.; Ritter, K. A.; et al. HPLC Method for
the Quantification of Procyanidins in Cocoa and Chocolate Samples and Correlation to
Total Antioxidant Capacity. J. Agric. Food Chem. 1999, 47 (10), 4184–4188.
https://doi.org/10.1021/jf990317m.
(72) Hollands, W. J.; Voorspoels, S.; Jacobs, G.; Aaby, K.; Meisland, A.; Garcia-Villalba, R.;
Tomas-Barberan, F.; Piskula, M. K.; Mawson, D.; Vovk, I.; et al. Development,
Validation and Evaluation of an Analytical Method for the Determination of Monomeric
and Oligomeric Procyanidins in Apple Extracts. J. Chromatogr. A 2017, 1495, 46–56.
https://doi.org/10.1016/j.chroma.2017.03.030.
(73) Toro-Uribe, S.; López-Giraldo, L. J.; Decker, E. A. Relationship between the
Physiochemical Properties of Cocoa Procyanidins and Their Ability to Inhibit Lipid
Oxidation in Liposomes. J. Agric. Food Chem. 2018, 66 (17), 4490–4502.
(74) Kostiainen, R.; Kauppila, T. J. Effect of Eluent on the Ionization Process in Liquid
Chromatography–Mass Spectrometry. J. Chromatogr. A 2009, 1216 (4), 685–699.
https://doi.org/10.1016/j.chroma.2008.08.095.
31
CHAPTER 3. Development of a Rapid HILIC UPLC-MS/MS Method for Procyanidins
with Enhanced Ionization Efficiency
Kathryn C. Racine, Andrew H. Lee, Amanda C. Stewart, Kenneth W. Blakeslee, Andrew P.
Neilson
Published in Journal of Chromatography A
K.C. Racine, A.H. Lee, A.C. Stewart, K.W. Blakeslee, A.P. Neilson, Development of a rapid
ultra performance hydrophilic interaction liquid chromatography tandem mass spectrometry
method for procyanidins with enhanced ionization efficiency, Journal of Chromatography A.
(2019). doi:https://doi.org/10.1016/j.chroma.2019.02.007.
ABSTRACT
Cocoa flavanols (catechins and procyanidins) can exist in various polymerization states and are
commonly classified by their degree of polymerization (DP). There is increasing evidence that
flavanols of distinct DP possess different biological activities, but separation and quantification of
the higher DP procyanidins is challenging and has thus created the need for new methodologies
that utilize advancements in columns and LC-MS/MS systems. An aqueous normal phase
(hydrophilic interaction liquid chromatography, HILIC), UPLC method with post-column ESI
adjuvant infusion was developed to reduce the total analysis time, increase peak separation, and
increase detection specificity (compared to traditional fluorescence methods) by coupling with
mass spectrometry detection. The total elution time was reduced from 70-90 min (typically used
for normal phase and HILIC HPLC separation of procyanidins) down to 9 min by employing
UPLC. Results indicate that by using a post-column 0.04 M ammonium formate infusion (5
µL/min), ionization of procyanidins was significantly enhanced. Lower limits of detection ranged
from 3.19 × 10⁻²-4.56 pmol-on-column, and lower limits of quantification ranged from 2.79 × 10-
2-1.17 × 10² pmol-on-column across compounds DP 1-9. This method builds upon the foundation
set by existing analytical methods and employs new technologies to dramatically increase sample
throughput and enhance detection limits and specificity, facilitating improved analysis for
procyanidins.
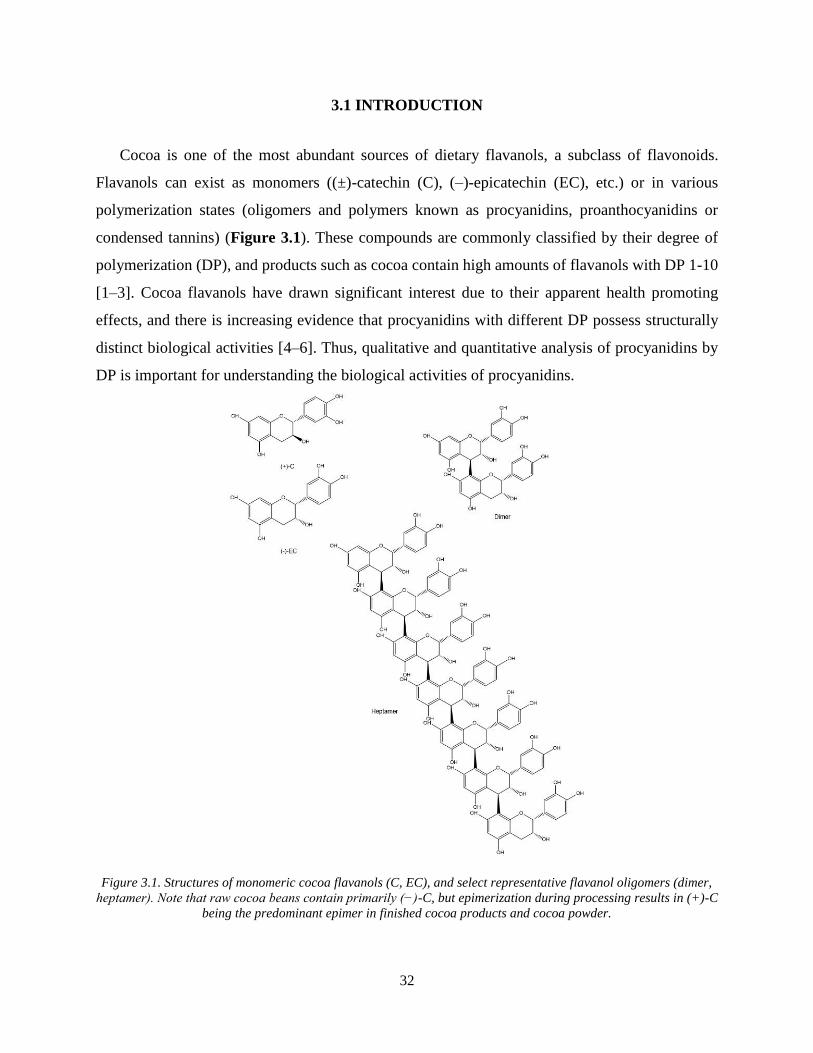
32
3.1 INTRODUCTION
Cocoa is one of the most abundant sources of dietary flavanols, a subclass of flavonoids.
Flavanols can exist as monomers ((±)-catechin (C), (–)-epicatechin (EC), etc.) or in various
polymerization states (oligomers and polymers known as procyanidins, proanthocyanidins or
condensed tannins) (Figure 3.1). These compounds are commonly classified by their degree of
polymerization (DP), and products such as cocoa contain high amounts of flavanols with DP 1-10
[1–3]. Cocoa flavanols have drawn significant interest due to their apparent health promoting
effects, and there is increasing evidence that procyanidins with different DP possess structurally
distinct biological activities [4–6]. Thus, qualitative and quantitative analysis of procyanidins by
DP is important for understanding the biological activities of procyanidins.
Figure 3.1. Structures of monomeric cocoa flavanols (C, EC), and select representative flavanol oligomers (dimer,
heptamer). Note that raw cocoa beans contain primarily (−)-C, but epimerization during processing results in (+)-C
being the predominant epimer in finished cocoa products and cocoa powder.
33
Due to factors such as ease of analysis by and more widespread use of reverse-phase (RP) LC
(which typically cannot resolve the large procyanidins adequately), wide commercial availability
of standards and comparatively high bioavailability, much of the literature focuses on the food
content and biological action of flavanol monomers, C and EC. However, the larger species
(oligomeric and polymeric flavanols) are widely distributed in the diet, and recent evidence
suggests that despite their limited bioavailability, these complex flavanols are effective at
mediating the onset of obesity and insulin resistance as well as protecting against gut inflammation
activity when compared to smaller flavanol fractions [5–7]. Although the relationship between DP
and biological activity remains the subject of investigation, these complex flavanols are the subject
of increasing investigation as potentially potent and novel complementary approaches to chronic
disease prevention. Due to this interest, it is critical to develop analytical methods that can provide
rapid, sensitive and specific detection and quantification of these individual procyanidins in order
to more thoroughly understand their underlying mechanisms of action, plant distribution and
consumption patterns.
Because of the structural complexity these high molecular weight procyanidins possess, their
analysis is challenging [1]. There is generally an inverse relationship between flavanol DP and
detector response (for various detection modalities), and thus limits of detection, limits of
quantification, and analytical sensitivity [8]. Normal-phase (NP) or HILIC HPLC coupled to
fluorescence detection (FLD) typically provide the best resolution of large flavanols, but efficiency
and sensitivity remain the primary challenge of using these methods [1,8–12]. With run times
typically ranging between 70-90 min, these methods are severely limited by low sample
throughput and place high demand on analytical resources. Machonis et al [10] was able to
significantly optimize the robust, widely-used NP method proposed by Robbins et al [9], reducing
the elution time to 15 min as opposed to 86 min. Additionally, Hollands et al [8] adapted the
method proposed by Robbins et al [9] but with a HILIC HPLC application to quantify large
procyanidins extracted from apples. Although this method is able to quantify similar procyanidins,
it has a lengthy 45 min run time. Recently, advances in UPLC column technology and the
improvement of HILIC UPLC columns suggests that the speed of these methods may be optimized
even further. However, despite reduced analysis time and increased throughput, sensitivity of high
DP compounds remains low. This is due to the fact that NP methods typically rely on FLD [9–11].
While FLD is useful for procyanidins, use of FLD does not provide the specificity of definitive
34
mass confirmation and fragmentation achieved by MS/MS. Therefore, coupling the NP or HILIC
resolution power with the specificity of mass spectrometry (MS) is desired. However, NP LC is
poorly compatible with the standard MS ionization source, electrospray ionization (ESI), which
relies on the presence of high concentrations of protic solvents and other ionizable mobile phase
reagents to facilitate charge transfer to analytes, while RP and HILIC LC are better suited for MS
pairing. Though HILIC solvents are much better suited for ESI than NP, the comparatively low
concentrations of water used for HILIC (vs. RP) suggest that ESI ionization efficiency could still
be enhanced through post-column reagent infusion to achieve ionization performance similar to
that of RP conditions, and therefore improving sensitivity and achieving adequate limits of
detection and quantification [13,14]. Recently, the use of post-column ionization reagents has been
proposed for improved ESI performance of flavanols [12].
To continue advancing our understanding of the role of procyanidins in human health, the
quantification of these large procyanidins must be addressed. Long analysis times require extended
instrument use and large quantities of solvents that could otherwise be used for other analyses.
Additionally, long analysis times grouped with lengthy sample sets could lead to sample
degradation. The objective of this study was therefore to develop an optimized methodology that
rapidly and sensitively quantifies individual procyanidins based upon their DP to reduce
instrument time, lower laboratory costs, and increase sample throughput. We sought to achieve
this by pairing recent improvements in HILIC-UPLC with use of post-column ESI adjuvant
infusion.
35
3.2 MATERIALS AND METHODS
3.2.1. Reagents, standards, and samples. LC-MS grade acetonitrile (ACN), methanol (MeOH),
and water were obtained from Thermo Fisher Scientific (Waltham, MA). Glacial acetic acid,
methanol, and acetone were obtained from VWR (Radnor, PA). Ammonium formate and (−)-
epigallocatechin gallate (EGCG) were obtained from Sigma-Aldrich (St. Louis, MO). Standards
of (±)-catechin (C), (–)-epicatechin (EC), and procyanidin B2 (PCB2) were obtained from
ChromaDex (Irvine, CA). Standards of procyanidin C1 (PCC1, DP3), cinnamtannin A2 (CinA2,
DP4), and DP5 – 9 purified from cocoa (purity: DP 3-5: 93-99%, DP6-9: 80-92%) were obtained
from Planta Analytica (New Milford, CT). Raw unfermented cocoa beans were commercially
available, sourced from Ecuador, and received from Natural Zing LLC (Mount Airy, MD).
3.2.2. Sample preparation. Flavanol-rich cocoa extract (CE) was obtained using the method
developed by Dorenkott et al [5], with minor modifications. Cocoa beans were frozen using
liquid nitrogen and then ground in a laboratory blender (Waring Products, Stamford, CT) for 2
min to obtain a powder. To de-fat the cocoa powder, ground powder (40 g) was extracted with
150 mL of hexane and sonicated for 10 min. The mixture was centrifuged at 5000 × g for 5 min
and the supernatant was discarded. After repeating the de-fatting step, the residual hexane was
evaporated. Extraction solution (150 mL) consisting of 70:28:2 (v/v/v) acetone, water, and acetic
acid, and dried defatted cocoa powder were mixed and sonicated (10 min). Supernatant was
collected after centrifuging the mixture at 5000 × g for 5 min. This procedure was repeated until
colorless supernatant was obtained. Supernatants from each extraction were pooled, and acetone
was evaporated by using rotary vacuum evaporator RV 10 basic (IKA®, Wilmington, NC) at
45°C. The remaining extract was frozen at –80 ° C and freeze dried. Freeze dried CE was then
crushed into powder and stored at –80 °C until further analysis. For analysis, CE was dissolved
in extraction solution [70:28:2 (v/v/v) acetone, water, acetic acid] to specified concentrations.
3.2.3. UPLC-MS/MS analysis. Cocoa monomeric flavanols and procyanidins were analyzed by
UPLC-MS/MS. A Waters Acquity H-class separation module (Milford, MA) equipped with an
Acquity Torus DIOL Column (2.1 mm × 100 mm, 1.7 μm particle size, 45 °C) and Torus DIOL
VanGuard Pre-column (2.1 mm × 5 mm, 1.7 µL particle size) was used to perform the analysis.
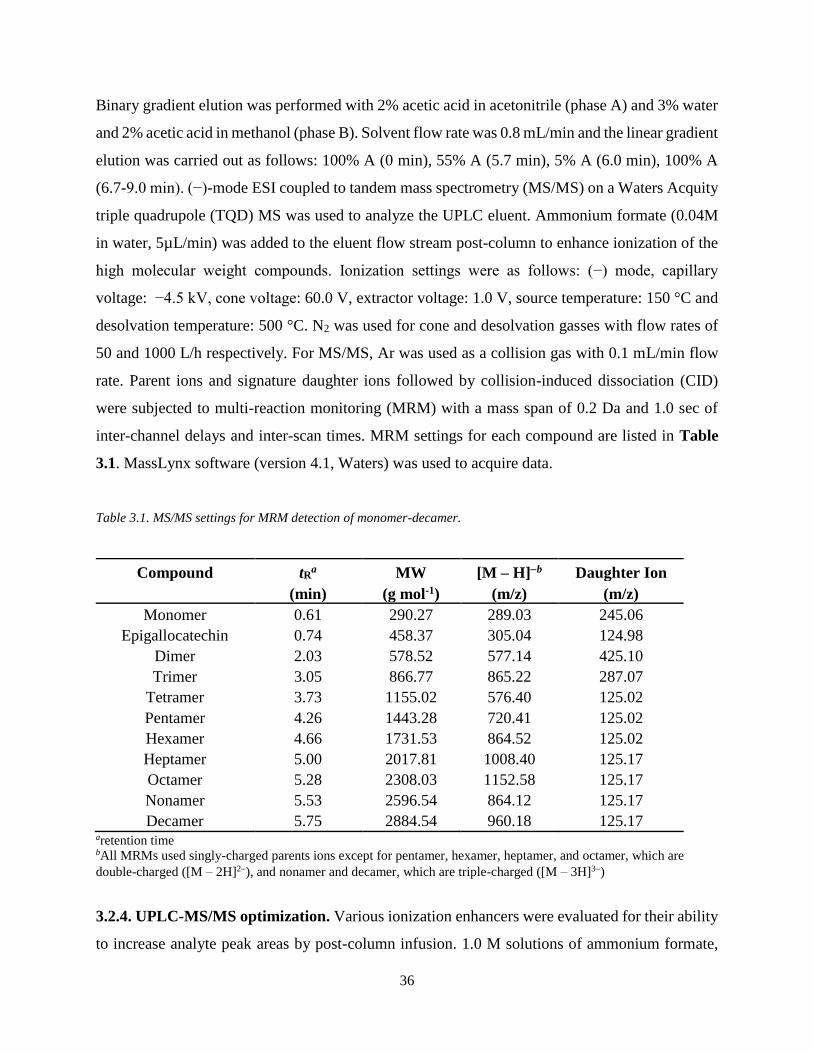
36
Binary gradient elution was performed with 2% acetic acid in acetonitrile (phase A) and 3% water
and 2% acetic acid in methanol (phase B). Solvent flow rate was 0.8 mL/min and the linear gradient
elution was carried out as follows: 100% A (0 min), 55% A (5.7 min), 5% A (6.0 min), 100% A
(6.7-9.0 min). (−)-mode ESI coupled to tandem mass spectrometry (MS/MS) on a Waters Acquity
triple quadrupole (TQD) MS was used to analyze the UPLC eluent. Ammonium formate (0.04M
in water, 5µL/min) was added to the eluent flow stream post-column to enhance ionization of the
high molecular weight compounds. Ionization settings were as follows: (−) mode, capillary
voltage: −4.5 kV, cone voltage: 60.0 V, extractor voltage: 1.0 V, source temperature: 150 °C and
desolvation temperature: 500 °C. N2 was used for cone and desolvation gasses with flow rates of
50 and 1000 L/h respectively. For MS/MS, Ar was used as a collision gas with 0.1 mL/min flow
rate. Parent ions and signature daughter ions followed by collision-induced dissociation (CID)
were subjected to multi-reaction monitoring (MRM) with a mass span of 0.2 Da and 1.0 sec of
inter-channel delays and inter-scan times. MRM settings for each compound are listed in Table
3.1. MassLynx software (version 4.1, Waters) was used to acquire data.
Table 3.1. MS/MS settings for MRM detection of monomer-decamer.
Compound tRa MW [M – H]−b Daughter Ion
(min) (g mol-1) (m/z) (m/z)
Monomer 0.61 290.27 289.03 245.06
Epigallocatechin 0.74 458.37 305.04 124.98
Dimer 2.03 578.52 577.14 425.10
Trimer 3.05 866.77 865.22 287.07
Tetramer 3.73 1155.02 576.40 125.02
Pentamer 4.26 1443.28 720.41 125.02
Hexamer 4.66 1731.53 864.52 125.02
Heptamer 5.00 2017.81 1008.40 125.17
Octamer 5.28 2308.03 1152.58 125.17
Nonamer 5.53 2596.54 864.12 125.17
Decamer 5.75 2884.54 960.18 125.17 aretention time bAll MRMs used singly-charged parents ions except for pentamer, hexamer, heptamer, and octamer, which are
double-charged ([M – 2H]2−), and nonamer and decamer, which are triple-charged ([M – 3H]3−)
3.2.4. UPLC-MS/MS optimization. Various ionization enhancers were evaluated for their ability
to increase analyte peak areas by post-column infusion. 1.0 M solutions of ammonium formate,
37
sodium carbonate, sodium acetate, sodium citrate, ammonium bicarbonate, as well as water, and
control (no infusion) were infused into the flow at 10 µL/min, tested on ionization following
injection of a highly concentrated CE (40 mg/mL) with an injection volume of 1 µL. See section
2.3 for conditions.
Various post-column infusion rates of 0.5 M ammonium formate were then evaluated for their
ability to increase analyte peak areas (whereas 1 M ammonium formate was used initially,
preliminary experiments suggested lower concentrations would be optimal and therefore this
experiment was performed with 0.5 M). Using injection of the 40 mg/mL CE under identical
conditions, infusion was introduced at 0-30 µL/min (the maximum flow rate of the built-in Acquity
TQD syringe pump). Various concentrations of the infusion enhancer were also evaluated for their
ability to increase analyte peak areas. Concentrations of ammonium formate ranging from 0-2.0
M were infused at 5 µL/min into the flow using during injection of the 40 mg/mL CE. Because of
the highly concentrated CE, a wash step (50 µL, 5 min) of phase C [70:28:2 (v/v/v) acetone, water,
acetic acid] was injected after every 2 sample injections, followed by a 4 min pre-run to revert to
initial starting conditions. Pre-run conditions were as followed: a linear gradient of 100% C, 0.6
mL/min (0 min), 100% A, 0.6 mL/min (.10 min), 100% A, 0.8 mL/min (3-4 min). This wash step
was not employed for CE injection concentrations lower than 40 mg/ml (representing typical use).
Due to the use of an ESI enhancer, following infusion selection and optimization, the tune (i.e.
ESI source) settings were optimized by infusing .04 M ammonium formate with dissolved CE (1.5
mg/mL) at 5 µL/min (the final optimized infusion settings) and adjusting the cone and capillary
voltages, source and capillary temperatures, and gas flow rates to select conditions maximizing the
enhancements due to the enhancer (data not shown, as these data were collected using direct CE
infusion). To evaluate the combined effects of the ESI enhancer and modified tune settings,
samples were run in triplicate according to the following: no infusion/original tune, no
infusion/optimized tune, infusion/original tune, infusion/optimized tune.
In order to assess the impact of injection volume on peak shape, a 5 mg/mL CE was prepared
and tested at the following volumes: 0.5, 1, 2, 5, 10, 20, 30, 40, and 50 µL. Because of the fact that
increasing the injection volume also increases the total mass injected, a second experiment was
performed in which the concentration was varied so that the total mass injected was the same
across various injection volumes: 40 mg/mL (1 µL), 20 mg/mL (2 µL), 10 mg/mL (4 µL), 5 mg/mL
(8 µL), 2.5 mg/mL (16 µL), 1 mg/mL (40 µL).
38
3.2.5. Measurement of variability and calibration curve. Intraday variability was assessed by
performing HILIC UPLC-MS/MS analysis using the final optimized method on a freshly made
aliquot of 5 mg/mL CE nine times in the same day. An internal standard of epigallocatechin gallate
(EGCG) was utilized at 0.01 mg/mL. Interday variability was assessed by performing HILIC
UPLC-MS/MS analysis on freshly thawed aliquots of CE with 0.01 mg/mL EGCG nine times for
three consecutive days.
Calibration curves for standards DP 1-9 were prepared and analyzed in triplicate. 18
dilutions, ranging from 6.93 × 10⁻⁷ - 0.091 mg/mL were prepared with 0.01 mg/mL EGCG in all
samples. In order to calculate lower limit of detection (LLOD) and lower limit of quantification
(LLOQ), analysis was performed on incrementally diluted concentrations of each standard until
the signal (peak height):noise ratio was reduced to 3:1 or 10:1, respectively. LLOD or LLOQ for
each standard was then defined as the lowest amount (pmol-on-column) that resulted in a
signal:noise ratio of >3:1 or >10:1, respectively. LLOD and LLOQ were determined in triplicate
and the mean LLOD and LLOQ are reported.
3.2.6. Data analysis. Statistical analyses were performed on XLSTAT-Base (2018.5, New York,
NY) and GraphPad Prism 7.03 (GraphPad, La Jolla, CA). Data were analyzed by one-way
ANOVA to determine the overall significance and if detected, Tukey’s HSD post-hoc test was
used to compare all means. Significance was defined a priori as P < 0.05.
3.3 RESULTS AND DISCUSSION
In the present study, we developed a comparatively rapid HILIC-UPLC-MS/MS method
to more efficiently and effectively quantify cocoa flavanols by their DP. We achieved this by
employing a UPLC HILIC column to optimize peak resolution and then utilizing post-column
ionization of ammonium formate to improve ESI-MS ionization. Although our method meets the
definition of traditional NP through the utilization of mobile phases less polar than the stationary
phase, it is in fact aqueous NP (HILIC) due to the solvents used. By optimizing the optimal infusion
compound, rate, and concentration, as well as modifying the source parameters, we were able to
significantly reduce the elution time while enhancing the MS signal of each procyanidin analyzed.
39
3.3.1 Infusion identification and optimization. In order to identify potential post-column
reagents enhancing procyanidin ionization, 1.0 M solutions of various compound were infused
post-column at 10 µL/min as potential ESI enhancers on the basis of their compatibility with
mobile phase and ability to improve ionization in HILIC LC-MS (Figure 3.2). These were
employed during analysis of an injected CE solution. Small organic acids and bases, such as
ammonium formate, are especially volatile and can have positive implications on the ionization of
higher molecular-weight compounds. The peak areas of each compound (DP 1- 10) obtained with
each of the tested ionization enhancers are shown in Figure 3.2. The infusion compound was then
selected on the basis of generally enhanced maximal peak area across all compounds analyzed.
Ionization efficiency was generally good for monomers and other small flavanols regardless of the
nature of the infused compound, as expected. Some tested compounds (sodium carbonate and
sodium acetate) actually suppressed ionization almost completely for most flavanols. Although
water had optimal ionization for smaller flavanols (EGC, monomer, dimer, and trimer),
ammonium formate was the best of the tested compounds at enhancing flavanol ionization for the
larger flavanols, DP 4 - 10. Therefore, ammonium formate was selected for further optimization.
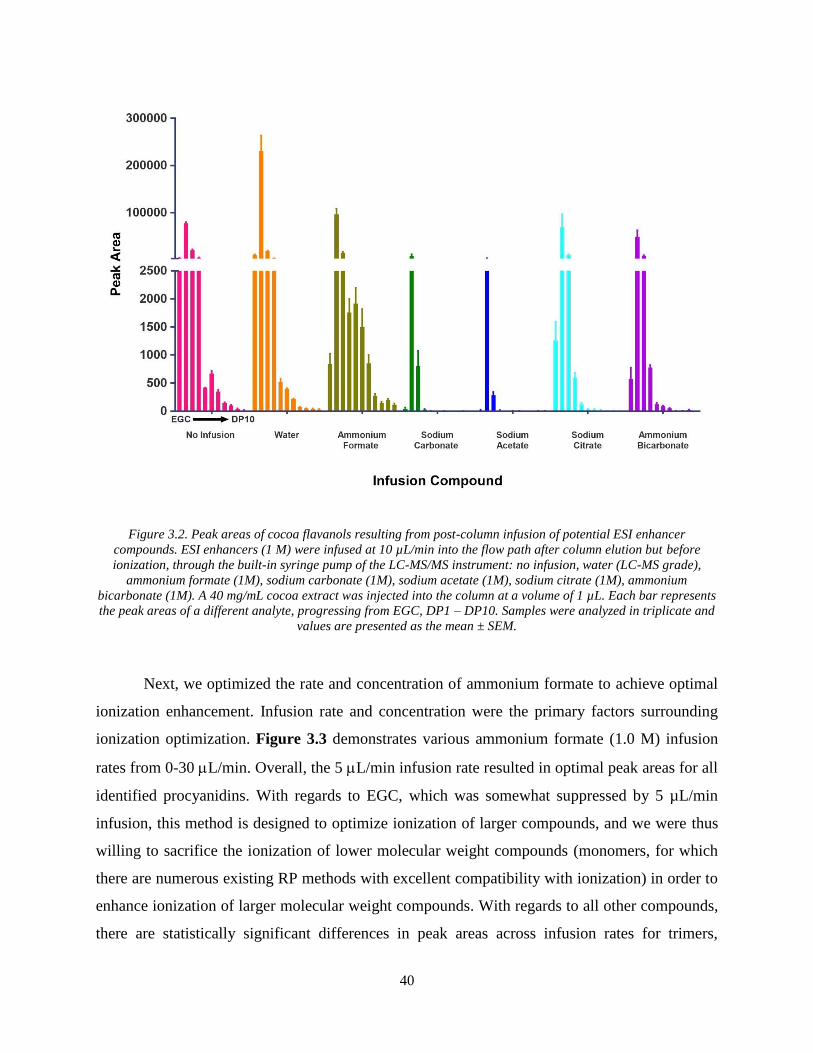
40
Figure 3.2. Peak areas of cocoa flavanols resulting from post-column infusion of potential ESI enhancer
compounds. ESI enhancers (1 M) were infused at 10 µL/min into the flow path after column elution but before
ionization, through the built-in syringe pump of the LC-MS/MS instrument: no infusion, water (LC-MS grade),
ammonium formate (1M), sodium carbonate (1M), sodium acetate (1M), sodium citrate (1M), ammonium
bicarbonate (1M). A 40 mg/mL cocoa extract was injected into the column at a volume of 1 µL. Each bar represents
the peak areas of a different analyte, progressing from EGC, DP1 – DP10. Samples were analyzed in triplicate and
values are presented as the mean ± SEM.
Next, we optimized the rate and concentration of ammonium formate to achieve optimal
ionization enhancement. Infusion rate and concentration were the primary factors surrounding
ionization optimization. Figure 3.3 demonstrates various ammonium formate (1.0 M) infusion
rates from 0-30 L/min. Overall, the 5 L/min infusion rate resulted in optimal peak areas for all
identified procyanidins. With regards to EGC, which was somewhat suppressed by 5 µL/min
infusion, this method is designed to optimize ionization of larger compounds, and we were thus
willing to sacrifice the ionization of lower molecular weight compounds (monomers, for which
there are numerous existing RP methods with excellent compatibility with ionization) in order to
enhance ionization of larger molecular weight compounds. With regards to all other compounds,
there are statistically significant differences in peak areas across infusion rates for trimers,
41
tetramers, and hexamers, as denoted by the superscripts. The lack of statistical difference
differences in peak areas across infusion rates for many of the compounds (DP 5, 7-10) is due to
the extremely high variability in peak areas that was observed for some of the higher infusion rates.
Despite the greater mean peak areas at these higher rates, extreme variability is not optimal for
method performance. Because of this, we chose to move forward with 5 µL/min, which was
selected as the best combination of enhanced peak areas for larger compounds. Higher infusion
rates generally resulted in large variability. Next, we optimized the concentration of ammonium
formate from 0-2 M at 5 L/min (Figure 3.4). 0.04 M ammonium formate consistently resulted in
the highest sensitivity among all compounds. Through these steps it was determined that an
infusion of 0.04 M ammonium formate at 5 L/min produced optimal sensitivity and ionization of
the higher molecular weight flavanols.
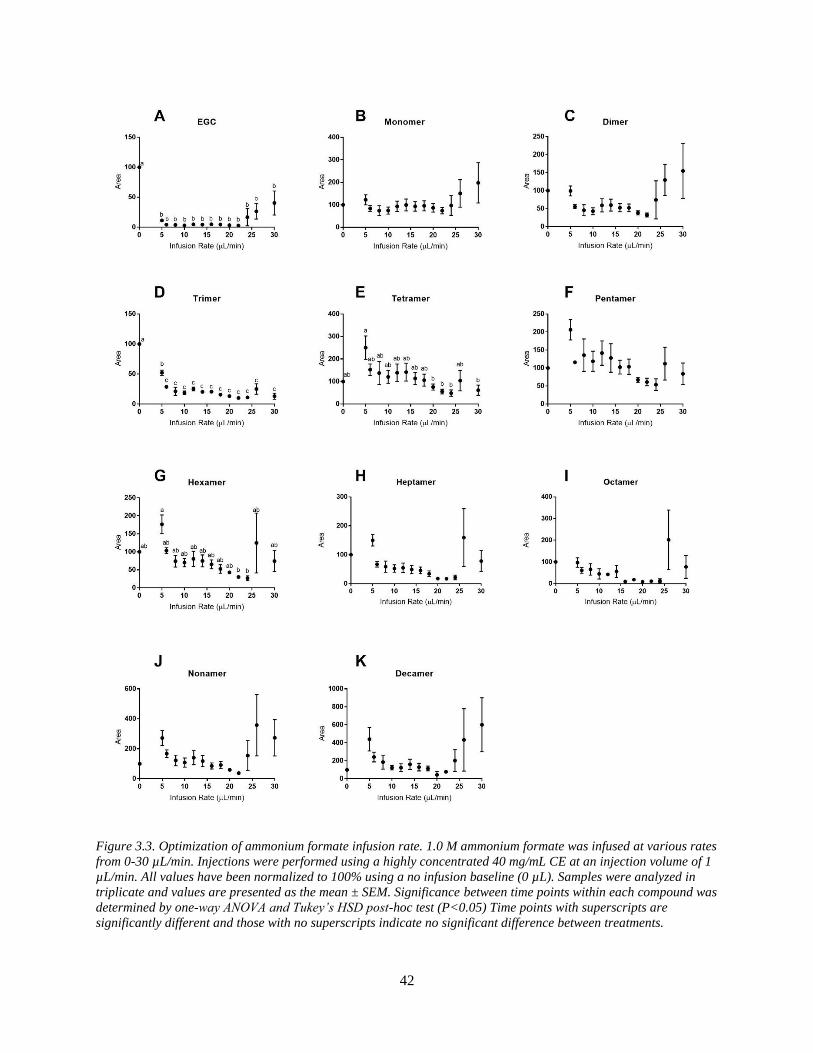
42
Figure 3.3. Optimization of ammonium formate infusion rate. 1.0 M ammonium formate was infused at various rates
from 0-30 µL/min. Injections were performed using a highly concentrated 40 mg/mL CE at an injection volume of 1
µL/min. All values have been normalized to 100% using a no infusion baseline (0 µL). Samples were analyzed in
triplicate and values are presented as the mean ± SEM. Significance between time points within each compound was
determined by one-way ANOVA and Tukey’s HSD post-hoc test (P<0.05) Time points with superscripts are
significantly different and those with no superscripts indicate no significant difference between treatments.
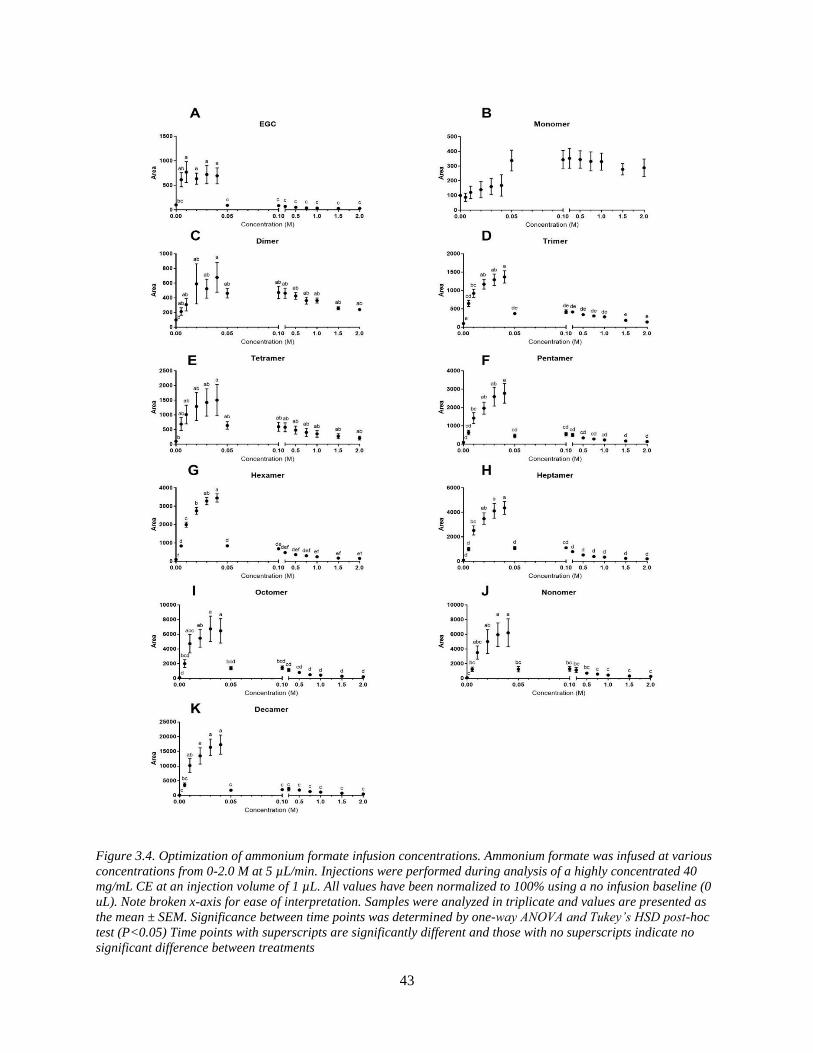
43
Figure 3.4. Optimization of ammonium formate infusion concentrations. Ammonium formate was infused at various
concentrations from 0-2.0 M at 5 µL/min. Injections were performed during analysis of a highly concentrated 40
mg/mL CE at an injection volume of 1 µL. All values have been normalized to 100% using a no infusion baseline (0
uL). Note broken x-axis for ease of interpretation. Samples were analyzed in triplicate and values are presented as
the mean ± SEM. Significance between time points was determined by one-way ANOVA and Tukey’s HSD post-hoc
test (P<0.05) Time points with superscripts are significantly different and those with no superscripts indicate no
significant difference between treatments
44
Due to the modifications in the ionization, we next manually optimized the tune (i.e.
source) settings, in the context of infusing 0.04 M ammonium formate at 5 L/min, in order to
account for the presence of the ammonium formate (data not shown). The original source settings
were 60 V (cone), −4.5 kV (capillary), 1 V (extractor), 0 V (RF lens), 150°C (source temp), 1000
L/hr (desolvation gas flow), 50 L/hr (cone gas flow), and after optimization the modified source
settings were 45 V (cone), −4.25 kV (capillary), 1 V (extractor), 0 V (RF lens), 150°C (source
temp), 1000 L/hr (desolvation gas flow), and 50 L/hr (cone gas flow). Therefore, these modified
source settings were employed moving forward. In order to assess the combined impacts of the
ammonium formate infusion (0.04 M at 5 L/min) and the modified tune settings on ionization
efficiency, we analyzed CE with and without the infusion and the modified source settings in
combination (Figure 3.5). Without infusion, there was minimal change to the majority of the
procyanidins ionized using the modified tune settings. Once infusion was introduced, we were able
to further improve ionization efficiency for the better part of the analyzed procyanidins. It is very
clear that the ammonium formate infusion significantly contributes to enhanced ionization of
procyanidins beyond trimer. Although the benefit of these conditions is lower in monomers (EGC,
C, and EC) and modest for dimers and trimers, larger analytes are increasingly more difficult to
individually ionize and the infusion/optimized tune produced signal as much as 100X more
amplified than without (Figure 3.5 E-K). Although many of the procyanidins did not show a
statistically significant difference between the original and optimized tune settings, EGC,
monomer, and dimer did significantly improve from original to optimized tune settings, thus using
this rationale to move forward with optimized tune settings. Furthermore, it is unknown why some
compounds exhibited greater variability in this experiment. This demonstrates the significant
improvement in ionization, and by extension the utility of this method.
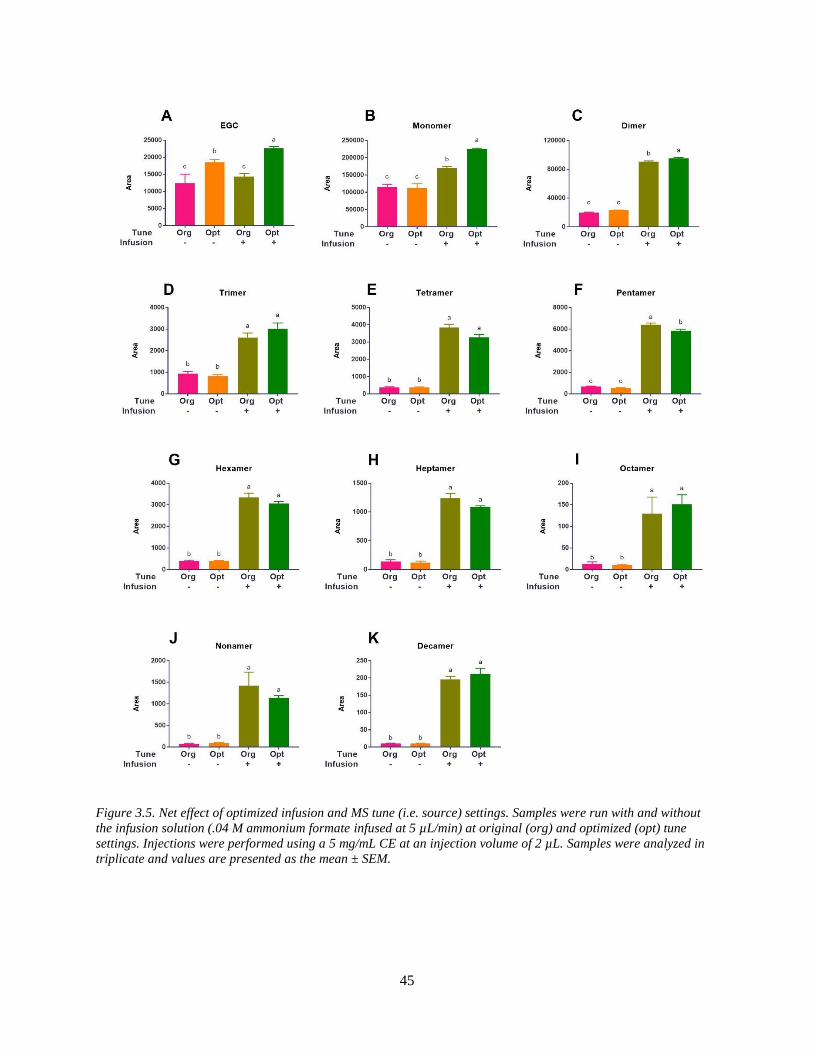
45
Figure 3.5. Net effect of optimized infusion and MS tune (i.e. source) settings. Samples were run with and without
the infusion solution (.04 M ammonium formate infused at 5 µL/min) at original (org) and optimized (opt) tune
settings. Injections were performed using a 5 mg/mL CE at an injection volume of 2 µL. Samples were analyzed in
triplicate and values are presented as the mean ± SEM.
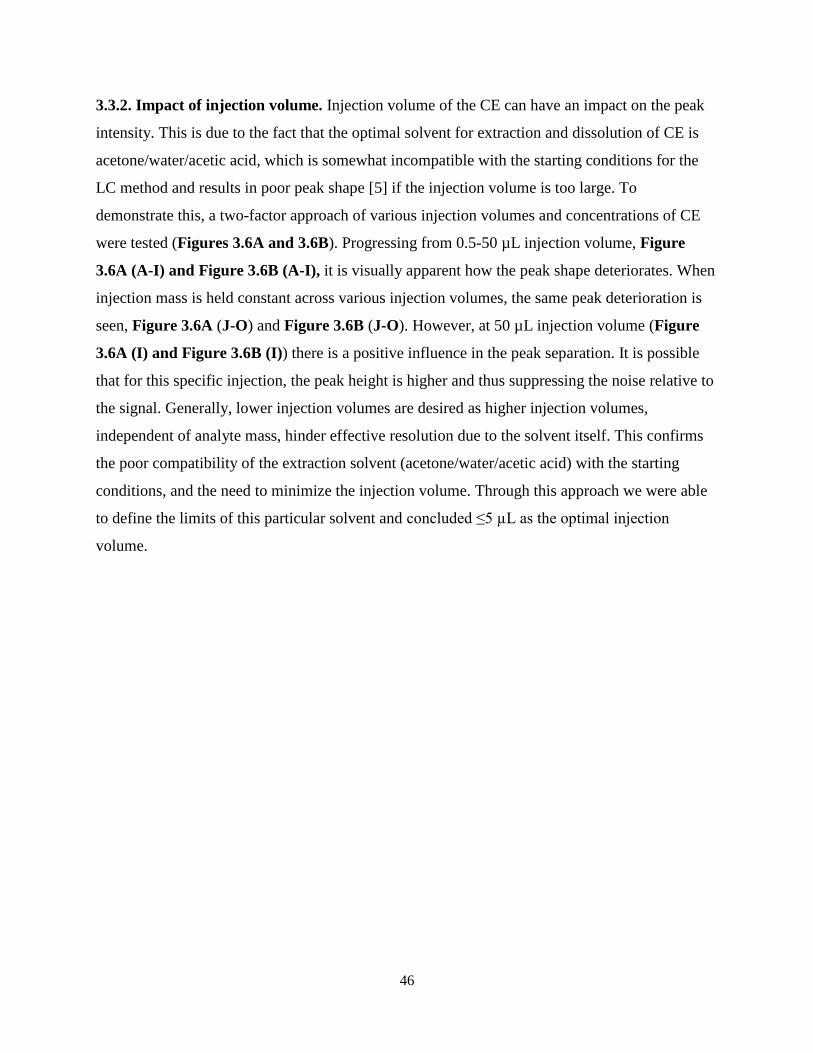
46
3.3.2. Impact of injection volume. Injection volume of the CE can have an impact on the peak
intensity. This is due to the fact that the optimal solvent for extraction and dissolution of CE is
acetone/water/acetic acid, which is somewhat incompatible with the starting conditions for the
LC method and results in poor peak shape [5] if the injection volume is too large. To
demonstrate this, a two-factor approach of various injection volumes and concentrations of CE
were tested (Figures 3.6A and 3.6B). Progressing from 0.5-50 µL injection volume, Figure
3.6A (A-I) and Figure 3.6B (A-I), it is visually apparent how the peak shape deteriorates. When
injection mass is held constant across various injection volumes, the same peak deterioration is
seen, Figure 3.6A (J-O) and Figure 3.6B (J-O). However, at 50 µL injection volume (Figure
3.6A (I) and Figure 3.6B (I)) there is a positive influence in the peak separation. It is possible
that for this specific injection, the peak height is higher and thus suppressing the noise relative to
the signal. Generally, lower injection volumes are desired as higher injection volumes,
independent of analyte mass, hinder effective resolution due to the solvent itself. This confirms
the poor compatibility of the extraction solvent (acetone/water/acetic acid) with the starting
conditions, and the need to minimize the injection volume. Through this approach we were able
to define the limits of this particular solvent and concluded ≤5 µL as the optimal injection
volume.
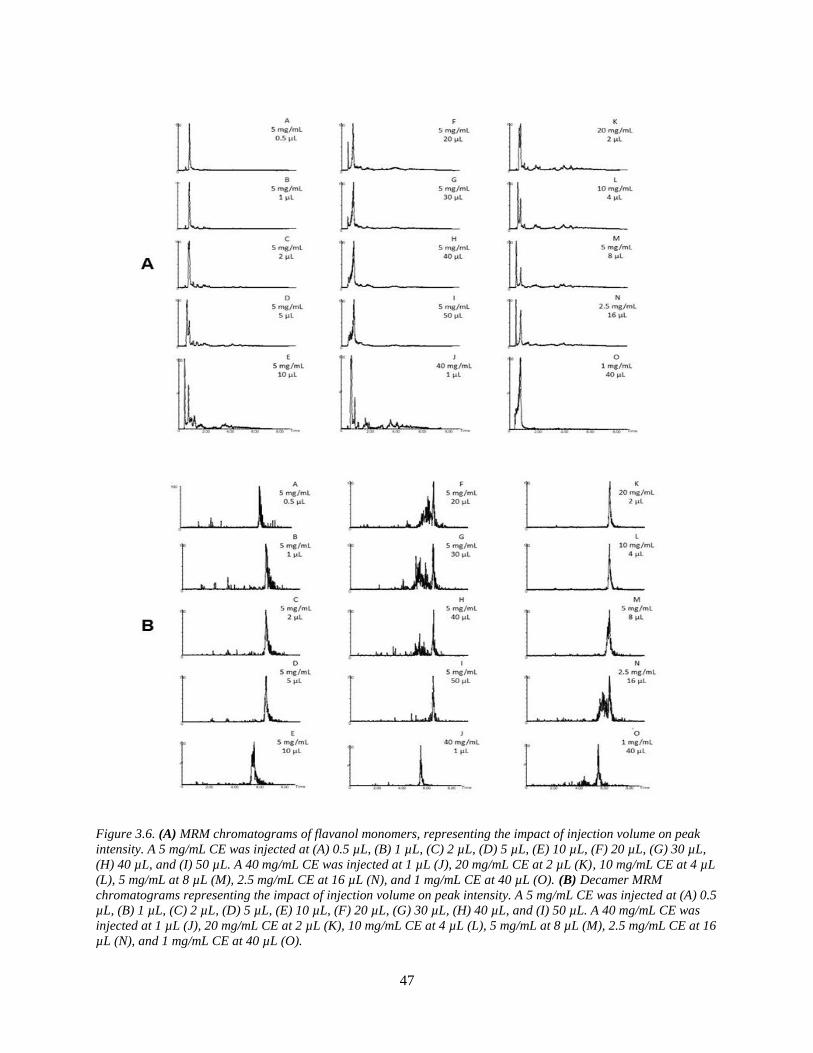
47
Figure 3.6. (A) MRM chromatograms of flavanol monomers, representing the impact of injection volume on peak
intensity. A 5 mg/mL CE was injected at (A) 0.5 µL, (B) 1 µL, (C) 2 µL, (D) 5 µL, (E) 10 µL, (F) 20 µL, (G) 30 µL,
(H) 40 µL, and (I) 50 µL. A 40 mg/mL CE was injected at 1 µL (J), 20 mg/mL CE at 2 µL (K), 10 mg/mL CE at 4 µL
(L), 5 mg/mL at 8 µL (M), 2.5 mg/mL CE at 16 µL (N), and 1 mg/mL CE at 40 µL (O). (B) Decamer MRM
chromatograms representing the impact of injection volume on peak intensity. A 5 mg/mL CE was injected at (A) 0.5
µL, (B) 1 µL, (C) 2 µL, (D) 5 µL, (E) 10 µL, (F) 20 µL, (G) 30 µL, (H) 40 µL, and (I) 50 µL. A 40 mg/mL CE was
injected at 1 µL (J), 20 mg/mL CE at 2 µL (K), 10 mg/mL CE at 4 µL (L), 5 mg/mL at 8 µL (M), 2.5 mg/mL CE at 16
µL (N), and 1 mg/mL CE at 40 µL (O).
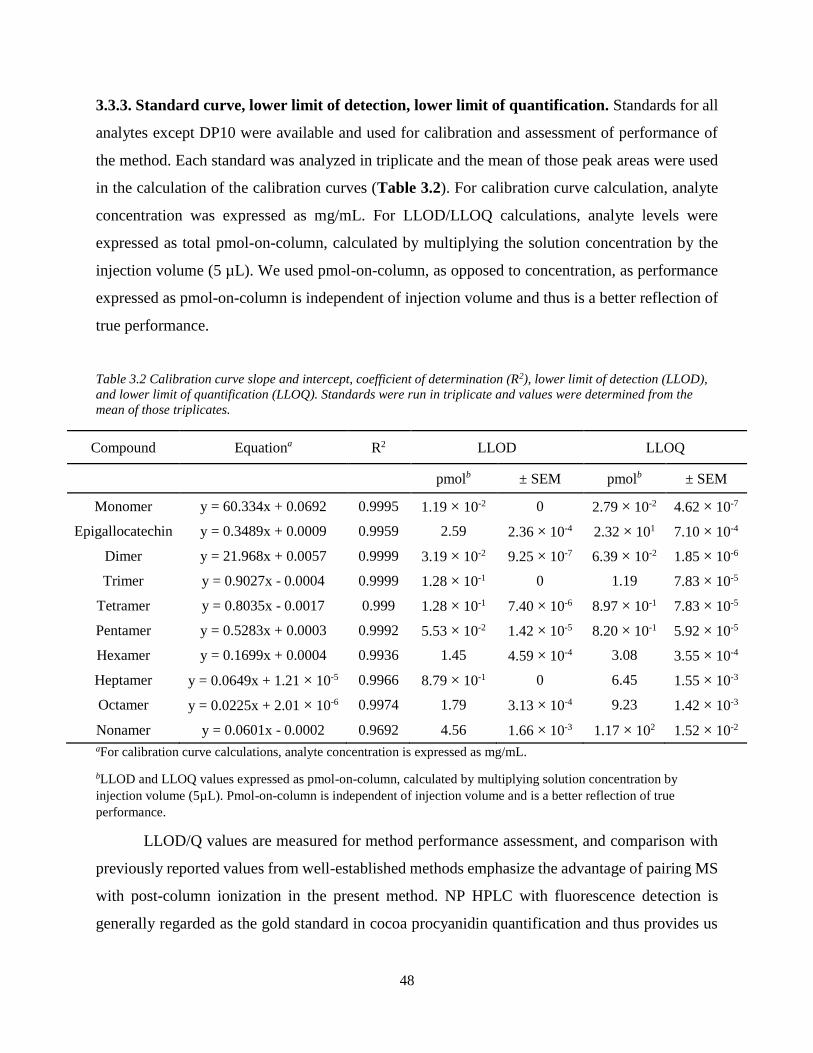
48
3.3.3. Standard curve, lower limit of detection, lower limit of quantification. Standards for all
analytes except DP10 were available and used for calibration and assessment of performance of
the method. Each standard was analyzed in triplicate and the mean of those peak areas were used
in the calculation of the calibration curves (Table 3.2). For calibration curve calculation, analyte
concentration was expressed as mg/mL. For LLOD/LLOQ calculations, analyte levels were
expressed as total pmol-on-column, calculated by multiplying the solution concentration by the
injection volume (5 µL). We used pmol-on-column, as opposed to concentration, as performance
expressed as pmol-on-column is independent of injection volume and thus is a better reflection of
true performance.
Table 3.2 Calibration curve slope and intercept, coefficient of determination (R2), lower limit of detection (LLOD),
and lower limit of quantification (LLOQ). Standards were run in triplicate and values were determined from the
mean of those triplicates.
Compound Equationa R2 LLOD LLOQ
pmolb ± SEM pmolb ± SEM
Monomer y = 60.334x + 0.0692 0.9995 1.19 × 10⁻² 0 2.79 × 10⁻² 4.62 × 10⁻⁷
Epigallocatechin y = 0.3489x + 0.0009 0.9959 2.59 2.36 × 10⁻⁴ 2.32 × 101 7.10 × 10⁻⁴
Dimer y = 21.968x + 0.0057 0.9999 3.19 × 10⁻² 9.25 × 10⁻⁷ 6.39 × 10⁻² 1.85 × 10⁻⁶
Trimer y = 0.9027x - 0.0004 0.9999 1.28 × 10⁻¹ 0 1.19 7.83 × 10⁻⁵
Tetramer y = 0.8035x - 0.0017 0.999 1.28 × 10⁻¹ 7.40 × 10⁻⁶ 8.97 × 10⁻¹ 7.83 × 10⁻⁵
Pentamer y = 0.5283x + 0.0003 0.9992 5.53 × 10⁻² 1.42 × 10⁻⁵ 8.20 × 10⁻¹ 5.92 × 10⁻⁵
Hexamer y = 0.1699x + 0.0004 0.9936 1.45 4.59 × 10⁻⁴ 3.08 3.55 × 10⁻⁴
Heptamer y = 0.0649x + 1.21 × 10⁻⁵ 0.9966 8.79 × 10⁻¹ 0 6.45 1.55 × 10⁻³
Octamer y = 0.0225x + 2.01 × 10⁻⁶ 0.9974 1.79 3.13 × 10⁻⁴ 9.23 1.42 × 10⁻³
Nonamer y = 0.0601x - 0.0002 0.9692 4.56 1.66 × 10⁻³ 1.17 × 10² 1.52 × 10⁻² aFor calibration curve calculations, analyte concentration is expressed as mg/mL.
bLLOD and LLOQ values expressed as pmol-on-column, calculated by multiplying solution concentration by
injection volume (5µL). Pmol-on-column is independent of injection volume and is a better reflection of true
performance.
LLOD/Q values are measured for method performance assessment, and comparison with
previously reported values from well-established methods emphasize the advantage of pairing MS
with post-column ionization in the present method. NP HPLC with fluorescence detection is
generally regarded as the gold standard in cocoa procyanidin quantification and thus provides us
49
with LLOD/Q values to better understand the difference in detectors. Generally, the values
reported in our method for LLOD/Q (Table 3.2), are up to 100,000 fold lower for small compounds
(DP 1-3) and between 30-8,000 fold lower for larger compounds (DP 4-9) compared to those
reported in NP HPLC-FLD methods [9,11]. In comparison to HILIC-HPLC quantification of
similar procyanidins, our method brought about LOQ values between 30-7,000 fold lower for
smaller compounds (DP 1-5) and 4-141 fold lower for larger compounds (DP6-9) [8]. Without
post-column ionization, previously reported LLOD/Q values from UPLC-MS/MS are more
comparable than those of HPLC-FLD [15]. Yet, the use of post-column ionization with UPLC-
MS/MS in the current method brings a 10 fold decrease in LLOD/Q values, though higher DP
procyanidins were not assessed [15]. It is important to note that these previously reported methods
utilize different detectors and additionally do not utilize post-column ionization as we do in the
current method. Advancements have allowed for the integration of HILIC-LC-MS/MS, and thus
cutting down retention time, increased specificity through MS, and increased separation through
HILIC. Although FLD methods are useful for samples with high concentrations of analytes (i.e.
food), more dilute samples (i.e. biological tissues, fluid, etc.) would be better run on our proposed
method. This is confirmed through the increasing values in LLOD/Q as the DP of compounds
increase (Table 3.2), and mirrored by values seen in the literature [9,11,15].
3.3.4. Repeatability and reproducibility. Intraday variation of retention time and response was
quantified by analyzing an aliquot of 5 mg/mL CE, injected at 5 µL, nine times in one day. Peak
area and retention time from each injection were used to calculate the coefficient of variation (CV)
for each compound. Interday variation of response was quantified by analyzing a fresh aliquot of
5 mg/mL CE, injected at 5 µL, nine times each day over the span of three consecutive days.
Intraday and interday CV remained <2% for retention time across all compounds (DP 1-10), while
intraday retention time CV remained <10% for peak area among DP 1-9, with the exception of DP
10 at 10.13% (Table 3.3). Interday CV was much more variable for peak area than intraday. CVs
increase with increasing DP, specifically in DP 7-10. Stanley et al [16] utilized a RP HPLC-ECD
method to quantify cocoa procyanidins at DP 2-7. Not only is our method more efficient than this
method but has similar peak area intraday variation and comparable interday variation. The authors
present intraday CVs ˂10% with the exception of one compound at an average of 11.4% variation
over the three-day period, a trend that is also seen in our data. The interday CVs for our method
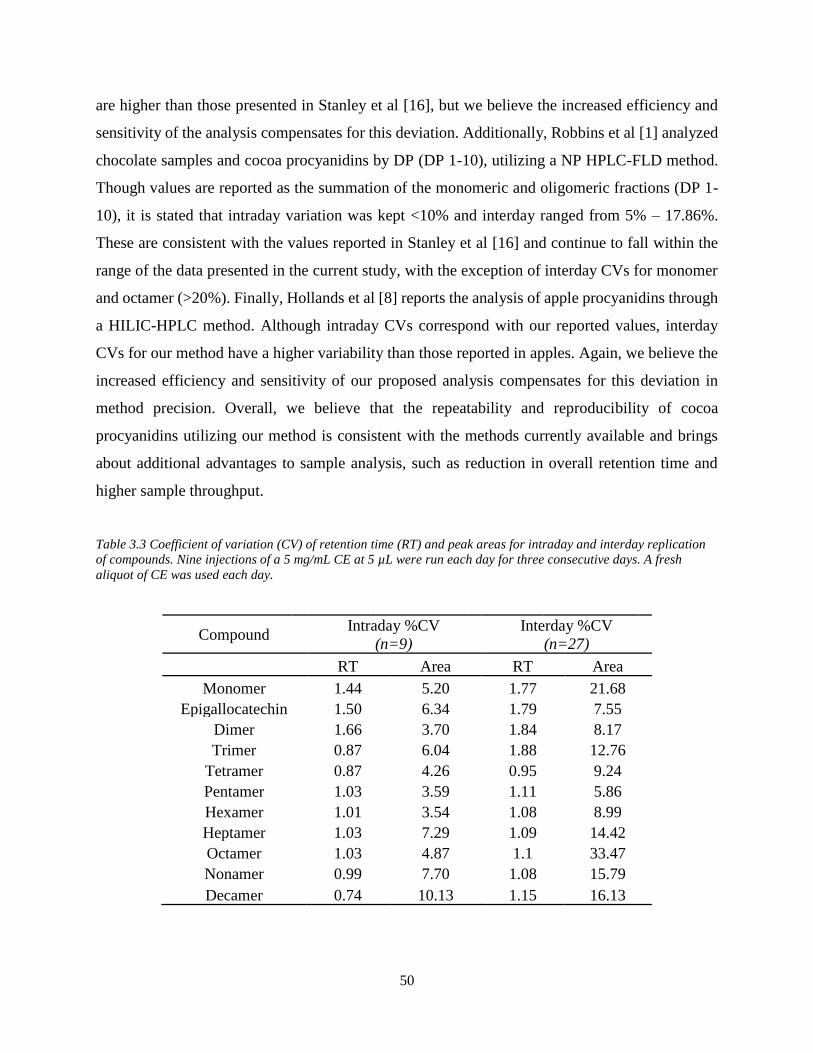
50
are higher than those presented in Stanley et al [16], but we believe the increased efficiency and
sensitivity of the analysis compensates for this deviation. Additionally, Robbins et al [1] analyzed
chocolate samples and cocoa procyanidins by DP (DP 1-10), utilizing a NP HPLC-FLD method.
Though values are reported as the summation of the monomeric and oligomeric fractions (DP 1-
10), it is stated that intraday variation was kept <10% and interday ranged from 5% – 17.86%.
These are consistent with the values reported in Stanley et al [16] and continue to fall within the
range of the data presented in the current study, with the exception of interday CVs for monomer
and octamer (>20%). Finally, Hollands et al [8] reports the analysis of apple procyanidins through
a HILIC-HPLC method. Although intraday CVs correspond with our reported values, interday
CVs for our method have a higher variability than those reported in apples. Again, we believe the
increased efficiency and sensitivity of our proposed analysis compensates for this deviation in
method precision. Overall, we believe that the repeatability and reproducibility of cocoa
procyanidins utilizing our method is consistent with the methods currently available and brings
about additional advantages to sample analysis, such as reduction in overall retention time and
higher sample throughput.
Table 3.3 Coefficient of variation (CV) of retention time (RT) and peak areas for intraday and interday replication
of compounds. Nine injections of a 5 mg/mL CE at 5 µL were run each day for three consecutive days. A fresh
aliquot of CE was used each day.
Compound Intraday %CV
(n=9)
Interday %CV
(n=27)
RT Area RT Area
Monomer 1.44 5.20 1.77 21.68
Epigallocatechin 1.50 6.34 1.79 7.55
Dimer 1.66 3.70 1.84 8.17
Trimer 0.87 6.04 1.88 12.76
Tetramer 0.87 4.26 0.95 9.24
Pentamer 1.03 3.59 1.11 5.86
Hexamer 1.01 3.54 1.08 8.99
Heptamer 1.03 7.29 1.09 14.42
Octamer 1.03 4.87 1.1 33.47
Nonamer 0.99 7.70 1.08 15.79
Decamer 0.74 10.13 1.15 16.13
51
3.3.5. MRM chromatogram. MRM chromatograms representing the final method are shown in
Figure 3.7. The total run time of 9 min is significantly reduced from previously established
methods, typically ranging from 70-90 min in total, or 16-20 samples per day [1,8,9,12]. Machonis
et al [10] initially reduced total run time from a 76 min NP HPLC-FLD method to a 15 min method,
but the quantification capability of the method remained the same. On a per day sample throughput
basis, our 9 min method can process up to 160 runs per day, a 40% improvement from 15 min and
approximately 800% improvement from the original HPLC-FLD method. At 9 min, the total run
time is no longer a limiting factor and sample throughput significantly increases. The significant
reduction in run time compared to previous published HILIC and NP procyanidin methods was
achieved by taking advantage of UPLC columns and instrumentation, whereas previous methods
employed HPLC.
It is important to note the peak intensities of Figure 3.7, specifically those of DP 6 and DP
9. Due to very minor differences in their MRM transition parent and daughter masses (Table 3.1),
these compounds provide signal on both MRM channels compounds overlap with one another
when analyzed together (such as in CE or mixed standards). By analyzing isolated authentic
standards, it is apparent that the nonamer is the second peak, corresponding to overall elution by
increasing DP as expected. The multiple peaks could be eliminated by further specifying the
retention time window for each compound, but for our purposes, displaying the entire
chromatogram was critical for demonstrating the method’s ability to both resolve and selectively
identify high molecular weight compounds. Furthermore, more distinct daughter ions could be
employed for DP 6 and DP 9 MRMs, but the selected MRMs gave the best fragmentation
intensities for each authentic standard and were selected in order to maximize LLOD/LLOQ for
each compound.
52
Figure 3.7. LC-MS/MS overlay chromatogram of non-smoothed peaks of each compound analyzed from cocoa
extract (left), as well as hexamer and nonamer chromatograms, obtained from analysis of the respective authentic
standards separately.
3.4 CONCLUSIONS
Growing interest in cocoa and the relationship between cocoa polyphenols and health has
created a gap in the quantification of larger cocoa analytes. These large molecular weight
compounds with varying DP are difficult to measure and thus, until recently, have been largely
unexplored. Currently the only available methods to quantify these large DP procyanidins require
large time commitments, large volumes of solvents, or are not compatible with MS, therefore being
unable to identify any unknowns that may present themselves during analysis. Through the use of
a UPLC DIOL (HILIC) column we significantly reduced analysis time, improved the compatibility
with MS and integrated a post-column ESI adjuvant infusion that enhances ionization along with
MS compatibility. To our knowledge, HILIC-UPLC has not been reported with these compounds
and this method will be the first of its kind. The method described in this study offers a more
sensitive, specific and rapid alternative to current methods for cocoa procyanidin analysis.
Utilization of this method has the potential to enable advancements in the field of cocoa
polyphenols and health that were not possible due to previous analytical limitations.
53
Acknowledgements
Funding for this work was provided, in part, by 1) Waters Corporation, Milford, MA (purchase
of authentic standards) and 2) the Virginia Agricultural Experiment Station and the Hatch
Program of the National Institute of Food and Agriculture, U.S. Department of Agriculture.
REFERNCES
[1] R.J. Robbins, J. Leonczak, J. Li, J.C. Johnson, T. Collins, C. Kwik-Uribe, H.H. Schmitz,
Determination of Flavanol and Procyanidin (by Degree of Polymerization 1–10)
Content of Chocolate, Cocoa Liquors, Powder(s), and Cocoa Flavanol Extracts by Normal
Phase High-Performance Liquid Chromatography: Collaborative Study, (2012).
doi:info:doi/10.5740/jaoacint.12-162.
[2] J.F. Hammerstone, S.A. Lazarus, A.E. Mitchell, R. Rucker, H.H. Schmitz, Identification
of Procyanidins in Cocoa (Theobroma cacao) and Chocolate Using High-Performance
Liquid Chromatography/Mass Spectrometry, J. Agric. Food Chem. 47 (1999) 490–496.
doi:10.1021/jf980760h.
[3] J. Wollgast, E. Anklam, Review on polyphenols in Theobroma cacao: changes in
composition during the manufacture of chocolate and methodology for identification and
quantification, Food Res. Int. 33 (2000) 423–447. doi:10.1016/S0963-9969(00)00068-5.
[4] I. Andújar, M.C. Recio, R.M. Giner, J.L. Ríos, Cocoa polyphenols and their potential
benefits for human health, Oxid. Med. Cell. Longev. 2012 (2012).
[5] M.R. Dorenkott, L.E. Griffin, K.M. Goodrich, K.A. Thompson-Witrick, G. Fundaro, L.
Ye, J.R. Stevens, M. Ali, S.F. O’Keefe, M.W. Hulver, A.P. Neilson, Oligomeric Cocoa
Procyanidins Possess Enhanced Bioactivity Compared to Monomeric and Polymeric
Cocoa Procyanidins for Preventing the Development of Obesity, Insulin Resistance, and
Impaired Glucose Tolerance during High-Fat Feeding, J. Agric. Food Chem. 62 (2014)
2216–2227. doi:10.1021/jf500333y.
[6] Z.T. Bitzer, S.L. Glisan, M.R. Dorenkott, K.M. Goodrich, L. Ye, S.F. O’Keefe, J.D.
Lambert, A.P. Neilson, Cocoa procyanidins with different degrees of polymerization
possess distinct activities in models of colonic inflammation, J. Nutr. Biochem. 26 (2015)
827–831. doi:10.1016/j.jnutbio.2015.02.007.
[7] Y. Yamashita, M. Okabe, M. Natsume, H. Ashida, Cinnamtannin A2, a tetrameric
procyanidin, increases GLP-1 and insulin secretion in mice, Biosci. Biotechnol. Biochem.
77 (2013) 888–891.
[8] W.J. Hollands, S. Voorspoels, G. Jacobs, K. Aaby, A. Meisland, R. Garcia-Villalba, F.
Tomas-Barberan, M.K. Piskula, D. Mawson, I. Vovk, P.W. Needs, P.A. Kroon,
Development, validation and evaluation of an analytical method for the determination of
monomeric and oligomeric procyanidins in apple extracts, J. Chromatogr. A. 1495 (2017)
46–56. doi:10.1016/j.chroma.2017.03.030.
[9] R.J. Robbins, J. Leonczak, J.C. Johnson, J. Li, C. Kwik-Uribe, R.L. Prior, L. Gu, Method
performance and multi-laboratory assessment of a normal phase high pressure liquid
chromatography–fluorescence detection method for the quantitation of flavanols and
procyanidins in cocoa and chocolate containing samples, J. Chromatogr. A. 1216 (2009)
4831–4840.
54
[10] P.R. Machonis, M.A. Jones, C. Kwik-Uribe, D. Dowell, Determination of Flavanols and
Procyanidins (DP 1–10) in Cocoa-Based Ingredients and Products by UHPLC:
First Action 2013.03, (2014). doi:info:doi/10.5740/jaoacint.14-112.
[11] G.E. Adamson, S.A. Lazarus, A.E. Mitchell, R.L. Prior, G. Cao, P.H. Jacobs, B.G.
Kremers, J.F. Hammerstone, R.B. Rucker, K.A. Ritter, H.H. Schmitz, HPLC Method for
the Quantification of Procyanidins in Cocoa and Chocolate Samples and Correlation to
Total Antioxidant Capacity, J. Agric. Food Chem. 47 (1999) 4184–4188.
doi:10.1021/jf990317m.
[12] S. Toro-Uribe, L.J. López-Giraldo, E.A. Decker, Relationship between the
Physiochemical Properties of Cocoa Procyanidins and Their Ability to Inhibit Lipid
Oxidation in Liposomes, J. Agric. Food Chem. 66 (2018) 4490–4502.
[13] R. Kostiainen, T.J. Kauppila, Effect of eluent on the ionization process in liquid
chromatography–mass spectrometry, J. Chromatogr. A. 1216 (2009) 685–699.
doi:10.1016/j.chroma.2008.08.095.
[14] H.P. Nguyen, K.A. Schug, The advantages of ESI‐MS detection in conjunction with
HILIC mode separations: Fundamentals and applications, J. Sep. Sci. 31 (2008) 1465–
1480.
[15] N. Ortega, M.-P. Romero, A. Macià, J. Reguant, N. Anglès, J.-R. Morelló, M.-J. Motilva,
Comparative study of UPLC–MS/MS and HPLC–MS/MS to determine procyanidins and
alkaloids in cocoa samples, J. Food Compos. Anal. 23 (2010) 298–305.
[16] T.H. Stanley, A.T. Smithson, A.P. Neilson, R.C. Anantheswaran, J.D. Lambert, Analysis
of Cocoa Proanthocyanidins Using Reversed Phase High-Performance Liquid
Chromatography and Electrochemical Detection: Application to Studies on the Effect of
Alkaline Processing, J. Agric. Food Chem. 63 (2015) 5970–5975.
doi:10.1021/acs.jafc.5b02661.
55
CHAPTER 4. Development and Characterization of a Pilot-Scale Model Cocoa
Fermentation System Suitable for Studying the Impact of Fermentation on Putative
Bioactive Compounds and Bioactivity of Cocoa
Kathryn C. Racine, Andrew H. Lee, Brian D. Wiersema, Haibo Huang, Joshua D. Lambert,
Amanda C. Stewart, Andrew P. Neilson
Published in Foods
Racine, K.C.; Lee, A.H.; Wiersema, B.D.; Huang, H.; Lambert, J.D.; Stewart, A.C.; Neilson,
A.P. Development and Characterization of a Pilot-Scale Model Cocoa Fermentation System
Suitable for Studying the Impact of Fermentation on Putative Bioactive Compounds and
Bioactivity of Cocoa. Foods 2019, 8, 102.
ABSTRACT
Cocoa is a concentrated source of dietary flavanols—putative bioactive compounds associated
with health benefits. It is known that fermentation and roasting reduce levels of native flavonoids
in cocoa, and it is generally thought that this loss translates to reduced bioactivity. However, the
mechanisms of these losses are poorly understood, and little data exist to support this paradigm
that flavonoid loss results in reduced health benefits. To further facilitate large-scale studies of
the impact of fermentation on cocoa flavanols, a controlled laboratory fermentation model
system was increased in scale to a large (pilot) scale system. Raw cocoa beans (15 kg) were
fermented in 16 L of a simulated pulp media in duplicate for 168 h. The temperature of the
fermentation was increased from 25–55 °C at a rate of 5 °C/24 h. As expected, total polyphenols
and flavanol levels decreased as fermentation progressed (a loss of 18.3% total polyphenols and
14.4% loss of total flavanols during fermentation) but some increases were observed in the final
timepoints (120–168 h). Fermentation substrates, metabolites and putative cocoa bioactive
compounds were monitored and found to follow typical trends for on-farm cocoa heap
fermentations. For example, sucrose levels in pulp declined from >40 mg/mL to undetectable at
96 h. This model system provides a controlled environment for further investigation into the
potential for optimizing fermentation parameters to enhance the flavanol composition and the
potential health benefits of the resultant cocoa beans.
56
4.1 INTRODUCTION
Recently, cocoa (Theobroma cacao) and its putative bioactive compounds (particularly
flavonoids) have been associated with various health benefits, including positive effects on
cardiovascular, metabolic and endocrine diseases [1]. There is interest among health researchers,
scientists, cocoa suppliers and manufacturers alike in tailoring the processing of cocoa to produce
products with maximum health benefits. Three main groups of flavonoids exist within cocoas
beans: proanthocyanidins (oligomeric and polymeric flavanols) constitute approximately 58% of
the total phenolic content, followed by catechins (monomeric flavanols, ~37%) and anthocyanins
(~4%) [2]. It is known that oxidation, condensation and other reactions that take place during cocoa
fermentation and roasting reduce levels of native flavonoids, warranting investigation into how
these reactions ultimately impact cocoa’s health benefits [3–8]. The widely-accepted assumption
is that preservation of native flavonoids is critical for retaining bioactivity [9]. However, reactions
(oxidation, epimerization, condensation, etc.) during processing may generate compounds with
novel activities, potentially preserving or even enhancing health benefits [2,10–13] despite
flavonoid loss. Recent findings by Ryan et al. [11] contradict the widely-accepted assumption that
loss of native cocoa flavonoids corresponds with reduced activity in some cases. In their study,
lower concentrations of flavonoids and total polyphenols in fermented cocoa products were not
found to be associated with reduced bioactivity in in vitro digestive enzyme inhibition assays.
These findings indicate the potential for optimization of processing factors such as fermentation
and roasting to maximize the health benefits of cocoa.
Commercial cocoa fermentation is conducted on or in close proximity to the farm of origin in
large heaps on the ground or in wooden boxes covered with banana leaves. Tremendous variability
exists among on-farm heap fermentations, as differences in environmental microbiota, climate,
substrate and fermentation methods all play key roles in microbial ecology and activity. These
conditions are poorly documented and beans with differing fermentation histories are commingled
into large batches, making post hoc evaluation of the impact of fermentation on bioactivity
essentially impossible [8,12,14]. Furthermore, sourcing fermented beans for scientific research is
difficult, and complex supply chains have left researchers with uncertainty on cultivar, processing
parameters and heap consistency. Sourcing intact cocoa pods is also logistically challenging. With
growing interest in the potential for optimization of processing to influence composition and
57
subsequent bioactivity of cocoa, a controlled model pilot-scale fermentation system is needed.
Employing dried, unfermented beans and simulated pulp media eliminates the needs for fresh
unopened pods, a major limitation for cocoa fermentation research in regions distant from
cultivation. Such a system would provide the ability to control all aspects of fermentation using
the exact same starting beans, eliminating confounding variables when sourcing is not under full
control of the investigators.
Some preliminary work has been done to explore controlling cocoa fermentation for research
purposes (both for characterizing fermentation processes as well as modifying outcomes). Several
laboratory bench-scale model fermentations have been conducted in a variety of vessels, including
plastic [4,15] and stainless-steel [16], to examine the microbial influence and overall impact of
starter cultures on cocoa fermentation. These model fermentations generally use pulp and beans
from freshly harvested pods—which is not practical for frequent large-scale use in cocoa
fermentation research conducted in non-tropical regions—and use inoculated and ambient pulp
mediums [6,17–21]. Our group recently developed a large laboratory bench-scale fermentation
using simulated pulp media and dried unfermented cocoa beans as starting material [22]. To our
knowledge, ours was the first model of this scale. Along with other laboratory bench-scale model
fermentation systems, this model can be used to evaluate the impact of controlled fermentation on
putative bioactive compounds in cocoa. Fermentation can cause anywhere from 0–70% loss of
total polyphenols, and following fermentation the beans are dried and roasted, causing an
additional 15–40% loss [2,3,23–31]. Nonetheless, recent findings have indicated that lower
concentrations of specific cocoa flavonoids and total polyphenols in a given product are not always
associated with decreased bioactivity [11].
Additional studies employing a combination of analytical, in vitro and in vivo approaches are
needed to advance the understanding of how specific cocoa flavonoid losses during cocoa
processing affect the bioactivities of cocoa. Studies are then needed to optimize processing,
including fermentation, to maximize the desirable health benefits of cocoa. However, to employ
techniques that go beyond analytical characterization of the fermented product, such as in vivo
bioactivity studies, larger amounts of experimentally fermented cocoa would be required than can
be reasonably produced using existing laboratory bench-scale model systems (pilot scale: tens of
kgs of fermented beans or more, instead of bench scale: hundreds of grams). Hence, our objective
was to develop and characterize a pilot-scale model cocoa fermentation system suitable for
58
studying the impact of fermentation on putative bioactive compounds. Dried, unfermented beans
and a simulated pulp media and ambient microorganisms were used due to the limitations
associated with sourcing and transporting fresh whole cocoa pods. Specifically, our hypothesis
was that broad microbial and chemical changes similar to those generally observed in heap
fermentations could be replicated in non-tropical regions by using a pilot-scale model system
designed to simulate the conditions occurring in the middle of a well-turned cocoa heap, and that
this system could be used to generate sufficient amounts of fermented cocoa beans for further
research on the effect processing has on the potential health benefits of cocoa.
4.2 MATERIALS AND METHODS
4.2.1. Chemicals and standards. Citric acid, yeast extract, malt extract, calcium lactate
pentahydride, tween 80, sodium hydroxide, magnesium sulfate heptahydride, manganese sulfate
monohydride, sucrose, glucose, fructose, peptone, calcium carbonate and agar were obtained from
Thermo Fisher Scientific (Waltham, MA, USA). Cycloheximide was obtained from MP
Biomedicals, LLC (Solon, OH, USA) and oxytetracycline dihydrate was obtained from Acros
Organics (Springfield Township, NJ, USA). Lactic acid, Folin–Ciocalteu reagent, 4-
dimethylaminocinnamaldehyde (DMAC), (±)-catechin, (–)-epicatechin and procyanidin B2
(PCB2) were obtained from Sigma-Aldrich (St. Louis, MO, USA). Procyanidin C1 (PCC1) and
cinnamtannin A2 (CinA2) were obtained from Planta Analytica (New Milford, CT, USA).
Solvents were ACS grade or higher.
4.2.2. Pilot-scale fermentation model. Raw unfermented Criollo cocoa beans (18 kg) (Natural
Zing LLC, Mount Airy, MD, USA), sourced from Ecuador, were rehydrated in 66.4 × 44.3 × 34.3
cm plastic fermentation boxes (Polypropylene, Sterilite, Townsend, MA, USA) by submersion in
approximately 20 L of distilled, deionized (DI) water for 24 h. The final moisture content of the
beans after rehydration was 39.7% (IR-120 Moisture Analyzer, Denver Instrument, Bohemia, NY,
USA), close to the lower end of the typical moisture range (40–60%) for fresh beans [32,33].
Rehydrated beans were then drained and 15 kg were mixed with 16 L of simulated pulp media,
prepared as described by Lee et al. [22] with minor modifications. Simulated pulp media were
obtained by mixing 3 separate solutions (solutions A, B and C). Solution A consisted of citric acid
59
(10 g/L), yeast extract (5 g/L), peptone (5 g/L), calcium lactate pentahydride (1 g/L) and tween 80
(1 mL/L); the pH was adjusted to 3.6 using 1 N NaOH and then volume corrected to a total of 9.6
L before autoclaving (121 °C, 15 min) to ensure sterility of the medium. Solution B was a 4.8-L
sugar solution, with 1.6 L each of sucrose (83.3 g/L), glucose (133.3 g/L) and fructose (150 g/L).
Each sugar solution was autoclaved and cooled prior to fermentation. Solution C was prepared the
day of fermentation and consisted of magnesium sulfate heptahydride (1 g/L) and manganese
sulfate monohydride (0.4 g/L) for a total of 1.6 L. Boxes were loosely covered with their plastic
lids and placed inside a pre-heated (25 °C) incubator (Forma 29 cu ft Reach-In Incubator, Model
No. 3950, Thermo Fisher Scientific, Waltham, MA, USA). Scale-up from the bench scale was
required to produce sufficient material for experiments evaluating the impact of fermentation on
cocoa bioactivity using in vivo models. Two factors determined the scale of the pilot system: (1)
the amount of fermented product required for animal studies using the fermented material as
substrate, and (2) the size of the largest incubator available in our pilot plant. Taking these two
factors into account, the batch size was increased by over 10-fold from a 1.2-kg batch of rehydrated
beans at the bench scale to a 15-kg batch at the pilot scale. The bench-scale system was under
constant agitation in a shaker/incubator, which was not feasible in this pilot system. To maintain
maximum dissolved oxygen (DO) possible in a static system, fermentation vessel size and shape
were selected to maximize the surface area to volume ratio, and a stirring regime was implemented
wherein the contents of the vessel were well-mixed twice daily. Through preliminary work, this
mixing regime, in combination with mixing due to gas evolution during fermentation, proved
sufficient to maintain a well-mixed condition in the fermentation vessel and to support the
microbial succession required for fermentation.
The fermentation was performed in duplicate, simultaneously under identical conditions (2
replicate boxes each employing the conditions described above: 15 kg rehydrated beans and 16 L
simulated pulp per box) using ambient microorganisms (i.e., no inoculation) and took place over
a period of 168 h (representing the upper end of the spectrum of reported heap fermentation
times that occur on-farm). In the future, fermentation time can be varied to obtain different
extents of fermentation. The incubator set point was raised 5 °C per 24 h to a final temperature of
55 °C in order to mimic temperature progressions seen in heap fermentation [3,8,34,35]. Beans
were manually agitated for 3 min every 12 h to ensure that the simulated pulp media were
aerated [14,34–36]. The agitation step was critical to ensure the expected succession of the
60
microbial communities due to our model’s inability to introduce oxygen by draining pulp away,
as typically happens during heap fermentations when the pulp is liquefied and the heap is
manually turned. Pulp and bean samples were collected every 24 h throughout the fermentation.
Pulp dissolved oxygen (DO) and pH values were monitored using benchtop meters (Orion DO
Probe 083005MD; Orion Versa Star Pro pH meter; Thermo). After 168 h of fermentation, the
beans were drained to remove the remaining pulp media, rinsed with water and spread evenly
onto baking sheets. Beans were oven dried (Rational, Landsberg am Lech, Germany; Blodgett,
Burlington, VT, USA) at 45–65 °C until the moisture content fell below 8%. These conditions
mimicked typical commercial drying protocols [3,34,36,37]. After drying, beans were
thoroughly mixed together and stored at 4 °C.
4.2.3. Microbial enumeration. Enumeration methods and selective media were based on the
protocols of Nielsen et al. [34] and Ho et al. [38] with minor modifications. Collected pulp media
(5 mL) from each time point was diluted with 45 mL sterile 0.1% peptone water, and 1 mL of the
resulting mixture was then diluted 10-fold. Aliquots (0.1 mL) were spread inoculated to nutrient
agar appropriate for the growth of yeast, lactic acid bacteria (LAB) and acetic acid bacteria (AAB).
Yeast cultures were spread on YM media (3 g/L yeast extract, 3 g/L malt extract, 3 g/L peptone,
10 g/L glucose, 20 g/L agar) with 100 mg/L oxytetracycline and incubated at 37 °C. LAB were
cultured anaerobically by a BD GasPAK EZ gas generating system (Franklin Lakes, NJ, USA) on
de Man–Rogosa–Sharpe (MRS) agar (Sigma) with 400 mg/L cycloheximide at 37 °C, and AAB
were cultured on GYC media (50 g/L glucose, 10 g/L yeast extract, 30 g/L calcium carbonate, 20
g/L agar, pH = 5.6) with 400 mg/L cycloheximide by incubating at 25 °C. Bacterial enumeration
was performed in duplicate on analytical replicates for each fermentation box and time-point.
Colonies were counted and presented as log colony-forming units (CFU)/mL.
4.2.4. Cut test. The cut test is the standard assessment of post-fermentation bean quality and
suitability to move forward in processing [3,39]. A reduced sample-size version of the cut test was
performed as follows: 6 beans from each 24-h sampling were cut through lengthwise and each half
examined for color and quality defects. Although this test is not very applicable to low-anthocyanin
beans like Criollo, a purple interior is indicative that the fermentation ended prematurely, while a
brown interior is indicative of a successful fermentation [3,40].
61
4.2.5. Fermentation index. Fermentation index (FI) monitors the color change within the bean
cotyledon during fermentation. This color change is due to the decreasing anthocyanin content as
beans progress through fermentation. FI was measured based on the method of Romero-Cortes et
al. [41] with minor modifications. Five to seven randomly selected cocoa beans from each time
point were frozen with liquid nitrogen and ground to a fine powder. A 50-mg sample of the
resulting powder was weighed and mixed with 5 mL MeOH:HCl (97:3 v/v). Samples were
extracted at 4 °C for 16–18 h on a rotating shaker, centrifuged for 5 min at 3500× g, and the
supernatant was collected. Absorbance was measured using a BioTek Synergy 2 plate reader
(BioTek, Winooski, VT, USA) on a 96-well plate (Corning Inc., Corning, NY, USA) at 460 and
530 nm. These wavelengths were chosen to express structural properties and distributions through
fermentation, as 530 nm is a general λmax for anthocyanin spectra and 460 nm reflects the glycoside
distribution [42]. FI was determined based on the ratio of the absorbance at 460 nm compared to
that of 520 nm.
4.2.6. Bean pH. Approximately 5–7 cocoa beans collected at each time point were frozen with
liquid nitrogen, the shells were removed and the nibs were ground. Ground nibs (5 g) were
collected and mixed with 100 mL hot water (90 °C) and stirred for 30 s. The cocoa water solution
(25 mL) was then filtered through Whatman #4 filter paper and collected for pH analysis. It is
important to note that this procedure was not for quantifying the actual pH of the cocoa bean itself,
but rather to measure the acidity derived when bean acids are diluted into water; it is useful for
comparison between the pH of solutions produced by beans at different time points.
4.2.7. High-performance liquid chromatography (HPLC) analysis of fermentation
metabolites
4.2.7.1 Pulp media sample preparation. Pulp media samples were diluted 10-fold with distilled
water, vortexed and centrifuged for 5 min at 5000× g. Next, 1 mL of supernatant was removed
and filtered through a 0.45-µM polyvinylidene difluoride (PVDF) membrane filter (Thermo
Fisher Scientific, Waltham, MA, USA) into vials.
4.2.7.2. Bean sample preparation. Approximately 5–7 cocoa beans were peeled so that the nibs
were exposed. Next, 5 g of nib were weighed and added to distilled water at a 10× dilution. The
bean water solution was homogenized at high speed for 2 min in a blender (Waring Products,
62
Calhoun, GA, USA). The blended mixture was then centrifuged for 5 min at 5000× g and 1 mL
supernatant was removed and filtered into vials.
4.2.7.3. Analysis. Bean and pulp samples were analyzed by HPLC on an Agilent HPLC 1260
Infinity Series (Agilent Technologies, Santa Clara, CA, USA) using an Aminex HPX-87H column
(300 × 7.8 mm, 50 °C) (Bio-Rad Laboratories, Hercules, CA, USA) and a refractive index (RI)
detector (35 °C). A 0.005 M H2SO4 isocratic mobile phase at a flow rate of 0.6 mL/min was used
for analyte separation. The sample injection volume was 5 µL. Triplicate analytical replicates were
prepared and analyzed from each fermentation time point. A standard curve was prepared with a
range from 0.5 to 5.0 g/L. Sugars (sucrose, glucose, fructose), ethanol, glycerol and organic acids
(acetic acid, lactic acid, succinic acid, citric acid) were quantified.
4.2.8. Polyphenol extraction and quantification. Whole cocoa beans (40 g) were frozen with
liquid nitrogen and ground into a fine powder. To defat, the powder was mixed with 150 mL
hexane and sonicated for 10 min at 22 °C. The mixture was then centrifuged for 5 min at 5000× g,
the supernatant was discarded and then the process was repeated. Once defatted, the powder was
allowed to dry at room temperature. Once dry, the powder was mixed with 150 mL extraction
solution (70:28:2 acetone, water, acetic acid v/v/v), sonicated for 10 min at 22 °C and centrifuged
for 5 min at 5000× g. The supernatant was collected, and this procedure was repeated three times
for a total volume of 450 mL. All collected supernatant was pooled and placed under vacuum on
a rotary evaporator at 40 °C until all acetone had evaporated. The resulting extract was freeze dried
for 72 h and the yield was calculated. Total phenolic content (all polyphenols, including flavanols
as well as other flavonoids and non-flavonoid phenolics) of both the nib and shell was determined
by the Folin–Ciocalteu colorimetric assay and total flavanols (only catechins and
proanthocyanidins) measured by the 4-dimethylaminocinnamaldehyde (DMAC) colorimetric
assay, as previously described by Dorenkott et al. [10]. These values were expressed in mg gallic-
acid equivalents (mg GAE)/g bean and mg PCB2/g bean, respectively.
4.2.9. Individual polyphenol analysis and reversed phase UPLC-MS. Monomeric catechins
and low molecular weight procyanidins were measured by UPLC-MS on an Acquity H-Class
UPLC-QDa Mass Detector (Waters Corporation, Milford, MA, USA). Cocoa extract (CE) was
diluted with 0.1% formic acid (v/v) in water and 0.1% formic acid in acetonitrile (95:5 v/v), to a
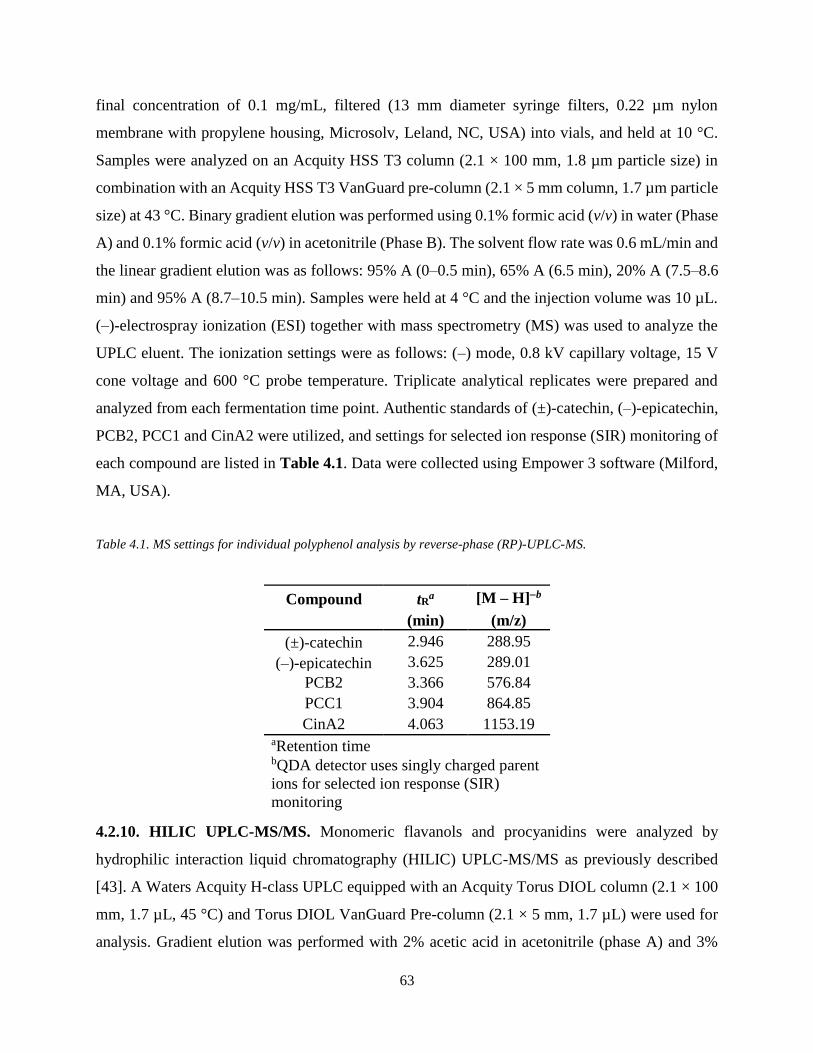
63
final concentration of 0.1 mg/mL, filtered (13 mm diameter syringe filters, 0.22 µm nylon
membrane with propylene housing, Microsolv, Leland, NC, USA) into vials, and held at 10 °C.
Samples were analyzed on an Acquity HSS T3 column (2.1 × 100 mm, 1.8 µm particle size) in
combination with an Acquity HSS T3 VanGuard pre-column (2.1 × 5 mm column, 1.7 µm particle
size) at 43 °C. Binary gradient elution was performed using 0.1% formic acid (v/v) in water (Phase
A) and 0.1% formic acid (v/v) in acetonitrile (Phase B). The solvent flow rate was 0.6 mL/min and
the linear gradient elution was as follows: 95% A (0–0.5 min), 65% A (6.5 min), 20% A (7.5–8.6
min) and 95% A (8.7–10.5 min). Samples were held at 4 °C and the injection volume was 10 µL.
(–)-electrospray ionization (ESI) together with mass spectrometry (MS) was used to analyze the
UPLC eluent. The ionization settings were as follows: (–) mode, 0.8 kV capillary voltage, 15 V
cone voltage and 600 °C probe temperature. Triplicate analytical replicates were prepared and
analyzed from each fermentation time point. Authentic standards of (±)-catechin, (–)-epicatechin,
PCB2, PCC1 and CinA2 were utilized, and settings for selected ion response (SIR) monitoring of
each compound are listed in Table 4.1. Data were collected using Empower 3 software (Milford,
MA, USA).
Table 4.1. MS settings for individual polyphenol analysis by reverse-phase (RP)-UPLC-MS.
Compound tRa [M – H]−b
(min) (m/z)
(±)-catechin 2.946 288.95
(–)-epicatechin 3.625 289.01
PCB2 3.366 576.84
PCC1 3.904 864.85
CinA2 4.063 1153.19 aRetention time bQDA detector uses singly charged parent
ions for selected ion response (SIR)
monitoring
4.2.10. HILIC UPLC-MS/MS. Monomeric flavanols and procyanidins were analyzed by
hydrophilic interaction liquid chromatography (HILIC) UPLC-MS/MS as previously described
[43]. A Waters Acquity H-class UPLC equipped with an Acquity Torus DIOL column (2.1 × 100
mm, 1.7 µL, 45 °C) and Torus DIOL VanGuard Pre-column (2.1 × 5 mm, 1.7 µL) were used for
analysis. Gradient elution was performed with 2% acetic acid in acetonitrile (phase A) and 3%
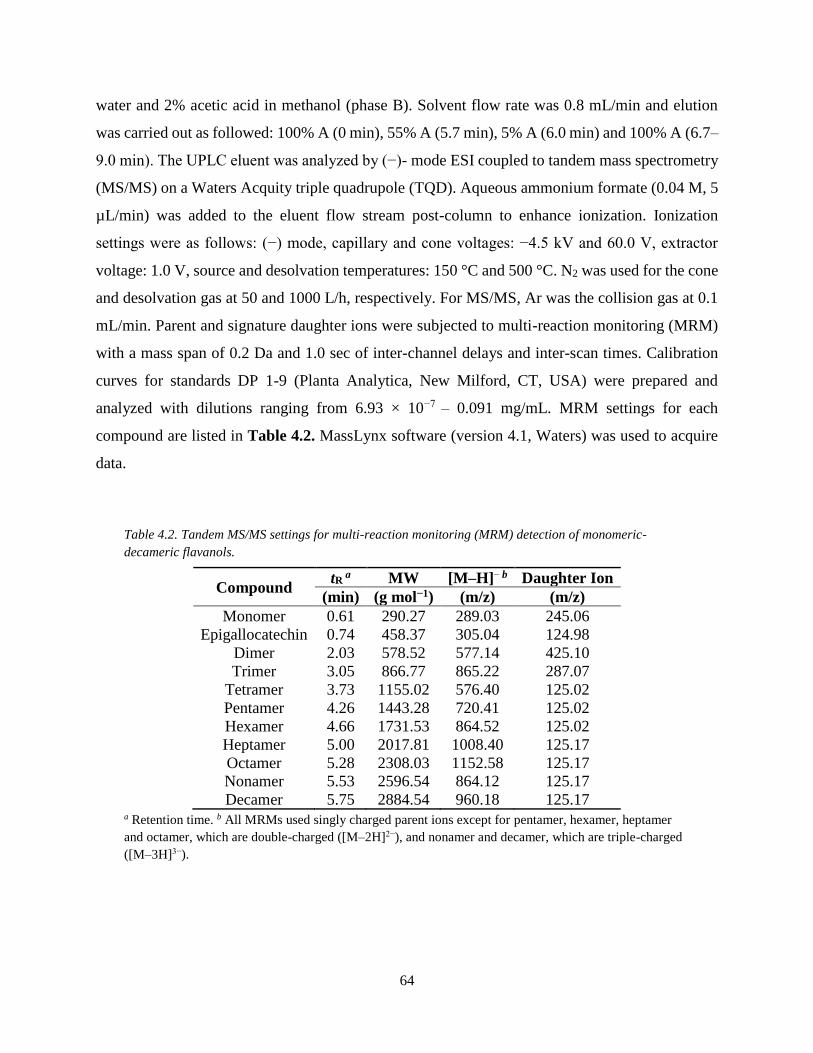
64
water and 2% acetic acid in methanol (phase B). Solvent flow rate was 0.8 mL/min and elution
was carried out as followed: 100% A (0 min), 55% A (5.7 min), 5% A (6.0 min) and 100% A (6.7–
9.0 min). The UPLC eluent was analyzed by (−)- mode ESI coupled to tandem mass spectrometry
(MS/MS) on a Waters Acquity triple quadrupole (TQD). Aqueous ammonium formate (0.04 M, 5
µL/min) was added to the eluent flow stream post-column to enhance ionization. Ionization
settings were as follows: (−) mode, capillary and cone voltages: −4.5 kV and 60.0 V, extractor
voltage: 1.0 V, source and desolvation temperatures: 150 °C and 500 °C. N2 was used for the cone
and desolvation gas at 50 and 1000 L/h, respectively. For MS/MS, Ar was the collision gas at 0.1
mL/min. Parent and signature daughter ions were subjected to multi-reaction monitoring (MRM)
with a mass span of 0.2 Da and 1.0 sec of inter-channel delays and inter-scan times. Calibration
curves for standards DP 1-9 (Planta Analytica, New Milford, CT, USA) were prepared and
analyzed with dilutions ranging from 6.93 × 10⁻⁷ – 0.091 mg/mL. MRM settings for each
compound are listed in Table 4.2. MassLynx software (version 4.1, Waters) was used to acquire
data.
Table 4.2. Tandem MS/MS settings for multi-reaction monitoring (MRM) detection of monomeric-
decameric flavanols.
Compound tR
a MW [M–H]– b Daughter Ion
(min) (g mol−1) (m/z) (m/z)
Monomer 0.61 290.27 289.03 245.06
Epigallocatechin 0.74 458.37 305.04 124.98
Dimer 2.03 578.52 577.14 425.10
Trimer 3.05 866.77 865.22 287.07
Tetramer 3.73 1155.02 576.40 125.02
Pentamer 4.26 1443.28 720.41 125.02
Hexamer 4.66 1731.53 864.52 125.02
Heptamer 5.00 2017.81 1008.40 125.17
Octamer 5.28 2308.03 1152.58 125.17
Nonamer 5.53 2596.54 864.12 125.17
Decamer 5.75 2884.54 960.18 125.17 a Retention time. b All MRMs used singly charged parent ions except for pentamer, hexamer, heptamer
and octamer, which are double-charged ([M–2H]2−), and nonamer and decamer, which are triple-charged
([M–3H]3−).
65
4.2.11. Data analysis and statistics. The fermentation was performed in duplicate, simultaneously
under identical conditions. Analyses were performed on samples from each replicate; analytical
replicates were averaged together to create a composite value for each fermentation replicate. Data
from distinct time points were analyzed by one-way ANOVA to determine overall significance. If
significant differences were detected, Tukey’s HSD post-hoc test was then used to compare all
time point means. Significance was defined as p < 0.05. Analyses were performed using GraphPad
Prism 7.03 (GraphPad, La Jolla, CA, USA).
4.3 RESULTS
4.3.1. pH, DO, FI, cut test. As shown in Figure 4.1A, the mean pH of the simulated pulp media
started at approximately 3.6, increased to a maximum value at 72 h and slightly declined to a final
mean of 4.6. The solution made from the nib had a mean pH of 5.4, and the pH declined throughout
fermentation to a final mean of 4.6. Initial DO levels were high due to the fresh mixing of simulated
pulp and beans but decreased rapidly over the first 24 h followed by consistent levels for the
remainder of the fermentation. It has been determined that cocoa mass is adequately fermented
when FI measurements are ≥1 [41] and, as shown in Figure 4.1B, FI values began at 0.872 ± 0.065
and values ≥1 were initially achieved between 48–72 h. Figure 4.1C shows the cut test of beans
selected at each time point. There were a variety of colors over the span of the fermentation, from
light/dark brown to purple.
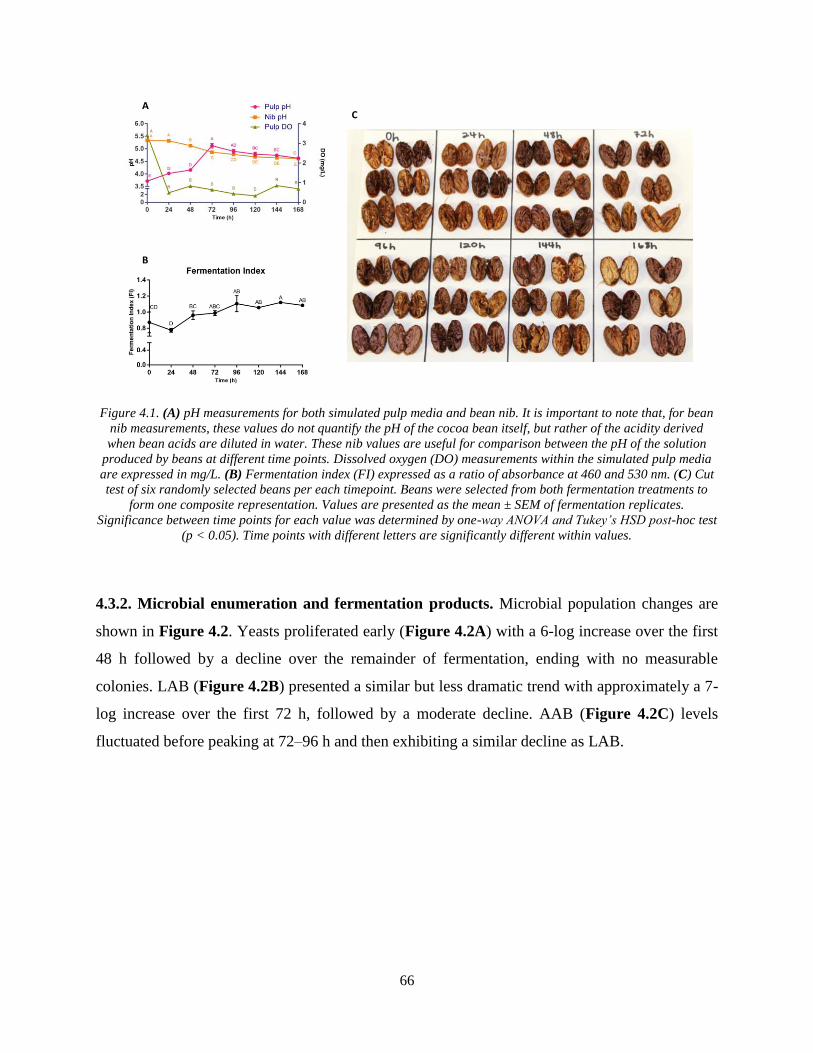
66
Figure 4.1. (A) pH measurements for both simulated pulp media and bean nib. It is important to note that, for bean
nib measurements, these values do not quantify the pH of the cocoa bean itself, but rather of the acidity derived
when bean acids are diluted in water. These nib values are useful for comparison between the pH of the solution
produced by beans at different time points. Dissolved oxygen (DO) measurements within the simulated pulp media
are expressed in mg/L. (B) Fermentation index (FI) expressed as a ratio of absorbance at 460 and 530 nm. (C) Cut
test of six randomly selected beans per each timepoint. Beans were selected from both fermentation treatments to
form one composite representation. Values are presented as the mean ± SEM of fermentation replicates.
Significance between time points for each value was determined by one-way ANOVA and Tukey’s HSD post-hoc test
(p < 0.05). Time points with different letters are significantly different within values.
4.3.2. Microbial enumeration and fermentation products. Microbial population changes are
shown in Figure 4.2. Yeasts proliferated early (Figure 4.2A) with a 6-log increase over the first
48 h followed by a decline over the remainder of fermentation, ending with no measurable
colonies. LAB (Figure 4.2B) presented a similar but less dramatic trend with approximately a 7-
log increase over the first 72 h, followed by a moderate decline. AAB (Figure 4.2C) levels
fluctuated before peaking at 72–96 h and then exhibiting a similar decline as LAB.
A
B
C
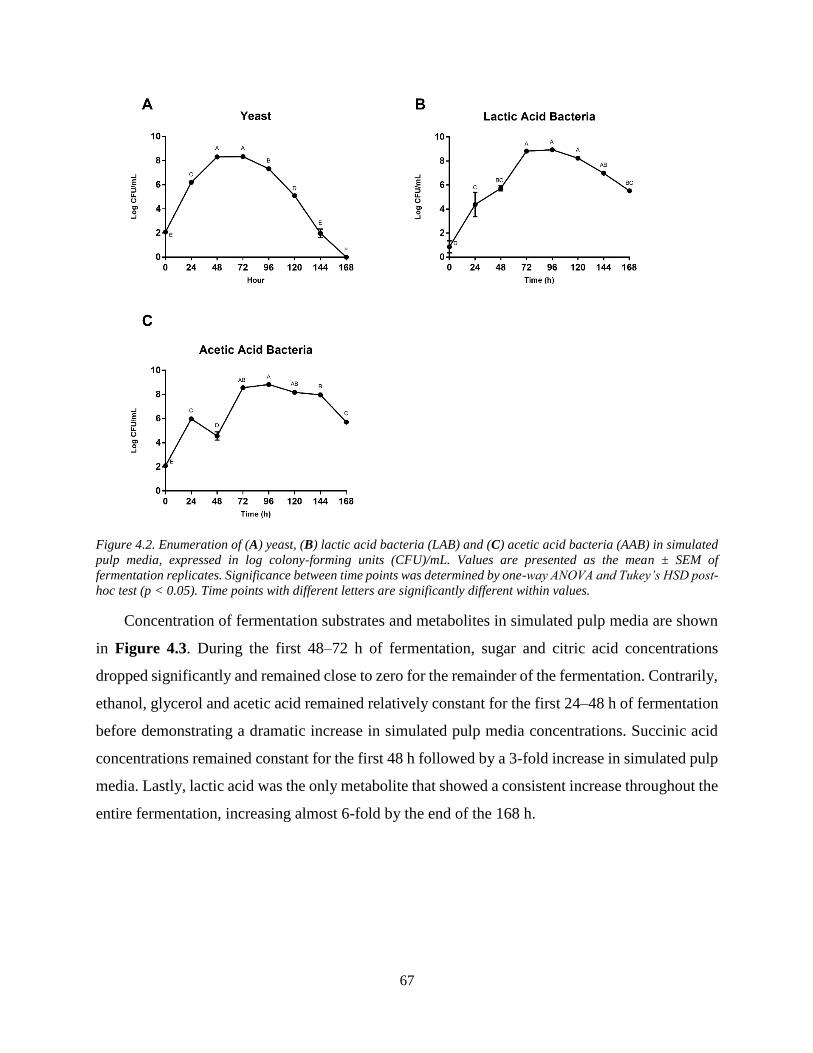
67
Figure 4.2. Enumeration of (A) yeast, (B) lactic acid bacteria (LAB) and (C) acetic acid bacteria (AAB) in simulated
pulp media, expressed in log colony-forming units (CFU)/mL. Values are presented as the mean ± SEM of
fermentation replicates. Significance between time points was determined by one-way ANOVA and Tukey’s HSD post-
hoc test (p < 0.05). Time points with different letters are significantly different within values.
Concentration of fermentation substrates and metabolites in simulated pulp media are shown
in Figure 4.3. During the first 48–72 h of fermentation, sugar and citric acid concentrations
dropped significantly and remained close to zero for the remainder of the fermentation. Contrarily,
ethanol, glycerol and acetic acid remained relatively constant for the first 24–48 h of fermentation
before demonstrating a dramatic increase in simulated pulp media concentrations. Succinic acid
concentrations remained constant for the first 48 h followed by a 3-fold increase in simulated pulp
media. Lastly, lactic acid was the only metabolite that showed a consistent increase throughout the
entire fermentation, increasing almost 6-fold by the end of the 168 h.
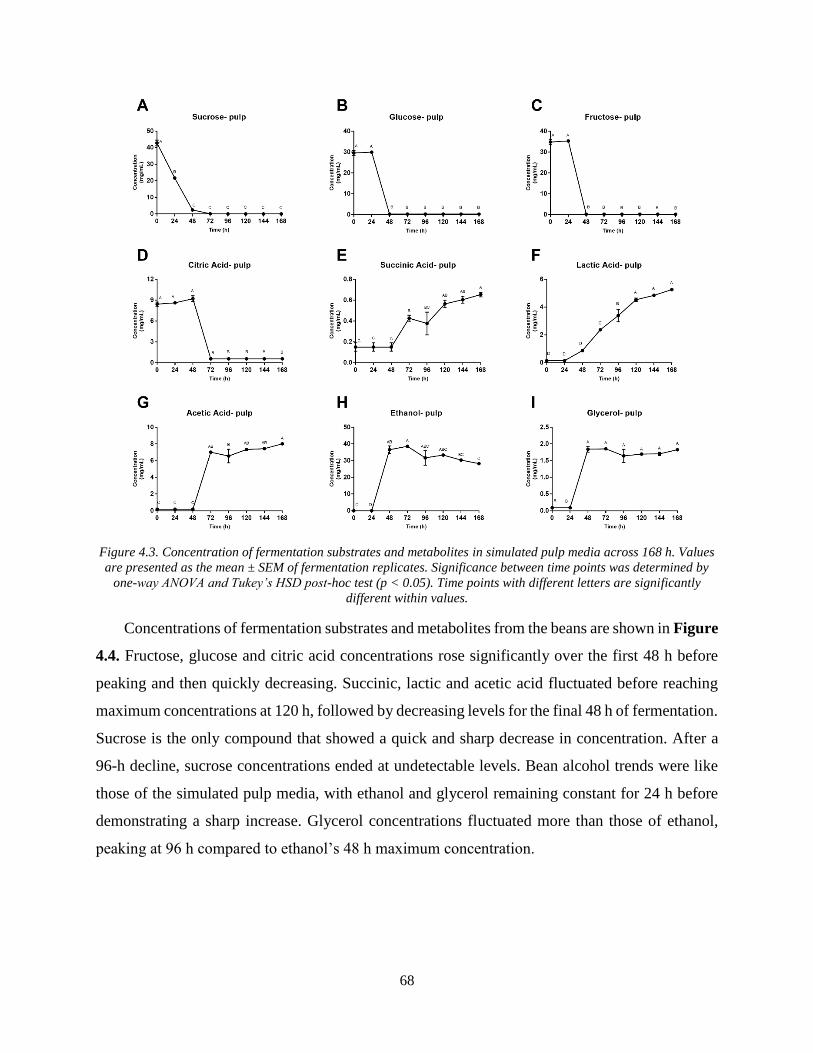
68
Figure 4.3. Concentration of fermentation substrates and metabolites in simulated pulp media across 168 h. Values
are presented as the mean ± SEM of fermentation replicates. Significance between time points was determined by
one-way ANOVA and Tukey’s HSD post-hoc test (p < 0.05). Time points with different letters are significantly
different within values.
Concentrations of fermentation substrates and metabolites from the beans are shown in Figure
4.4. Fructose, glucose and citric acid concentrations rose significantly over the first 48 h before
peaking and then quickly decreasing. Succinic, lactic and acetic acid fluctuated before reaching
maximum concentrations at 120 h, followed by decreasing levels for the final 48 h of fermentation.
Sucrose is the only compound that showed a quick and sharp decrease in concentration. After a
96-h decline, sucrose concentrations ended at undetectable levels. Bean alcohol trends were like
those of the simulated pulp media, with ethanol and glycerol remaining constant for 24 h before
demonstrating a sharp increase. Glycerol concentrations fluctuated more than those of ethanol,
peaking at 96 h compared to ethanol’s 48 h maximum concentration.
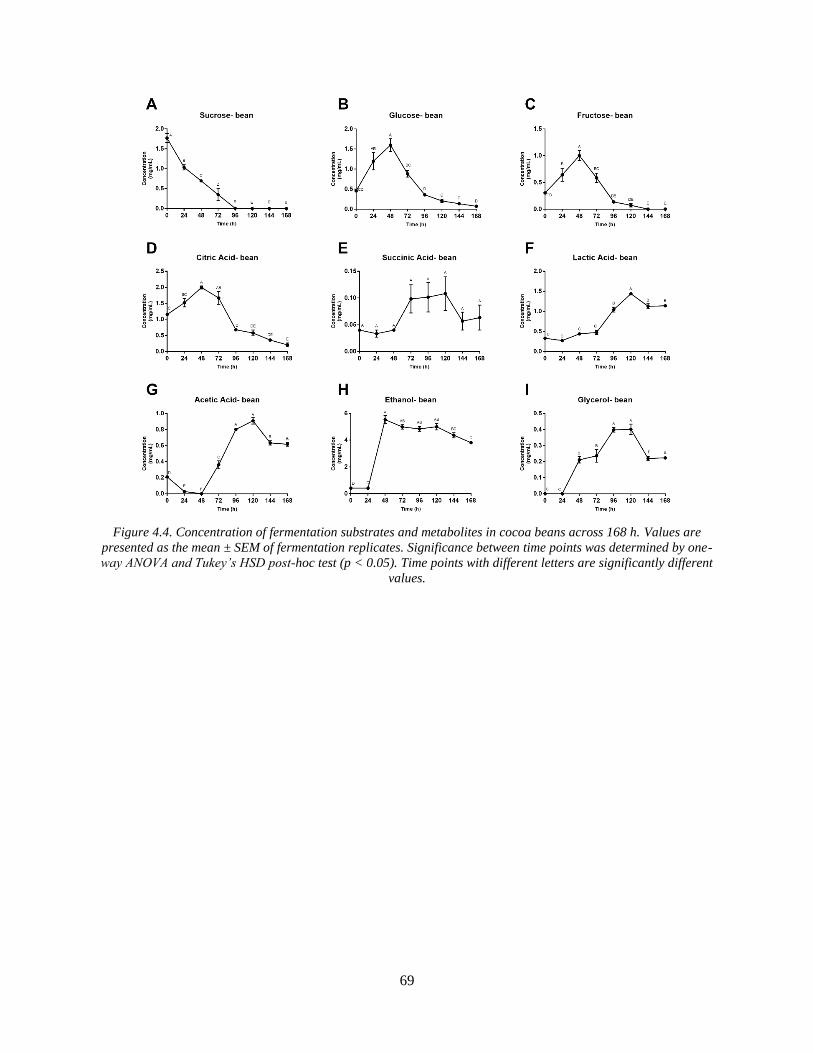
69
Figure 4.4. Concentration of fermentation substrates and metabolites in cocoa beans across 168 h. Values are
presented as the mean ± SEM of fermentation replicates. Significance between time points was determined by one-
way ANOVA and Tukey’s HSD post-hoc test (p < 0.05). Time points with different letters are significantly different
values.
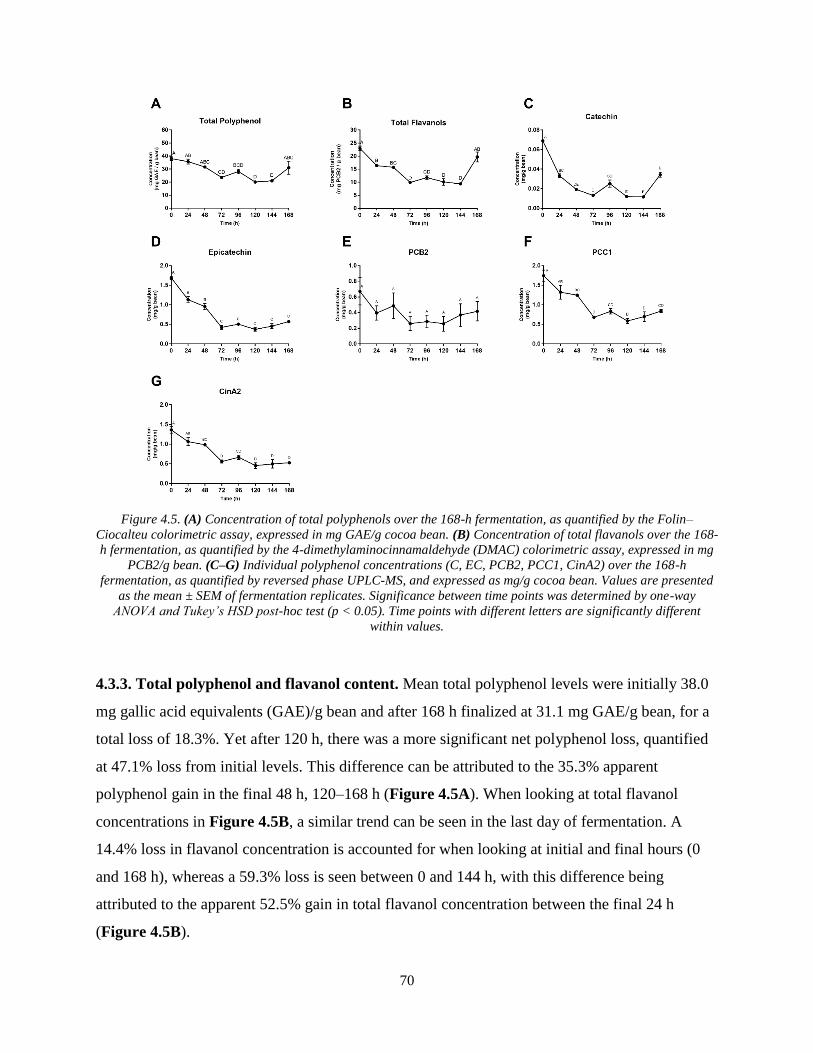
70
Figure 4.5. (A) Concentration of total polyphenols over the 168-h fermentation, as quantified by the Folin–
Ciocalteu colorimetric assay, expressed in mg GAE/g cocoa bean. (B) Concentration of total flavanols over the 168-
h fermentation, as quantified by the 4-dimethylaminocinnamaldehyde (DMAC) colorimetric assay, expressed in mg
PCB2/g bean. (C–G) Individual polyphenol concentrations (C, EC, PCB2, PCC1, CinA2) over the 168-h
fermentation, as quantified by reversed phase UPLC-MS, and expressed as mg/g cocoa bean. Values are presented
as the mean ± SEM of fermentation replicates. Significance between time points was determined by one-way
ANOVA and Tukey’s HSD post-hoc test (p < 0.05). Time points with different letters are significantly different
within values.
4.3.3. Total polyphenol and flavanol content. Mean total polyphenol levels were initially 38.0
mg gallic acid equivalents (GAE)/g bean and after 168 h finalized at 31.1 mg GAE/g bean, for a
total loss of 18.3%. Yet after 120 h, there was a more significant net polyphenol loss, quantified
at 47.1% loss from initial levels. This difference can be attributed to the 35.3% apparent
polyphenol gain in the final 48 h, 120–168 h (Figure 4.5A). When looking at total flavanol
concentrations in Figure 4.5B, a similar trend can be seen in the last day of fermentation. A
14.4% loss in flavanol concentration is accounted for when looking at initial and final hours (0
and 168 h), whereas a 59.3% loss is seen between 0 and 144 h, with this difference being
attributed to the apparent 52.5% gain in total flavanol concentration between the final 24 h
(Figure 4.5B).
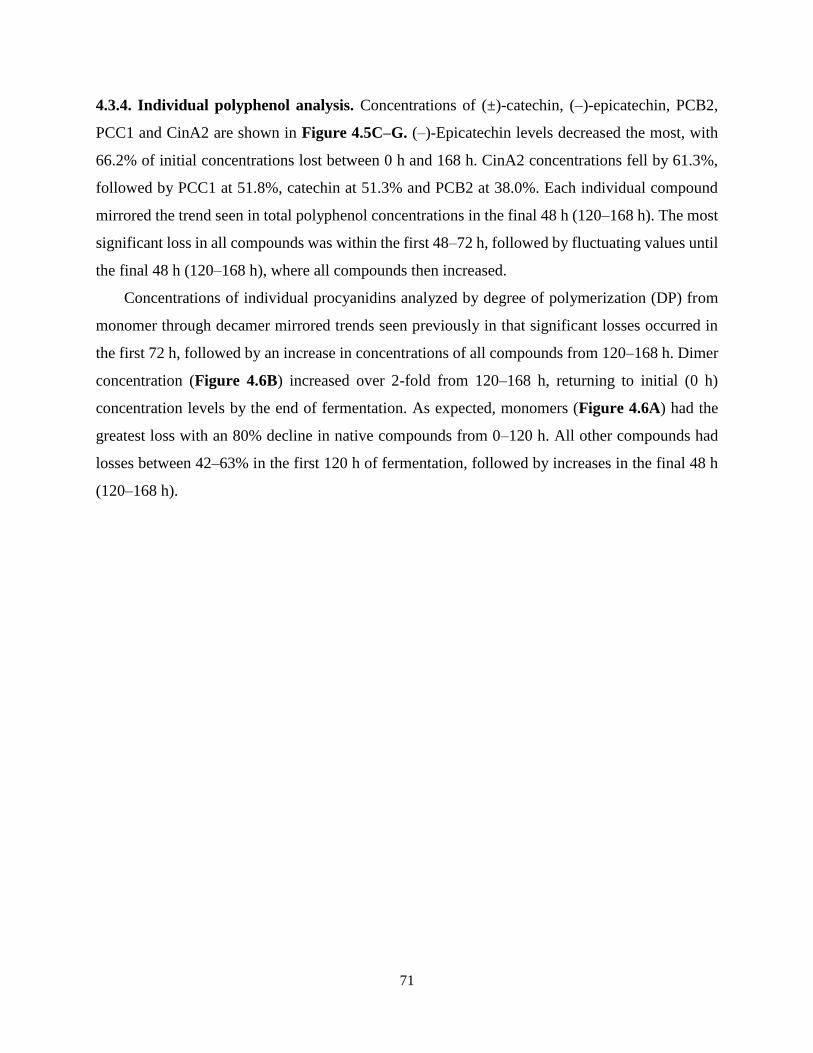
71
4.3.4. Individual polyphenol analysis. Concentrations of (±)-catechin, (–)-epicatechin, PCB2,
PCC1 and CinA2 are shown in Figure 4.5C–G. (–)-Epicatechin levels decreased the most, with
66.2% of initial concentrations lost between 0 h and 168 h. CinA2 concentrations fell by 61.3%,
followed by PCC1 at 51.8%, catechin at 51.3% and PCB2 at 38.0%. Each individual compound
mirrored the trend seen in total polyphenol concentrations in the final 48 h (120–168 h). The most
significant loss in all compounds was within the first 48–72 h, followed by fluctuating values until
the final 48 h (120–168 h), where all compounds then increased.
Concentrations of individual procyanidins analyzed by degree of polymerization (DP) from
monomer through decamer mirrored trends seen previously in that significant losses occurred in
the first 72 h, followed by an increase in concentrations of all compounds from 120–168 h. Dimer
concentration (Figure 4.6B) increased over 2-fold from 120–168 h, returning to initial (0 h)
concentration levels by the end of fermentation. As expected, monomers (Figure 4.6A) had the
greatest loss with an 80% decline in native compounds from 0–120 h. All other compounds had
losses between 42–63% in the first 120 h of fermentation, followed by increases in the final 48 h
(120–168 h).
72
Figure 4.6. Individual polyphenol concentrations by mean degree of polymerization (mDP) over the 168-h
fermentation as quantified by HILIC UPLC-MS/MS and expressed as mg/g cocoa bean. Values are presented as the
mean ± SEM of fermentation replicates. Significance between time points was determined by one-way ANOVA and
Tukey’s HSD post-hoc test (p < 0.05). Time points with different letters are significantly different within values.
4.4 DISCUSSION
The primary goal of this work was to develop and characterize a pilot-scale model cocoa
fermentation system suitable for conducting cocoa fermentation research in the absence of fresh
cocoa pods, and capable of producing sufficient quantities (tens of kg) of material for further
evaluating the impact of cocoa fermentation on putative bioactive compounds and cocoa
bioactivity in in vitro and in vivo experiments. Our model was not designed to physically mimic a
scaled-down heap fermentation, but rather to serve as a model system suitable for the study of heap
fermentation using (1) dried, unfermented beans and a simulated liquid pulp media as the starting
material, (2) ambient microbiota and (3) regular stirring. The goal was to achieve similar chemical
changes as observed in on-farm heap fermentations by putting beans in similar conditions to those
found at the center of a well-turned heap. In cocoa fermentations conducted on farms, highly
variable conditions exist between regions, countries, farms and even between specific heaps, as
73
temperature and environment play important roles in fermentation [44]. Using separate boxes
under identical conditions provided some insight into the amount of variability to expect in this
controlled model. Variability within our model was generally very minor and the metabolic
profiles were similar to those seen in heap fermentations. Although our model was consistent, the
replicate fermentations were conducted simultaneously in the same incubator. Further work is
needed to determine the consistency between batches conducted at different times and in different
incubators.
At an initial pH of 3.6, the pulp media created a favorable environment for yeasts to proliferate
within the first 48 h [12]. Citric acid was then metabolized by LAB and ethanol production
continued, increasing the pH and encouraging the growth of LAB. As lactic and acetic acids
dominated the system, pH declined (72–168 h) and bean cotyledon was penetrated to initiate bean
death, where endogenous biochemical reactions began the formation of the characteristic chocolate
flavor, and pH concluded at approximately 4.6 [45]. In heap fermentations, turning patterns are a
primary factor in pH variability. On average, heaps that are turned at least twice progress from pH
3.9–4.6 [8,12,14,34]. Our system was stirred every 12 h to mimic conditions in the center of a
well-mixed heap, and our observed pH values align with previously reported values. DO values
stabilized after 24 h as the lag phase of yeast metabolism ended. Likely due to a lack of monitoring
equipment, there are no published data regarding DO progression in heap fermentations. Moving
forward, aeration in the model could be increased to elevate DO. It would be worthwhile to monitor
DO in various on-farm fermentation systems to determine accurate values for modeling a given
system. Additionally, comparison of our measured FI values with reported values provide evidence
that sufficient fermentation can be achieved under these pilot-scale conditions. Anthocyanins and
catechin monomers polymerize during fermentation, rapidly disappearing from the bean cotyledon
[2,24]. This can also be observed in the cut test. In traditional cut tests of ≥300 beans, bean color
should uniformly progress from purple to brown throughout the fermentation, showing the effect
of polyphenol oxidase and other reactions that reduce the appearance of color within the bean.
Criollo beans have low anthocyanin levels and as such the cut test and FI for these beans does not
follow the pattern typically seen with other cultivars such as Trinitario and Forastero [46–50].
However, it is important to include these tests in reference to typical cocoa fermentation quality
checks, and future work is needed using this model with other cocoa cultivars.
74
Yeasts proliferate during the early stages of fermentation, consuming available sugars and
converting them to ethanol and carbon dioxide. Sucrose concentrations exhibited a decline in both
pulp media and bean, while pulp glucose and fructose concentrations had a 24-h lag period, and
bean concentrations of these sugars increased in the beginning hours, likely due to diffusion from
the pulp media into the bean. The early decrease in sucrose is likely due to yeast-derived invertase
that hydrolyze sucrose into glucose and fructose during the lag period, before the yeasts begin to
consume these sugars. Although sugar concentrations vary between replicates, these trends are
similar to those seen in traditional heaps [8,16,51]. Ultimately, yeasts consumed all available
substrates for growth, inducing inhibition of their own activity, and LAB began to dominate the
system with citric acid degradation, subsequently increasing pH and creating an optimal
environment for bacterial growth [52]. AAB then thrived in this newly aerobic, less-acidic
environment (48–72 h), facilitating the oxidation of ethanol to acetic acid and, further, to carbon
dioxide and water, ultimately resulting in bean death. Although the reactions that occur within the
bean itself are not well understood, reported consumption and production of metabolites during
industrial cocoa fermentation follow a similar pattern to that of the simulated pulp media in the
model system described in this study.
During the first days of fermentation, polyphenols are oxidized via polyphenol oxidase and
condense into high molecular weight tannins and other complex compounds. These reactions occur
as polyphenols, such as (–)-epicatechin, diffuse out of the bean cotyledon and into the media,
subsequently aligning with bean death [9,24]. Criollo beans have been reported to have
approximately two-thirds of the total polyphenol content of Forastero and Trinitario varieties, yet
other studies have indicated that Criollo beans have high levels of procyanidins with no significant
difference in total polyphenol content between the three main cultivars [40,53,54]. Total phenolic
content of Criollo beans is often not thoroughly analyzed, but values of 40–50 mg GAE/g have
been reported, aligning with the data presented in this study (Figure 4.5A) [53]. The most dramatic
decrease in phenolic concentrations took place in the first 72 h (Figures 4.5 and 4.6), confirming
this model system’s activity and succession of bean death, as well as representing the quick decline
of polyphenol compounds seen in Criollo bean fermentation [40]. Additionally, the observed loss
of polyphenols from raw to fermented is comparable to that of heap fermentations. The average
loss of total polyphenol content previously reported is 40–60%, which is within the range of loss
for this study [3,9,17,23,46,55,56]. Payne et al. [55] found that heap fermentation resulted in an
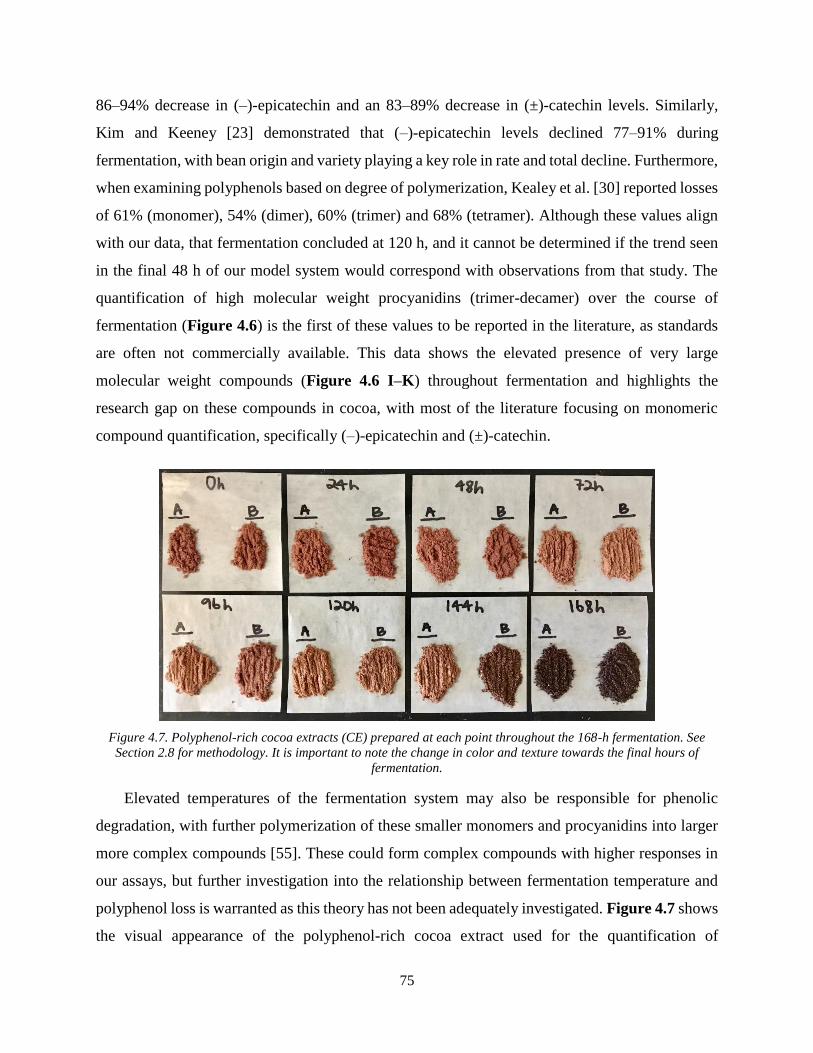
75
86–94% decrease in (–)-epicatechin and an 83–89% decrease in (±)-catechin levels. Similarly,
Kim and Keeney [23] demonstrated that (–)-epicatechin levels declined 77–91% during
fermentation, with bean origin and variety playing a key role in rate and total decline. Furthermore,
when examining polyphenols based on degree of polymerization, Kealey et al. [30] reported losses
of 61% (monomer), 54% (dimer), 60% (trimer) and 68% (tetramer). Although these values align
with our data, that fermentation concluded at 120 h, and it cannot be determined if the trend seen
in the final 48 h of our model system would correspond with observations from that study. The
quantification of high molecular weight procyanidins (trimer-decamer) over the course of
fermentation (Figure 4.6) is the first of these values to be reported in the literature, as standards
are often not commercially available. This data shows the elevated presence of very large
molecular weight compounds (Figure 4.6 I–K) throughout fermentation and highlights the
research gap on these compounds in cocoa, with most of the literature focusing on monomeric
compound quantification, specifically (–)-epicatechin and (±)-catechin.
Figure 4.7. Polyphenol-rich cocoa extracts (CE) prepared at each point throughout the 168-h fermentation. See
Section 2.8 for methodology. It is important to note the change in color and texture towards the final hours of
fermentation.
Elevated temperatures of the fermentation system may also be responsible for phenolic
degradation, with further polymerization of these smaller monomers and procyanidins into larger
more complex compounds [55]. These could form complex compounds with higher responses in
our assays, but further investigation into the relationship between fermentation temperature and
polyphenol loss is warranted as this theory has not been adequately investigated. Figure 4.7 shows
the visual appearance of the polyphenol-rich cocoa extract used for the quantification of
76
total/individual polyphenols and total flavanols. At 144 h, a change in the extract can be noted in
the color and texture. Because the four different analyses (Folin-Ciocalteu, DMAC, UPLC-MS,
UPLC-MS/MS) were performed at different times and produced similar results in terms of time-
course trends, it is unlikely that the phenolic increase in the final hours is due to human error during
analysis. An error in extract preparation is possible but also unlikely, as the appearance of the
cocoa extracts change in multiple instances. Further investigation into a wider range of compounds
is warranted to determine the cause of this phenolic increase, as it is inconsistent with any
previously reported data and there is a lack of thorough data quantifying these individual
compounds across varying degrees of fermentation. The mechanism by which these late-stage
changes occurred warrants further study. It is important to note that the specific beans used for the
curt test (Figure 4.1C) were not the same actual beans used for extraction and other assays, and
furthermore that extraction isolates and concentrates components that cannot always be visibly
observed in beans.
Although polyphenol loss may have negative implications on the overall health benefits of
cocoa, this relationship is still poorly understood. It is important to understand that these losses
correspond with the development of positive flavor profiles, and a balance must be found between
optimization of polyphenol content for health outcomes and for acceptable flavor [3]. Furthermore,
the chemistry of these losses, and the structures and bioactivity of the subsequent products, remain
to be elucidated.
Interest in controlled fermentation systems has emerged as a strategy to experimentally
manipulate cocoa fermentation on various scales in regions where cocoa does not grow. Controlled
fermentations using a model system offer reliable, reproducible methods to understand the
microbial and biochemical reactions that occur. In heap fermentations, beans and pulp are removed
directly from the pod, heaped on the ground or in wooden boxes and covered with banana leaves.
Traditional systems, while effective for cocoa production, offer little ability to implement
experimental conditions or controls to enable research on the impact of environment, materials
and fermentation management practices on outcomes of fermentation. In a controlled setting,
factors such as temperature, bulk density, relative humidity, oxygenation, microbial inoculation
and other influences can be regulated and manipulated, furthering scientific understanding of the
complex interactions occurring during cocoa fermentation. Additionally, previously published
fermentation-like model systems range in capacity from 25 beans to 1.2 kg rehydrated bean weight
77
[19,22,57]. With the capacity of our model to ferment approximately 30 kg of rehydrated cocoa
beans simultaneously, this novel pilot-scale model can produce relatively large quantities of
fermented beans in a controlled setting. Production of a larger quantity of material under controlled
experimental fermentation conditions will enable further study of the bioactivity of the resulting
cocoa, using animal feeding experiments, for example. Furthermore, this pilot-scale model
fermentation can be conducted using food-grade inputs, making it applicable to the production of
substrates for human clinical trials as well, where large amounts of material are required.
It is critical to note that the system developed in this study is intended to serve as a model
designed to replicate the chemical outcomes of cocoa fermentation, but not to physically duplicate
the heap fermentation process on a smaller scale. As such, our model aims to produce conditions
mimicking the center of a well-turned heap in simulated pulp media. Our data indicate that this
system is a reliable and controlled pilot-scale fermentation model, which replicates the outcomes
of heap fermentation with acceptable fidelity. It is important to note that cocoa fermentation varies
significantly. Our model system was not tested in the present study to mimic all possible
combinations of turning, aeration, temperature gradients or lengths of fermentation. However, the
model we describe here can be used to study such variations in a controlled environment. We are
currently expanding upon this study by introducing variables such as cool vs. hot fermentations to
generate cocoas with distinct chemical profiles for evaluating the impact of composition on health
benefits. Although our results show promise moving forward, this model is not without limitations.
The beans used were commercially available and of largely unknown origin. Although the beans
were food-grade and declared to be dried and unfermented, drying temperature and duration, as
well as the conditions between harvest and drying, are unknown. Moving forward, we will address
this limitation by obtaining dried unfermented beans from suppliers with more knowledge of the
supply chain. The impact of using dried, unfermented beans on the fidelity of our model, compared
with fermentation using fresh beans, will need to be evaluated by using a single batch of beans and
conducting fermentations using fresh beans, as well as by drying and then employing our model.
For example, early flavanol degradation by endogenous polyphenol oxidase may be impacted.
Also, aeration could be further optimized to mimic conditions at the center of a well-mixed heap
or box fermentation, or at least to gain an understanding of the effects of aeration on the chemical
changes observed. Acquiring fresh cocoa pods for use in laboratories distant from production
regions without spoilage has proven to be expensive and ineffective.
78
To summarize the novelty of the present work, several key advances have been made. First,
by using dried, unfermented beans and a simulated pulp medium instead of relying on fresh cocoa
pods, this model system will allow cocoa fermentation research to progress anywhere in the world
regardless of location, climate or season. This greatly expands the ability of researchers distant
from cocoa cultivation to control and manipulate cocoa fermentation for research purposes.
Second, the increased scale of this model system (from previous controlled lab fermentations using
tens or hundreds of grams of beans to the present model employing 2 × 15 kg beans) will facilitate
production of large amounts of custom cocoas designed specifically for animal or human clinical
studies. Both of these advances will result in expanded scope of cocoa fermentation research. Thus,
the development and characterization of this pilot-scale model system represents a promising new
and controlled method for expanding upon cocoa fermentation research.
Funding: This research was funded by USDA AFRI Grant 2017-67017-26783. Funding for this
work was also provided, in part, by the Virginia Agricultural Experiment Station and the Hatch
Program of the National Institute of Food and Agriculture, US Department of Agriculture.
Acknowledgments: The authors would like the acknowledge Qing Jin and Nicholas Poe for their
assistance with HPLC set-up and analysis.
Conflicts of Interest: The authors declare no conflict of interest.
REFERENCES
1. Andújar, I.; Recio, M.C.; Giner, R.M.; Ríos, J.L. Cocoa polyphenols and their potential
benefits for human health. Oxid. Med. Cell. Longev. 2012, 2012.
2. Wollgast, J.; Anklam, E. Review on polyphenols in Theobroma cacao: Changes in
composition during the manufacture of chocolate and methodology for identification and
quantification. Food Res. Int. 2000, 33, 423–447.
3. Camu, N.; De Winter, T.; Addo, S.K.; Takrama, J.S.; Bernaert, H.; De Vuyst, L. Fermentation
of cocoa beans: Influence of microbial activities and polyphenol concentrations on the flavour
of chocolate. J. Sci. Food Agric. 2008, 88, 2288–2297.
4. Romanens, E.; Näf, R.; Lobmaier, T.; Pedan, V.; Leischtfeld, S.F.; Meile, L.; Schwenninger,
S.M. A lab-scale model system for cocoa bean fermentation. Appl. Microbiol. Biotechnol.
2018, 102, 3349–3362.
5. Hurst, W.J.; Krake, S.H.; Bergmeier, S.C.; Payne, M.J.; Miller, K.B.; Stuart, D.A. Impact of
fermentation, drying, roasting and Dutch processing on flavan-3-ol stereochemistry in cacao
beans and cocoa ingredients. Chem. Cent. J. 2011, 5, 53.
79
6. De Taeye, C.; Bodart, M.; Caullet, G.; Collin, S. Roasting conditions for preserving cocoa
flavan‐3‐ol monomers and oligomers: Interesting behaviour of Criollo clones. J. Sci. Food
Agric. 2017, 97, 4001–4008.
7. Ioannone, F.; Di Mattia, C.D.; De Gregorio, M.; Sergi, M.; Serafini, M.; Sacchetti, G.
Flavanols, proanthocyanidins and antioxidant activity changes during cocoa (Theobroma
cacao L.) roasting as affected by temperature and time of processing. Food Chem. 2015, 174,
256–262.
8. Camu, N.; Winter, T.D.; Verbrugghe, K.; Cleenwerck, I.; Vandamme, P.; Takrama, J.S.;
Vancanneyt, M.; Vuyst, L.D. Dynamics and Biodiversity of Populations of Lactic Acid
Bacteria and Acetic Acid Bacteria Involved in Spontaneous Heap Fermentation of Cocoa
Beans in Ghana. Appl. Environ. Microbiol. 2007, 73, 1809–1824.
9. Albertini, B.; Schoubben, A.; Guarnaccia, D.; Pinelli, F.; Della Vecchia, M.; Ricci, M.; Di
Renzo, G.C.; Blasi, P. Effect of fermentation and drying on cocoa polyphenols. J. Agric. Food
Chem. 2015, 63, 9948–9953.
10. Dorenkott, M.R.; Griffin, L.E.; Goodrich, K.M.; Thompson-Witrick, K.A.; Fundaro, G.; Ye,
L.; Stevens, J.R.; Ali, M.; O’Keefe, S.F.; Hulver, M.W.; et al. Oligomeric Cocoa Procyanidins
Possess Enhanced Bioactivity Compared to Monomeric and Polymeric Cocoa Procyanidins
for Preventing the Development of Obesity, Insulin Resistance, and Impaired Glucose
Tolerance during High-Fat Feeding. J. Agric. Food Chem. 2014, 62, 2216–2227.
11. Ryan, C.M.; Khoo, W.; Ye, L.; Lambert, J.D.; O’Keefe, S.F.; Neilson, A.P. Loss of Native
Flavanols during Fermentation and Roasting Does Not Necessarily Reduce Digestive
Enzyme-Inhibiting Bioactivities of Cocoa. J. Agric. Food Chem. 2016, 64, 3616–3625.
12. Schwan, R.F.; Wheals, A.E. The Microbiology of Cocoa Fermentation and its Role in
Chocolate Quality. Crit. Rev. Food Sci. Nutr. 2004, 44, 205–221.
13. Żyżelewicz, D.; Bojczuk, M.; Budryn, G.; Zduńczyk, Z.; Juśkiewicz, J.; Jurgoński, A.; Oracz,
J. Influence of diet based on bread supplemented with raw and roasted cocoa bean extracts on
physiological indices of laboratory rats. Food Res. Int. 2018, 112, 209–216.
14. Camu, N.; González, A.; De Winter, T.; Van Schoor, A.; De Bruyne, K.; Vandamme, P.;
Takrama, J.S.; Addo, S.K.; De Vuyst, L. Influence of turning and environmental
contamination on the dynamics of populations of lactic acid and acetic acid bacteria involved
in spontaneous cocoa bean heap fermentation in Ghana. Appl. Environ. Microbiol. 2008, 74,
86–98.
15. Lefeber, T.; Gobert, W.; Vrancken, G.; Camu, N.; De Vuyst, L. Dynamics and species
diversity of communities of lactic acid bacteria and acetic acid bacteria during spontaneous
cocoa bean fermentation in vessels. Food Microbiol. 2011, 28, 457–464.
16. De Melo Pereira, G.V.; Magalhães, K.T.; de Almeida, E.G.; da Silva Coelho, I.; Schwan, R.F.
Spontaneous cocoa bean fermentation carried out in a novel-design stainless steel tank:
Influence on the dynamics of microbial populations and physical–chemical properties. Int. J.
Food Microbiol. 2013, 161, 121–133.
17. Di Mattia, C.; Sacchetti, G.; Seghetti, L.; Piva, A.; Mastrocola, D. “Vino Cotto” Composition
and Antioxidant Activity as Affected by Non Enzymatic Browning. Influenza
Dellimbrunimento non Enzimatico Sulla Compos. e Attiv. Antiossidante Vino Cotto 2007, 19,
413–424.
18. De Taeye, C.; Caullet, G.; Eyamo Evina, V.J.; Collin, S. Procyanidin A2 and Its Degradation
Products in Raw, Fermented, and Roasted Cocoa. J. Agric. Food Chem. 2017, 65, 1715–1723.
80
19. Eyamo Evina, V.J.; De Taeye, C.; Niemenak, N.; Youmbi, E.; Collin, S. Influence of acetic
and lactic acids on cocoa flavan-3-ol degradation through fermentation-like incubations. LWT
Food Sci. Technol. 2016, 68, 514–522.
20. Kadow, D.; Niemenak, N.; Rohn, S.; Lieberei, R. Fermentation-like incubation of cocoa seeds
(Theobroma cacao L.)–Reconstruction and guidance of the fermentation process. LWT Food
Sci. Technol. 2015, 62, 357–361.
21. De Melo Pereira, G.V.; Miguel, M.G.; Ramos, C.L.; Schwan, R.F. Microbiological and
Physicochemical Characterization of Small-Scale Cocoa Fermentations and Screening of
Yeast and Bacteria Strains for the Development of a Defined Starter Culture. Appl. Environ.
Microbiol. 2012, 78, 5395–5405.
22. Lee, A.H.; Neilson, A.P.; O’Keefe, S.F.; Ogejo, J.A.; Huang, H.; Ponder, M.; Chu, H.S.S.;
Jin, Q.; Pilot, G.; Stewart, A.C. A laboratory-scale model cocoa fermentation using dried,
unfermented beans and artificial pulp can simulate the microbial and chemical changes of on-
farm cocoa fermentation. Eur. Food Res. Technol. 2019, 245, 511–519.
23. Kim, H.; Keeney, P.G. (−)-Epicatechin Content in Fermented and Unfermented Cocoa Beans.
J. Food Sci. 1984, 49, 1090–1092.
24. De Brito, E.S.; García, N.H.P.; Gallão, M.I.; Cortelazzo, A.L.; Fevereiro, P.S.; Braga, M.R.
Structural and chemical changes in cocoa (Theobroma cacao L.) during fermentation, drying
and roasting. J. Sci. Food Agric. 2001, 81, 281–288.
25. Mazor Jolić, S.; Radojčić Redovniković, I.; Marković, K.; Ivanec Šipušić, Đ.; Delonga, K.
Changes of phenolic compounds and antioxidant capacity in cocoa beans processing. Int. J.
Food Sci. Technol. 2011, 46, 1793–1800.
26. Tomas-Barberan, F.A.; Cienfuegos-Jovellanos, E.; Marin, A.; Muguerza, B.; Gil-Izquierdo,
A.; Cerda, B.; Zafrilla, P.; Morillas, J.; Mulero, J.; Ibarra, A.; et al. A new process to develop
a cocoa powder with higher flavonoid monomer content and enhanced bioavailability in
healthy humans. J. Agric. Food Chem. 2007, 55, 3926–3935.
27. Cienfuegos-Jovellanos, E.; Quiñones, M.D.; Muguerza, B.; Moulay, L.; Miguel, M.;
Aleixandre, A. Antihypertensive effect of a polyphenol-rich cocoa powder industrially
processed to preserve the original flavonoids of the cocoa beans. J. Agric. Food Chem. 2009,
57, 6156–6162.
28. Stahl, L.; Miller, K.B.; Apgar, J.; Sweigart, D.S.; Stuart, D.A.; McHale, N.; Ou, B.; Kondo,
M.; Hurst, W.J. Preservation of cocoa antioxidant activity, total polyphenols, flavan‐3‐ols, and
procyanidin content in foods prepared with cocoa powder. J. Food Sci. 2009, 74, C456–C461.
29. Kealey, K.S.; Snyder, R.M.; Romanczyk, L.J., Jr.; Geyer, H.M.; Myers, M.E.; Whitacre, E.J.;
Hammerstone, J.F., Jr.; Schmitz, H.H. Cocoa Components, Edible Products Having Enriched
Polyphenol Content, Methods of Making Same and Medical Uses. U.S. Patent No. 6,312,753,
6 November 2001.
30. Kealey, K.S.; Snyder, R.M.; Romanczyk, L.J., Jr.; Hammerstone, J.F., Jr.; Buck, M.M.;
Cipolla, G.G. Foods Containing Cocoa Solids Having High Cocoa Polyphenol Contents. U.S.
Patent No. 6,372,267, 16 April 2002.
31. Zapp, L.; Slaga, T.J.; Zhao, J.; Lang, M. Method for Enhancing Post-Processing Content of
Beneficial Compounds in Foodstuffs Made with Cocoa Beans. U.S. Patent No. 6,660,322, 9
December 2003.
32. García-Alamilla, P.; Salgado-Cervantes, M.A.; Barel, M.; Berthomieu, G.; Rodríguez-
Jimenes, G.C.; García-Alvarado, M.A. Moisture, acidity and temperature evolution during
cacao drying. J. Food Eng. 2007, 79, 1159–1165.
81
33. Jinap, S.; Thien, J.; Yap, T.N. Effect of drying on acidity and volatile fatty acids content of
cocoa beans. J. Sci. Food Agric. 1994, 65, 67–75.
34. Nielsen, D.S.; Teniola, O.D.; Ban-Koffi, L.; Owusu, M.; Andersson, T.S.; Holzapfel, W.H.
The microbiology of Ghanaian cocoa fermentations analysed using culture-dependent and
culture-independent methods. Int. J. Food Microbiol. 2007, 114, 168–186.
35. Gálvez, S.L.; Loiseau, G.; Paredes, J.L.; Barel, M.; Guiraud, J.-P. Study on the microflora and
biochemistry of cocoa fermentation in the Dominican Republic. Int. J. Food Microbiol. 2007,
114, 124–130.
36. Guehi, S.T.; Dabonne, S.; Ban-Koffi, L.; Kedjebo, D.K.; Zahouli, G.I.B. Effect of turning
beans and fermentation method on the acidity and physical quality of raw cocoa beans. Adv.
J. Food Sci. Technol. 2010, 2, 163–171.
37. Hansen, C.E.; del Olmo, M.; Burri, C. Enzyme activities in cocoa beans during fermentation.
J. Sci. Food Agric. 1998, 77, 273–281.
38. Ho, V.T.T.; Zhao, J.; Fleet, G. Yeasts are essential for cocoa bean fermentation. Int. J. Food
Microbiol. 2014, 174, 72–87.
39. Schwan, R.F. Cocoa fermentations conducted with a defined microbial cocktail inoculum.
Appl. Environ. Microbiol. 1998, 64, 1477–1483.
40. Elwers, S.; Zambrano, A.; Rohsius, C.; Lieberei, R. Differences between the content of
phenolic compounds in Criollo, Forastero and Trinitario cocoa seed (Theobroma cacao L.).
Eur. Food Res. Technol. 2009, 229, 937–948.
41. Romero-Cortes, T.; Salgado-Cervantes, M.A.; García-Alamilla, P.; García-Alvarado, M.A.;
del C Rodríguez-Jimenes, G.; Hidalgo-Morales, M.; Robles-Olvera, V. Relationship between
fermentation index and other biochemical changes evaluated during the fermentation of
Mexican cocoa (Theobroma cacao) beans. J. Sci. Food Agric. 2013, 93, 2596–2604.
42. Harborne, J. Spectral methods of characterizing anthocyanins. Biochem. J. 1958, 70, 22.
43. Racine, K.C.; Lee, A.H.; Stewart, A.C.; Blakeslee, K.W.; Neilson, A.P. Development of a
rapid ultra performance hydrophilic interaction liquid chromatography tandem mass
spectrometry method for procyanidins with enhanced ionization efficiency. J. Chromatogr. A
2019, doi:10.1016/j.chroma.2019.02.007.
44. Wollgast, J.; Anklam, E. Polyphenols in chocolate: Is there a contribution to human health?
Food Res. Int. 2000, 33, 449–459.
45. Ardhana, M.M.; Fleet, G.H. The microbial ecology of cocoa bean fermentations in Indonesia.
Int. J. Food Microbiol. 2003, 86, 87–99.
46. Nazaruddin, R.; Seng, L.K.; Hassan, O.; Said, M. Effect of pulp preconditioning on the content
of polyphenols in cocoa beans (Theobroma cacao) during fermentation. Ind. Crops Prod.
2006, 24, 87–94.
47. Emmanuel, O.A.; Jennifer, Q.; Agnes, S.B.; Jemmy, S.T.; Firibu, K.S. Influence of pulp-
preconditioning and fermentation on fermentative quality and appearance of Ghanaian cocoa
(Theobroma cacao) beans. Int. Food Res. J. 2012, 19, 127–133.
48. Selamat, J.; Mordingah Harun, S. Formation of methyl pyrazine during cocoa bean
fermentation. Pertanika 1994, 17, 27–27.
49. Misnawi, S.; Jamilah, B.; Nazamid, S. Effects of incubation and polyphenol oxidase
enrichment on colour, fermentation index, procyanidins and astringency of unfermented and
partly fermented cocoa beans. Int. J. Food Sci. Technol. 2003, 38, 285–295.
82
50. Oracz, J.; Nebesny, E.; Żyżelewicz, D. Changes in the flavan-3-ols, anthocyanins, and
flavanols composition of cocoa beans of different Theobroma cacao L. groups affected by
roasting conditions. Eur. Food Res. Technol. 2015, 241, 663–681.
51. Da Veiga Moreira, I.M.; Miguel, M.G.; Duarte, W.F.; Dias, D.R.; Schwan, R.F. Microbial
succession and the dynamics of metabolites and sugars during the fermentation of three
different cocoa (Theobroma cacao L.) hybrids. Food Res. Int. 2013, 54, 9–17.
52. Vuyst, L.D.; Weckx, S. The cocoa bean fermentation process: From ecosystem analysis to
starter culture development. J. Appl. Microbiol. 2016, 121, 5–17.
53. Oracz, J.; Zyzelewicz, D.; Nebesny, E. The Content of Polyphenolic Compounds in Cocoa
Beans (Theobroma cacao L.), Depending on Variety, Growing Region, and Processing
Operations: A Review. Crit. Rev. Food Sci. Nutr. 2015, 55, 1176–1192.
54. Saltini, R.; Akkerman, R.; Frosch, S. Optimizing chocolate production through traceability:
A review of the influence of farming practices on cocoa bean quality. Food Control 2013, 29,
167–187.
55. Payne, M.J.; Hurst, W.J.; Miller, K.B.; Rank, C.; Stuart, D.A. Impact of Fermentation, Drying,
Roasting, and Dutch Processing on Epicatechin and Catechin Content of Cacao Beans and
Cocoa Ingredients. J. Agric. Food Chem. 2010, 58, 10518–10527.
56. Aikpokpodion, P.E.; Dongo, L.N. Effects of fermentation intensity on polyphenols and
antioxidant capacity of cocoa beans. Int. J. Sustain. Crop Prod. 2010, 5, 66–70.
57. De Taeye, C.; Eyamo Evina, V.J.; Caullet, G.; Niemenak, N.; Collin, S. Fate of anthocyanins
through cocoa fermentation. Emergence of new polyphenolic dimers. J. Agric. Food Chem.
2016, 64, 8876–8885.
83
CHAPTER 5. Modulation of α-glucosidase activity results from changes in flavanol mean
degree of polymerization imparted through controlled fermentation and roasting
Kathryn C. Racine, Brian D. Wiersema, Laura E. Griffin, Lauren A. Essenmacher, Amy N.
Moore, Andrew H. Lee, Joshua D. Lambert, Amanda C. Stewart, Andrew P. Neilson
Submitted to Molecular Nutrition and Food Research
ABSTRACT
Scope
We investigated whether cocoa processing parameters (fermentation and roasting
time/temperature) influenced the α-glucosidase inhibitory activity of cocoa powders.
Methods and results
Raw unfermented cocoa beans were fermented using a pilot scale fermentation system, roasted,
and then winnowed, ground, and pressed to produce cocoa powders with different combinations
of fermentation [unfermented, cool (max 46°C) or hot fermentation (max 60°C)] and roasting
[not roasted, cool (120°C) or hot roasted (170°C)]. Powders were chemically characterized and
assessed for α-glucosidase inhibitory activity. Low and high molecular weight fractions (8-10
kDa cutoff) were produced from cocoa powder extracts of each treatment. Cocoa processing
(fermentation/roasting) contributed to significant (p<0.05) losses of native flavanols. Hot
roasting had the greatest impact on flavanol degradation, yet resulted in flavanols with the
highest mean degree of polymerization (mDP). All powder treatments dose-dependently
inhibited α-glucosidase enzyme activity, with cool fermented/cool roasted powder exhibiting the
best inhibition of α-glucosidase at the lowest IC50 of 62.2 µg/mL. A strong correlation (R=
−0.882) was observed between increasing flavanol mDP and decreasing IC50 values, indicating
that flavanol polymerization is a marker of enhanced α-glucosidase inhibition.
Conclusions
Our data demonstrate that cocoa powders are potent inhibitors of α-glucosidase activity.
Significant reduction in total polyphenol and flavanol concentrations induced by processing does
not necessarily dictate reduced enzyme activity, but rather these steps can actually enhance cocoa
bioactivity.
84
5.1 INTRODUCTION
Cocoa beans (Theobroma cacao) are highly concentrated dietary sources of flavanols-
compounds thought to be responsible for many bioactive properties of cocoa, such as
antitumorigenic, antimutagenic, anti-inflammatory, and antioxidant capacity [1–5]. Native
flavanols in cocoa beans are approximately 58% procyanidins, or flavanol oligomers and
polymers (monomeric residues linked via 4→β6 or 4→β8 bonds [6]. The major monomeric
flavanols in cocoa are (−)-epicatechin and (+)-catechin [roasting epimerizes (+)-catechin to (−)-
catechin]. Additionally, cocoa beans contain other bioactives such as lipids, fiber, lignins,
melanoidins (after roasting), methylxanthines, and other complex compounds that have not been
extensively characterized in cocoa. Depending on variety, beans contain approximately 55% fat,
16% fiber, 10% protein, and 3% ash [7]. Because of the complex reactions that occur during
cocoa processing, the health benefits associated with dietary cocoa are likely due to multiple
bioactives and their interactions, not one compound or class of compounds [8].
After harvesting, cocoa beans undergo a series of processing steps (fermentation, drying,
roasting, winnowing and various other process that may include pressing or alkalization) to
produce a final product such as cocoa powder or chocolate, and these processing steps will
largely determine chemical composition of the product. Fermentation is the first step in cocoa
processing and traditionally occurs in wooden boxes or heaps on the ground, covered with
banana leaves. Ambient microorganisms initiate a series of biochemical transformations,
developing important flavor, aroma, and color precursors within the beans. Fermentation results
in 0-70% loss of total polyphenols (similar losses for the flavanol subclass), followed by an
additional 15-40% loss during drying and roasting [9–11]. Roasting is dependent upon time and
temperature, with times varying from 5-120 min at 120-150°C, and is responsible for the
development of characteristic aroma, color, and texture of cocoa [12]. During this heat treatment,
non-enzymatic browning reactions can occur between native cocoa polyphenols and mono- or
polysaccharides, proteins and amino acids to produce Maillard reaction products (melanoidins)
[6]. Beans can be roasted whole or as nibs, and winnowing, or separating the husks from the nib,
can be done prior to or following roasting. The roasted nibs are then ground at elevated
temperatures to produce a cocoa liquor and then pressed to separate fat (cocoa butter) from cake,
approximately 58% of the total liquor [12]. The cocoa cake is then ground into a homogenous
85
powder to be used in a variety of finished products. Chemical reactions during cocoa processing
alter the structure and reduce measured levels of flavanols, and the accepted paradigm is that
preservation of the native flavanols is critical for retaining bioactivity [9, 11, 13]. It is possible,
however, that reactions occurring throughout processing may generate compounds with novel
activities such as lignin-like complexes and melanoidins, potentially preserving or even
enhancing bioactivity compared to the raw cocoa bean [9, 14–22]. Due to analytical challenges
such as lack of authentic standards, complexity and size of potential products, low bioavailability
of large complex compounds, and the continued focus of researchers on small monomeric
flavanols, the levels and activities of these large, complex and diverse compounds are largely
unknown.
In the human body, flavanols have highly variable systemic bioavailability, with
absorption being inversely proportional to molecular weight and ~0% absorption for compounds
≥ tetramer [23–27]. Due to this poor absorption, cocoa is an ideal food for the delivery of these
bioactive compounds to the GI tract. Although this limits the activity of native flavanols in the
peripheral tissues, delivery to the gut lumen and epithelial surface is high and not subject to
various barriers and processes that reduce flavanol activity, ultimately exposing the gut to
elevated levels of native unmetabolized flavanols and flavanol processing products. Bioactivity
exerted within the lumen of the gut plays a potential role in mitigation and prevention of obesity
and related chronic conditions, such as type 2 diabetes mellitus, dyslipidemia, and cardiovascular
disease. Specifically, inhibition of gut digestive enzymes to limit macronutrient digestion is a
promising mode of bioactivity that does not require systemic bioavailability. Cocoa and cocoa
flavanols inhibit lipases, -amylase and -glucosidase; with -glucosidase appearing to be the
most affected enzyme based on reported IC50 values [15, 28]. α-glucosidase is a brush border
enzyme that hydrolyzes starch and maltose into absorbable glucose [29]. Inhibition of -
glucosidase is a potential strategy to inhibit or slow blood glucose absorption in the context of
glucose intolerance/hyperglycemia. Commercially available α-glucosidase inhibitors, such as
acarbose, miglitol, and voglibose, come with high prices and various side effects (such as GI
discomfort), therefore warranting the investigation of dietary flavonoids (from berries, red wine,
green tea, cocoa, etc.) as potential inhibitors [19]. While procyanidins are effective -
glucosidase inhibitors, recently we found that various cocoas were effective inhibitors of α-
glucosidase despite large reductions in flavanols as a result of fermentation and roasting [15].
86
These results challenge the existing idea that the presence of native flavonoids is responsible for
all bioactivity and therefore warrant further investigation into the factors that determine -
glucosidase inhibition. Specifically, the impact of cocoa processing on subsequent bioactivity,
and the identification of non-flavanol cocoa components with bioactivity are of interest.
Fermentation and roasting are the most universally applicable steps in cocoa processing
that can be manipulated in order to produce a final product with variable flavanol compositions.
Due to the poor documentation and varying practices of fermentation, a controlled model pilot-
scale fermentation is necessary in order to conduct research regarding the impact of fermentation
and further processing on bean composition and subsequently bioactivity [12, 30, 31].
Furthermore, cocoa powder is a widely consumed commodity worldwide and the harvesting of
beans is essential to the economic prosperity of many developing countries. The main objectives
of this work were to 1) evaluate the effect of extremes in fermentation temperature and roasting
temperature on the chemical composition of cocoa beans and cocoa powder, 2) determine how
fermentation and roasting affect α-glucosidase inhibitory activity of cocoa powder, and 3)
identify compositional factors and processing conditions that optimize α-glucosidase inhibitory
activity of cocoa. The end goal of this research is to develop processing approaches to maximize
the health protective activities of dietary cocoa powder.
5.2 MATERIALS AND METHODS
5.2.1 Chemicals and standards. Raw unfermented cocoa beans, sourced from Hispaniola, were
provided by Cargill, Inc. (Wayzata, MN). Although not confirmed, the researchers believe the
beans to be of the Criollo variety. Beans were stored in burlap sacks at 3.5°C prior to use. LC-
MS grade acetonitrile (ACN), methanol (MeOH), citric acid, yeast extract, malt extract, calcium-
lactate pentahydride, tween 80, sodium hydroxide, magnesium sulfate heptahydride, manganese
sulfate monohydride, sucrose, glucose, fructose, calcium carbonate, agar and water were
obtained from Thermo-Fisher Scientific (Waltham, MA). Glacial acetic acid, methanol, and
acetone were obtained from VWR (Radnor, PA). Standards of (−)-epicatechin (EC), (±)-catechin
(C), and procyanidin B2 (PCB2) were obtained from ChromaDex (Irving, CA). Standards of
procyanidin C1 (PCC1), cinnamtannin A2 (CinA2), and DP 5-9 purified from cocoa (purity: DP
3-5: 93-99%, DP6-9: 80-92%) were obtained from Planta Analytica (New Milford, CT).
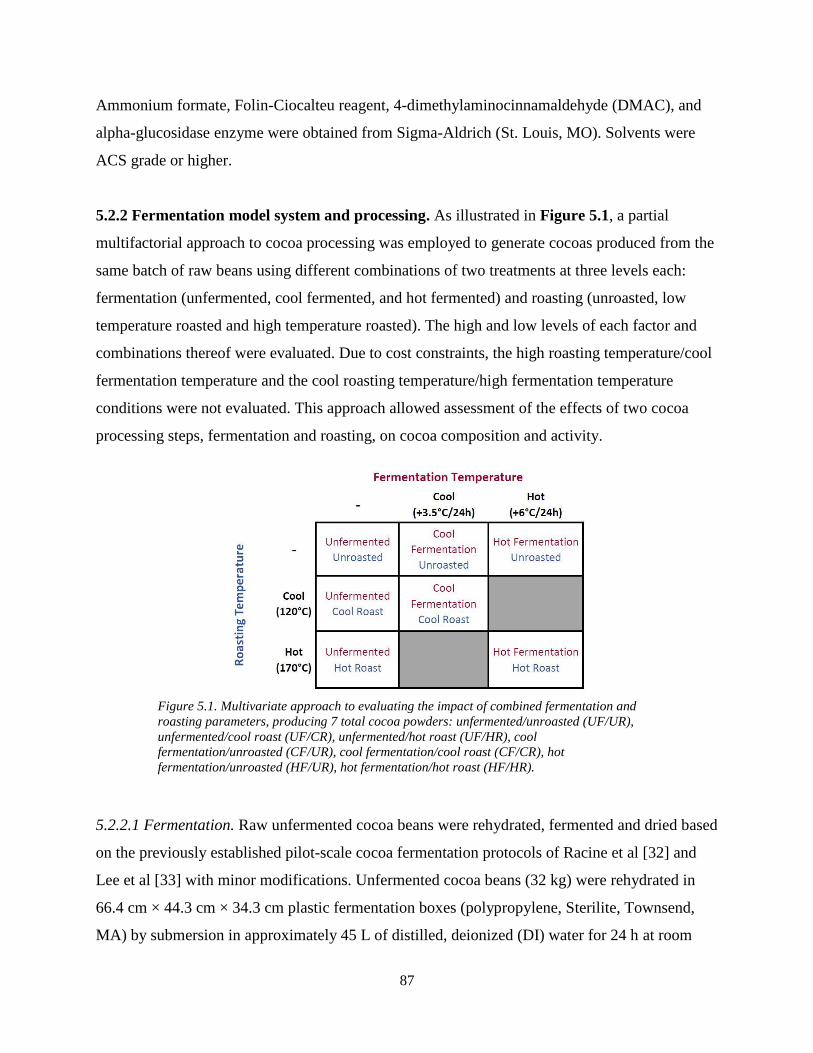
87
Ammonium formate, Folin-Ciocalteu reagent, 4-dimethylaminocinnamaldehyde (DMAC), and
alpha-glucosidase enzyme were obtained from Sigma-Aldrich (St. Louis, MO). Solvents were
ACS grade or higher.
5.2.2 Fermentation model system and processing. As illustrated in Figure 5.1, a partial
multifactorial approach to cocoa processing was employed to generate cocoas produced from the
same batch of raw beans using different combinations of two treatments at three levels each:
fermentation (unfermented, cool fermented, and hot fermented) and roasting (unroasted, low
temperature roasted and high temperature roasted). The high and low levels of each factor and
combinations thereof were evaluated. Due to cost constraints, the high roasting temperature/cool
fermentation temperature and the cool roasting temperature/high fermentation temperature
conditions were not evaluated. This approach allowed assessment of the effects of two cocoa
processing steps, fermentation and roasting, on cocoa composition and activity.
5.2.2.1 Fermentation. Raw unfermented cocoa beans were rehydrated, fermented and dried based
on the previously established pilot-scale cocoa fermentation protocols of Racine et al [32] and
Lee et al [33] with minor modifications. Unfermented cocoa beans (32 kg) were rehydrated in
66.4 cm × 44.3 cm × 34.3 cm plastic fermentation boxes (polypropylene, Sterilite, Townsend,
MA) by submersion in approximately 45 L of distilled, deionized (DI) water for 24 h at room
Figure 5.1. Multivariate approach to evaluating the impact of combined fermentation and
roasting parameters, producing 7 total cocoa powders: unfermented/unroasted (UF/UR),
unfermented/cool roast (UF/CR), unfermented/hot roast (UF/HR), cool
fermentation/unroasted (CF/UR), cool fermentation/cool roast (CF/CR), hot
fermentation/unroasted (HF/UR), hot fermentation/hot roast (HF/HR).
88
temperature. The final moisture content of the beans after rehydration was between 35-50% (IR-
120 Moisture Analyzer, Denver Instrument, Bohemia, NY). Rehydrated beans were then drained
and 60 kg were mixed with 60 L of simulated pulp media (3 replicate fermentation boxes per
fermentation batch; approximately 20 kg rehydrated beans and 20 L simulated pulp media per
box). For preparation of simulated pulp medium, three solutions were prepared separately and
combined with the rehydrated beans to begin fermentation. Solution A consisted of citric acid
(10 g/L), yeast extract (5 g/L), peptone (5 g/L), calcium lactate-pentahydride (1 g/L), and tween
80 (1 mL/L). pH was adjusted to 3.6 using 1 N NaOH and then autoclaved (121°C, 15 min) for a
total of 36 L. Solution B was an 18 L sugar solution of sucrose (83.3 g/L), glucose (133.3 g/L),
and fructose (150 g/L), autoclaved and cooled prior to fermentation. Solution C was prepared the
day of fermentation and consisted of magnesium sulfate heptahydride (1 g/L) and manganese
sulfate monohydride (0.4 g/L) for a total of 6 L. Boxes were loosely covered with their plastic
lids and placed inside a pre-heated (25°C) incubator (Forma 29 cu ft Reach-In-Incubator, Model
No. 3950, Thermo Fisher Scientific, Waltham, MA).
In total, four fermentation runs were conducted, two cool fermentation runs and two hot
fermentation runs. Each fermentation run continued for a total duration of 168 h. For each run,
the material was fermented in three separate boxes within this same incubator, with 20 kg
rehydrated beans and 20 L simulated pulp in each box. The incubator set point was raised 3.5
°C/24 h for the cool fermentation runs and 6°C/24 h for the hot fermentation runs, to final
temperatures of 46°C (cool) and 60°C (hot) (Figure 5.1). For all boxes in all fermentation runs,
beans were manually agitated for 5 min every 8 h to ensure that the simulated pulp media was
well-mixed and properly aerated. Pulp dissolved oxygen (DO) and pH values were monitored
using benchtop meters (Orion DO Probe 083005MD; Orion Versa Star Pro pH meter; Thermo
Fisher Scientific). After 168 h of fermentation, the beans were drained to remove the remaining
simulated pulp media, spread evenly onto baking sheets and oven dried (Rational, Germany;
Blodgett, Burlington, VT) at 65.5°C until the moisture content fell below 8%. After drying, all
beans from both cool fermentation runs were thoroughly commingled to mix all batches/boxes
and stored at 3.5°C until roasting, and the same was done for all beans from both hot
fermentation runs. The beans subjected to the unfermented treatment were rehydrated, drained,
and immediately oven dried according to the procedures above.
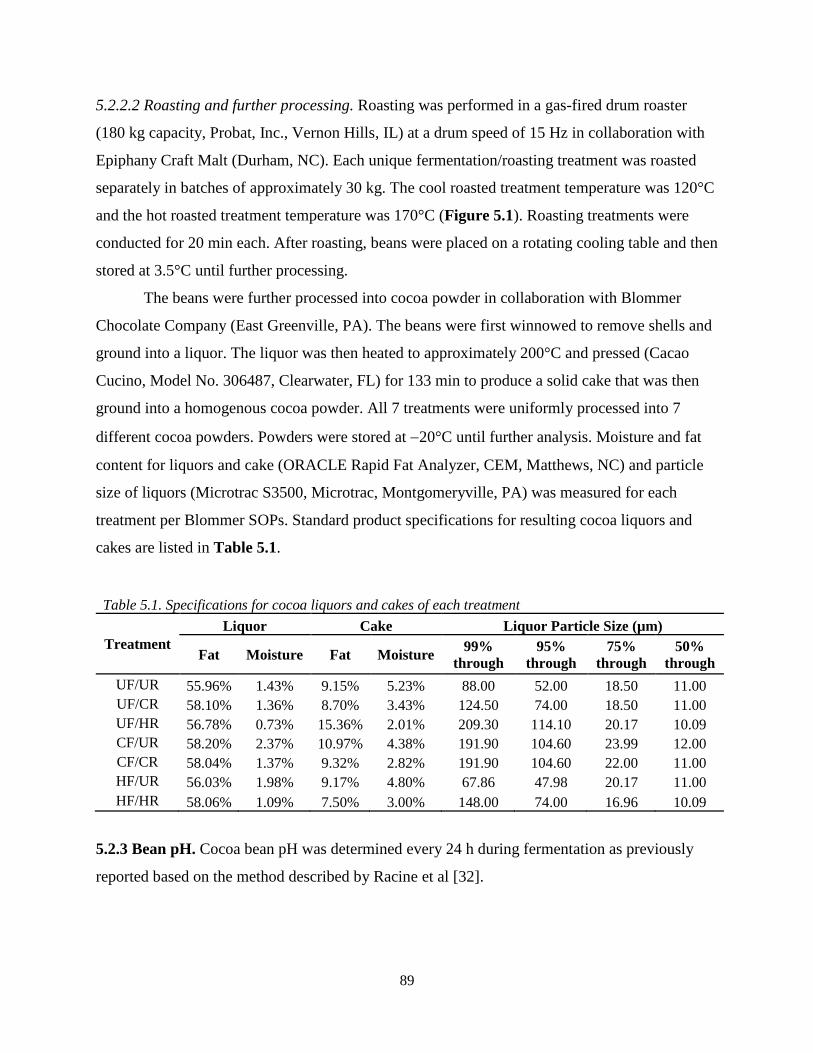
89
5.2.2.2 Roasting and further processing. Roasting was performed in a gas-fired drum roaster
(180 kg capacity, Probat, Inc., Vernon Hills, IL) at a drum speed of 15 Hz in collaboration with
Epiphany Craft Malt (Durham, NC). Each unique fermentation/roasting treatment was roasted
separately in batches of approximately 30 kg. The cool roasted treatment temperature was 120°C
and the hot roasted treatment temperature was 170°C (Figure 5.1). Roasting treatments were
conducted for 20 min each. After roasting, beans were placed on a rotating cooling table and then
stored at 3.5°C until further processing.
The beans were further processed into cocoa powder in collaboration with Blommer
Chocolate Company (East Greenville, PA). The beans were first winnowed to remove shells and
ground into a liquor. The liquor was then heated to approximately 200°C and pressed (Cacao
Cucino, Model No. 306487, Clearwater, FL) for 133 min to produce a solid cake that was then
ground into a homogenous cocoa powder. All 7 treatments were uniformly processed into 7
different cocoa powders. Powders were stored at −20°C until further analysis. Moisture and fat
content for liquors and cake (ORACLE Rapid Fat Analyzer, CEM, Matthews, NC) and particle
size of liquors (Microtrac S3500, Microtrac, Montgomeryville, PA) was measured for each
treatment per Blommer SOPs. Standard product specifications for resulting cocoa liquors and
cakes are listed in Table 5.1.
Table 5.1. Specifications for cocoa liquors and cakes of each treatment
Treatment
Liquor Cake Liquor Particle Size (µm)
Fat Moisture Fat Moisture 99%
through
95%
through
75%
through
50%
through
UF/UR 55.96% 1.43% 9.15% 5.23% 88.00 52.00 18.50 11.00
UF/CR 58.10% 1.36% 8.70% 3.43% 124.50 74.00 18.50 11.00
UF/HR 56.78% 0.73% 15.36% 2.01% 209.30 114.10 20.17 10.09
CF/UR 58.20% 2.37% 10.97% 4.38% 191.90 104.60 23.99 12.00
CF/CR 58.04% 1.37% 9.32% 2.82% 191.90 104.60 22.00 11.00
HF/UR 56.03% 1.98% 9.17% 4.80% 67.86 47.98 20.17 11.00
HF/HR 58.06% 1.09% 7.50% 3.00% 148.00 74.00 16.96 10.09
5.2.3 Bean pH. Cocoa bean pH was determined every 24 h during fermentation as previously
reported based on the method described by Racine et al [32].
90
5.2.4 Cut test. A representative cut test was performed on a sample of whole beans from each of
the four fermentation runs (2 cool batches, 2 hot batches). Beans (6) from each 24 h sampling
period (0-168 h) were cut through the middle lengthwise so that color and quality could be
assessed. This test is a standard assessment of post-fermentation bean quality and suitability to
move forward in processing [34, 35].
5.2.5 Fermentation index. Cocoa bean fermentation index (FI) was measured every 24 h during
fermentation based on the method of Romero-Cortes el al [36] with minor modifications.
Randomly selected whole cocoa beans (3-5 beans) were frozen with liquid nitrogen and ground
into a powder in an electric spice grinder. The powder (50 mg) was mixed with 5 mL MeOH
HCl (97:3 v/v) and extracted at 4°C for 16-18 h on a rotating platform. Samples were then
centrifuged (5 min, 3500 × g), supernatant collected (300 µL), and absorbance measured at 460
nm and 530 nm using a 96-well microplate. The FI was calculated using the equation below and
all analyses were performed in analytical triplicate.
𝐹𝐼 =𝐴460
𝐴530
5.2.6 Polyphenol extraction and characterization. Polyphenol rich extracts were made from
raw beans, the fermented cocoa beans (cocoa bean extract, CBE) and powders (cocoa powder
extract, CPE) for all seven treatments as described previously [15, 32, 37]. Total phenolic
content of the freeze dried cocoa extracts was approximated by the Folin-Ciocalteu colorimetric
assay and total flavanols measured by the 4-dimethylaminocinnamaldehyde (DMAC)
colorimetric assay, as previously described in Dorenkott et al [14]. These values were expressed
in mg Gallic Acid Equivalents (mg GAE)/g bean and mg PCB2/g bean, respectively. The mean
degree of polymerization (mDP) of the flavanols was determined using a thiolysis method based
on the protocol of Dorenkott et al [14] with minor modifications. Cocoa monomeric flavanols
and procyanidins (DP 1-10) were quantified by HILIC UPLC-MS/MS as previously described
based on the method of Racine et al[38] . Refer to Appendix A for full methodological details.
5.2.7 Melanoidin dialysis. The dialysis method proposed by Sacchetti et al [39] was followed
with modifications to fraction high and low molecular weight (HMW, LMW) CPE fractions.
91
CPE was re-dissolved in extraction solution (70:28:2 acetone, water, acetic acid) at a
concentration of 40 mg/mL. Dialysis was performed in triplicate using acidified methanol: water
(60:40, 0.1% formic acid) as the dialysis solvent. For each replicate, 2.5 mL of dissolved CPE
was placed inside presoaked dialysis tubing (8-10 kDa MW cutoff, Spectrum Spectra/Por
Biotech-Grade RC Dialysis, Fisher) and clipped closed. This MW cutoff was chosen based on
preliminary data showing that the majority of early, intermediate, and final Maillard reaction
products (MRP) are eluted from the 3.5-5 kDa and 8-10 kDa tubing, with very little in 20 kDa,
followed by a significant increase in 50 kDa (see Appendix A). The tubing was then submerged
in 250 mL of dialysis solvent and the beaker was stirred at 4°C for 24 h. Dialysis beakers were
continually sparged with nitrogen throughout the process. Following the 24 h dialysis period, the
250 mL dialysis solvent outside the tubing and the CPE components remaining within the tubing
were separately rotary evaporated at 55°C, frozen at −80°C, and then freeze dried. Following
freeze drying, solids were weighed, and yield was calculated.
To selectively quantify melanoidins, each dialysate (˂8-10 kDa) was resolubilized in 0.05
M H2SO4 to a concentration of 0.15625 (early MRP), 2.5 mg/mL (intermediate MRP), and 5
mg/mL (late MRP). The non-dialyzable CPE (>8-10 kDa) were resolubilized in 0.05 M H2SO4 to
a concentration of 0.15625 mg/mL (early MRP), 2.5-1.25 mg/mL (intermediate MRP), and 2.5
mg/mL (late MRP). Starting CPE at 40 mg/mL was freshly made with extraction solution and
diluted with 0.05 M H2SO4 0.15626 mg/mL (early MRP), 2.5-1.25 mg/mL (intermediate MRP),
and 10 mg/mL (late MRP). A standard curve was prepared with quinine sulfate dissolved in 0.05
M H2SO4 (1-1000 ppm). Each diluted dialysate, non-dialyzable CPE, starting CPE, and standard
was transferred (300 µL) into a UV-Star 96-well plate. The absorbance was read at 280 nm, 360
nm, and 420 nm, and early (280 nm), intermediate (360 nm) and late (420 nm) MR products
(MRP) quantified based on the standard curve. Due to the lack of standard response at 420 nm,
late MRP are reported as absolute absorbance values (single dilution used for each fraction to
facilitate direct comparisons of absorbances: 5 mg/mL (<8-10 kDa), 2.5 mg/mL (>8-10 kDa),
and 10 mg/mL (unfractionated CPE).
5.2.8 Three stage in vitro digestion. In order to determine digestively stable and soluble
compounds (i.e. diffusible across the unstirred water layer), cocoa powders from all treatments
were digested in vitro in three phases (oral, gastric, and intestinal) protocol as described by Li et
92
al [40] with modifications. Each cocoa powder (10 g) was diluted to a final volume of 500 mL.
After the intestinal phase, the final digesta was divided into 2-250 mL aliquots. One aliquot was
immediately frozen at −80°C (total digesta), and the second solution was centrifuged for 10 min
(5000 ×g, 37°C), the supernatant was collected, and then frozen at −80°C (solution digesta).
Both fractions were freeze dried and yields were calculated. A blank digestion (using 10 mL
saline instead of 10 g cocoa) was performed to account for the digestion reagents. Refer to
Appendix A for full methodological details.
5.2.9 In vitro α-glucosidase inhibition. CPE and soluble digesta fractions were screened for α-
glucosidase inhibitory activity in vitro as described previously [15]. A 0.1 M phosphate buffer
(pH 6.9) was prepared in water with sodium phosphate monobasic anhydrous (8.05 g/L), and
sodium phosphate dibasic anhydrous (4.67 g/L). pH was adjusted to 6.9 with 1 N NaOH. CPE
was diluted to obtain concentrations of 0.3125-8,000 µg/mL (all in 10% DMSO). Using
calculated extraction and digesta yields, soluble digesta fractions for each corresponding cocoa
powder were weighed according to an equivalent of 20 mg CPE (i.e. in the amount of digesta
resulting from digestion of the amount of cocoa powder that yielded 20 mg CPE). Soluble
digesta fractions were diluted to obtain concentrations equivalent to 0.3125-8,000 µg/mL CPE in
the starting cocoa (all in 10% DMSO). A negative control (no inhibitor, i.e. 0 µg/mL CPE) was
prepared with only 10% DMSO. The α-glucosidase solution was prepared in 0.1 M phosphate
buffer to a final concentration of 1 U/mL. The p-nitrophenyl α-D-glucopyranoside (pNPG)
substrate solution was prepared at a final concentration of 1 mM in 0.1 M phosphate buffer. In
96-well plates (n=6 wells/treatment), 50 µL of each working sample solution or negative control
was mixed with 100 µL of α-glucosidase solution. The plate was then incubated at room
temperature for 10 min followed by the addition of 50 µL of pNPG solution to each well. The
final concentrations of each inhibitor solution was thus 0-2,000 µg/mL (CPE) or 0-2,000 µg CPE
starting material/mL (digesta). The plate was then read at 405 nm. The positive control was
acarbose in 10% DMSO matched to CPE concentrations (0-2,000 µg/mL final concentration in
the assay). The cocoa extracts were compared to the controls at each concentration and the
values expressed as % α-glucosidase activity via the following equation:
% 𝛼 − 𝐺𝑙𝑢𝑐𝑜𝑠𝑖𝑑𝑎𝑠𝑒 𝐴𝑐𝑡𝑖𝑣𝑖𝑡𝑦 = (∆Asample
∆Ānegative control
) 𝑥 100
93
where:
ΔAsample= the change in the individual absorbance value of the product of the inhibitor, substrate,
and enzyme at each inhibitor dose before and after incubation
ΔAnegative control= the average change in absorbance of the negative control (0 µg/mL) before and
after incubation
5.2.10 Data analysis and statistics. All fermentation data (pH, FI, DO), compositional data
(Folin-Ciocalteu, DMAC, thiolysis, melanoidins, individual flavanols/procyanidins), and enzyme
activity (% activity) at individual concentrations near IC50 values were analyzed by one-way
ANOVA. If a significant overall treatment effect was detected, Tukey’s HSD post hoc test was
performed to determine differences between all treatment means. Median inhibitory
concentration (IC50) values for α-glucosidase were calculated for each CPE treatment using a
four-parameters sigmodal analysis. Simple linear regression analysis was performed to correlate
individual compositional factors (predictors: X) to α-glucosidase activity (IC50, outcomes: Y).
The mean compositional values and IC50 for each CPE treatment were plotted (7 points per
analysis), and R and R2 were calculated. Statistical significance was defined a priori as p < 0.05.
Analyses were performed on XLSTAT-Base (2018.5, New York, NY) and GraphPad Prism
v7.03 (GraphPad, La Jolla, CA).
5.3 RESULTS
5.3.1 Fermentation model system and cocoa processing. Monitored fermentation parameters
(pH, DO) progressed similarly across the 168 h for CF and HF, with initial (0 h) pulp pH values
at 3.99±0.05 and 3.84±0.01, respectively, and ending (168 h) values at 3.51±0.02 and 3.36±0.07,
respectively (Figure 5.2). At the end of fermentation, pulp of both CF and HF concluded with
more acidic internal environments. Furthermore, initial bean pH values ranged from 5.61±0.01
(CF) to 5.75±0.16 (HF) and concluded at 3.89±0.04 (CF) and 3.95±0.01 (HF) after 168 h.
Dissolved oxygen remained ≤1 mg/L after the first 24 h of fermentation. Initial FI values (Figure
5.2) for both CF and HF were above 1.0 and remained within ±0.01 throughout the entire 168 h
fermentation. Cut test results, although performed at a much lower sample size than the
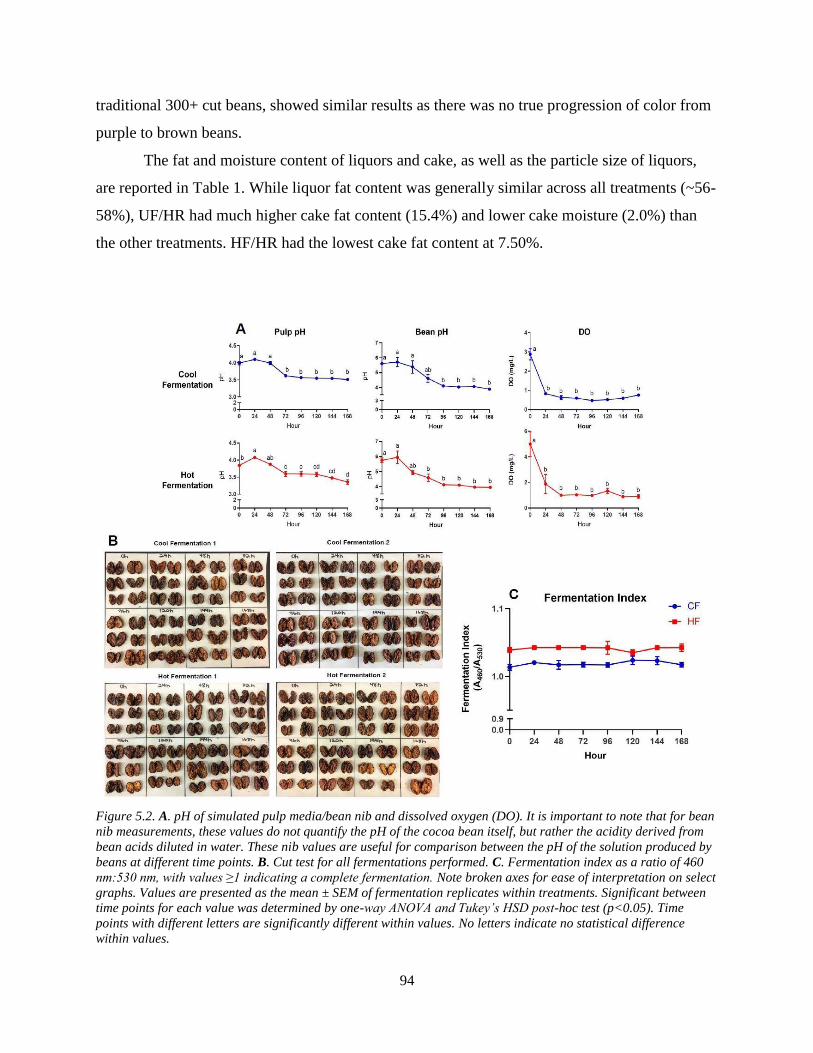
94
traditional 300+ cut beans, showed similar results as there was no true progression of color from
purple to brown beans.
The fat and moisture content of liquors and cake, as well as the particle size of liquors,
are reported in Table 1. While liquor fat content was generally similar across all treatments (~56-
58%), UF/HR had much higher cake fat content (15.4%) and lower cake moisture (2.0%) than
the other treatments. HF/HR had the lowest cake fat content at 7.50%.
Figure 5.2. A. pH of simulated pulp media/bean nib and dissolved oxygen (DO). It is important to note that for bean
nib measurements, these values do not quantify the pH of the cocoa bean itself, but rather the acidity derived from
bean acids diluted in water. These nib values are useful for comparison between the pH of the solution produced by
beans at different time points. B. Cut test for all fermentations performed. C. Fermentation index as a ratio of 460
nm:530 nm, with values ≥1 indicating a complete fermentation. Note broken axes for ease of interpretation on select
graphs. Values are presented as the mean ± SEM of fermentation replicates within treatments. Significant between
time points for each value was determined by one-way ANOVA and Tukey’s HSD post-hoc test (p<0.05). Time
points with different letters are significantly different within values. No letters indicate no statistical difference
within values.
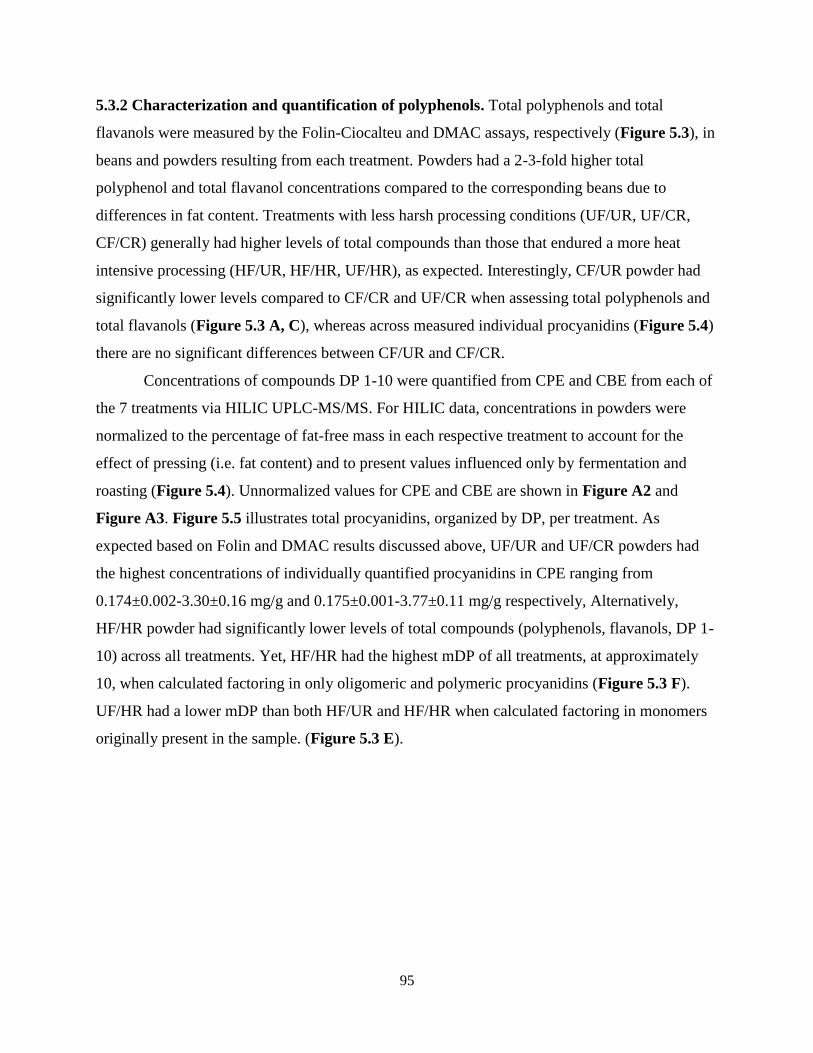
95
5.3.2 Characterization and quantification of polyphenols. Total polyphenols and total
flavanols were measured by the Folin-Ciocalteu and DMAC assays, respectively (Figure 5.3), in
beans and powders resulting from each treatment. Powders had a 2-3-fold higher total
polyphenol and total flavanol concentrations compared to the corresponding beans due to
differences in fat content. Treatments with less harsh processing conditions (UF/UR, UF/CR,
CF/CR) generally had higher levels of total compounds than those that endured a more heat
intensive processing (HF/UR, HF/HR, UF/HR), as expected. Interestingly, CF/UR powder had
significantly lower levels compared to CF/CR and UF/CR when assessing total polyphenols and
total flavanols (Figure 5.3 A, C), whereas across measured individual procyanidins (Figure 5.4)
there are no significant differences between CF/UR and CF/CR.
Concentrations of compounds DP 1-10 were quantified from CPE and CBE from each of
the 7 treatments via HILIC UPLC-MS/MS. For HILIC data, concentrations in powders were
normalized to the percentage of fat-free mass in each respective treatment to account for the
effect of pressing (i.e. fat content) and to present values influenced only by fermentation and
roasting (Figure 5.4). Unnormalized values for CPE and CBE are shown in Figure A2 and
Figure A3. Figure 5.5 illustrates total procyanidins, organized by DP, per treatment. As
expected based on Folin and DMAC results discussed above, UF/UR and UF/CR powders had
the highest concentrations of individually quantified procyanidins in CPE ranging from
0.174±0.002-3.30±0.16 mg/g and 0.175±0.001-3.77±0.11 mg/g respectively, Alternatively,
HF/HR powder had significantly lower levels of total compounds (polyphenols, flavanols, DP 1-
10) across all treatments. Yet, HF/HR had the highest mDP of all treatments, at approximately
10, when calculated factoring in only oligomeric and polymeric procyanidins (Figure 5.3 F).
UF/HR had a lower mDP than both HF/UR and HF/HR when calculated factoring in monomers
originally present in the sample. (Figure 5.3 E).
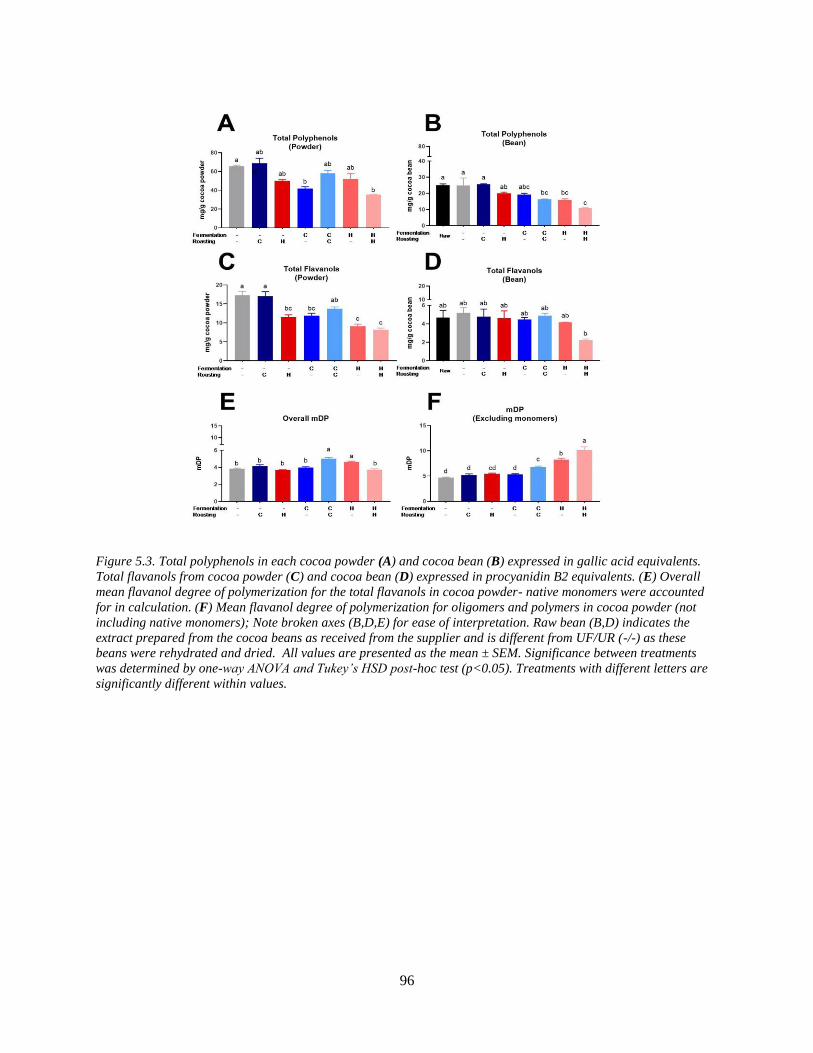
96
Figure 5.3. Total polyphenols in each cocoa powder (A) and cocoa bean (B) expressed in gallic acid equivalents.
Total flavanols from cocoa powder (C) and cocoa bean (D) expressed in procyanidin B2 equivalents. (E) Overall
mean flavanol degree of polymerization for the total flavanols in cocoa powder- native monomers were accounted
for in calculation. (F) Mean flavanol degree of polymerization for oligomers and polymers in cocoa powder (not
including native monomers); Note broken axes (B,D,E) for ease of interpretation. Raw bean (B,D) indicates the
extract prepared from the cocoa beans as received from the supplier and is different from UF/UR (-/-) as these
beans were rehydrated and dried. All values are presented as the mean ± SEM. Significance between treatments
was determined by one-way ANOVA and Tukey’s HSD post-hoc test (p<0.05). Treatments with different letters are
significantly different within values.
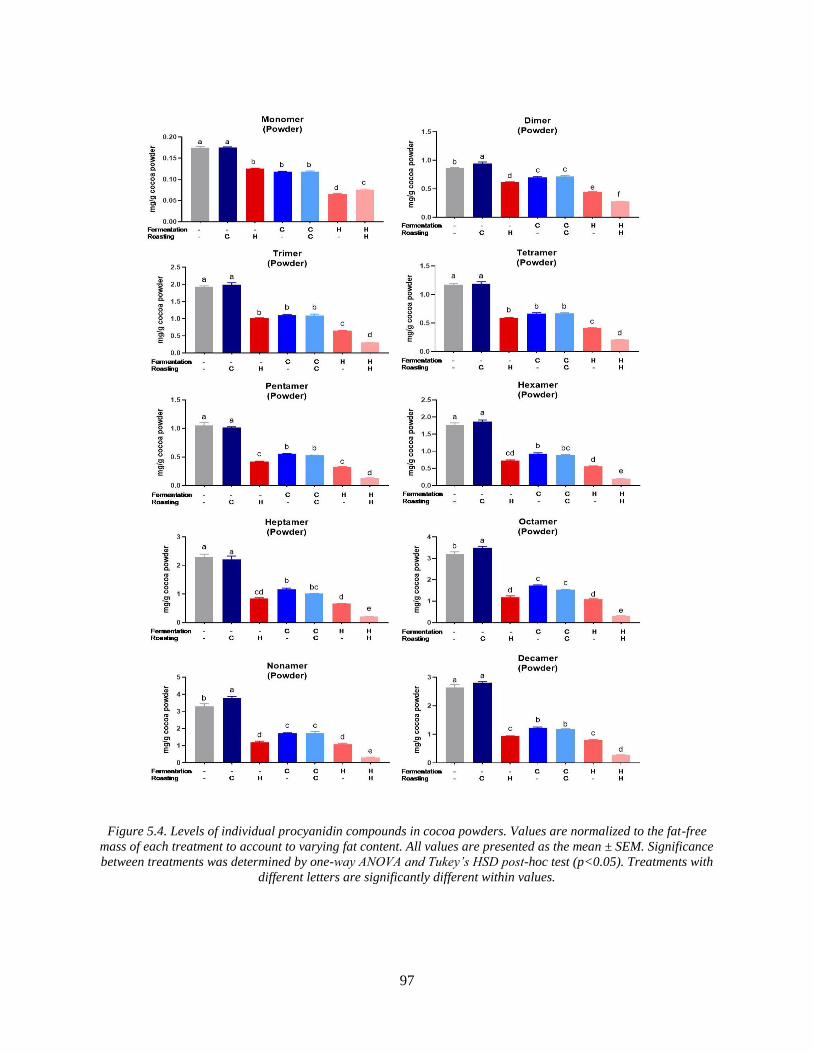
97
Figure 5.4. Levels of individual procyanidin compounds in cocoa powders. Values are normalized to the fat-free
mass of each treatment to account to varying fat content. All values are presented as the mean ± SEM. Significance
between treatments was determined by one-way ANOVA and Tukey’s HSD post-hoc test (p<0.05). Treatments with
different letters are significantly different within values.
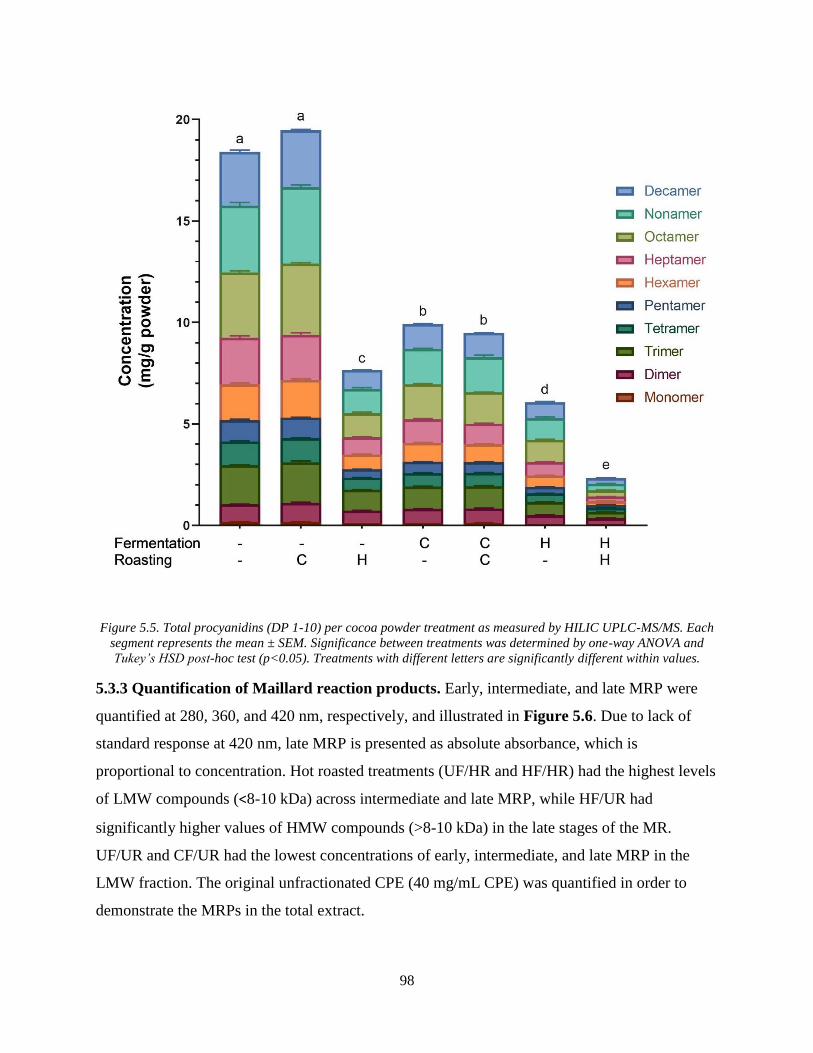
98
Figure 5.5. Total procyanidins (DP 1-10) per cocoa powder treatment as measured by HILIC UPLC-MS/MS. Each
segment represents the mean ± SEM. Significance between treatments was determined by one-way ANOVA and
Tukey’s HSD post-hoc test (p<0.05). Treatments with different letters are significantly different within values.
5.3.3 Quantification of Maillard reaction products. Early, intermediate, and late MRP were
quantified at 280, 360, and 420 nm, respectively, and illustrated in Figure 5.6. Due to lack of
standard response at 420 nm, late MRP is presented as absolute absorbance, which is
proportional to concentration. Hot roasted treatments (UF/HR and HF/HR) had the highest levels
of LMW compounds (˂8-10 kDa) across intermediate and late MRP, while HF/UR had
significantly higher values of HMW compounds (>8-10 kDa) in the late stages of the MR.
UF/UR and CF/UR had the lowest concentrations of early, intermediate, and late MRP in the
LMW fraction. The original unfractionated CPE (40 mg/mL CPE) was quantified in order to
demonstrate the MRPs in the total extract.
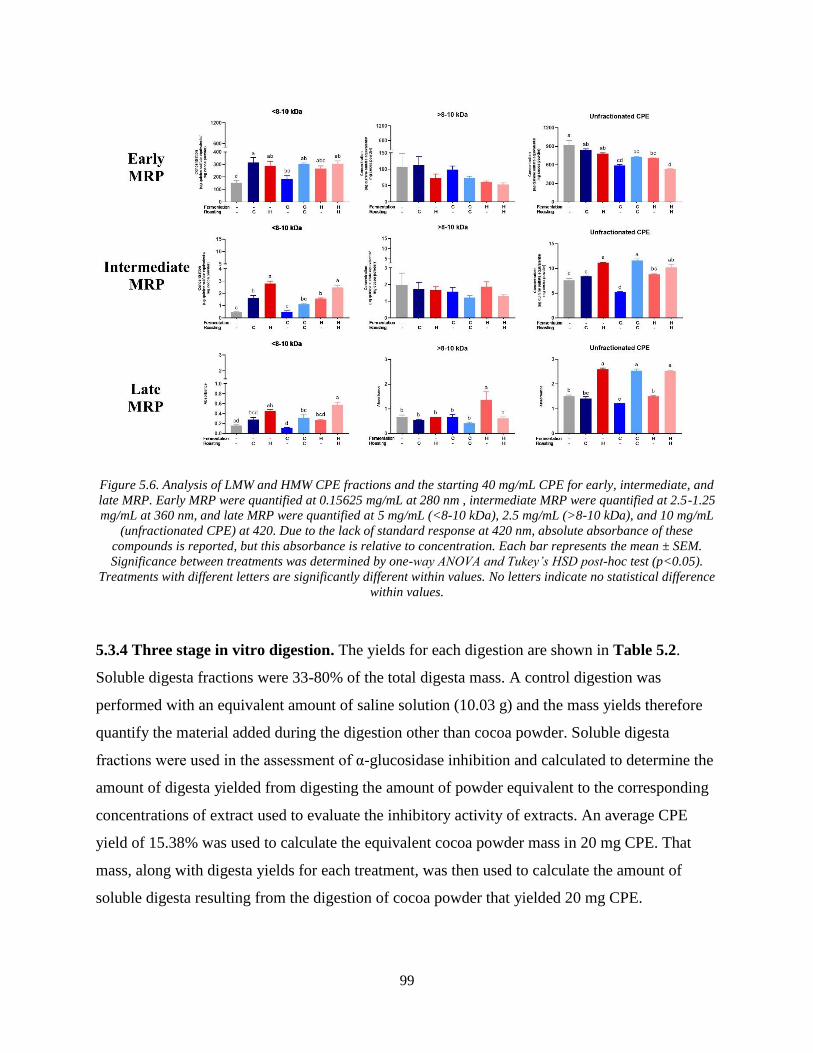
99
Figure 5.6. Analysis of LMW and HMW CPE fractions and the starting 40 mg/mL CPE for early, intermediate, and
late MRP. Early MRP were quantified at 0.15625 mg/mL at 280 nm , intermediate MRP were quantified at 2.5-1.25
mg/mL at 360 nm, and late MRP were quantified at 5 mg/mL (<8-10 kDa), 2.5 mg/mL (>8-10 kDa), and 10 mg/mL
(unfractionated CPE) at 420. Due to the lack of standard response at 420 nm, absolute absorbance of these
compounds is reported, but this absorbance is relative to concentration. Each bar represents the mean ± SEM.
Significance between treatments was determined by one-way ANOVA and Tukey’s HSD post-hoc test (p<0.05).
Treatments with different letters are significantly different within values. No letters indicate no statistical difference
within values.
5.3.4 Three stage in vitro digestion. The yields for each digestion are shown in Table 5.2.
Soluble digesta fractions were 33-80% of the total digesta mass. A control digestion was
performed with an equivalent amount of saline solution (10.03 g) and the mass yields therefore
quantify the material added during the digestion other than cocoa powder. Soluble digesta
fractions were used in the assessment of α-glucosidase inhibition and calculated to determine the
amount of digesta yielded from digesting the amount of powder equivalent to the corresponding
concentrations of extract used to evaluate the inhibitory activity of extracts. An average CPE
yield of 15.38% was used to calculate the equivalent cocoa powder mass in 20 mg CPE. That
mass, along with digesta yields for each treatment, was then used to calculate the amount of
soluble digesta resulting from the digestion of cocoa powder that yielded 20 mg CPE.
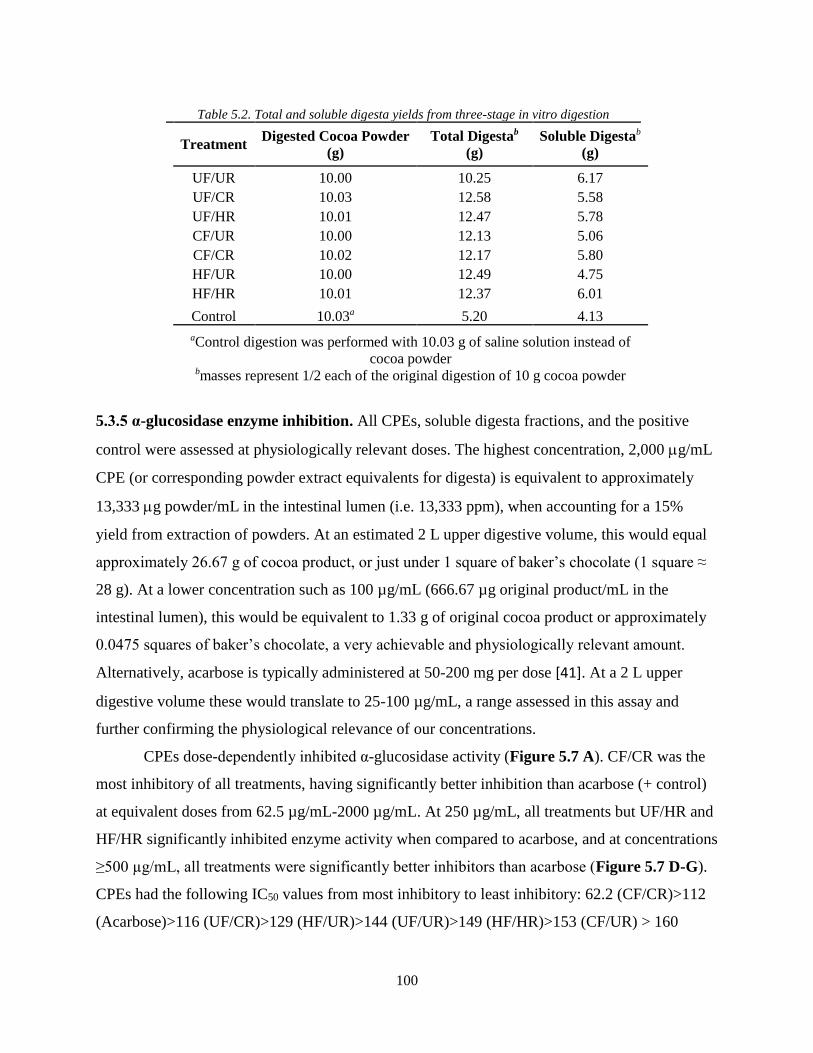
100
Table 5.2. Total and soluble digesta yields from three-stage in vitro digestion
Treatment Digested Cocoa Powder
(g)
Total Digestab
(g)
Soluble Digestab
(g)
UF/UR 10.00 10.25 6.17
UF/CR 10.03 12.58 5.58
UF/HR 10.01 12.47 5.78
CF/UR 10.00 12.13 5.06
CF/CR 10.02 12.17 5.80
HF/UR 10.00 12.49 4.75
HF/HR 10.01 12.37 6.01
Control 10.03a 5.20 4.13
aControl digestion was performed with 10.03 g of saline solution instead of
cocoa powder bmasses represent 1/2 each of the original digestion of 10 g cocoa powder
5.3.5 α-glucosidase enzyme inhibition. All CPEs, soluble digesta fractions, and the positive
control were assessed at physiologically relevant doses. The highest concentration, 2,000 g/mL
CPE (or corresponding powder extract equivalents for digesta) is equivalent to approximately
13,333 g powder/mL in the intestinal lumen (i.e. 13,333 ppm), when accounting for a 15%
yield from extraction of powders. At an estimated 2 L upper digestive volume, this would equal
approximately 26.67 g of cocoa product, or just under 1 square of baker’s chocolate (1 square ≈
28 g). At a lower concentration such as 100 µg/mL (666.67 µg original product/mL in the
intestinal lumen), this would be equivalent to 1.33 g of original cocoa product or approximately
0.0475 squares of baker’s chocolate, a very achievable and physiologically relevant amount.
Alternatively, acarbose is typically administered at 50-200 mg per dose [41]. At a 2 L upper
digestive volume these would translate to 25-100 µg/mL, a range assessed in this assay and
further confirming the physiological relevance of our concentrations.
CPEs dose-dependently inhibited α-glucosidase activity (Figure 5.7 A). CF/CR was the
most inhibitory of all treatments, having significantly better inhibition than acarbose (+ control)
at equivalent doses from 62.5 µg/mL-2000 µg/mL. At 250 µg/mL, all treatments but UF/HR and
HF/HR significantly inhibited enzyme activity when compared to acarbose, and at concentrations
≥500 µg/mL, all treatments were significantly better inhibitors than acarbose (Figure 5.7 D-G).
CPEs had the following IC50 values from most inhibitory to least inhibitory: 62.2 (CF/CR)>112
(Acarbose)>116 (UF/CR)>129 (HF/UR)>144 (UF/UR)>149 (HF/HR)>153 (CF/UR) > 160
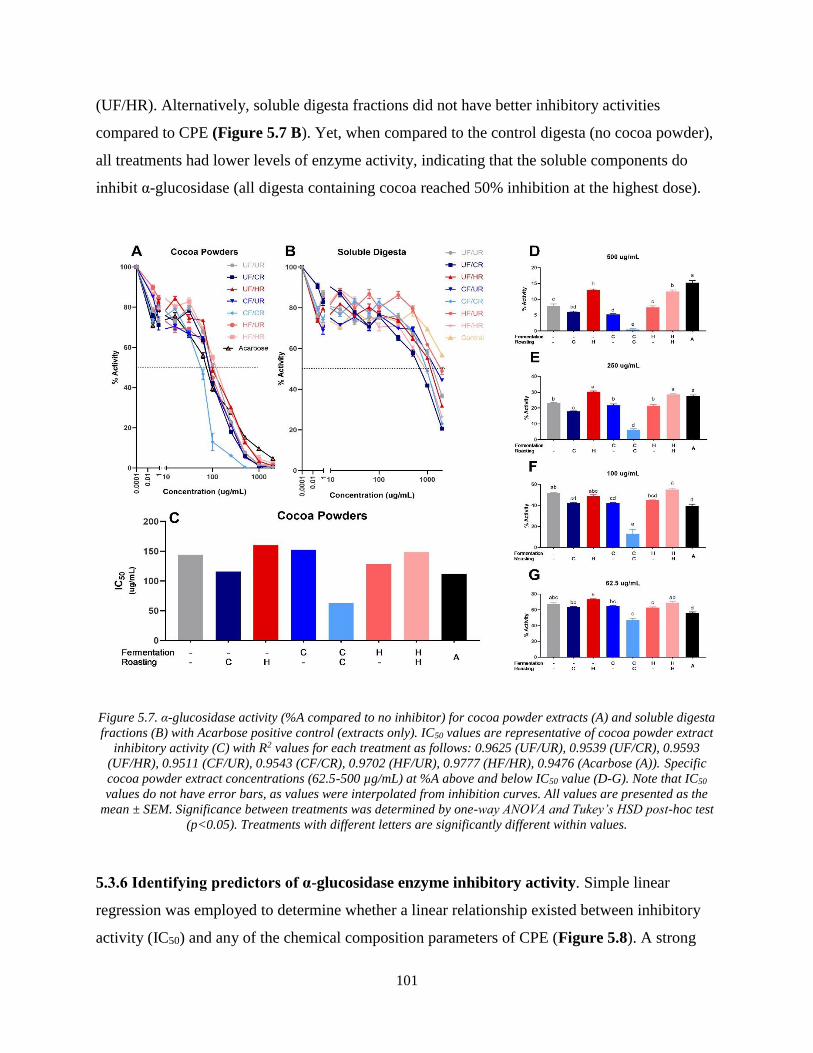
101
(UF/HR). Alternatively, soluble digesta fractions did not have better inhibitory activities
compared to CPE (Figure 5.7 B). Yet, when compared to the control digesta (no cocoa powder),
all treatments had lower levels of enzyme activity, indicating that the soluble components do
inhibit α-glucosidase (all digesta containing cocoa reached 50% inhibition at the highest dose).
Figure 5.7. α-glucosidase activity (%A compared to no inhibitor) for cocoa powder extracts (A) and soluble digesta
fractions (B) with Acarbose positive control (extracts only). IC50 values are representative of cocoa powder extract
inhibitory activity (C) with R2 values for each treatment as follows: 0.9625 (UF/UR), 0.9539 (UF/CR), 0.9593
(UF/HR), 0.9511 (CF/UR), 0.9543 (CF/CR), 0.9702 (HF/UR), 0.9777 (HF/HR), 0.9476 (Acarbose (A)). Specific
cocoa powder extract concentrations (62.5-500 µg/mL) at %A above and below IC50 value (D-G). Note that IC50
values do not have error bars, as values were interpolated from inhibition curves. All values are presented as the
mean ± SEM. Significance between treatments was determined by one-way ANOVA and Tukey’s HSD post-hoc test
(p<0.05). Treatments with different letters are significantly different within values.
5.3.6 Identifying predictors of α-glucosidase enzyme inhibitory activity. Simple linear
regression was employed to determine whether a linear relationship existed between inhibitory
activity (IC50) and any of the chemical composition parameters of CPE (Figure 5.8). A strong
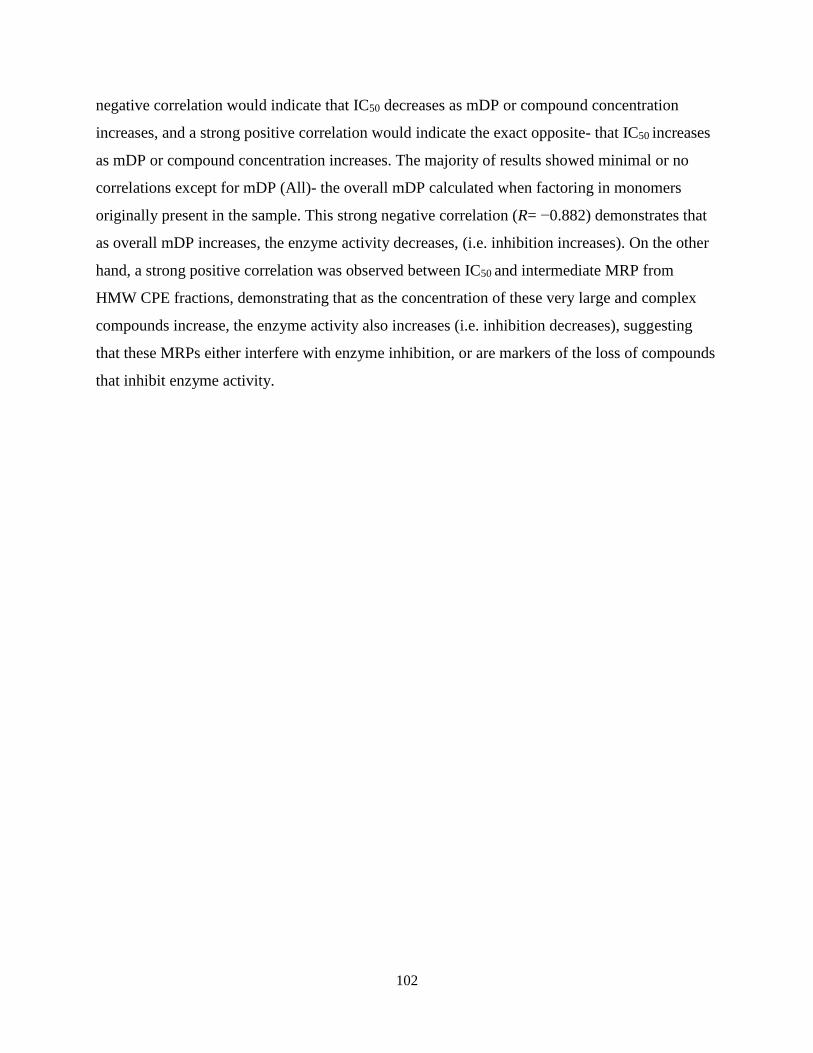
102
negative correlation would indicate that IC50 decreases as mDP or compound concentration
increases, and a strong positive correlation would indicate the exact opposite- that IC50 increases
as mDP or compound concentration increases. The majority of results showed minimal or no
correlations except for mDP (All)- the overall mDP calculated when factoring in monomers
originally present in the sample. This strong negative correlation (R= −0.882) demonstrates that
as overall mDP increases, the enzyme activity decreases, (i.e. inhibition increases). On the other
hand, a strong positive correlation was observed between IC50 and intermediate MRP from
HMW CPE fractions, demonstrating that as the concentration of these very large and complex
compounds increase, the enzyme activity also increases (i.e. inhibition decreases), suggesting
that these MRPs either interfere with enzyme inhibition, or are markers of the loss of compounds
that inhibit enzyme activity.
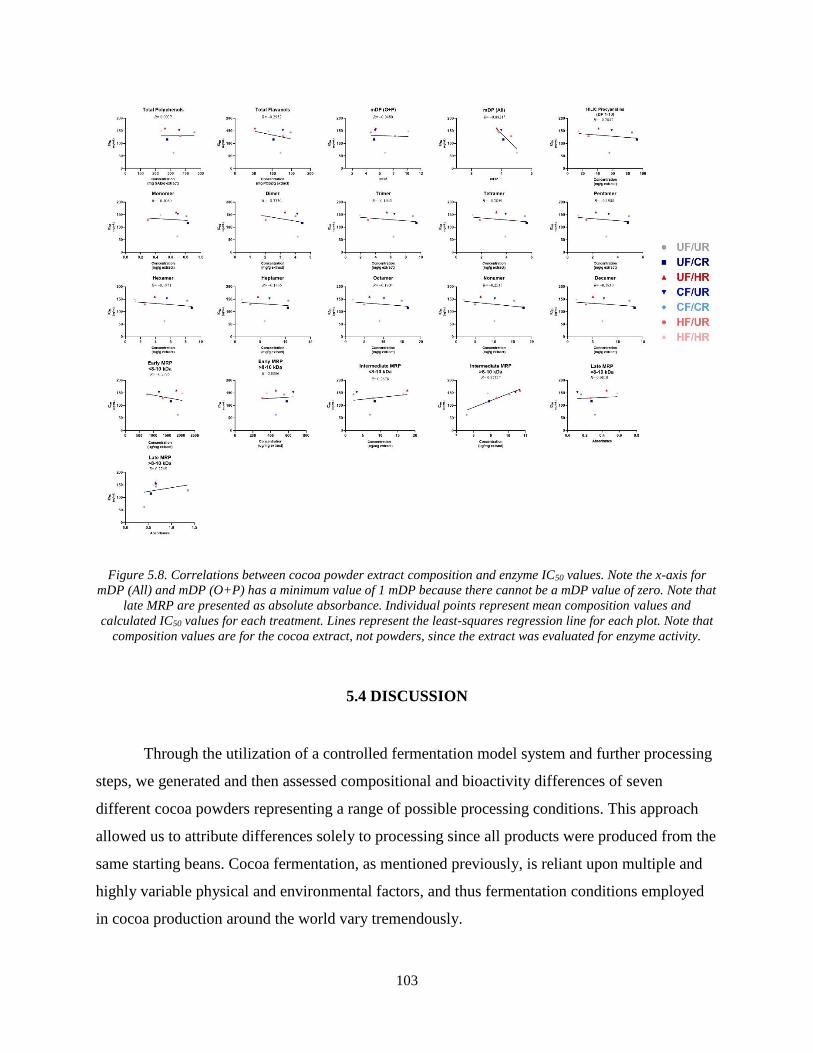
103
Figure 5.8. Correlations between cocoa powder extract composition and enzyme IC50 values. Note the x-axis for
mDP (All) and mDP (O+P) has a minimum value of 1 mDP because there cannot be a mDP value of zero. Note that
late MRP are presented as absolute absorbance. Individual points represent mean composition values and
calculated IC50 values for each treatment. Lines represent the least-squares regression line for each plot. Note that
composition values are for the cocoa extract, not powders, since the extract was evaluated for enzyme activity.
5.4 DISCUSSION
Through the utilization of a controlled fermentation model system and further processing
steps, we generated and then assessed compositional and bioactivity differences of seven
different cocoa powders representing a range of possible processing conditions. This approach
allowed us to attribute differences solely to processing since all products were produced from the
same starting beans. Cocoa fermentation, as mentioned previously, is reliant upon multiple and
highly variable physical and environmental factors, and thus fermentation conditions employed
in cocoa production around the world vary tremendously.
104
Reported heap fermentations appear to start uniformly around pH 3.6 but our model
system started slightly out of these ranges [12, 30, 31, 42–44]. Both our cool and hot
fermentations concluded under more acidic conditions as well. Beans of Trinitario and Forastero
varieties typically range in initial pH from 6.3-6.8, decreasing to approximately 5.0-6.0 by the
end of fermentation, whereas Criollo beans, while not as widely produced or studied as the
Trinitario and Forastero varieties, have been noted for their characteristically low pH [43–45].
The high initial DO values can be attributed to the fresh mixing of bean and simulated pulp
media, dropping significantly after 24 h and remaining ≤1 mg/L for the remainder of the
fermentation. This model system fermentation is liquid based, and therefore designed to mimic
the conditions in the center of a well-mixed cocoa heap. FI and cut test are traditional quality
controls conducted on farm to assess post-fermentation bean quality. Both are based upon
anthocyanin degradation and aglycone release throughout fermentation. The FI of raw
unfermented beans range from 0.3-0.6 and increase to 1.3-1.4 during fermentation, with a value
of ≥1 indicating adequate and complete fermentation [2, 46, 47]. However, our FI values started
at >1 (Figure 5.2C). These data, along with the acidic values for both pulp and bean in CF and
HF systems, lead us to believe that these beans are of Criollo or Nacional variety. Criollo beans
have low levels of anthocyanins compared to other varieties like Trinitario and Forastero, and
have a naturally low pH, possibly explaining the high acidity in our fermentation systems and
inconclusive FI and cut test results [45]. Nacional beans grow in Ecuador and have a very similar
genetic composition with Criollo beans [45]. Traceability is often not possible in global
commodity supply chains, such as that of cocoa beans. Although the exact variety of these beans
is unknown, reported data from heap fermentations allowed us to make a suggested conclusion
into the cultivar variation of these beans and its impact on fermentation and quality controls.
Overall, these two fermentation models were generally similar in pH, DO and FI with each other,
and produced results that are in agreement with the ranges reported for traditional heap
fermentations.
Total polyphenol and flavanol content differed between powder and bean products, with
powders having higher total concentrations of both polyphenols and flavanols. This is likely due
to the removal of flavanol-free cocoa butter during processing as cocoa powder is the ground
product of the pressed cake. Overall, our data align with previously published reports that
fermentation and roasting significantly reduce native flavanol levels in cocoa beans [5, 13, 17,
105
20, 34, 48–50]. While most previous studies have investigated the implications of fermentation
and roasting independently of each other, our model assess these processing techniques as
consecutive steps in varying combinations. Roasting is often considered the key phase in cocoa
processing in terms of defining the sensory characteristics of a finished product by producing
characteristic aromas, flavors, and texture of beans. Yet, roasting is an extension of the flavanol
reduction that begins during fermentation. Epimerization reactions and polymerization of
flavanols to one another, as well as reaction of these compounds with larger polymeric structures
such as proteins, polysaccharides, and Maillard reaction products can all influence flavonoid
levels in processed cocoa [5, 51]. This is demonstrated clearly by our data through the distinction
between the broad range of total polyphenol and flavanol quantification (via Folin-Ciocalteu and
DMAC assays) and a more specific quantification broken down by DP (via HILIC UPLC-
MS/MS). CF/UR powder has significantly lower levels of total polyphenols and flavanols than
CF/CR and UF/CR powders, yet there are minimal differences between CF/UR and CF/CR
across individually quantified procyanidins (DP 1-10)- likely explained by slight differences in
each individual procyanidin making a large difference in total levels. One potential explanation
is that roasting induces the production of complex high molecular weight compounds (DP>10)
and the release of bound polyphenols, ultimately measured by Folin-Ciocalteu and DMAC
assays and thus increasing total polyphenol and flavanol quantities, but not compounds
quantified in our targeted analysis of individual compounds (i.e. compounds for which standards
were obtained). Additionally, the significantly lower levels of all measured compounds in
HF/HR demonstrate that prolonged high temperature exposure via hot fermentation followed by
hot roasting suppress polyphenol and flavanol concentrations. However, the high mDP reported
for both the HF/UR and HF/HR suggests that fermentation parameters may have a larger
influence on polymerization of larger molecular weight compounds than originally thought, or
that the synergy between fermentation and roasting at high temperatures is crucial in the
development of large procyanidins. This correlates with previous research suggesting that levels
of high molecular weight procyanidins increase with prolonged roasting time and high roasting
temperatures [6, 20]. Although our roasting treatments were conducted at a uniform time (20
min), increased and prolonged heat exposure was most prominent in the HF/UR and HF/HR
treatments and present similar results, as the mDP (excluding monomers) of these treatments
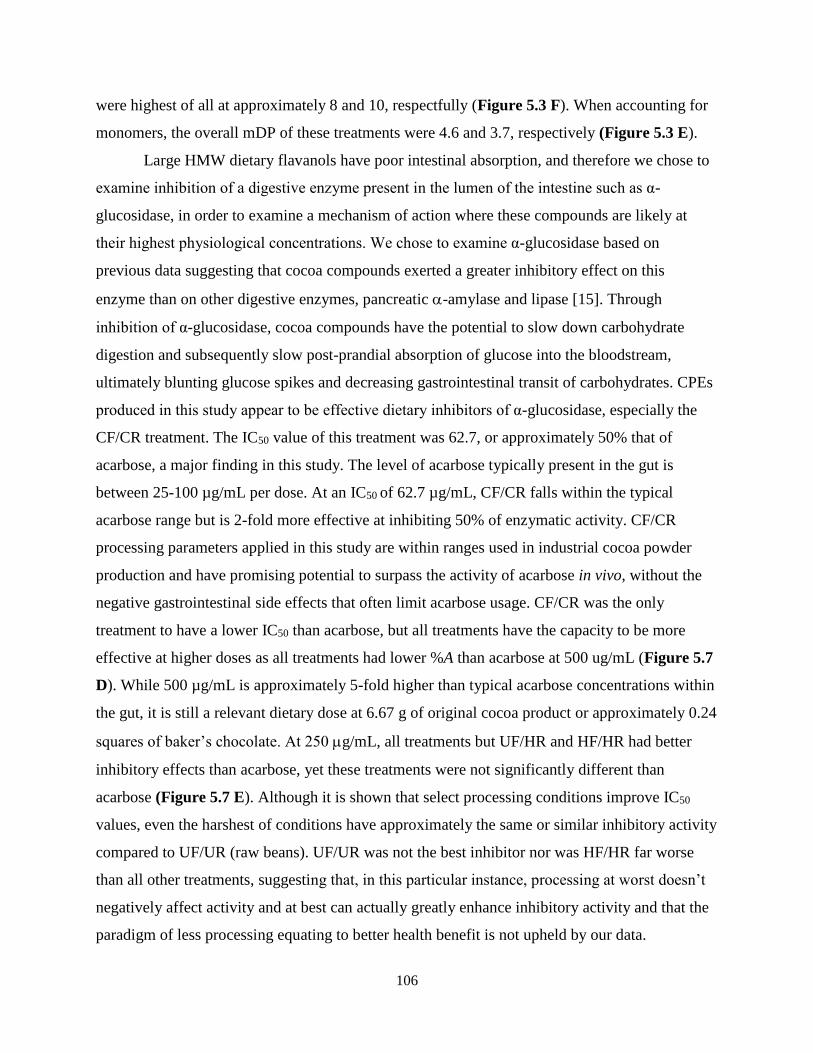
106
were highest of all at approximately 8 and 10, respectfully (Figure 5.3 F). When accounting for
monomers, the overall mDP of these treatments were 4.6 and 3.7, respectively (Figure 5.3 E).
Large HMW dietary flavanols have poor intestinal absorption, and therefore we chose to
examine inhibition of a digestive enzyme present in the lumen of the intestine such as α-
glucosidase, in order to examine a mechanism of action where these compounds are likely at
their highest physiological concentrations. We chose to examine α-glucosidase based on
previous data suggesting that cocoa compounds exerted a greater inhibitory effect on this
enzyme than on other digestive enzymes, pancreatic -amylase and lipase [15]. Through
inhibition of α-glucosidase, cocoa compounds have the potential to slow down carbohydrate
digestion and subsequently slow post-prandial absorption of glucose into the bloodstream,
ultimately blunting glucose spikes and decreasing gastrointestinal transit of carbohydrates. CPEs
produced in this study appear to be effective dietary inhibitors of α-glucosidase, especially the
CF/CR treatment. The IC50 value of this treatment was 62.7, or approximately 50% that of
acarbose, a major finding in this study. The level of acarbose typically present in the gut is
between 25-100 µg/mL per dose. At an IC50 of 62.7 µg/mL, CF/CR falls within the typical
acarbose range but is 2-fold more effective at inhibiting 50% of enzymatic activity. CF/CR
processing parameters applied in this study are within ranges used in industrial cocoa powder
production and have promising potential to surpass the activity of acarbose in vivo, without the
negative gastrointestinal side effects that often limit acarbose usage. CF/CR was the only
treatment to have a lower IC50 than acarbose, but all treatments have the capacity to be more
effective at higher doses as all treatments had lower %A than acarbose at 500 ug/mL (Figure 5.7
D). While 500 µg/mL is approximately 5-fold higher than typical acarbose concentrations within
the gut, it is still a relevant dietary dose at 6.67 g of original cocoa product or approximately 0.24
squares of baker’s chocolate. At 250 g/mL, all treatments but UF/HR and HF/HR had better
inhibitory effects than acarbose, yet these treatments were not significantly different than
acarbose (Figure 5.7 E). Although it is shown that select processing conditions improve IC50
values, even the harshest of conditions have approximately the same or similar inhibitory activity
compared to UF/UR (raw beans). UF/UR was not the best inhibitor nor was HF/HR far worse
than all other treatments, suggesting that, in this particular instance, processing at worst doesn’t
negatively affect activity and at best can actually greatly enhance inhibitory activity and that the
paradigm of less processing equating to better health benefit is not upheld by our data.
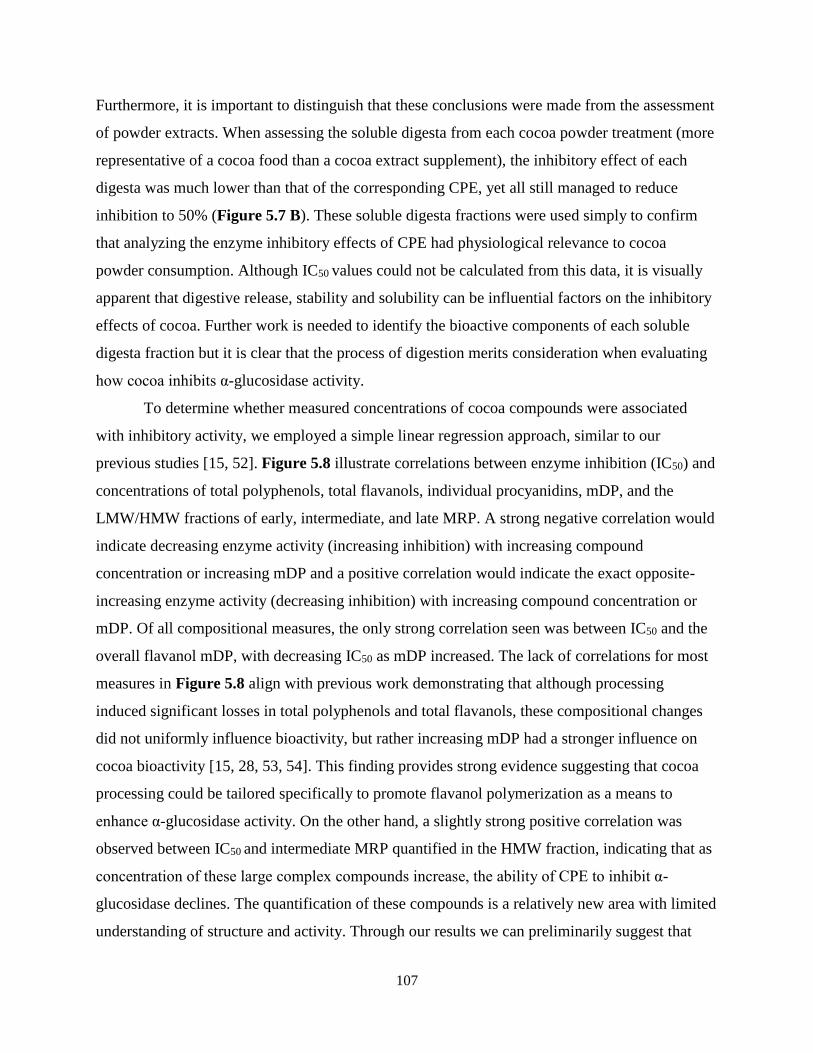
107
Furthermore, it is important to distinguish that these conclusions were made from the assessment
of powder extracts. When assessing the soluble digesta from each cocoa powder treatment (more
representative of a cocoa food than a cocoa extract supplement), the inhibitory effect of each
digesta was much lower than that of the corresponding CPE, yet all still managed to reduce
inhibition to 50% (Figure 5.7 B). These soluble digesta fractions were used simply to confirm
that analyzing the enzyme inhibitory effects of CPE had physiological relevance to cocoa
powder consumption. Although IC50 values could not be calculated from this data, it is visually
apparent that digestive release, stability and solubility can be influential factors on the inhibitory
effects of cocoa. Further work is needed to identify the bioactive components of each soluble
digesta fraction but it is clear that the process of digestion merits consideration when evaluating
how cocoa inhibits α-glucosidase activity.
To determine whether measured concentrations of cocoa compounds were associated
with inhibitory activity, we employed a simple linear regression approach, similar to our
previous studies [15, 52]. Figure 5.8 illustrate correlations between enzyme inhibition (IC50) and
concentrations of total polyphenols, total flavanols, individual procyanidins, mDP, and the
LMW/HMW fractions of early, intermediate, and late MRP. A strong negative correlation would
indicate decreasing enzyme activity (increasing inhibition) with increasing compound
concentration or increasing mDP and a positive correlation would indicate the exact opposite-
increasing enzyme activity (decreasing inhibition) with increasing compound concentration or
mDP. Of all compositional measures, the only strong correlation seen was between IC50 and the
overall flavanol mDP, with decreasing IC50 as mDP increased. The lack of correlations for most
measures in Figure 5.8 align with previous work demonstrating that although processing
induced significant losses in total polyphenols and total flavanols, these compositional changes
did not uniformly influence bioactivity, but rather increasing mDP had a stronger influence on
cocoa bioactivity [15, 28, 53, 54]. This finding provides strong evidence suggesting that cocoa
processing could be tailored specifically to promote flavanol polymerization as a means to
enhance α-glucosidase activity. On the other hand, a slightly strong positive correlation was
observed between IC50 and intermediate MRP quantified in the HMW fraction, indicating that as
concentration of these large complex compounds increase, the ability of CPE to inhibit α-
glucosidase declines. The quantification of these compounds is a relatively new area with limited
understanding of structure and activity. Through our results we can preliminarily suggest that
108
longer and higher roasting times/temperatures, often resulting in increased production of these
MRP, negatively impact the α-glucosidase inhibitory activity of CPE, but further investigation
into these compounds is needed to fully elucidate the impact they have on specific digestive
enzymes.
This study is novel in its use of a single uniform batch of raw cocoa beans as the starting
material for all processing treatments followed by control and monitoring of fermentation,
roasting and all other downstream processing conditions. This approach provided us with direct
knowledge of how the cocoa powders we evaluated were produced. Furthermore, we were able
to modify the fermentation and roasting conditions to produce seven cocoa powders made from
the same starting material, but subject to different processing conditions. Previous studies have
often relied on information reported through various levels of the cocoa supply chain, often
resulting in unknowns regarding processing conditions, as most cocoa production processes,
especially fermentation, lack robust controls or recordkeeping, resulting in considerable variation
and poor traceability. Our controlled system eliminates many of these external challenges,
providing confidence that differences between the cocoa powders evaluated were due to the
fermentation and roasting treatments, rather than unknown factors throughout the supply chain.
While the model fermentation system used in our study is not designed to physically mimic
conditions found in on-farm cocoa fermentation, fermentation of cocoa beans using this system
results in biochemical changes analogous to those reported in on farm fermentation. Conducting
the fermentation step in this model system allowed us to produce cocoa powders with acceptable
chemical composition, that were subject to known and controlled fermentation conditions. We
are currently expanding on this research by investigating each cocoa powder’s ability to prevent
obesity-induced GI and systemic inflammation and gut barrier dysfunction in vivo.
This study is not without limitations. Quantifying individual procyanidins ranging from
DP 1-10, although expanding beyond the monomeric flavan-3-ols often focused on in cocoa
products, still leaves many large molecular weight compounds yet to be quantified individually.
Additionally, α-glucosidase inhibition is just one specific mode of bioactivity that we chose to
focus on, based on potential for this inhibition demonstrated in previous reports. Although our
results begin to expand on this powerful inhibitory effect, the exact compositional factors
involved remain to be elucidated. To address these limitations moving forward, our processing
parameters could be expanded to include a wider range of processing conditions, to further
109
optimize α-glucosidase inhibitory activity. This expansion of treatment conditions tested, as well
as further fractionation of powder extracts to identify specific components associated with α-
glucosidase inhibitory activity, would allow a more comprehensive understanding of the impact
each processing step has on various compositional factors and bioactivity of dietary cocoa. By
extending characterization to lignins and speciation of melanoidins, further evidence could be
provided to explain this enzymatic activity. The in vitro work also needs to be extended in vivo
to further reinforce and clarify the mechanisms behind cocoa’s enzymatic inhibition influence in
both animals and humans, including but not limited to maltose versus glucose tolerance tests
with cocoa consumption, diet-induced obesity, and glucose intolerance. Furthermore, yeast-
derived α-glucosidase is a good, inexpensive starting point to screen for α-glucosidase inhibitory
activity in vitro. However, moving forward, work to understand specific mechanisms of α-
glucosidase inhibition by cocoa will need to move into mammalian systems such as rat intestinal
powders and murine and/or human recombinant α-glucosidases [55].
5.5 CONCLUSION
Overall, the present study demonstrates that the components of processed cocoa powders
are promising inhibitors of α-glucosidase, despite a significant reduction in native flavanol
composition during fermentation and roasting, and that fermentation and roasting conditions
influence the inhibitory activity. These observations support our hypothesis that reductions in
native polyphenols and flavanols do not necessarily dictate a reduction in activity, and
furthermore that products of fermentation and roasting do in fact contribute to cocoa bioactivity.
Although many of the compositional factors quantified in this study lack strong correlation with
enzyme inhibition (IC50), we report the novel finding that α-glucosidase inhibitory activity
increases with increasing mDP. Further investigation is needed to determine the identity of
compounds that better correlate with this activity.
Funding
This work was supported by USDA AFRI Grant 2017-67017-26783. Funding for this work was
also provided, in part, by the Virginia Agricultural Experiment Station and the Hatch Program of
the National Institute of Food and Agriculture, U.S. Department of Agriculture.
110
Acknowledgement
The authors would like to acknowledge Wyatt Elder at Cargill Cocoa for his generous donation
of raw unfermented cocoa beans, Sebastian Wolfrum, James Naquin, and Lea Woodard at
Epiphany Craft Malt in Durham, NC for assistance in roasting, and Arlen Moser, Matt Mastrog,
and the Blommer Chocolate Research and Development team in East Greenville, PA for their
time and guidance in processing all cocoa powders, free of charge. Additionally, the authors
would like to thank Dr. Hengjian Wang for his help in freeze drying various samples.
REFERENCES
[1] Andújar, I., Recio, M.C., Giner, R.M., Ríos, J.L., Cocoa polyphenols and their potential
benefits for human health. Oxid. Med. Cell. Longev. 2012, 2012.
[2] Kongor, J.E., Hinneh, M., de Walle, D.V., Afoakwa, E.O., et al., Factors influencing
quality variation in cocoa (Theobroma cacao) bean flavour profile — A review. Food Res.
Int. 2016, 82, 44–52.
[3] Schinella, G., Mosca, S., Cienfuegos-Jovellanos, E., Pasamar, M.A., et al., Antioxidant
properties of polyphenol-rich cocoa products industrially processed. Food Res. Int. 2010,
43, 1614–1623.
[4] Hatano, T., Miyatake, H., Natsume, M., Osakabe, N., et al., Proanthocyanidin glycosides
and related polyphenols from cacao liquor and their antioxidant effects. Phytochemistry
2002, 59, 749–758.
[5] Oracz, J., Nebesny, E., Żyżelewicz, D., Changes in the flavan-3-ols, anthocyanins, and
flavanols composition of cocoa beans of different Theobroma cacao L. groups affected by
roasting conditions. Eur. Food Res. Technol. 2015, 241, 663–681.
[6] Oracz, J., Nebesny, E., Effect of roasting parameters on the physicochemical
characteristics of high-molecular-weight Maillard reaction products isolated from cocoa
beans of different Theobroma cacao L. groups. Eur. Food Res. Technol. 2019, 245, 111–
128.
[7] Valiente, C., Esteban, R.M., Molla, E., Lopezandreu, F.J., Roasting Effects on Dietary
Fiber Composition of Cocoa Beans. J. Food Sci. 1994, 59, 123-.
[8] Cooper, K.A., Donovan, J.L., Waterhouse, A.L., Williamson, G., Cocoa and health: a
decade of research. Br. J. Nutr. 2008, 99, 1–11.
[9] Wollgast, J., Anklam, E., Review on polyphenols in Theobroma cacao: changes in
composition during the manufacture of chocolate and methodology for identification and
quantification. Food Res. Int. 2000, 33, 423–447.
[10] de Brito, E.S., García, N.H.P., Gallão, M.I., Cortelazzo, A.L., et al., Structural and
chemical changes in cocoa (Theobroma cacao L) during fermentation, drying and roasting.
J. Sci. Food Agric. 2001, 81, 281–288.
[11] Mazor Jolić, S., Radojčić Redovniković, I., Marković, K., Ivanec Šipušić, Đ., et al.,
Changes of phenolic compounds and antioxidant capacity in cocoa beans processing. Int.
J. Food Sci. Technol. 2011, 46, 1793–1800.
111
[12] Schwan, R.F., Wheals, A.E., The Microbiology of Cocoa Fermentation and its Role in
Chocolate Quality. Crit. Rev. Food Sci. Nutr. 2004, 44, 205–221.
[13] Albertini, B., Schoubben, A., Guarnaccia, D., Pinelli, F., et al., Effect of fermentation and
drying on cocoa polyphenols. J. Agric. Food Chem. 2015, 63, 9948–9953.
[14] Dorenkott, M.R., Griffin, L.E., Goodrich, K.M., Thompson-Witrick, K.A., et al.,
Oligomeric Cocoa Procyanidins Possess Enhanced Bioactivity Compared to Monomeric
and Polymeric Cocoa Procyanidins for Preventing the Development of Obesity, Insulin
Resistance, and Impaired Glucose Tolerance during High-Fat Feeding. J. Agric. Food
Chem. 2014, 62, 2216–2227.
[15] Ryan, C.M., Khoo, W., Ye, L., Lambert, J.D., et al., Loss of Native Flavanols during
Fermentation and Roasting Does Not Necessarily Reduce Digestive Enzyme-Inhibiting
Bioactivities of Cocoa. J. Agric. Food Chem. 2016, 64, 3616–3625.
[16] Di Mattia, C., Sacchetti, G., Seghetti, L., Piva, A., et al., “Vino Cotto” Composition and
Antioxidant Activity as Affected by Non Enzymatic Browning. Influenza
DELLIMBRUNIMENTO NON ENZIMATICO SULLA Compos. E Attiv. ANTIOSSIDANTE
VINO COTTO 2007, 19, 413–424.
[17] Di Mattia, C., Martuscelli, M., Sacchetti, G., Scheirlinck, I., et al., Effect of Fermentation
and Drying on Procyanidins, Antiradical Activity and Reducing Properties of Cocoa
Beans. Food Bioprocess Technol. 2013, 6, 3420–3432.
[18] Quiroz-Reyes, C.N., Fogliano, V., Design cocoa processing towards healthy cocoa
products: The role of phenolics and melanoidins. J. Funct. Foods 2018, 45, 480–490.
[19] Bellesia, A., Tagliazucchi, D., Cocoa brew inhibits in vitro α-glucosidase activity: The
role of polyphenols and high molecular weight compounds. Food Res. Int. 2014, 63, 439–
445.
[20] Ioannone, F., Di Mattia, C.D., De Gregorio, M., Sergi, M., et al., Flavanols,
proanthocyanidins and antioxidant activity changes during cocoa (Theobroma cacao L.)
roasting as affected by temperature and time of processing. Food Chem. 2015, 174, 256–
262.
[21] Summa, C., McCourt, J., Cämmerer, B., Fiala, A., et al., Radical scavenging activity, anti-
bacterial and mutagenic effects of Cocoa bean Maillard Reaction products with degree of
roasting. Mol. Nutr. Food Res. 2008, 52, 342–351.
[22] Summa, C., Raposo, F.C., McCourt, J., Scalzo, R.L., et al., Effect of roasting on the
radical scavenging activity of cocoa beans. Eur. Food Res. Technol. 2006, 222, 368–375.
[23] Donovan, J.L., Lee, A., Manach, C., Rios, L., et al., Procyanidins are not bioavailable in
rats fed a single meal containing a grapeseed extract or the procyanidin dimer B 3. Br. J.
Nutr. 2002, 87, 299–306.
[24] Serra, A., Macia, A., Romero, M.-P., Valls, J., et al., Bioavailability of procyanidin dimers
and trimers and matrix food effects in in vitro and in vivo models. Br. J. Nutr. 2010, 103,
944–952.
[25] Ottaviani, J.I., Kwik-Uribe, C., Keen, C.L., Schroeter, H., Intake of dietary procyanidins
does not contribute to the pool of circulating flavanols in humans. Am. J. Clin. Nutr. 2012,
95, 851–858.
[26] Crozier, A., Del Rio, D., Clifford, M.N., Bioavailability of dietary flavonoids and phenolic
compounds. Mol. Aspects Med. 2010, 31, 446–467.
112
[27] Wiese, S., Esatbeyoglu, T., Winterhalter, P., Kruse, H.-P., et al., Comparative biokinetics
and metabolism of pure monomeric, dimeric, and polymeric flavan‐3‐ols: A randomized
cross‐over study in humans. Mol. Nutr. Food Res. 2015, 59, 610–621.
[28] Gu, Y., Hurst, W.J., Stuart, D.A., Lambert, J.D., Inhibition of Key Digestive Enzymes by
Cocoa Extracts and Procyanidins. J. Agric. Food Chem. 2011, 59, 5305–5311.
[29] Zhang, L.-L., Han, L., Yang, S.-Y., Meng, X.-M., et al., The mechanism of interactions
between flavan-3-ols against a-glucosidase and their in vivo antihyperglycemic effects.
Bioorganic Chem. 2019, 85, 364–372.
[30] Camu, N., Winter, T.D., Verbrugghe, K., Cleenwerck, I., et al., Dynamics and
Biodiversity of Populations of Lactic Acid Bacteria and Acetic Acid Bacteria Involved in
Spontaneous Heap Fermentation of Cocoa Beans in Ghana. Appl. Environ. Microbiol.
2007, 73, 1809–1824.
[31] Camu, N., González, A., De Winter, T., Van Schoor, A., et al., Influence of turning and
environmental contamination on the dynamics of populations of lactic acid and acetic acid
bacteria involved in spontaneous cocoa bean heap fermentation in Ghana. Appl. Environ.
Microbiol. 2008, 74, 86–98.
[32] Racine, K.C., Lee, A.H., Wiersema, B.D., Huang, H., et al., Development and
Characterization of a Pilot-Scale Model Cocoa Fermentation System Suitable for Studying
the Impact of Fermentation on Putative Bioactive Compounds and Bioactivity of Cocoa.
Foods 2019, 8, 102.
[33] Lee, A.H., Neilson, A.P., O’Keefe, S.F., Ogejo, J.A., et al., A laboratory-scale model
cocoa fermentation using dried, unfermented beans and artificial pulp can simulate the
microbial and chemical changes of on-farm cocoa fermentation. Eur. Food Res. Technol.
2018.
[34] Camu, N., De Winter, T., Addo, S.K., Takrama, J.S., et al., Fermentation of cocoa beans:
influence of microbial activities and polyphenol concentrations on the flavour of
chocolate. J. Sci. Food Agric. 2008, 88, 2288–2297.
[35] Schwan, R.F., Cocoa fermentations conducted with a defined microbial cocktail inoculum.
Appl. Environ. Microbiol. 1998, 64, 1477–1483.
[36] Romero-Cortes, T., Salgado-Cervantes, M.A., García-Alamilla, P., García-Alvarado,
M.A., et al., Relationship between fermentation index and other biochemical changes
evaluated during the fermentation of Mexican cocoa (Theobroma cacao) beans. J. Sci.
Food Agric. 2013, 93, 2596–2604.
[37] Racine, K.C., Lee, A.H., Stewart, A.C., Blakeslee, K.W., et al., Development of a rapid
ultra performance hydrophilic interaction liquid chromatography tandem mass
spectrometry method for procyanidins with enhanced ionization efficiency. J.
Chromatogr. A 2019.
[38] Racine, K.C., Lee, A.H., Stewart, A.C., Blakeslee, K.W., et al., Development of a rapid
ultra performance hydrophilic interaction liquid chromatography tandem mass
spectrometry method for procyanidins with enhanced ionization efficiency. J.
Chromatogr. A 2019.
[39] Sacchetti, G., Ioannone, F., De Gregorio, M., Di Mattia, C., et al., Non enzymatic
browning during cocoa roasting as affected by processing time and temperature. J. Food
Eng. 2016, 169, 44–52.
[40] Li, M., Koecher, K., Hansen, L., Ferruzzi, M.G., Phenolic recovery and bioaccessibility
from milled and finished whole grain oat products. Food Funct. 2016, 7, 3370–3381.
113
[41] Balfour, J.A., McTavish, D., Acarbose. Drugs 1993, 46, 1025–1054.
[42] Nielsen, D.S., Teniola, O.D., Ban-Koffi, L., Owusu, M., et al., The microbiology of
Ghanaian cocoa fermentations analysed using culture-dependent and culture-independent
methods. Int. J. Food Microbiol. 2007, 114, 168–186.
[43] Ho, V.T.T., Zhao, J., Fleet, G., The effect of lactic acid bacteria on cocoa bean
fermentation. Int. J. Food Microbiol. 2015, 205, 54–67.
[44] Ardhana, M.M., Fleet, G.H., The microbial ecology of cocoa bean fermentations in
Indonesia. Int. J. Food Microbiol. 2003, 86, 87–99.
[45] Saltini, R., Akkerman, R., Frosch, S., Optimizing chocolate production through
traceability: A review of the influence of farming practices on cocoa bean quality. Food
Control 2013, 29, 167–187.
[46] De Taeye, C., Eyamo Evina, V.J., Caullet, G., Niemenak, N., et al., Fate of anthocyanins
through cocoa fermentation. Emergence of new polyphenolic dimers. J. Agric. Food
Chem. 2016, 64, 8876–8885.
[47] Emmanuel, O.A., Jennifer, Q., Agnes, S.B., Jemmy, S.T., et al., Influence of pulp-
preconditioning and fermentation on fermentative quality and appearance of Ghanaian
cocoa (Theobroma cacao) beans. Int. Food Res. J. Selangor 2012, 19, 127–133.
[48] Payne, M.J., Hurst, W.J., Miller, K.B., Rank, C., et al., Impact of Fermentation, Drying,
Roasting, and Dutch Processing on Epicatechin and Catechin Content of Cacao Beans and
Cocoa Ingredients. J. Agric. Food Chem. 2010, 58, 10518–10527.
[49] Kothe, L., Zimmermann, B.F., Galensa, R., Temperature influences epimerization and
composition of flavanol monomers, dimers and trimers during cocoa bean roasting. Food
Chem. 2013, 141, 3656–3663.
[50] Kim, H., Keeney, P.G., (-)-Epicatechin Content in Fermented and Unfermented Cocoa
Beans. J. Food Sci. n.d., 49, 1090–1092.
[51] Kothe, L., Zimmermann, B.F., Galensa, R., Temperature influences epimerization and
composition of flavanol monomers, dimers and trimers during cocoa bean roasting. Food
Chem. 2013, 141, 3656–3663.
[52] Ryan, C.M., Khoo, W., Stewart, A.C., O’Keefe, S.F., et al., Flavanol concentrations do not
predict dipeptidyl peptidase-IV inhibitory activities of four cocoas with different
processing histories. Food Funct. 2017, 8, 746–756.
[53] Zhong, H., Xue, Y., Lu, X., Shao, Q., et al., The Effects of Different Degrees of
Procyanidin Polymerization on the Nutrient Absorption and Digestive Enzyme Activity in
Mice. Molecules 2018, 23.
[54] Yamashita, Y., Okabe, M., Natsume, M., Ashida, H., Comparison of anti-hyperglycemic
activities between low-and high-degree of polymerization procyanidin fractions from
cacao liquor extract. J Food Drug Anal 2012, 20, 283–287.
[55] Simsek, M., Quezada-Calvillo, R., Ferruzzi, M.G., Nichols, B.L., et al., Dietary phenolic
compounds selectively inhibit the individual subunits of maltase-glucoamylase and
sucrase-isomaltase with the potential of modulating glucose release. J. Agric. Food Chem.
2015, 63, 3873–3879.
114
CHAPTER 6. CONCLUSIONS AND FUTURE WORK
The overall goal of the work was to establish a relationship between cocoa processing
techniques and health protective activities of dietary cocoa, specifically the α-glucosidase
inhibitory activity. In order to achieve this goal, a rapid and sensitive method of detection for
cocoa procyanidins was developed (Chapter 3), a fermentation model system was scaled up to
produce controlled cocoa beans on a large scale (Chapter 4), and finally, this model system and
further processing was utilized to produce various controlled treatments of cocoa powder and
determine the bioactive properties of each (Chapter 5). The data presented in this work and
previously cited work shows exciting and promising potential for the use of fermented and
roasted cocoa as a prevention strategy and/or method to control T2D and obesity-induced
chronic conditions. Although our results have promise, there is still a need for continued
investigation and development of processing steps that maintain or enhance bioactivity while
preserving desirable sensory characteristics, as the concept of processed cocoa enhancing
bioactivity is relatively unexplored.
To build upon the results presented in this work, a long-term research goal could be to
characterize and understand the structural composition and health protecting activities of
melanoidins and high molecular weight compounds, produced through thermal processing, and
ultimately optimize cocoa processing conditions to produce cocoa with maximum activity. To
achieve this goal, future work will have to overcome many limitations. While we observed
powerful inhibitory effects of processed cocoa powders, the specific compounds and
mechanisms driving these activities is still largely unknown. Additionally, the variety of beans
used to produce cocoa powders of 7 different treatments was unknown. In the future is would be
valuable to look at different bean varieties from various growing regions to determine how these
factors play into the implications of processing (fermentation and roasting) and bioactivity.
Processing conditions can also be expanded upon to include a more focused range of optimal
conditions and techniques. Beneficial studies to perform in the future would be to expand this in
vitro work in vivo to begin to elucidate the mechanisms of various cocoa compounds that exhibit
health protective activities. Extracts of controlled processed cocoas could be fractioned into low,
intermediate, and high molecular weight MR products and melanoidins and used in vitro and in
vivo to determine the enzyme inhibiting potential and ultimately the behavior of these fractions
115
in the GI track. Utilization of MALDI-TOF and NMR techniques could assist in characterizing
these various fractions and determining structural characteristics.
The research conducted for this thesis begins to delve into the relationship between cocoa
processing and bioactivity, as well as identifying and developing various strategies to quantify
and preliminarily characterize large complex cocoa compounds. This work continues to
challenge the widely accepted assumption that degradation of native cocoa polyphenols
subsequently results in a decrease in overall bioactivity. The results from these data directly
contradict this assumption and begin to focus on the newly discovered concept that cocoa
processing may in fact enhance bioactivity.
116
APPENDIX A: SUPPLEMENTARY INFORMATION FOR CHAPTER 5
A1. SUPPLEMENTARY MATERIALS AND METHODS
Polyphenol extraction and quantification: Randomly selected whole cocoa beans (30 g) were
frozen with liquid nitrogen and ground into powder. Cocoa powders (40 g, from pressing or from
ground beans) were mixed with 150 mL hexane and sonicated (10 min, 22°C), centrifuged for (5
min, 5000 × g), supernatant discarded, and then repeated. Once defatted, the powder was dried at
room temperature. Once dry, defatted powder was mixed with 150 mL of extraction solution
(70:28:2 acetone, water, acetic acid v/v/v), sonicated (10 min, 22°C), and centrifuged for (5 min,
5000 × g). The supernatant was collected and this procedure was repeated three more times for a
total volume of 600 mL. All collected supernatant was pooled and placed under vacuum on a
rotary evaporator at 40°C until all acetone evaporated. The resulting cocoa extract was frozen at
−80°C, freeze dried, and the final extract was weighed to calculate extract yield. The freeze dried
extract was stored at −80°C until further analysis.
Folin-Ciocalteu colorimetric assay: Cocoa extracts (n=3) were diluted with 40% EtOH to a
final concentration of 0.2 mg/mL. In a 96-well plate, each solution (5 µL) was mixed with MQ
water (45 µL) and 0.2 N Folin-Ciocalteu reagent (125 µL). 100 µL sodium carbonate solution
(7.5% v/v) was added to the samples and mixed. The plate was incubated for 2 h at room
temperature and the absorbance read at 765 nm. Samples were compared to gallic acid standard
curves (n=2). Total polyphenol concentrations were expressed as mg Gallic Acid Equivalents
(GAE)/g cocoa bean.
4-dimethylaminocinnamaldehyde (DMAC) colorimetric assay: DMAC solution was prepared
by combining 3.0 mL stock HCl with 27 mL EtOH and chilling at 4°C for 15 min, 0.03 g DMAC
was added to the solution and mixed well. Cocoa extracts were diluted with EtOH to a final
concentration of 100 ppm. Standard curve (n=2) was prepared by diluting procyanidin B2 with
1:1 EtOH:water to concentrations of 1, 10 50, and 100 ppm. In a 96-well plate, each diluted
cocoa extract, PCB2 standard (1, 10, 50, 100 ppm), and EtOH blank (50 µL) was mixed with 250
µL of DMAC solution. Absorbance was read at 640 nm.
117
Thiolysis: Cocoa extracts were diluted with MeOH to 0.5 mg/mL and then mixed (50 µL) with
50 µL HCl (3.3%, water) and 100 µL benzyl mercaptan (5%, MeOH). Samples were placed in a
90°C water bath for 5 min and then cooled on ice for 5 min. Unthiolyzed controls were prepared
with cocoa extract and MeOH without heating in the water bath. Each thiolyzed sample (100 µL)
was combined with 900 µL of 0.1% formic acid in water and 0.1% formic acid in ACN (95:5
v/v). Samples were analyzed on a Waters Acquity H-Class separations module with an Acquity
UPLC HSS T3 column (2.1 mm × 100 mm, 1.8 µm) at 40°C. Binary gradient elution was
performed using 0.1% formic acid in water (Phase A) and 0.1% formic acid in ACN (Phase B).
Solvent flow rate was 0.6 mL/min and the linear gradient elution was as followed: 95% A (0-0.5
min), 65% A (6.5 min), 20% A (7.5-8.6 min), 95% A (8.7-10.5). (−)-electrospray ionization
(ESI) together with tandem mass spectrometry (MS/MS) was used to analyze UPLC effluent on
a Waters Acquity triple quadrupole (TQD) MS. (−) mode electrospray ionization (ESI) was
performed with capillary, cone, and extractor voltages of −4.24 kV, 30.0 V, and 3.0 V
respectively. Source temperature was 150°C and desolvation temperature was 400°C/ Cone gas
flowed at a rate of 75 L/h and desolvation gas at 900 L/h. Argon (0.25 mL/min) was used as the
collision gas in MS/MS. Multi-reaction monitoring (MRM) with a mass span of 0.2 Da was
performed on parent ions and collision-induced dissociation (CID) on daughter ions. Inter-
channel delays and interscan time was 1.0 s each. Additional calculations were done to account
for the native monomers and were reported as DP of total flavanols. mDP oligomers and
polymers and mDP of total flavanols were calculated as follows:
𝑚𝐷𝑃 (𝑂 + 𝑃) =𝑛𝑒𝑡 𝑛𝑢𝑚𝑏𝑒𝑟 𝑜𝑓 𝑚𝑜𝑛𝑜𝑚𝑒𝑟𝑠 + 𝑛𝑒𝑡 𝑛𝑢𝑚𝑏𝑒𝑟 𝑜𝑓 𝑡ℎ𝑖𝑜𝑙𝑦𝑡𝑖𝑐 𝑑𝑒𝑟𝑖𝑣𝑎𝑡𝑖𝑣𝑒𝑠
𝑛𝑒𝑡 𝑛𝑢𝑚𝑏𝑒𝑟 𝑜𝑓 𝑚𝑜𝑛𝑜𝑚𝑒𝑟𝑠
𝑚𝐷𝑃 (𝑡𝑜𝑡𝑎𝑙 𝑓𝑙𝑎𝑣𝑎𝑛𝑜𝑙𝑠) =𝑡𝑜𝑡𝑎𝑙 𝑚𝑜𝑛𝑜𝑚𝑒𝑟𝑠 + 𝑛𝑒𝑡 𝑛𝑢𝑚𝑏𝑒𝑟 𝑜𝑓 𝑡ℎ𝑖𝑜𝑙𝑦𝑡𝑖𝑐 𝑑𝑒𝑟𝑖𝑣𝑎𝑡𝑖𝑣𝑒𝑠
𝑡𝑜𝑡𝑎𝑙 𝑚𝑜𝑛𝑜𝑚𝑒𝑟𝑠
HILIC UPLC-MS/MS: A Waters Acquity H-class separation module equipped with an Acquity
Torus DIOL column (2.1 mm × 100 mm, 1.7 µL, 45°C) and Torus DIOL VanGuard Pre-column
(2.1 mm × 5 mm, 1.7µL) was used to perform the analysis. Binary gradient elution was
performed with 2% acetic acid in acetonitrile (phase A) and 3% water and 2% acetic acid in
methanol (phase B). Solvent flow rate was 0.8 mL/min and the linear gradient elution was
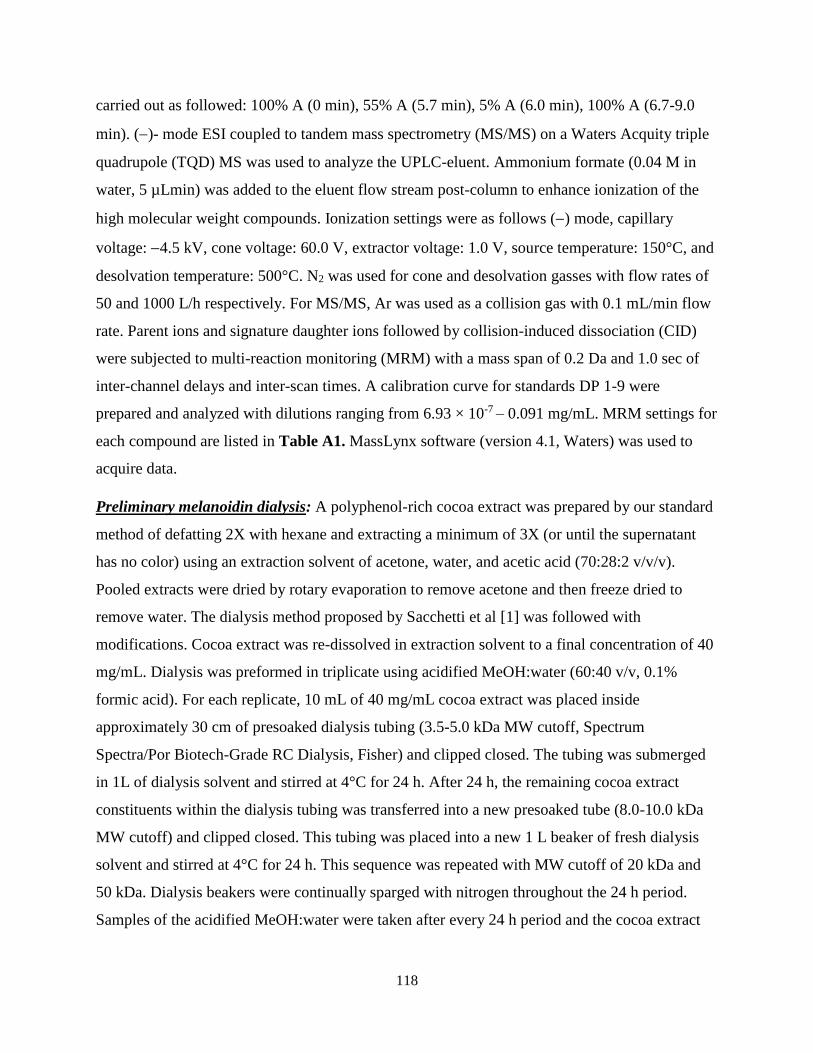
118
carried out as followed: 100% A (0 min), 55% A (5.7 min), 5% A (6.0 min), 100% A (6.7-9.0
min). (−)- mode ESI coupled to tandem mass spectrometry (MS/MS) on a Waters Acquity triple
quadrupole (TQD) MS was used to analyze the UPLC-eluent. Ammonium formate (0.04 M in
water, 5 µLmin) was added to the eluent flow stream post-column to enhance ionization of the
high molecular weight compounds. Ionization settings were as follows (−) mode, capillary
voltage: −4.5 kV, cone voltage: 60.0 V, extractor voltage: 1.0 V, source temperature: 150°C, and
desolvation temperature: 500°C. N2 was used for cone and desolvation gasses with flow rates of
50 and 1000 L/h respectively. For MS/MS, Ar was used as a collision gas with 0.1 mL/min flow
rate. Parent ions and signature daughter ions followed by collision-induced dissociation (CID)
were subjected to multi-reaction monitoring (MRM) with a mass span of 0.2 Da and 1.0 sec of
inter-channel delays and inter-scan times. A calibration curve for standards DP 1-9 were
prepared and analyzed with dilutions ranging from 6.93 × 10⁻⁷ – 0.091 mg/mL. MRM settings for
each compound are listed in Table A1. MassLynx software (version 4.1, Waters) was used to
acquire data.
Preliminary melanoidin dialysis: A polyphenol-rich cocoa extract was prepared by our standard
method of defatting 2X with hexane and extracting a minimum of 3X (or until the supernatant
has no color) using an extraction solvent of acetone, water, and acetic acid (70:28:2 v/v/v).
Pooled extracts were dried by rotary evaporation to remove acetone and then freeze dried to
remove water. The dialysis method proposed by Sacchetti et al [1] was followed with
modifications. Cocoa extract was re-dissolved in extraction solvent to a final concentration of 40
mg/mL. Dialysis was preformed in triplicate using acidified MeOH:water (60:40 v/v, 0.1%
formic acid). For each replicate, 10 mL of 40 mg/mL cocoa extract was placed inside
approximately 30 cm of presoaked dialysis tubing (3.5-5.0 kDa MW cutoff, Spectrum
Spectra/Por Biotech-Grade RC Dialysis, Fisher) and clipped closed. The tubing was submerged
in 1L of dialysis solvent and stirred at 4°C for 24 h. After 24 h, the remaining cocoa extract
constituents within the dialysis tubing was transferred into a new presoaked tube (8.0-10.0 kDa
MW cutoff) and clipped closed. This tubing was placed into a new 1 L beaker of fresh dialysis
solvent and stirred at 4°C for 24 h. This sequence was repeated with MW cutoff of 20 kDa and
50 kDa. Dialysis beakers were continually sparged with nitrogen throughout the 24 h period.
Samples of the acidified MeOH:water were taken after every 24 h period and the cocoa extract
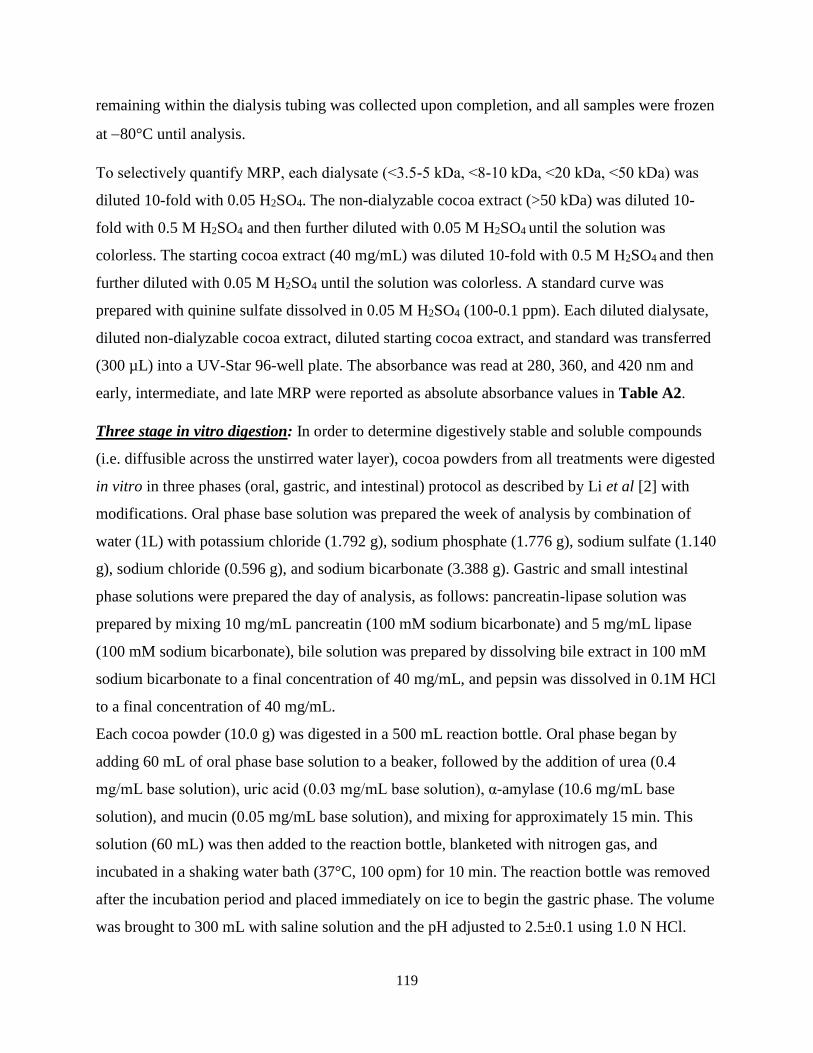
119
remaining within the dialysis tubing was collected upon completion, and all samples were frozen
at −80°C until analysis.
To selectively quantify MRP, each dialysate (˂3.5-5 kDa, ˂8-10 kDa, ˂20 kDa, ˂50 kDa) was
diluted 10-fold with 0.05 H2SO4. The non-dialyzable cocoa extract (>50 kDa) was diluted 10-
fold with 0.5 M H2SO4 and then further diluted with 0.05 M H2SO4 until the solution was
colorless. The starting cocoa extract (40 mg/mL) was diluted 10-fold with 0.5 M H2SO4 and then
further diluted with 0.05 M H2SO4 until the solution was colorless. A standard curve was
prepared with quinine sulfate dissolved in 0.05 M H2SO4 (100-0.1 ppm). Each diluted dialysate,
diluted non-dialyzable cocoa extract, diluted starting cocoa extract, and standard was transferred
(300 µL) into a UV-Star 96-well plate. The absorbance was read at 280, 360, and 420 nm and
early, intermediate, and late MRP were reported as absolute absorbance values in Table A2.
Three stage in vitro digestion: In order to determine digestively stable and soluble compounds
(i.e. diffusible across the unstirred water layer), cocoa powders from all treatments were digested
in vitro in three phases (oral, gastric, and intestinal) protocol as described by Li et al [2] with
modifications. Oral phase base solution was prepared the week of analysis by combination of
water (1L) with potassium chloride (1.792 g), sodium phosphate (1.776 g), sodium sulfate (1.140
g), sodium chloride (0.596 g), and sodium bicarbonate (3.388 g). Gastric and small intestinal
phase solutions were prepared the day of analysis, as follows: pancreatin-lipase solution was
prepared by mixing 10 mg/mL pancreatin (100 mM sodium bicarbonate) and 5 mg/mL lipase
(100 mM sodium bicarbonate), bile solution was prepared by dissolving bile extract in 100 mM
sodium bicarbonate to a final concentration of 40 mg/mL, and pepsin was dissolved in 0.1M HCl
to a final concentration of 40 mg/mL.
Each cocoa powder (10.0 g) was digested in a 500 mL reaction bottle. Oral phase began by
adding 60 mL of oral phase base solution to a beaker, followed by the addition of urea (0.4
mg/mL base solution), uric acid (0.03 mg/mL base solution), α-amylase (10.6 mg/mL base
solution), and mucin (0.05 mg/mL base solution), and mixing for approximately 15 min. This
solution (60 mL) was then added to the reaction bottle, blanketed with nitrogen gas, and
incubated in a shaking water bath (37°C, 100 opm) for 10 min. The reaction bottle was removed
after the incubation period and placed immediately on ice to begin the gastric phase. The volume
was brought to 300 mL with saline solution and the pH adjusted to 2.5±0.1 using 1.0 N HCl.
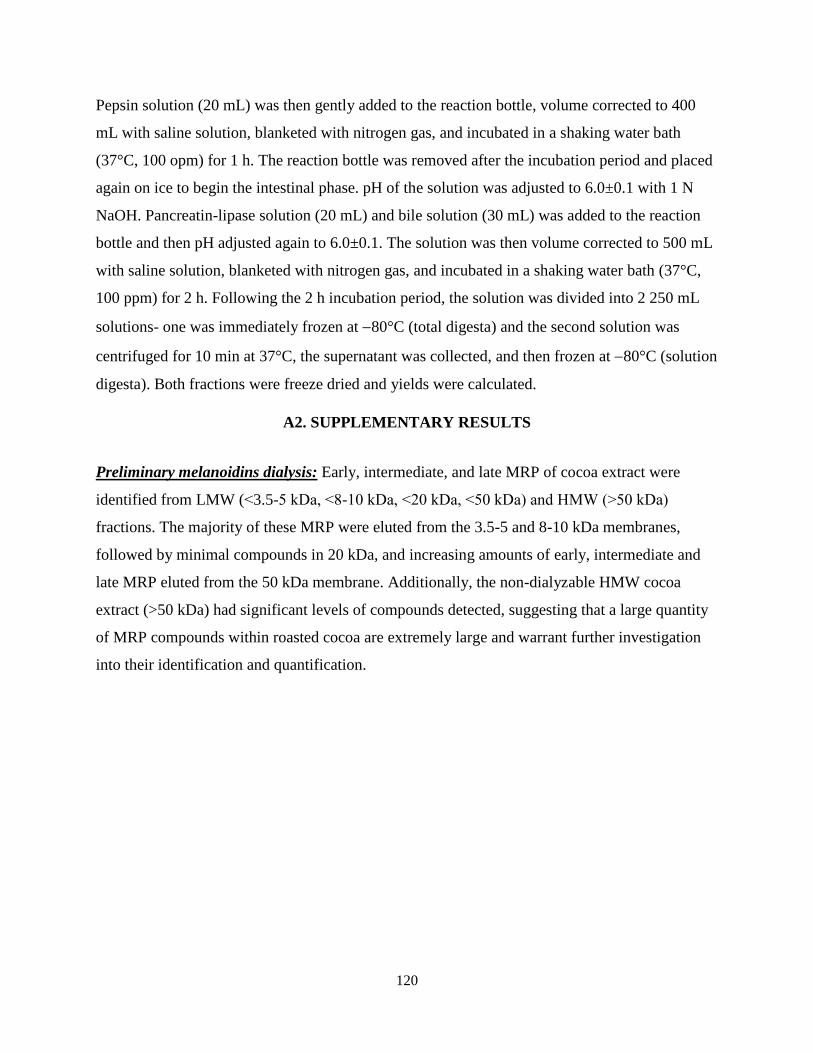
120
Pepsin solution (20 mL) was then gently added to the reaction bottle, volume corrected to 400
mL with saline solution, blanketed with nitrogen gas, and incubated in a shaking water bath
(37°C, 100 opm) for 1 h. The reaction bottle was removed after the incubation period and placed
again on ice to begin the intestinal phase. pH of the solution was adjusted to 6.0±0.1 with 1 N
NaOH. Pancreatin-lipase solution (20 mL) and bile solution (30 mL) was added to the reaction
bottle and then pH adjusted again to 6.0±0.1. The solution was then volume corrected to 500 mL
with saline solution, blanketed with nitrogen gas, and incubated in a shaking water bath (37°C,
100 ppm) for 2 h. Following the 2 h incubation period, the solution was divided into 2 250 mL
solutions- one was immediately frozen at −80°C (total digesta) and the second solution was
centrifuged for 10 min at 37°C, the supernatant was collected, and then frozen at −80°C (solution
digesta). Both fractions were freeze dried and yields were calculated.
A2. SUPPLEMENTARY RESULTS
Preliminary melanoidins dialysis: Early, intermediate, and late MRP of cocoa extract were
identified from LMW (˂3.5-5 kDa, ˂8-10 kDa, ˂20 kDa, ˂50 kDa) and HMW (>50 kDa)
fractions. The majority of these MRP were eluted from the 3.5-5 and 8-10 kDa membranes,
followed by minimal compounds in 20 kDa, and increasing amounts of early, intermediate and
late MRP eluted from the 50 kDa membrane. Additionally, the non-dialyzable HMW cocoa
extract (>50 kDa) had significant levels of compounds detected, suggesting that a large quantity
of MRP compounds within roasted cocoa are extremely large and warrant further investigation
into their identification and quantification.
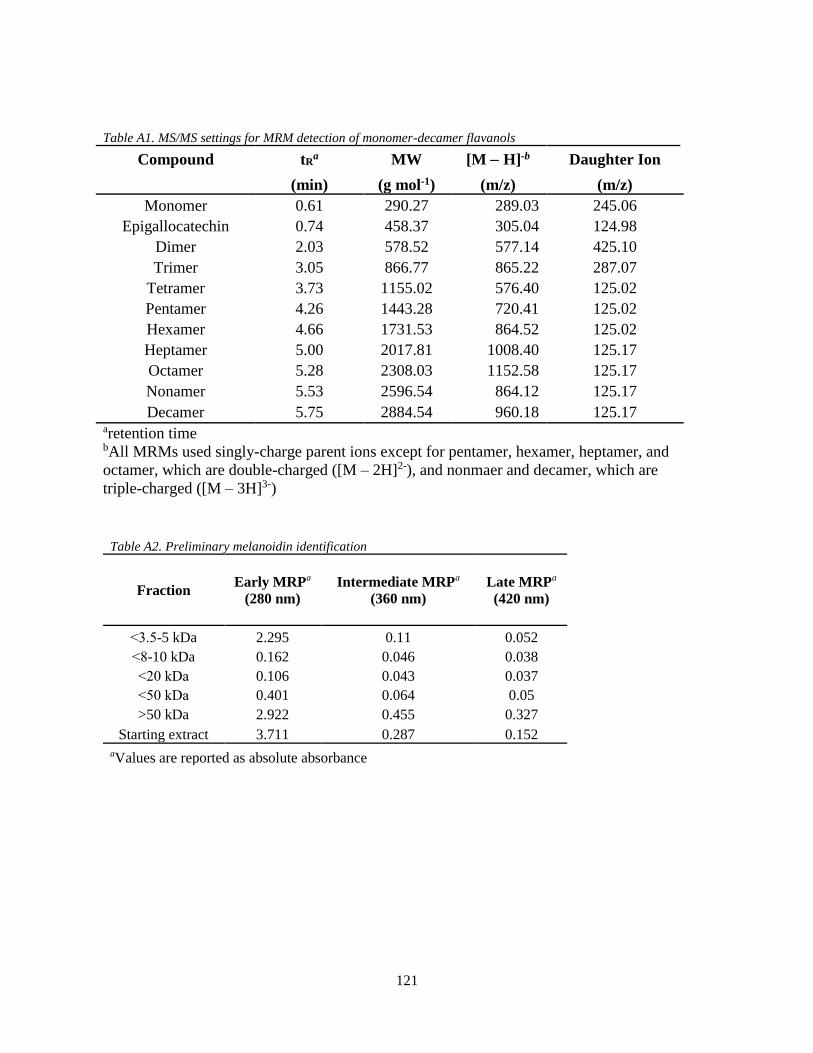
121
Table A1. MS/MS settings for MRM detection of monomer-decamer flavanols
Compound tRa MW [M − H]-b Daughter Ion
(min) (g mol-1) (m/z) (m/z)
Monomer 0.61 290.27 289.03 245.06
Epigallocatechin 0.74 458.37 305.04 124.98
Dimer 2.03 578.52 577.14 425.10
Trimer 3.05 866.77 865.22 287.07
Tetramer 3.73 1155.02 576.40 125.02
Pentamer 4.26 1443.28 720.41 125.02
Hexamer 4.66 1731.53 864.52 125.02
Heptamer 5.00 2017.81 1008.40 125.17
Octamer 5.28 2308.03 1152.58 125.17
Nonamer 5.53 2596.54 864.12 125.17
Decamer 5.75 2884.54 960.18 125.17 aretention time bAll MRMs used singly-charge parent ions except for pentamer, hexamer, heptamer, and
octamer, which are double-charged ([M – 2H]2-), and nonmaer and decamer, which are
triple-charged ([M – 3H]3-)
Table A2. Preliminary melanoidin identification
Fraction Early MRPa
(280 nm)
Intermediate MRPa
(360 nm)
Late MRPa
(420 nm)
˂3.5-5 kDa 2.295 0.11 0.052
˂8-10 kDa 0.162 0.046 0.038
˂20 kDa 0.106 0.043 0.037
˂50 kDa 0.401 0.064 0.05
>50 kDa 2.922 0.455 0.327
Starting extract 3.711 0.287 0.152
aValues are reported as absolute absorbance
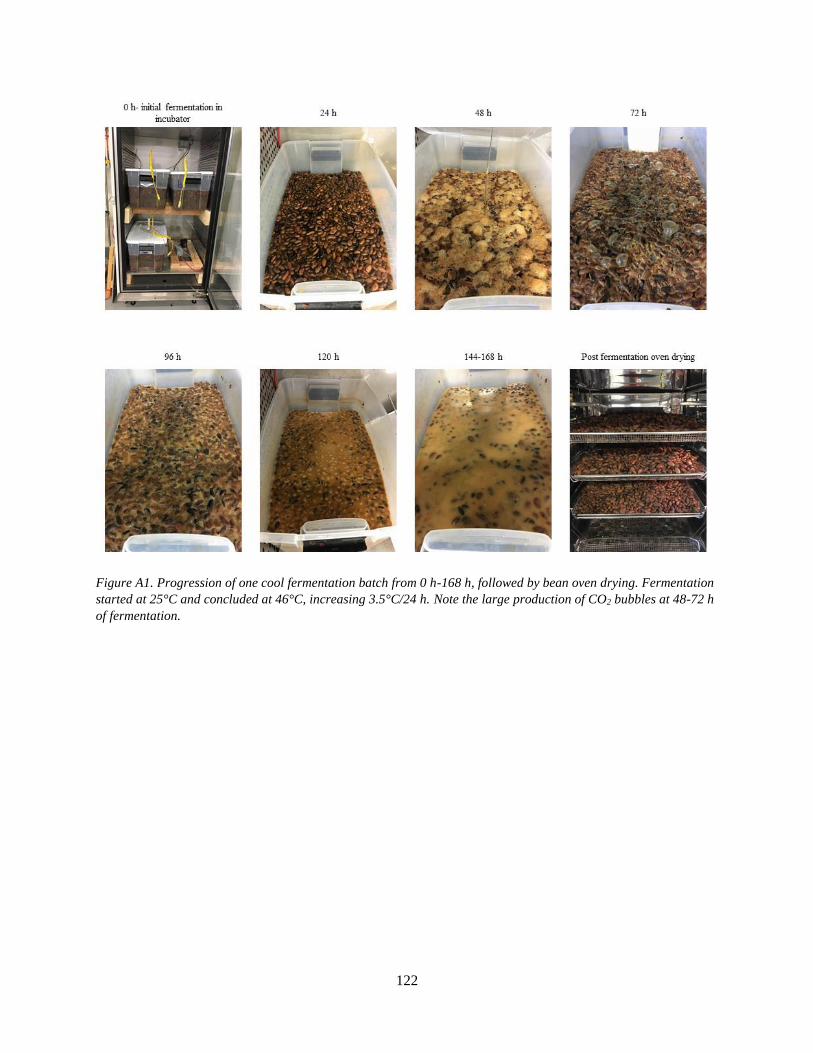
122
Figure A1. Progression of one cool fermentation batch from 0 h-168 h, followed by bean oven drying. Fermentation
started at 25°C and concluded at 46°C, increasing 3.5°C/24 h. Note the large production of CO2 bubbles at 48-72 h
of fermentation.
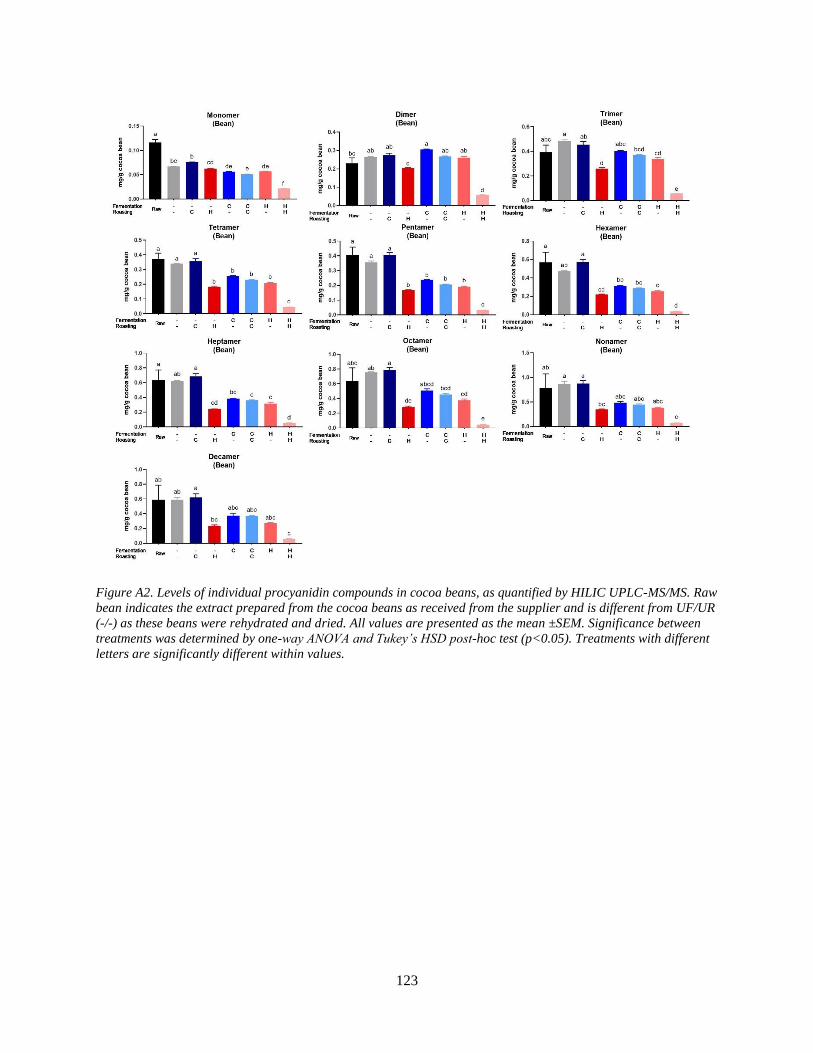
123
Figure A2. Levels of individual procyanidin compounds in cocoa beans, as quantified by HILIC UPLC-MS/MS. Raw
bean indicates the extract prepared from the cocoa beans as received from the supplier and is different from UF/UR
(-/-) as these beans were rehydrated and dried. All values are presented as the mean ±SEM. Significance between
treatments was determined by one-way ANOVA and Tukey’s HSD post-hoc test (p<0.05). Treatments with different
letters are significantly different within values.
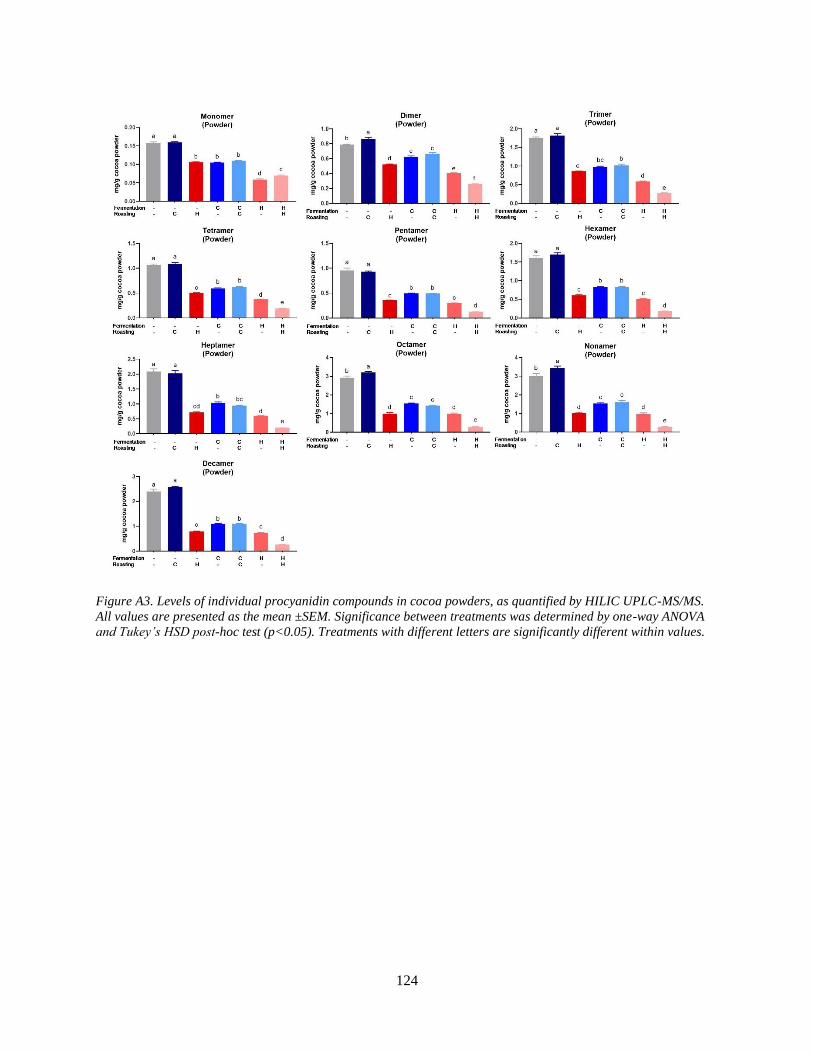
124
Figure A3. Levels of individual procyanidin compounds in cocoa powders, as quantified by HILIC UPLC-MS/MS.
All values are presented as the mean ±SEM. Significance between treatments was determined by one-way ANOVA
and Tukey’s HSD post-hoc test (p<0.05). Treatments with different letters are significantly different within values.
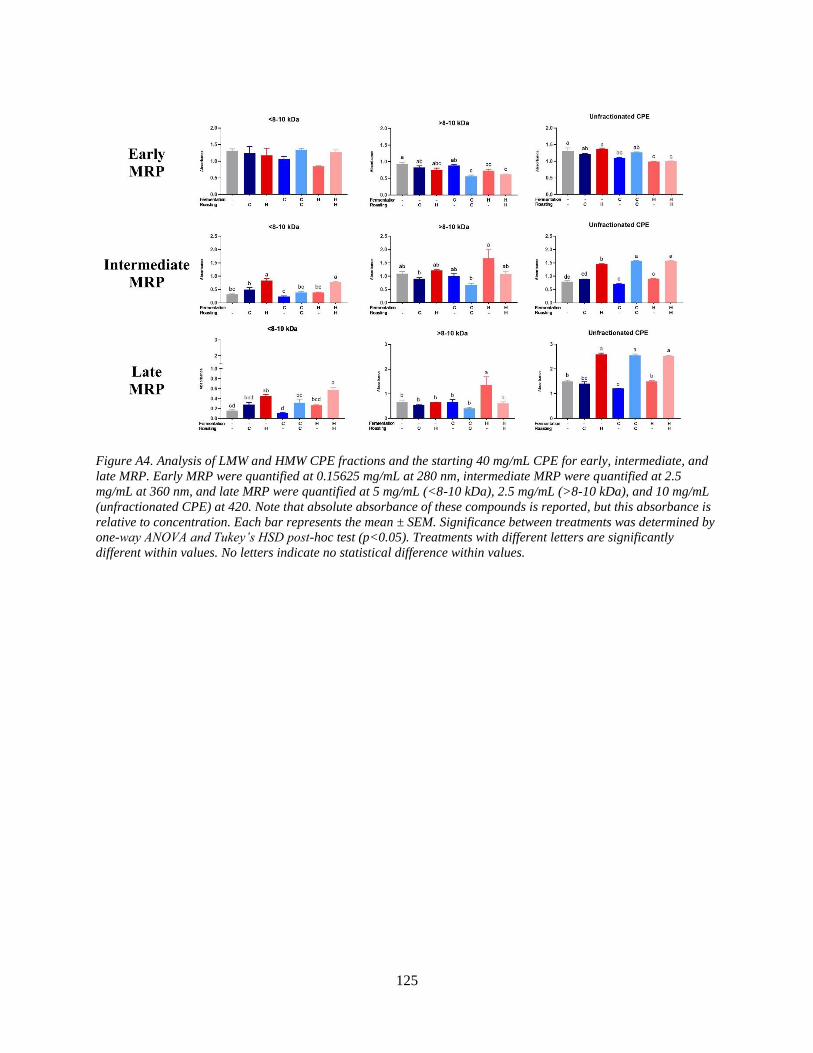
125
Figure A4. Analysis of LMW and HMW CPE fractions and the starting 40 mg/mL CPE for early, intermediate, and
late MRP. Early MRP were quantified at 0.15625 mg/mL at 280 nm, intermediate MRP were quantified at 2.5
mg/mL at 360 nm, and late MRP were quantified at 5 mg/mL (<8-10 kDa), 2.5 mg/mL (>8-10 kDa), and 10 mg/mL
(unfractionated CPE) at 420. Note that absolute absorbance of these compounds is reported, but this absorbance is
relative to concentration. Each bar represents the mean ± SEM. Significance between treatments was determined by
one-way ANOVA and Tukey’s HSD post-hoc test (p<0.05). Treatments with different letters are significantly
different within values. No letters indicate no statistical difference within values.
126
APPENDIX B: COPYRIGHT RELEASE
Chapter 3: Development of a Rapid HILIC UPLC-MS/MS Method for Procyanidins with
Enhanced Ionization Efficiency
Published in Journal of Chromatography A
Chapter 4: Development and Characterization of a Pilot-Scale Model Cocoa Fermentation
System Suitable for Studying the Impact of Fermentation on Putative Bioactive Compounds and
Bioactivity of Cocoa
Published in Foods