ET Theory 101 - University of California,...
47
ET Theory 101 ET Theory 101 USCID Workshop USCID Workshop http:// http:// biomet.ucdavis.edu biomet.ucdavis.edu PMhr PMhr , , PMday PMday , , PMmon PMmon CUP, SIMETAW (DWR link) CUP, SIMETAW (DWR link) R.L. Snyder, Biometeorology Specialist Copyright © Regents of the University of California
Transcript of ET Theory 101 - University of California,...

ET Theory 101ET Theory 101
USCID WorkshopUSCID Workshop
http://http://biomet.ucdavis.edubiomet.ucdavis.edu
PMhrPMhr, , PMdayPMday, , PMmonPMmon
CUP, SIMETAW (DWR link)CUP, SIMETAW (DWR link)
R.L. Snyder, Biometeorology Specialist Copyright © Regents of the University of California
Methods of Heat TransferMethods of Heat TransferConductionConduction-- from molecule to moleculefrom molecule to molecule
Heat Heat SourceSource
ConvectionConvection -- by movement of by movement of heated airheated air
Metal barMetal bar
RadiationRadiation -- energy passing energy passing from one object to another from one object to another without a connecting mediumwithout a connecting medium
Long wave Long wave loss from loss from EarthEarth
Short wave Short wave gained from gained from the sunthe sun EarthEarth
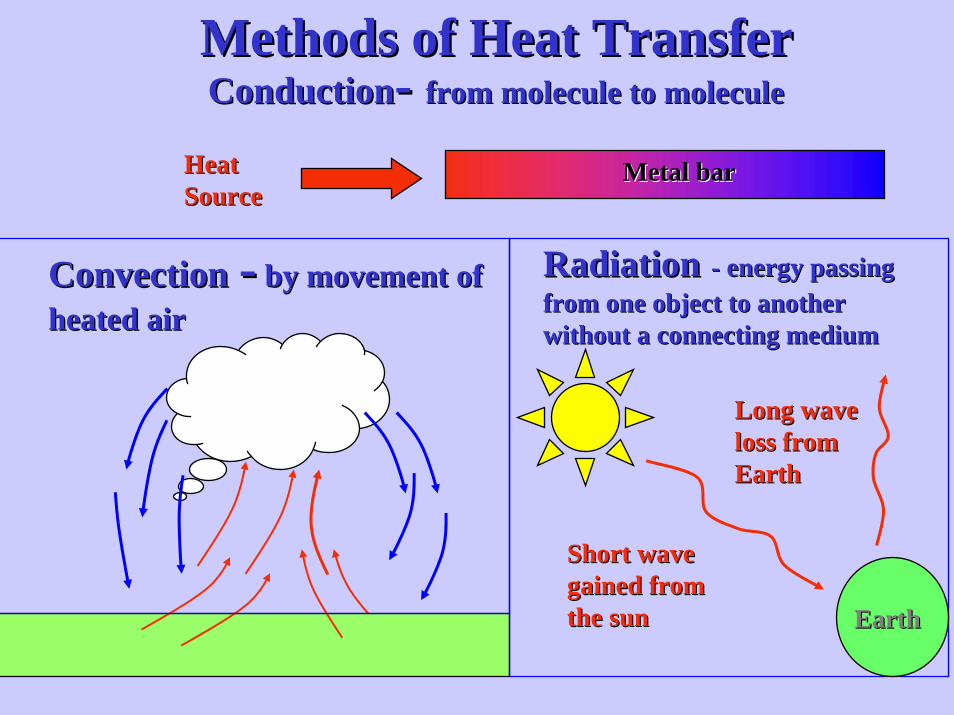
Questions 1 and 2Questions 1 and 21. How many molecules
of air are in a cubic meter?
1. If six billion people count 1000 molecules per hour, it would take 511 million years to count the number of molecules in 1 m3
2.69 x 1025
26,900,000,000,000,000,000,000,000 molecules m26,900,000,000,000,000,000,000,000 molecules m--33
2. The air is mostly nitrogen? (T/F)?
2. Air is mostly empty space. Less than 0.1% of the volume is occupied by moleculesFalse
Horstmeyer, S. 2001. Weatherwise 54:20-27.

Questions 3 and 4Questions 3 and 43. At 30oC, velocities
N2 - 1709 Km h-1
O2 - 1603 Km h-1
CO2 - 1366 Km h-1
H2O - 2136 Km h-1
3. Which molecules move faster? A. nitrogen B. oxygen C. carbon dioxide D. water vapor
4. False! Less than 0.1% of volume is occupied. Air can hold more water.
4. When saturated, the air cannot hold more water vapor (T/F)?
Horstmeyer, S. 2001. Weatherwise 54:20-27.

Questions 5Questions 5
5. How many molecule collisions per second occur in a m3 of air?
5. There are about 595 trillion collisions per second between air molecules in a m3 of air.
595,000,000,000,000 collisions/sec595,000,000,000,000 collisions/sec
Occupy < 0.1% volumeOccupy < 0.1% volume
26,900,000,000,000,000,000,000,000 molecules m26,900,000,000,000,000,000,000,000 molecules m--33
Horstmeyer, S. 2001. Weatherwise 54:20-27.
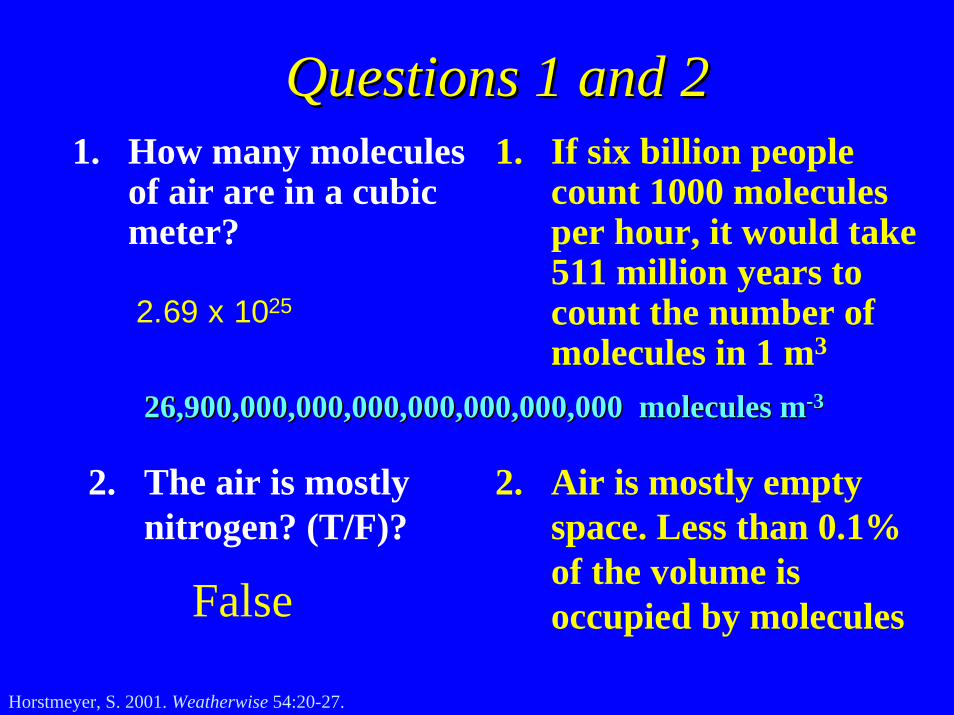
Sensible Heat & TemperatureSensible Heat & Temperature
Lower temperature Lower temperature LessLess sensible heatsensible heat
Higher temperature Higher temperature MoreMore sensible heatsensible heat

HO
H
Water Molecules consistof one oxygen and twohydrogen atoms
Water Molecule

Methods of Heat TransferMethods of Heat TransferLatent Heat Latent Heat -- Chemical HeatChemical Heat
HO H
When water moleculesevaporate, sensible heat ischanged to latent heat andthe temperature drops
H O
H
When water moleculescondense, latent heat ischanged to sensible heatand the temperature rises

More Water Vapor More Latent HeatMore Water Vapor More Latent Heat
HH O
HH O
OH
H
H
HO
H HO
HH O
H
H
O
H
HO
H
HO
I am a free water vapor
moleculeEnergy breaks our hydrogen bonds and sets
us free
Latent heat

Questions 6 Questions 6
6.6. False, there is more False, there is more total heat in humid total heat in humid than in dry air to than in dry air to melt the ice creammelt the ice cream
6.6. Your ice cream will Your ice cream will melt faster at 35% melt faster at 35% RH than at 75% RH than at 75% RH (T/F)?RH (T/F)?

Which wet towel dries fastest?Which wet towel dries fastest?
30 % RH30 % RH 70 % RH70 % RH
TTaa = 30 = 30 ooCC
Adiabatic ProcessAdiabatic Process
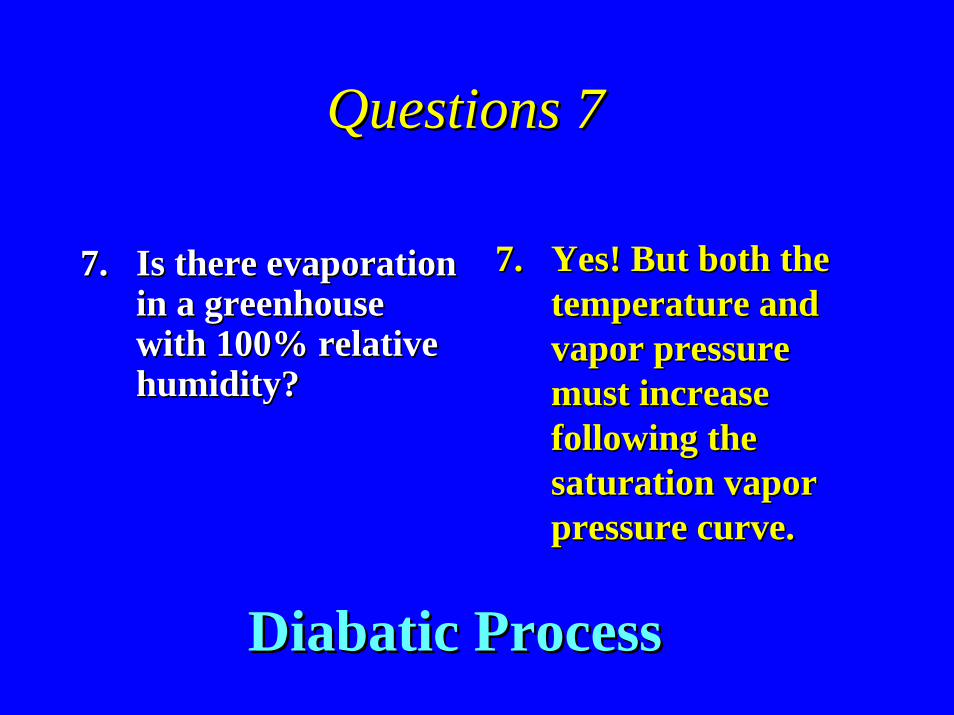
Questions 7 Questions 7
7.7. Yes! But both the Yes! But both the temperature and temperature and vapor pressure vapor pressure must increase must increase
7.7. Is there evaporation Is there evaporation in a greenhouse in a greenhouse with 100% relative with 100% relative humidity?humidity?
following the following the saturation vapor saturation vapor pressure curve. pressure curve.
DiabaticDiabatic ProcessProcess

RadiationRadiation4TE εσ=
ε = 1.0 for a black body
ε < 1.0 for a gray body
σσ= 5.67 = 5.67 ×× 1010--88 W mW m--22 KK--11
TT = absolute temperature = = absolute temperature = ooC+273.15C+273.15

Blackbody spectral emittance for Sun and Earth
0
20
40
60
80
100
0.1 1 10 100
Wavelength (µm)
Sola
r Spe
ctra
l Em
ittan
ce (M
W m
-2 µ
m-1
)
6000 K 288 K Eart
h Sp
ectr
al E
mitt
ance
(W m
-2 µ
m-1
)
0
10
20
30
73,483,200 W m73,483,200 W m--22 390 W m390 W m--22
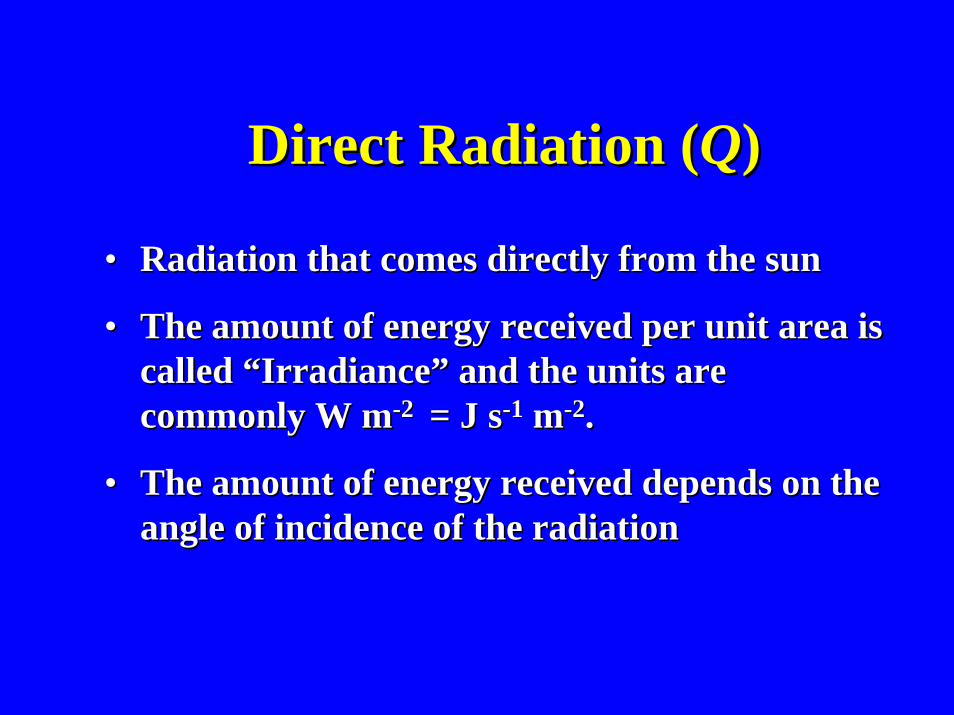
Direct Radiation (Direct Radiation (QQ))
•• Radiation that comes directly from the sun Radiation that comes directly from the sun
•• The amount of energy received per unit area is The amount of energy received per unit area is called “Irradiance” and the units are called “Irradiance” and the units are commonly W mcommonly W m--2 2 = J s= J s--11 mm--22..
•• The amount of energy received depends on the The amount of energy received depends on the angle of incidence of the radiationangle of incidence of the radiation

Direct beam radiation interception (W mDirect beam radiation interception (W m--22))
0o
60o
60o
30o
Qs500 433 250
QQss = Q = Q cos(cos(αα))

Diffuse Radiation (Diffuse Radiation (qq))
•• Solar radiation that is scattered by the sky and Solar radiation that is scattered by the sky and comes from all directions. comes from all directions.
•• During much of the day, about 10 to 15% of During much of the day, about 10 to 15% of the radiation received on a flat surface is the radiation received on a flat surface is diffuse radiation. diffuse radiation.
•• The diffuse radiation is nearly the same The diffuse radiation is nearly the same regardless of the surface orientation.regardless of the surface orientation.
•• The percentage of diffuse radiation is higher The percentage of diffuse radiation is higher near sunrise and sunset.near sunrise and sunset.

Direct and diffuse radiation (W mDirect and diffuse radiation (W m--22))
0o
60o
60o
30o
Qs
Qs+ q500
535
433
468
250
285
Rs = Qs + q
q ≈ 0.15 Qs on a horizontal sfc

0
10
20
30
0.1 1 10 100
Vegetation height (m)
Ref
lect
ion
(%)
AlbedoAlbedo

Net solar radiation (W mNet solar radiation (W m--22))
0o
60o
60o
30o
Qs
Qs+ q
α= 0.25
500
535
401
433
468
351
250
285
214
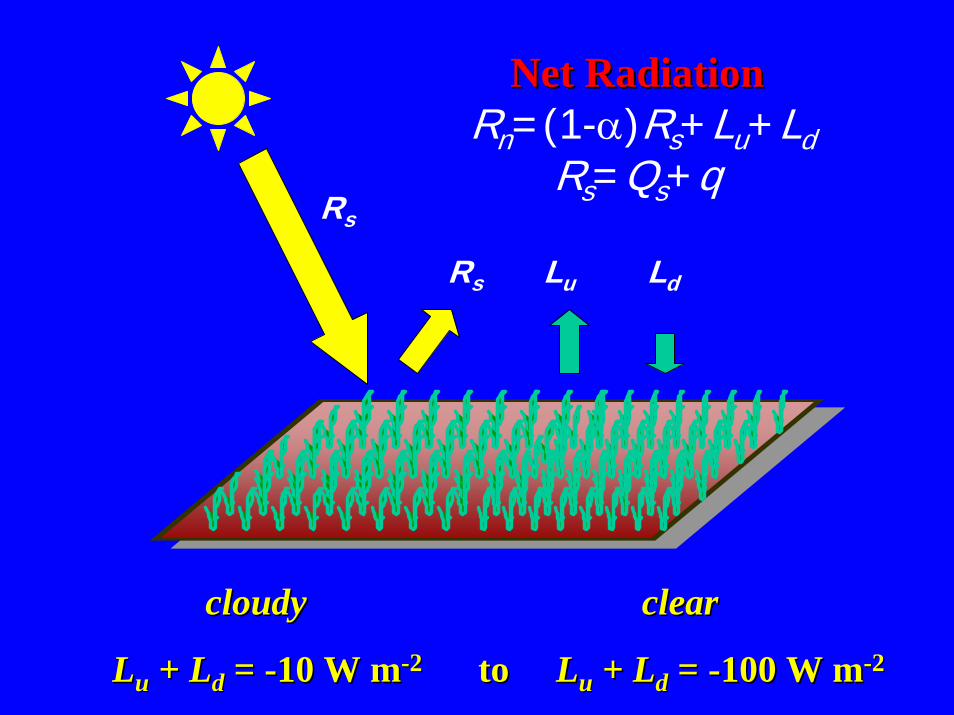
Net RadiationNet RadiationRn=(1-α)Rs+Lu+Ld
Rs=Qs+qRs
Rs Lu Ld
cloudy clearcloudy clear
LLuu + L+ Ldd = = --10 W m10 W m--22 to to LLuu + L+ Ldd = = --100 W m100 W m--22

Net radiation (W mNet radiation (W m--22))
0o
60o
60o
30o
Qs
Qs+ q
α= 0.25
RLn =-100
500
535
401
301
433
468
351
251
250
285
214
114
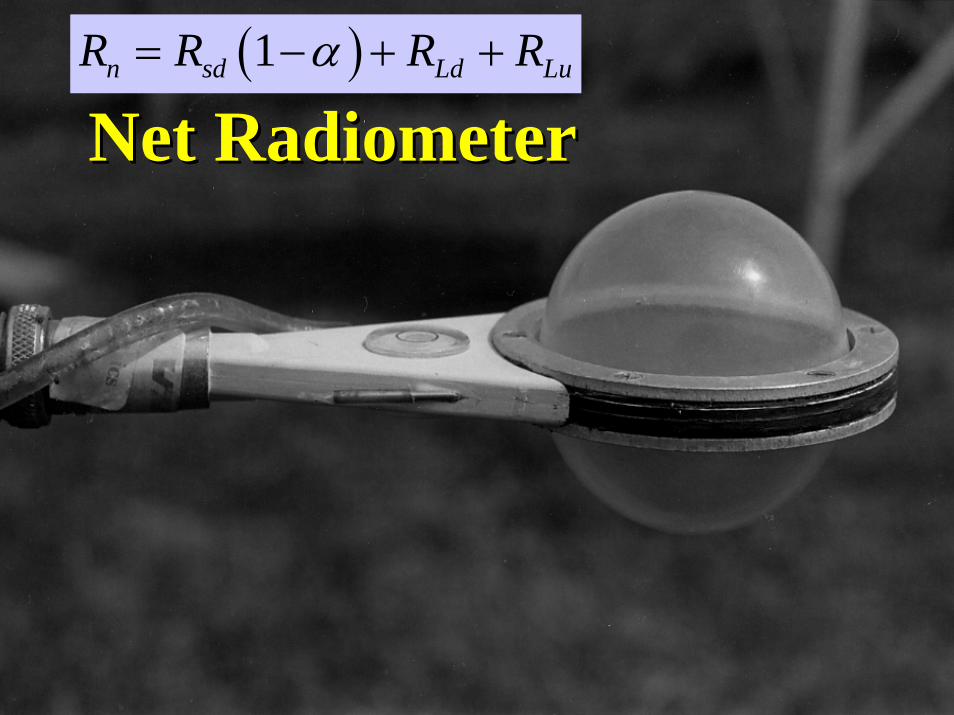
Net RadiometerNet Radiometer( )1n sd Ld LuR R R Rα= − + +
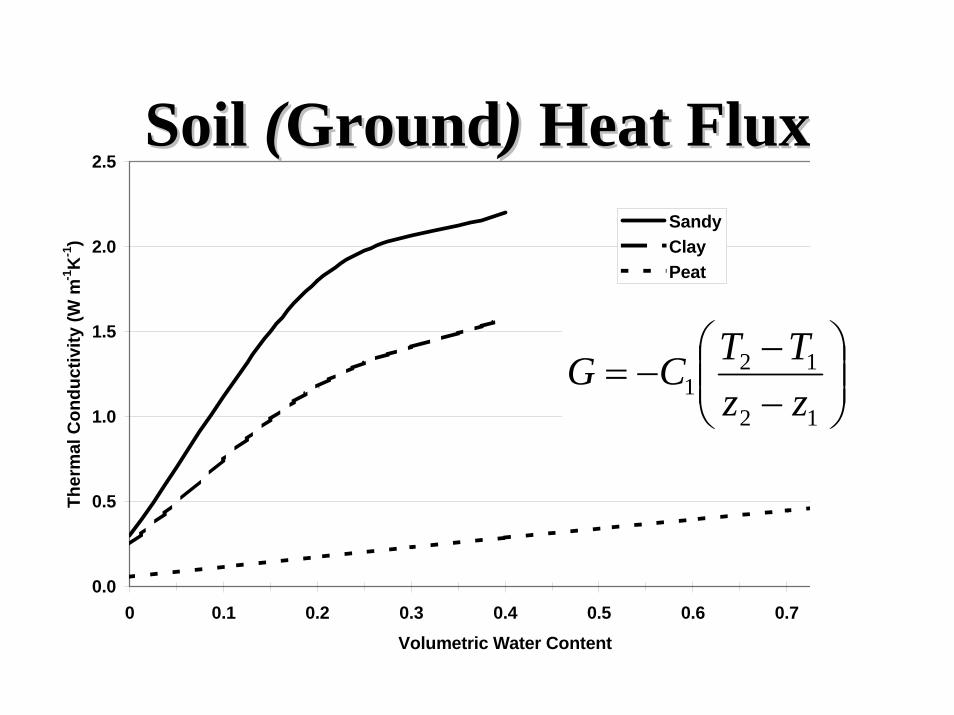
Soil Soil ((GroundGround)) Heat FluxHeat Flux
1TG Cz
∂= −
∂
0.0
0.5
1.0
1.5
2.0
2.5
0 0.1 0.2 0.3 0.4 0.5 0.6 0.7 0.8Volumetric Water Content
Ther
mal
Con
duct
ivity
(W m
-1K
-1)
SandyClayPeat
(b)
⎟⎟⎠
⎞⎜⎜⎝
⎛−−
−=12
121 zz
TTCG
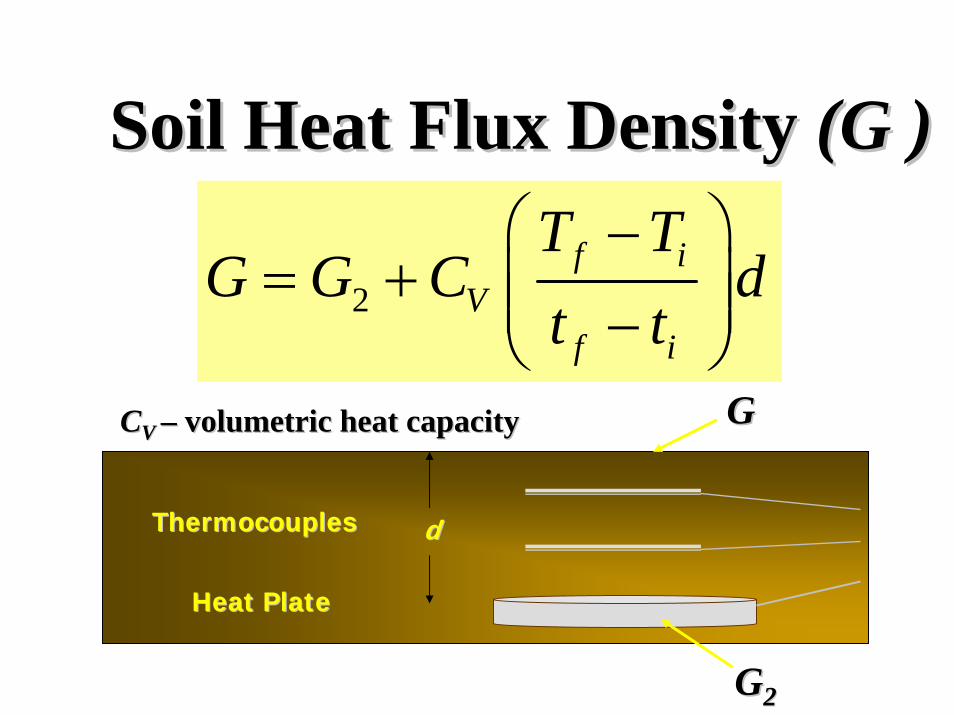
Soil Heat Flux Density Soil Heat Flux Density (G )(G )
Heat PlateHeat Plate
ThermocouplesThermocouples dd
GG
GG22
CCVV –– volumetric heat capacityvolumetric heat capacity
2f i
Vf i
T TG G C d
t t⎛ ⎞−
= + ⎜ ⎟⎜ ⎟−⎝ ⎠

SURFACE ENERGY BUDGETSSURFACE ENERGY BUDGETS
++
--+ - + -
MiscLEHGRn +++=
-+

Sensible Heat Flux DensitySensible Heat Flux Density
⎟⎟⎠
⎞⎜⎜⎝
⎛−−
−=12
12
zzTTCH pκρ
⎟⎟⎠
⎞⎜⎜⎝
⎛ −−=
hp r
TTCH 12ρ
hh
gzzr
=−
=12
1 κ

Latent Heat Flux DensityLatent Heat Flux Density
⎟⎟⎠
⎞⎜⎜⎝
⎛−−
⎟⎟⎠
⎞⎜⎜⎝
⎛−=
12
12
zzeeC
LE p
γρ
κ
⎟⎟⎠
⎞⎜⎜⎝
⎛ −⎟⎟⎠
⎞⎜⎜⎝
⎛−=
w
p
reeC
LE 12
γρ
ww
gzzr
=−
=12
1 κ
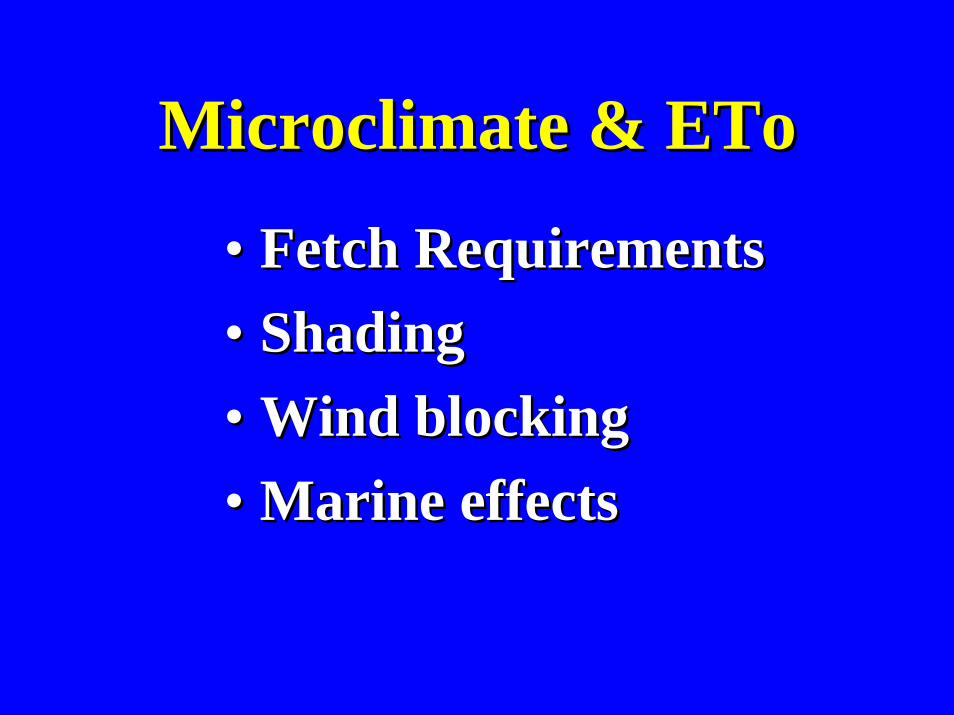
Microclimate & Microclimate & EToETo
•• Fetch RequirementsFetch Requirements•• Shading Shading •• Wind blockingWind blocking•• Marine effectsMarine effects

Fetch Requirements (Indio)
98 m
83 m
N
ST8_1
ST7_1
ST7_1 and ST8_1 installed on March 24
Prevailing Wind Direction CIMIS 162
GRASS

Fetch (98 m Vs 181 m)
y = 1.00xR2 = 0.99
7.0
9.0
11.0
13.0
15.0
7.0 9.0 11.0 13.0 15.0
CIMIS ETo (mm)
Non
Idea
l ETo
(mm
)
Indio Station ST7_1

Empirical ETo Empirical ETo –– El Dorado Country ClubEl Dorado Country Club
Adjustments for Regional effectsWind Blockage
Sunrise-Sunset
Advection
Empirical EquationsCIMIS
Regional effects

El Dorado Country Club
y = 0.63xR2 = 0.72
0.0
2.0
4.0
6.0
8.0
10.0
0.0 2.0 4.0 6.0 8.0 10.0 12.0 14.0
CIMIS ETo (mm)
El D
orad
o E
To (m
m)

Torrey Pines Vs Mira Mar
y = 0.77xR2 = 0.72
0.0
1.0
2.0
3.0
4.0
5.0
6.0
7.0
0.0 1.0 2.0 3.0 4.0 5.0 6.0 7.0
Mira Mar CIMIS ETo (mm)
Torr
ey P
ines
ET
o (m
m)

Temperature Model
y = -0.022x2 + 1.390xR2 = 0.885
0
5
10
15
20
25
30
0 5 10 15 20 25 30 35 40Mira Mar CIMIS T (oC)
Torr
ey P
ines
T (o C
)
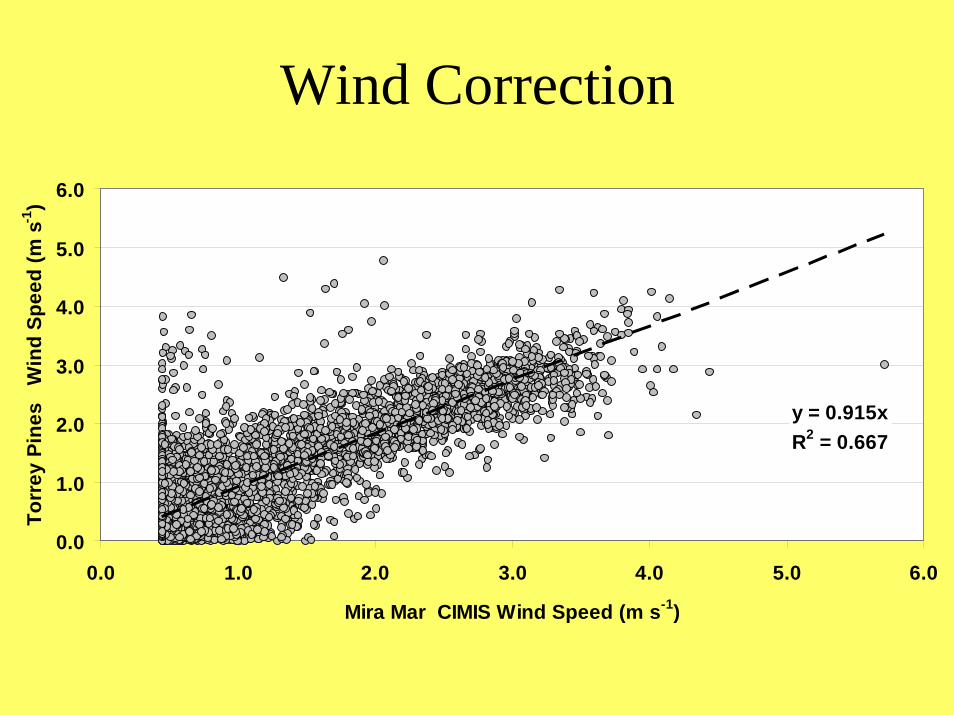
Wind Correction
y = 0.915xR2 = 0.667
0.0
1.0
2.0
3.0
4.0
5.0
6.0
0.0 1.0 2.0 3.0 4.0 5.0 6.0
Mira Mar CIMIS Wind Speed (m s-1)
Torr
ey P
ines
W
ind
Spee
d (m
s-1
)

Torrey Pines ETo Model
y = 0.973xR2 = 0.980
0.0
1.0
2.0
3.0
4.0
5.0
0.0 0.5 1.0 1.5 2.0 2.5 3.0 3.5 4.0 4.5 5.0
Mira Mar CIMIS ETo (mm)
Torr
ey P
ines
E
To (m
m)
R s & T d from Torry PinesT = -0.022*T C ^2 + 1.390*T C
U = 0.915*U C

Landscape CoefficientLandscape Coefficient
o
LL ET
ETK =
ETETLL -- measured measured ETEToo -- estimatedestimated
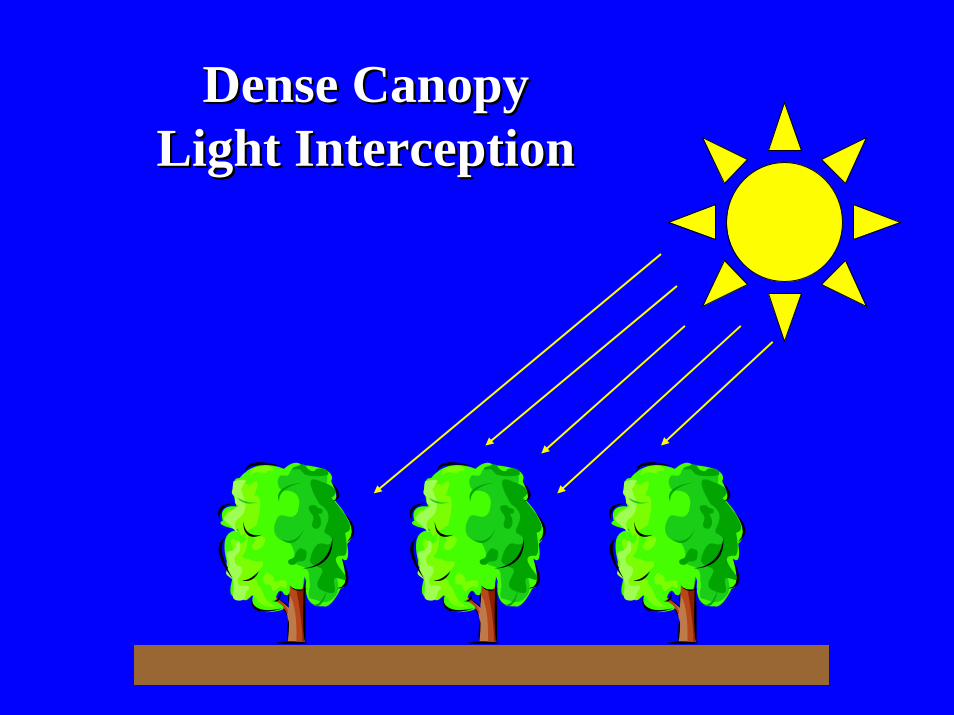
Dense Canopy Dense Canopy Light InterceptionLight Interception
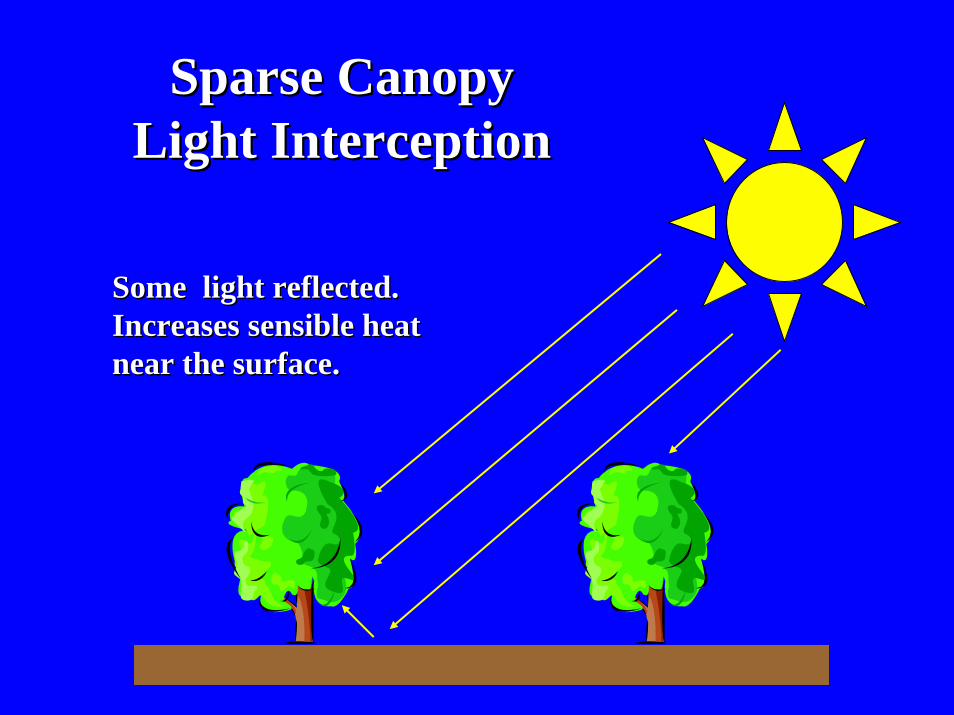
Sparse Canopy Sparse Canopy Light InterceptionLight Interception
Some light reflected. Some light reflected. Increases sensible heat Increases sensible heat near the surface.near the surface.

Density CorrectionDensity Correction
0.000.00
1.201.20
0.800.80
0.400.40
Frac
tion
of M
axim
um
Frac
tion
of M
axim
um K
cK
c
00 2020 4040 6060 8080
CCGG Ground Cover (%)Ground Cover (%)
sin70 2
GCF π⎛ ⎞= ⎜ ⎟⎝ ⎠

-100
0
100
200
300
400
500
600
700
800
7 10 13 16 19 8 11 14 17 8 11 14 17Time
Ene
rgy
Flux
Den
sity
(W m
-2)
Rn LE H G
Sunflowers (Bari, Italy)

-200
0
200
400
600
800
2400 1200 2400 1200 2400 1200 2400 1200 2400 1200 2400
Flux
Den
sity
(W m
-2)
Rn LE H G2
24-Jun20-Jun
Citrus Energy Balance - Lindsay 2001
Net
Rad
i atio
n ( W
mN
et R
adi a
tion
( W m
-- 22))
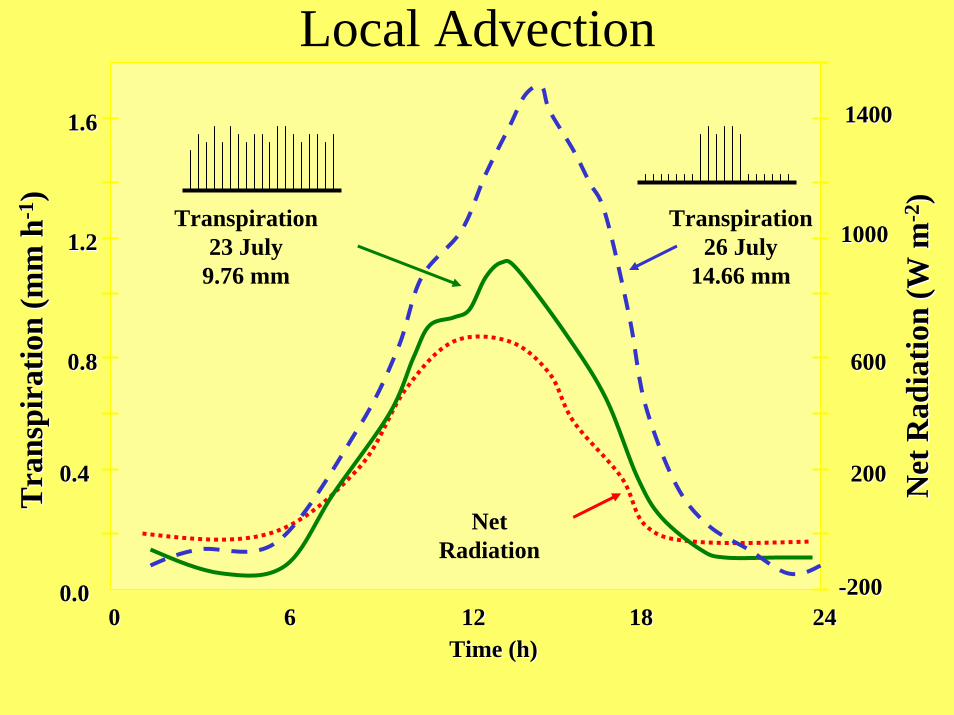
Net Radiation
Transpiration 23 July
9.76 mm
Transpiration 26 July
14.66 mm
0.00.0
0.40.4
0.80.8
1.21.2
1.61.6
Time (h)Time (h)
Tra
nspi
r atio
n ( m
m h
Tr a
n spi
r atio
n ( m
m h
-- 11))
--200200
200200
600600
14001400
10001000
00 121266 24241818
Local Advection
0.0
0.2
0.4
0.6
0.8
1.0
Time of Drying
Fra
ctio
n of
Dai
ly E
Tc
SU
NR
ISE M
ID A
M
NO
ON
MID
PM
SU
NS
ET
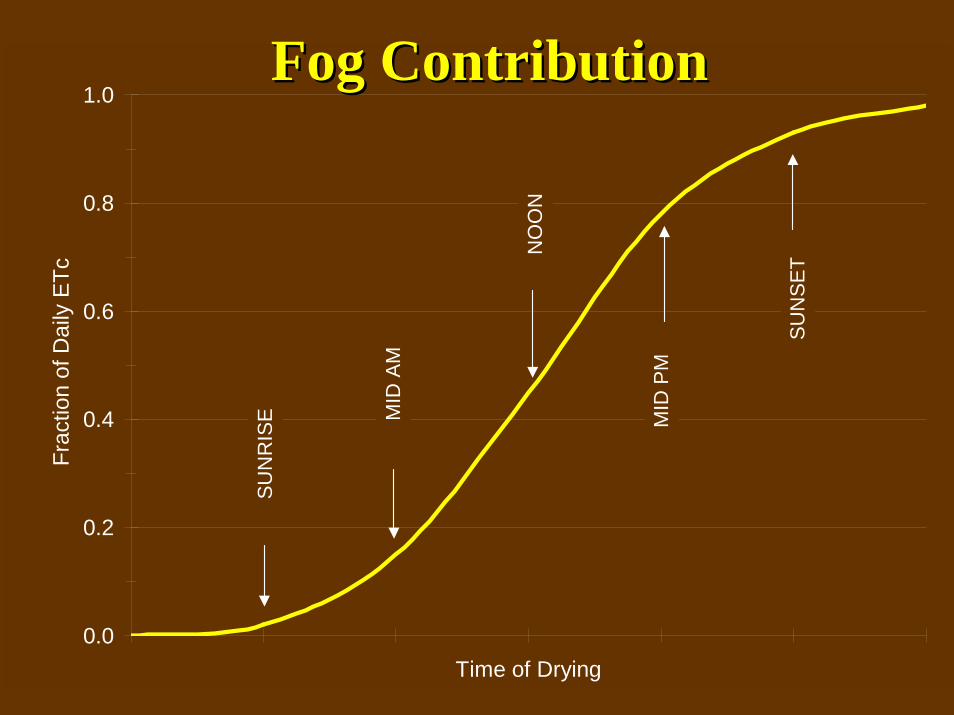
Fog ContributionFog Contribution

Water Table ContributionWater Table Contribution
ETETc ETETcc c
No Water TableNo Water Table With Water TableWith Water Table

The EndThe End
ThanksThanks