0 ! 1 2 Használati útmutató 16 # 0 .2.%* 2 H t - …Els használat
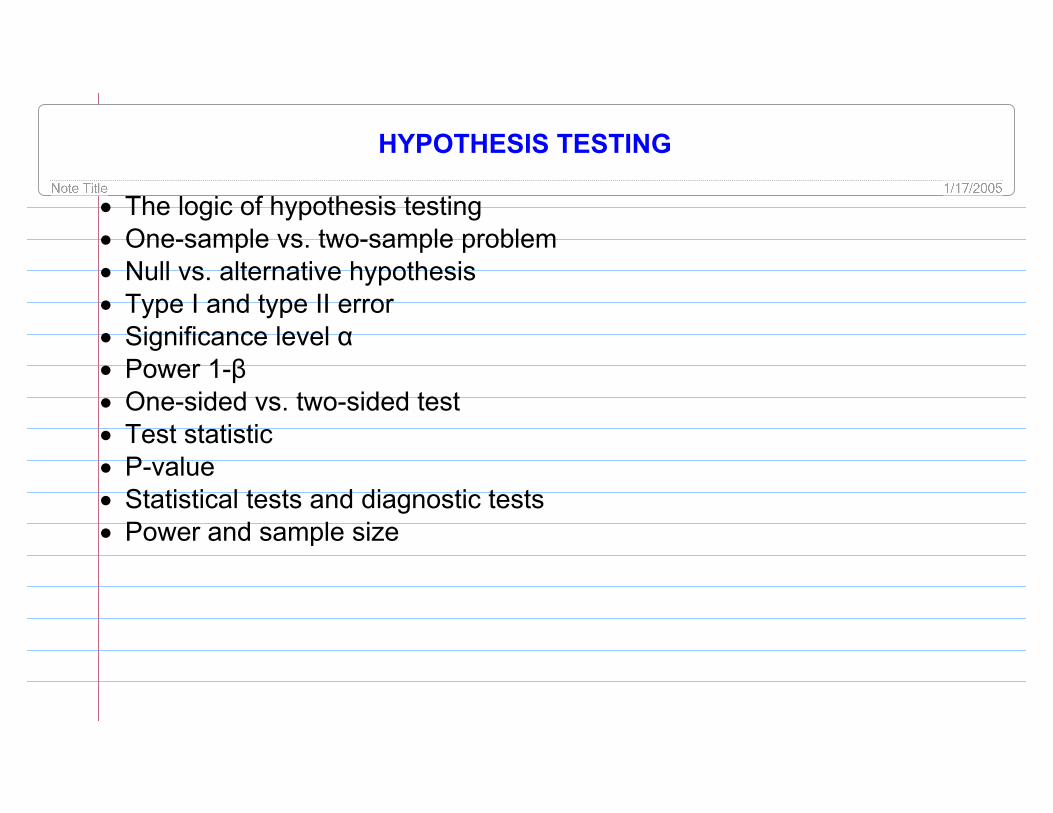
HYPOTHESIS TESTING
• The logic of hypothesis testing• One-sample vs. two-sample problem• Null vs. alternative hypothesis• Type I and type II error• Significance level α• Power 1-β• One-sided vs. two-sided test• Test statistic• P-value• Statistical tests and diagnostic tests• Power and sample size
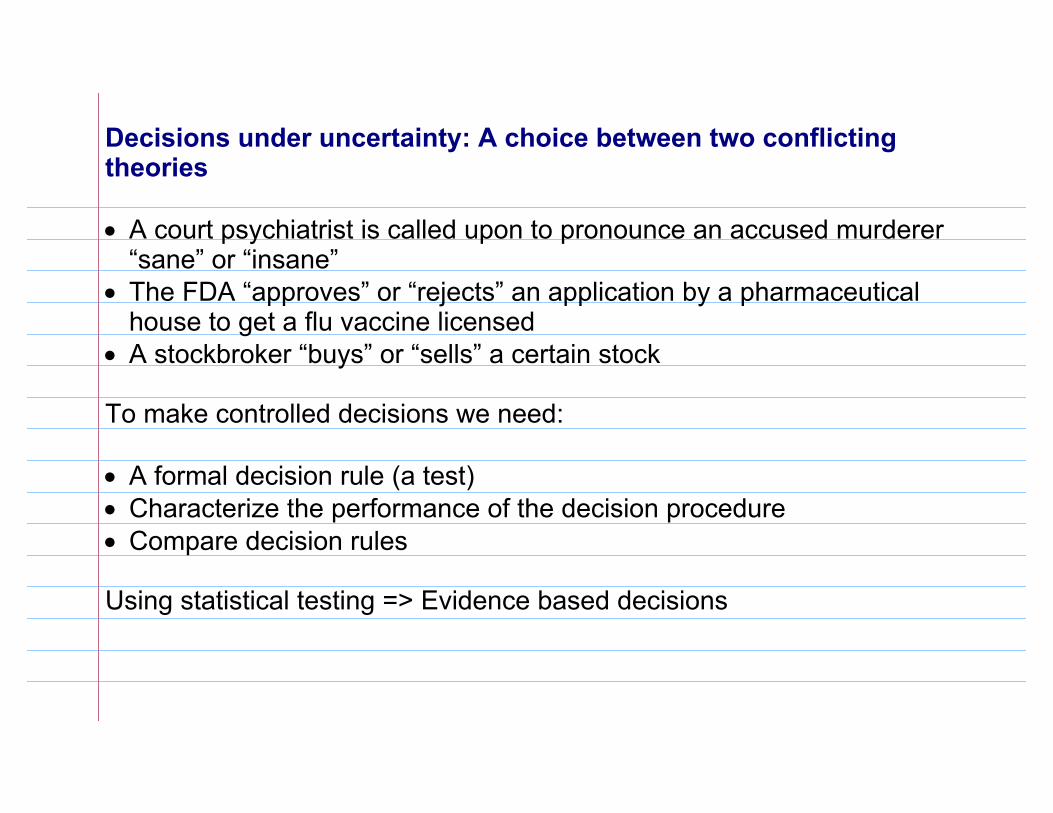
Decisions under uncertainty: A choice between two conflicting theories
• A court psychiatrist is called upon to pronounce an accused murderer “sane” or “insane”
• The FDA “approves” or “rejects” an application by a pharmaceutical house to get a flu vaccine licensed
• A stockbroker “buys” or “sells” a certain stock
To make controlled decisions we need:
• A formal decision rule (a test)• Characterize the performance of the decision procedure• Compare decision rules
Using statistical testing => Evidence based decisions
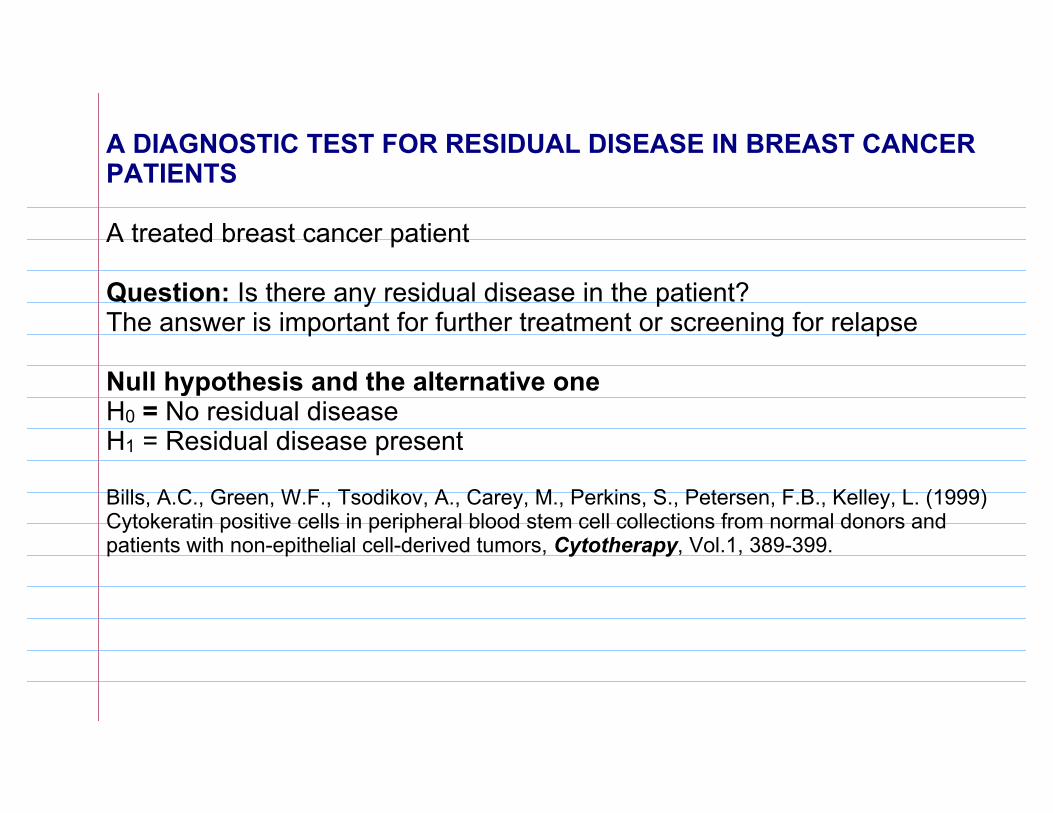
A DIAGNOSTIC TEST FOR RESIDUAL DISEASE IN BREAST CANCER PATIENTS
A treated breast cancer patient
Question: Is there any residual disease in the patient?The answer is important for further treatment or screening for relapse
Null hypothesis and the alternative oneH0 = No residual diseaseH1 = Residual disease present
Bills, A.C., Green, W.F., Tsodikov, A., Carey, M., Perkins, S., Petersen, F.B., Kelley, L. (1999) Cytokeratin positive cells in peripheral blood stem cell collections from normal donors and patients with non-epithelial cell-derived tumors, Cytotherapy, Vol.1, 389-399.
Quantify the effect: Measure residual disease
Marker of a cancer cell: Cytokeratin
A breast cancer cell is more likely to be Cytokeratine-positive than a normal cell. Nothing is perfect.
Measure of residual diseaseT (test statistic) Proportion of cytokeratin-positive cells in peripheral blood stem cell collection
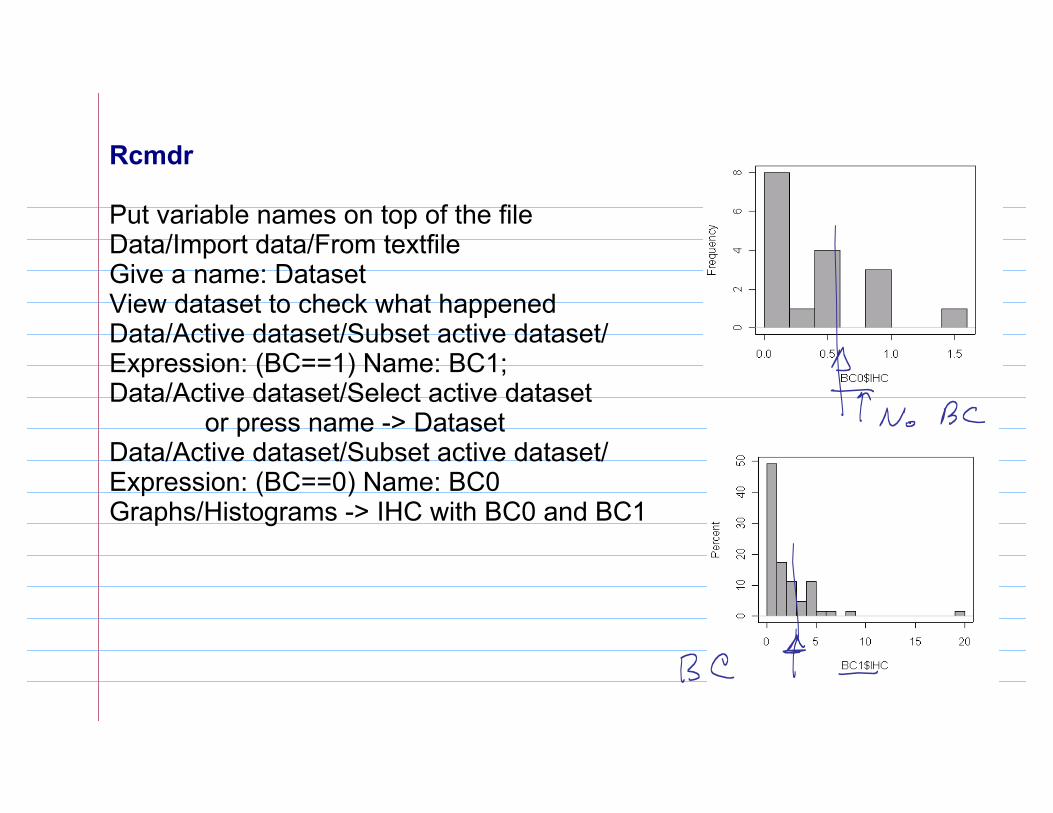
Rcmdr
Put variable names on top of the fileData/Import data/From textfileGive a name: DatasetView dataset to check what happenedData/Active dataset/Subset active dataset/ Expression: (BC==1) Name: BC1; Data/Active dataset/Select active dataset
or press name -> DatasetData/Active dataset/Subset active dataset/ Expression: (BC==0) Name: BC0Graphs/Histograms -> IHC with BC0 and BC1
Decision rule
A large T is observed
I want to interpret T as the presence of residual disease
The opponent argues: It might be just a random fluctuation in a healthy person
To argue against the opponent I proceed by taking his point and seeking a contradiction
Similar to a court procedure: difference=guilty, no difference=innocence
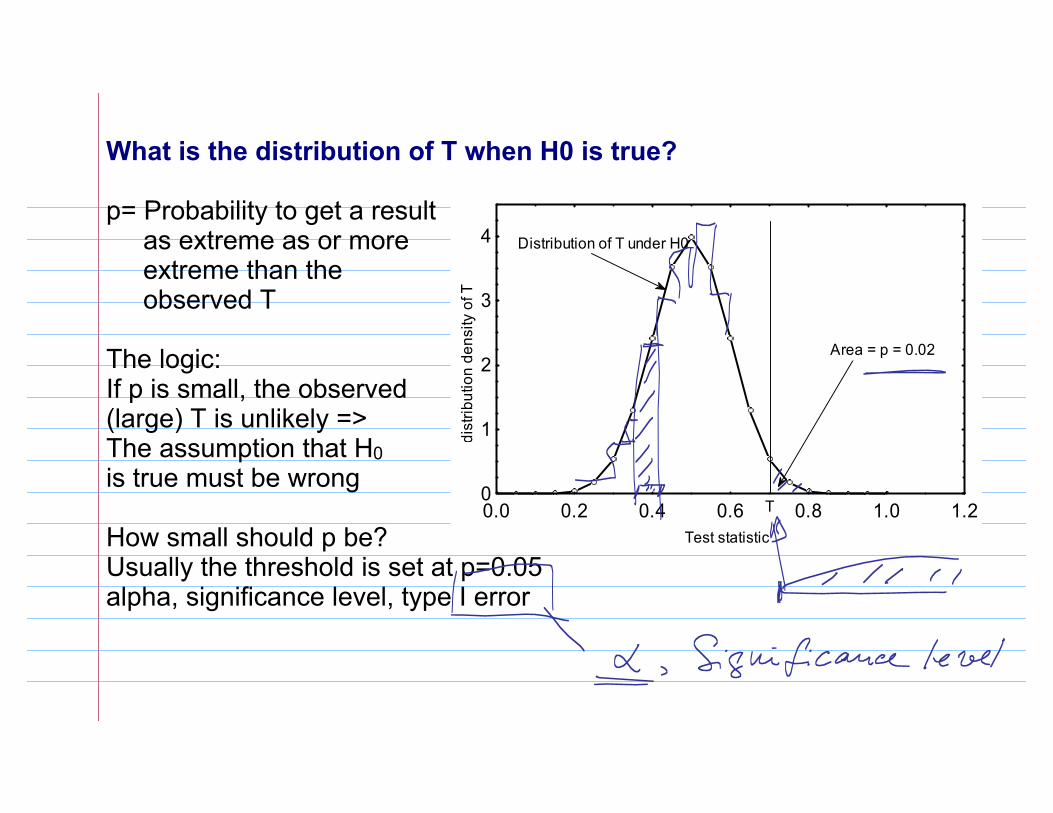
What is the distribution of T when H0 is true?
p= Probability to get a result as extreme as or more extreme than the observed T
The logic: If p is small, the observed (large) T is unlikely =>The assumption that H0 is true must be wrong
How small should p be?Usually the threshold is set at p=0.05 alpha, significance level, type I error
Test statistic
dist
ribut
ion
dens
ity o
f T
0.0 0.2 0.4 0.6 0.8 1.0 1.20
1
2
3
4
T
Area = p = 0.02
Distribution of T under H0
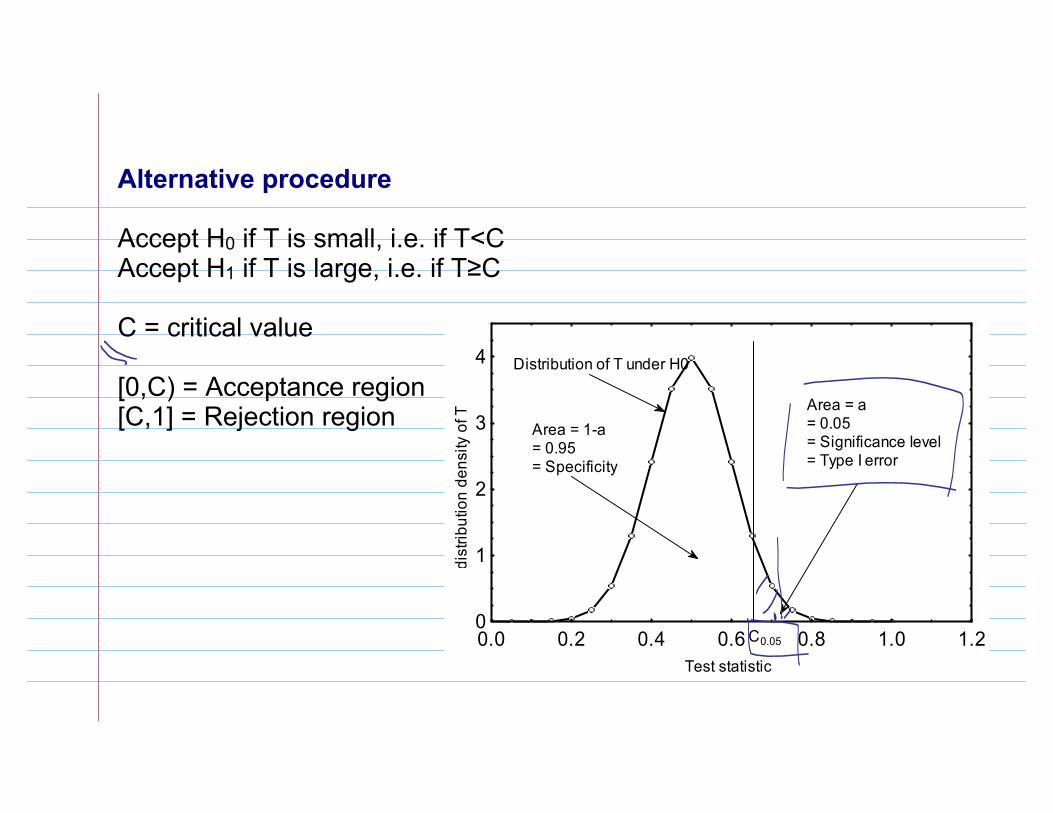
Alternative procedure
Accept H0 if T is small, i.e. if T<CAccept H1 if T is large, i.e. if T≥C
C = critical value
[0,C) = Acceptance region[C,1] = Rejection region
Test statistic
dist
ribut
ion
dens
ity o
f T
0.0 0.2 0.4 0.6 0.8 1.0 1.20
1
2
3
4 Distribution of T under H0
C0.05
Area = a = 0.05= Significance level = Type I error
Area = 1-a = 0.95= Specificity
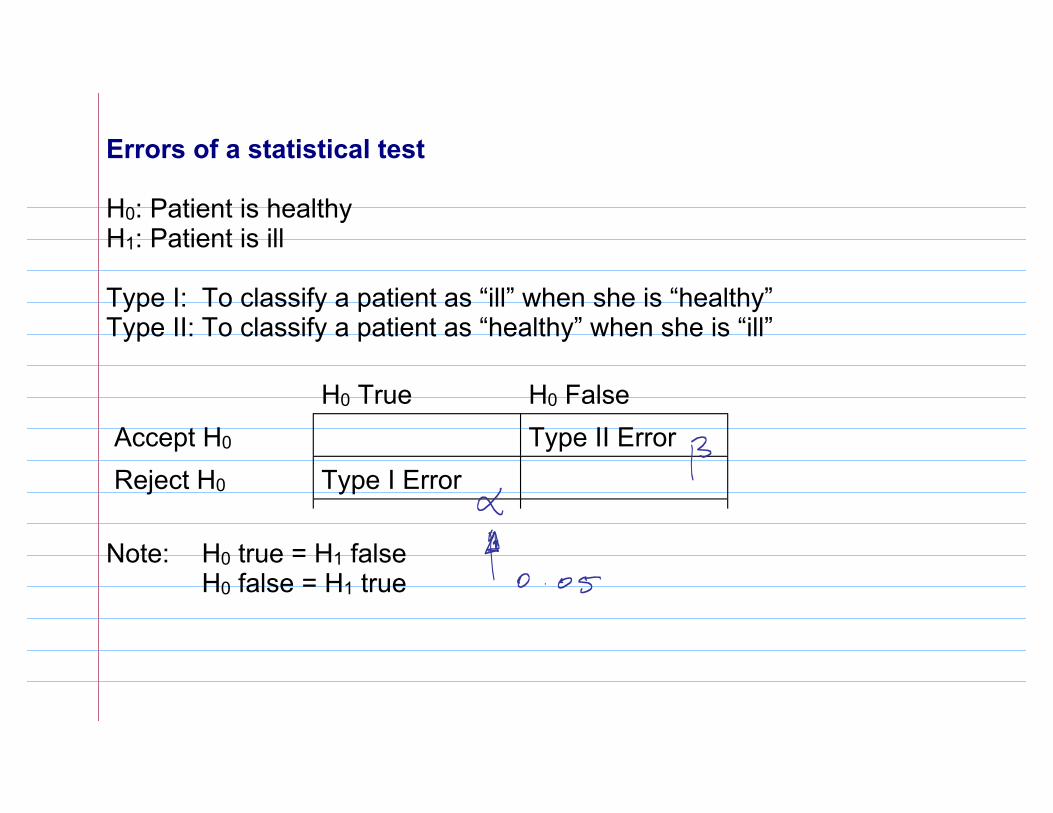
Errors of a statistical test
H0: Patient is healthyH1: Patient is ill
Type I: To classify a patient as “ill” when she is “healthy”Type II: To classify a patient as “healthy” when she is “ill”
H0 True H0 FalseAccept H0 Type II ErrorReject H0 Type I Error
Note: H0 true = H1 falseH0 false = H1 true
Court analogy
In many circumstances a type I error is often regarded as more serious than a type II error.
Example:H0: innocent vs. H1: guilty
type I error = declaring an innocent man guiltytype II error = declaring a guilty man innocent
Presumption of innocenceNegative test result means "There is not enough evidence to convict" rather than "innocence"
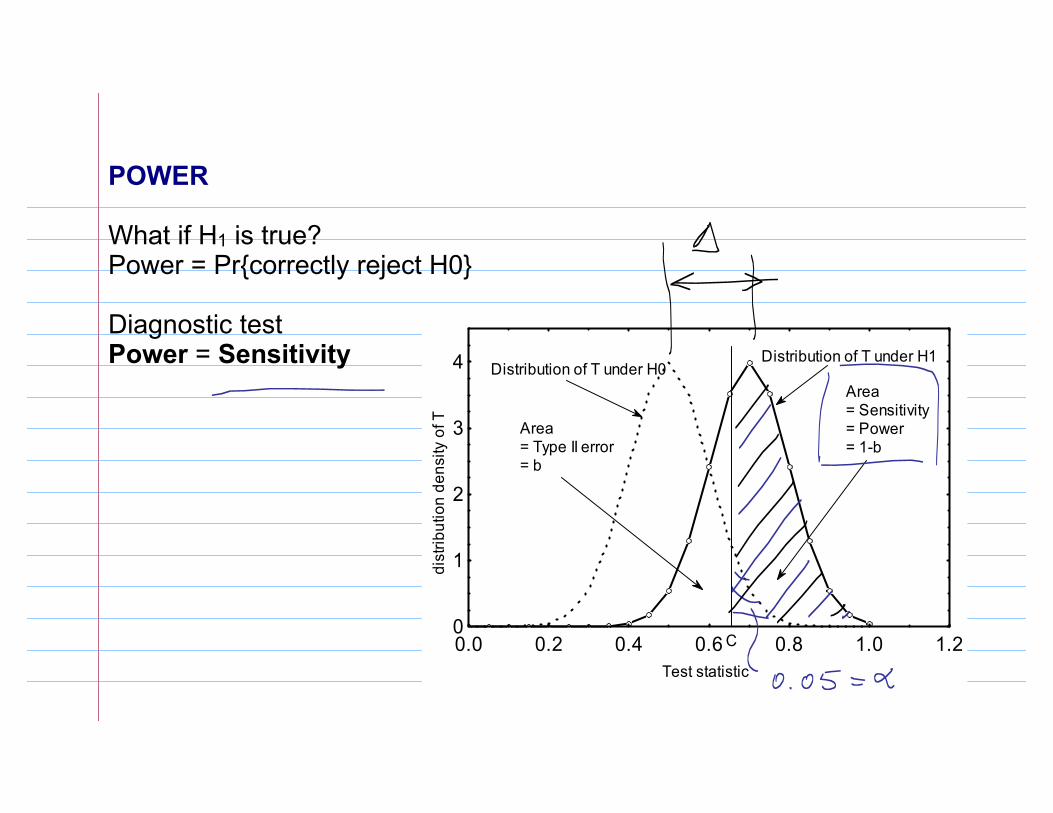
POWER
What if H1 is true?Power = Pr{correctly reject H0}
Diagnostic test Power = Sensitivity
Test statistic
dist
ribut
ion
dens
ity o
f T
0.0 0.2 0.4 0.6 0.8 1.0 1.20
1
2
3
4 Distribution of T under H0Distribution of T under H1
C
Area= Sensitivity= Power= 1-b
Area= Type II error= b
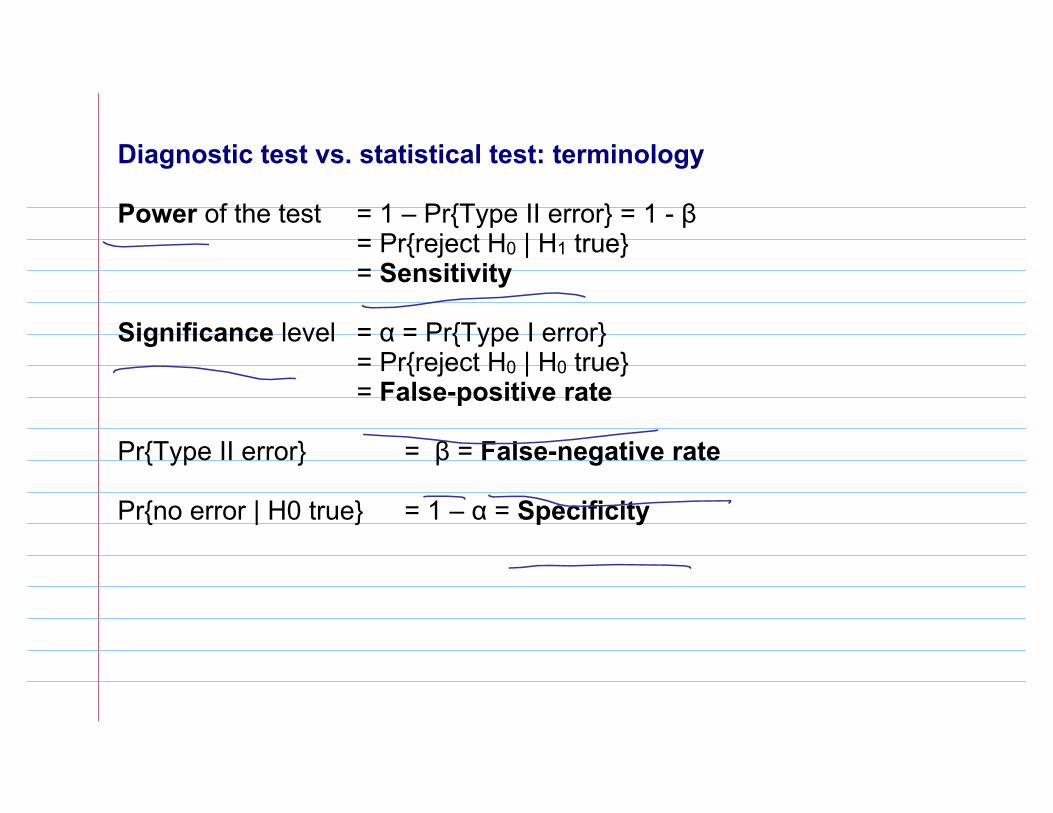
Diagnostic test vs. statistical test: terminology
Power of the test = 1 – Pr{Type II error} = 1 - β= Pr{reject H0 | H1 true} = Sensitivity
Significance level = α = Pr{Type I error}= Pr{reject H0 | H0 true}= False-positive rate
Pr{Type II error} = β = False-negative rate
Pr{no error | H0 true} = 1 – α = Specificity
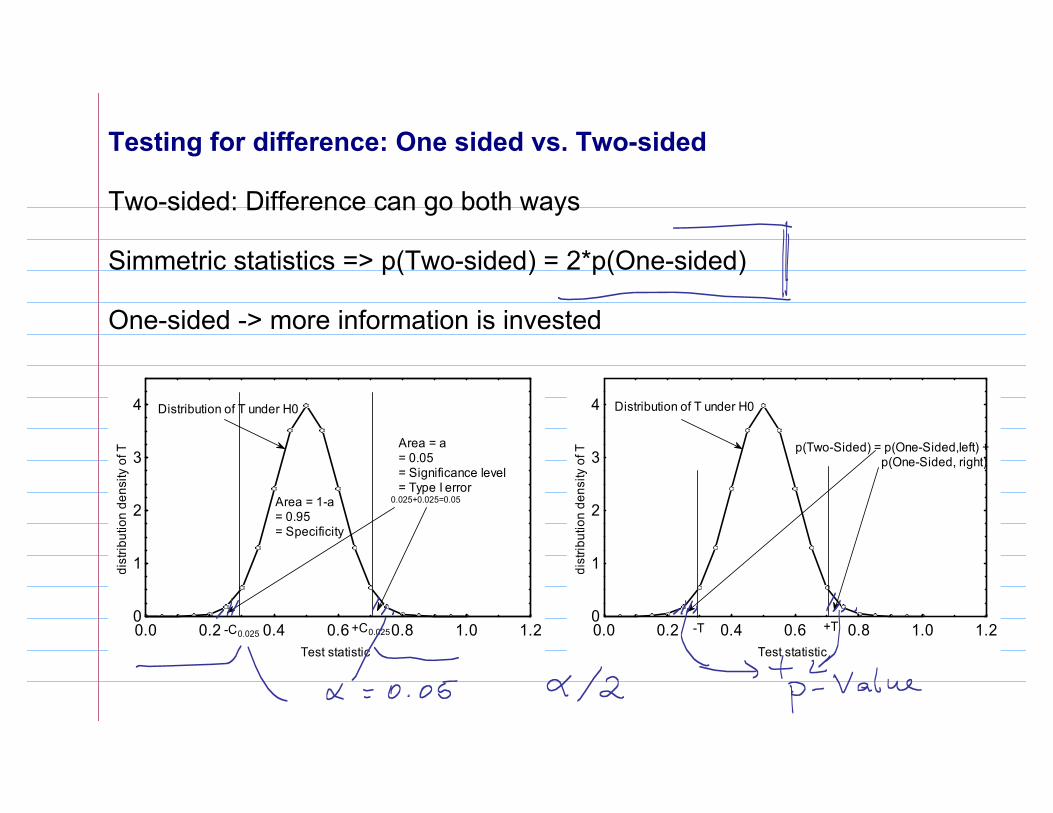
Testing for difference: One sided vs. Two-sided
Two-sided: Difference can go both ways
Simmetric statistics => p(Two-sided) = 2*p(One-sided)
One-sided -> more information is invested
Test statistic
dist
ribut
ion
dens
ity o
f T
0.0 0.2 0.4 0.6 0.8 1.0 1.20
1
2
3
4 Distribution of T under H0
+C0.025-C0.025
Area = a = 0.05= Significance level = Type I error
Area = 1-a = 0.95= Specificity
0.025+0.025=0.05
Test statistic
dist
ribut
ion
dens
ity o
f T
0.0 0.2 0.4 0.6 0.8 1.0 1.20
1
2
3
4
+T-T
p(Two-Sided) = p(One-Sided,left) + p(One-Sided, right)
Distribution of T under H0
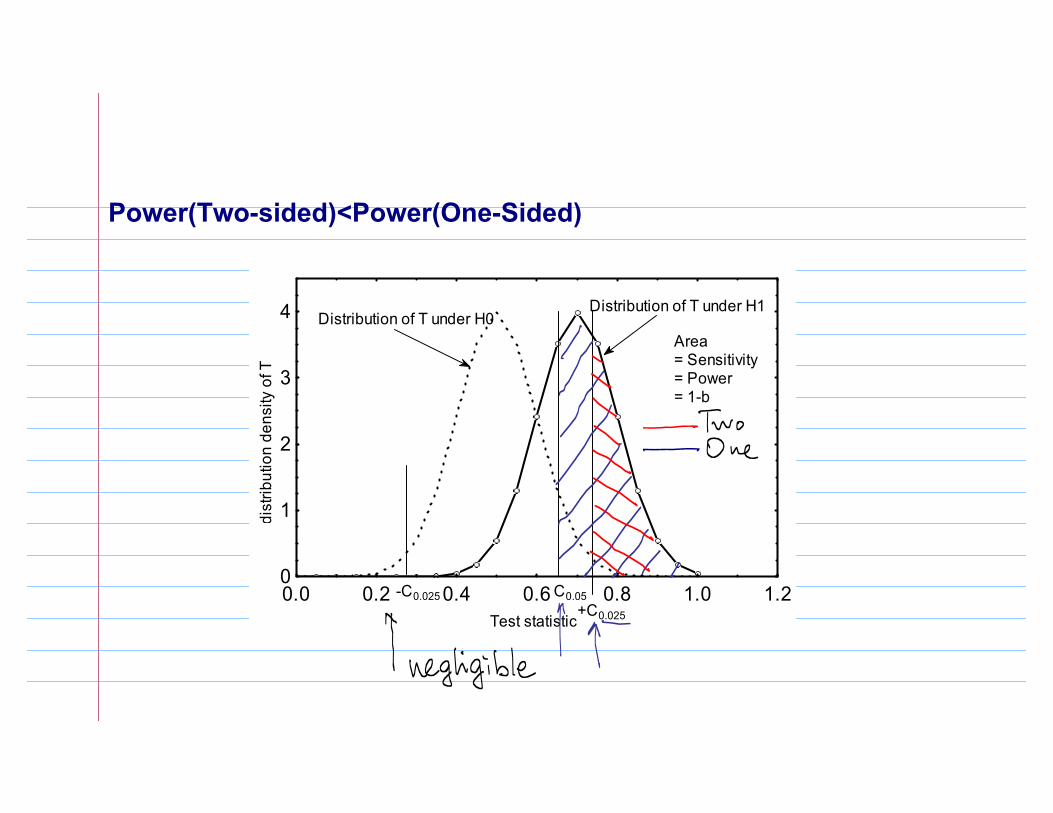
Power(Two-sided)<Power(One-Sided)
Test statistic
dist
ribut
ion
dens
ity o
f T
0.0 0.2 0.4 0.6 0.8 1.0 1.20
1
2
3
4 Distribution of T under H0Distribution of T under H1
+C0.025
-C0.025 C0.05
Area= Sensitivity= Power= 1-b
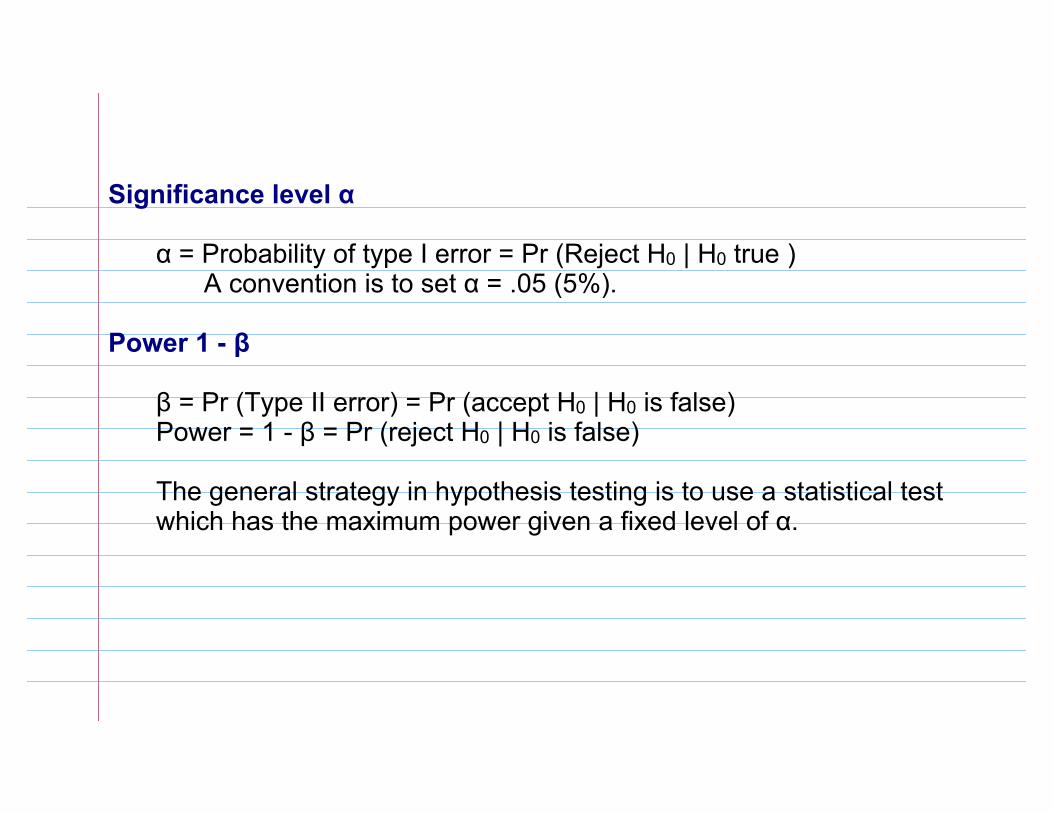
Significance level α
α = Probability of type I error = Pr (Reject H0 | H0 true )A convention is to set α = .05 (5%).
Power 1 - β
β = Pr (Type II error) = Pr (accept H0 | H0 is false)Power = 1 - β = Pr (reject H0 | H0 is false)
The general strategy in hypothesis testing is to use a statistical test which has the maximum power given a fixed level of α.
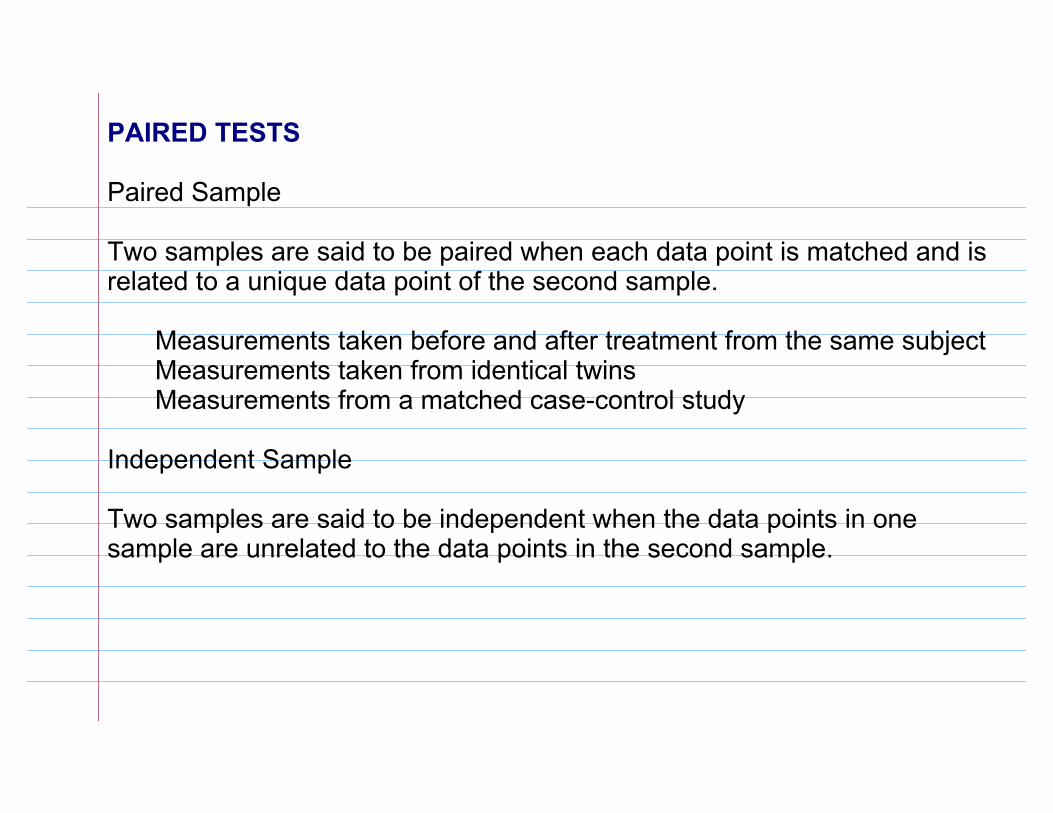
PAIRED TESTS
Paired Sample
Two samples are said to be paired when each data point is matched and is related to a unique data point of the second sample.
Measurements taken before and after treatment from the same subjectMeasurements taken from identical twinsMeasurements from a matched case-control study
Independent Sample
Two samples are said to be independent when the data points in one sample are unrelated to the data points in the second sample.
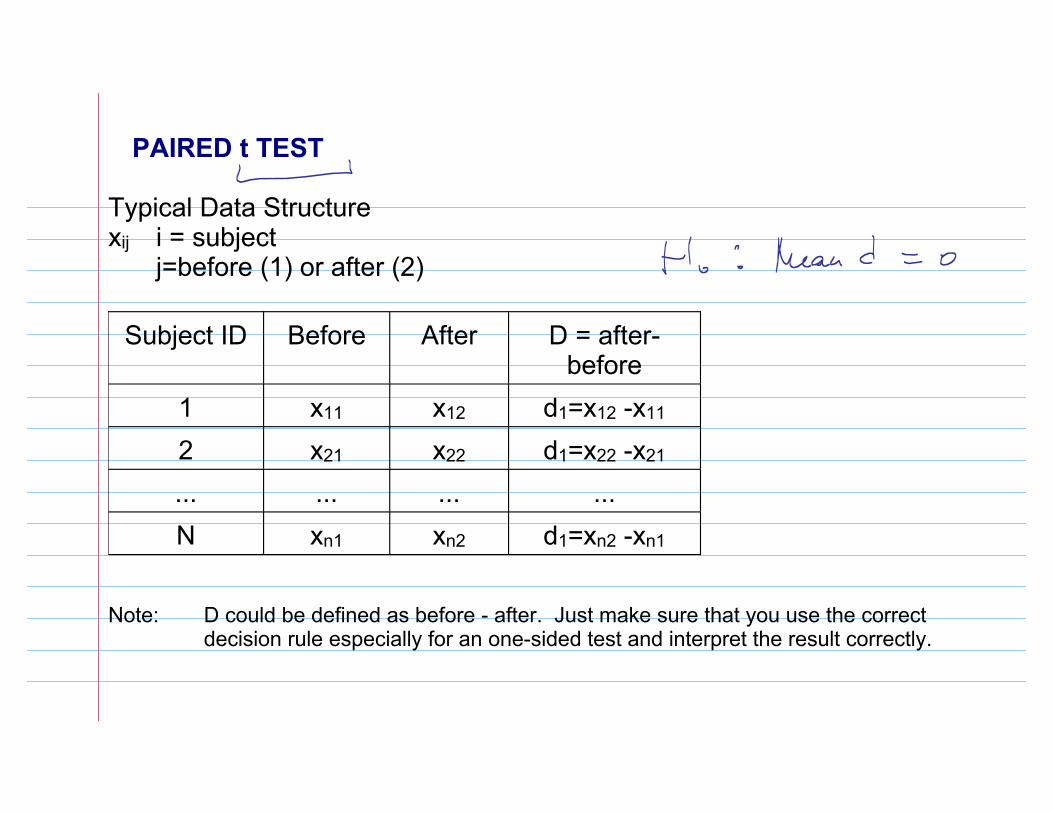
PAIRED t TEST
Typical Data Structurexij i = subject
j=before (1) or after (2)
Subject ID Before After D = after-before
1 x11 x12 d1=x12 -x11
2 x21 x22 d1=x22 -x21
... ... ... ...N xn1 xn2 d1=xn2 -xn1
Note: D could be defined as before - after. Just make sure that you use the correct decision rule especially for an one-sided test and interpret the result correctly.
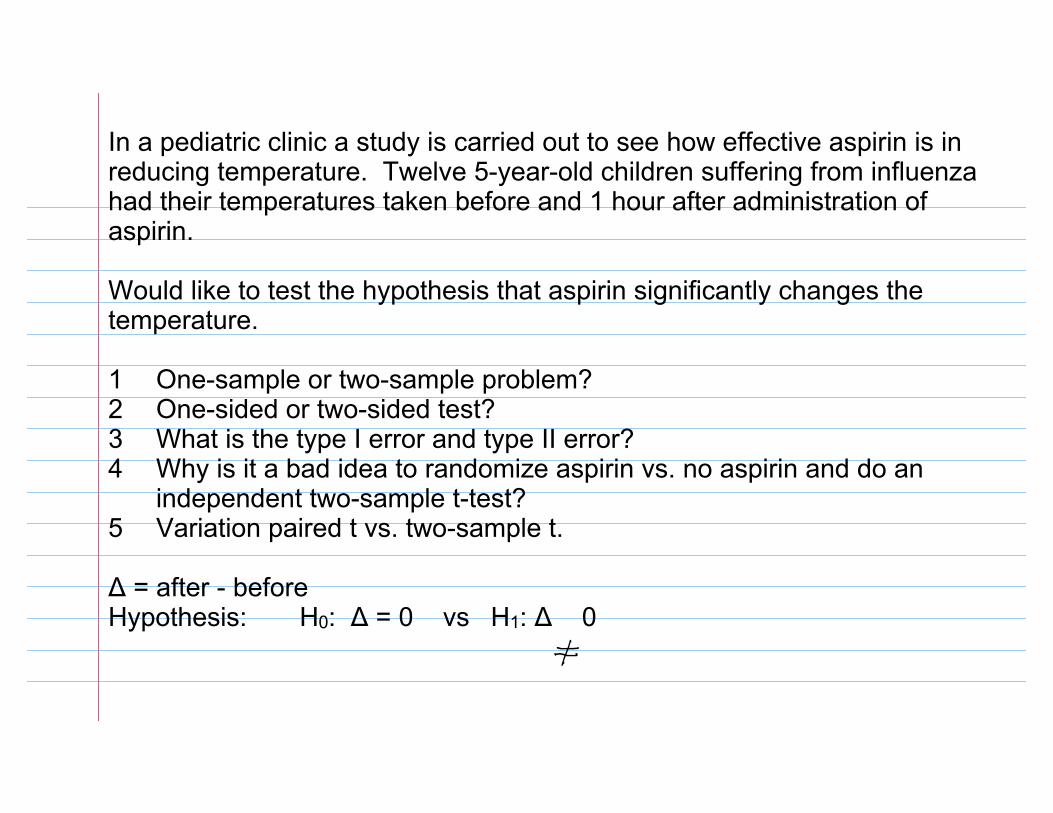
In a pediatric clinic a study is carried out to see how effective aspirin is in reducing temperature. Twelve 5-year-old children suffering from influenza had their temperatures taken before and 1 hour after administration of aspirin.
Would like to test the hypothesis that aspirin significantly changes the temperature.
1 One-sample or two-sample problem?2 One-sided or two-sided test?3 What is the type I error and type II error?4 Why is it a bad idea to randomize aspirin vs. no aspirin and do an
independent two-sample t-test?5 Variation paired t vs. two-sample t.
∆ = after - beforeHypothesis: H0: ∆ = 0 vs H1: ∆ 0
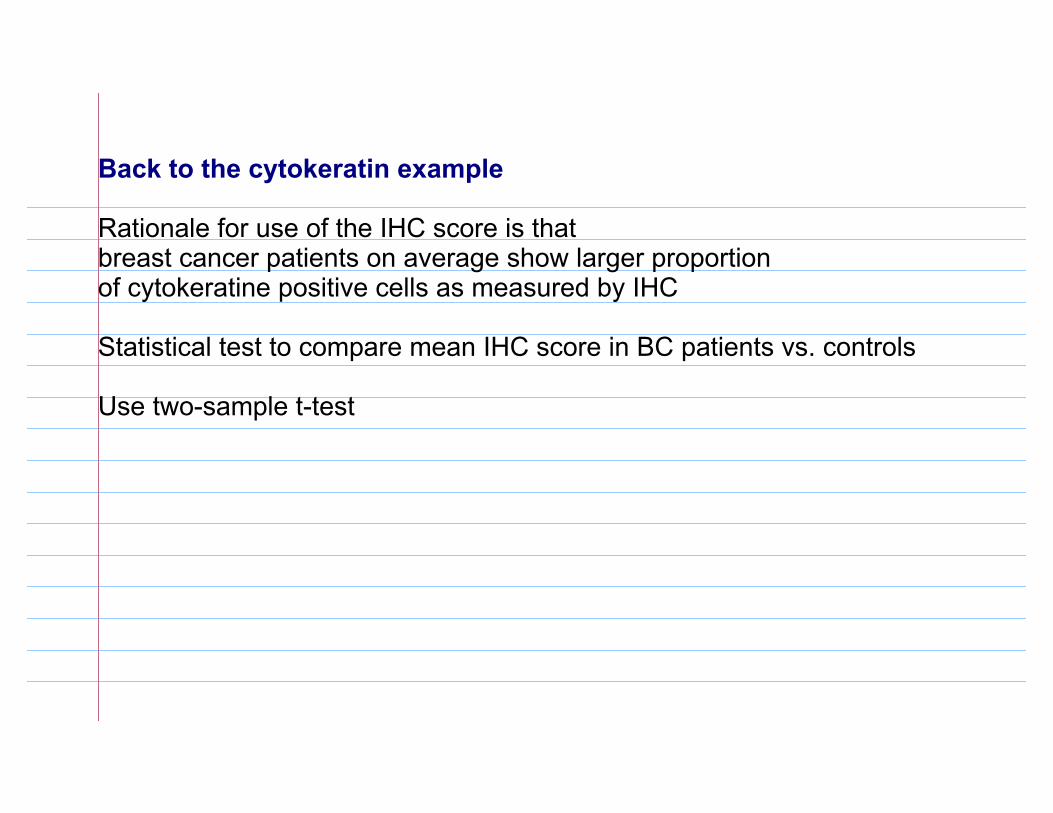
Back to the cytokeratin example
Rationale for use of the IHC score is that breast cancer patients on average show larger proportionof cytokeratine positive cells as measured by IHC
Statistical test to compare mean IHC score in BC patients vs. controls
Use two-sample t-test
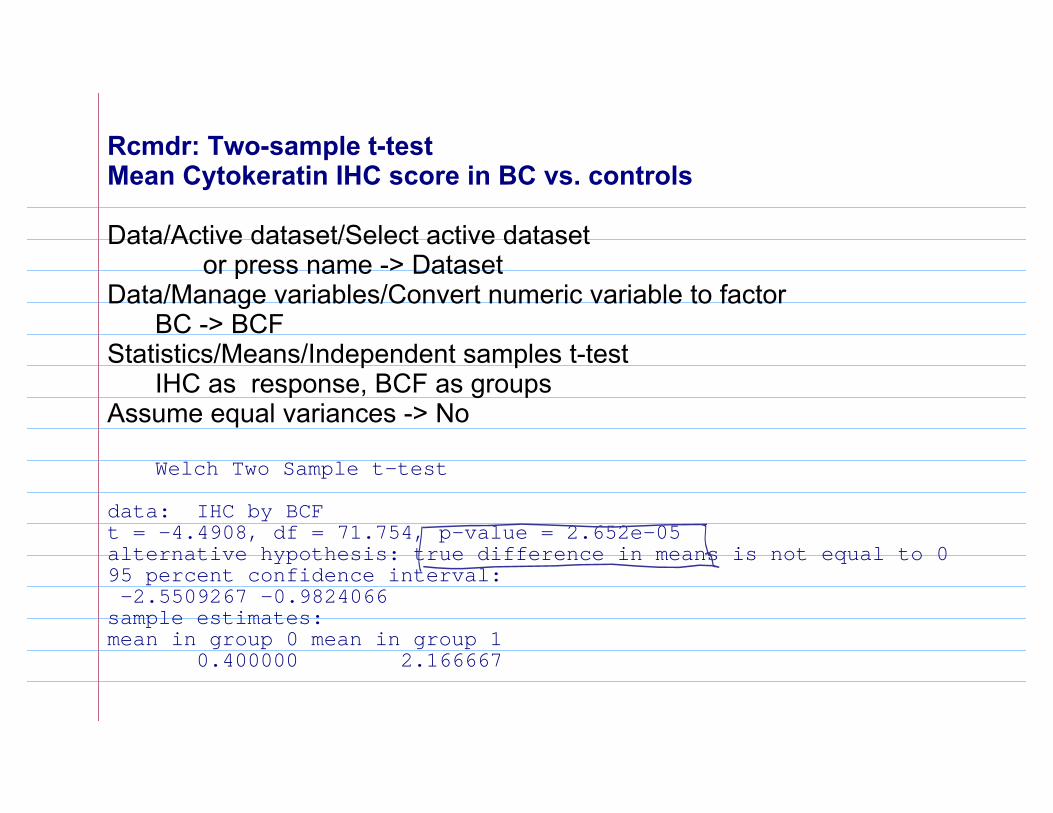
Rcmdr: Two-sample t-testMean Cytokeratin IHC score in BC vs. controls
Data/Active dataset/Select active dataset or press name -> Dataset
Data/Manage variables/Convert numeric variable to factorBC -> BCF
Statistics/Means/Independent samples t-testIHC as response, BCF as groups
Assume equal variances -> No
Welch Two Sample t-test
data: IHC by BCF t = -4.4908, df = 71.754, p-value = 2.652e-05alternative hypothesis: true difference in means is not equal to 0 95 percent confidence interval: -2.5509267 -0.9824066 sample estimates:mean in group 0 mean in group 1 0.400000 2.166667
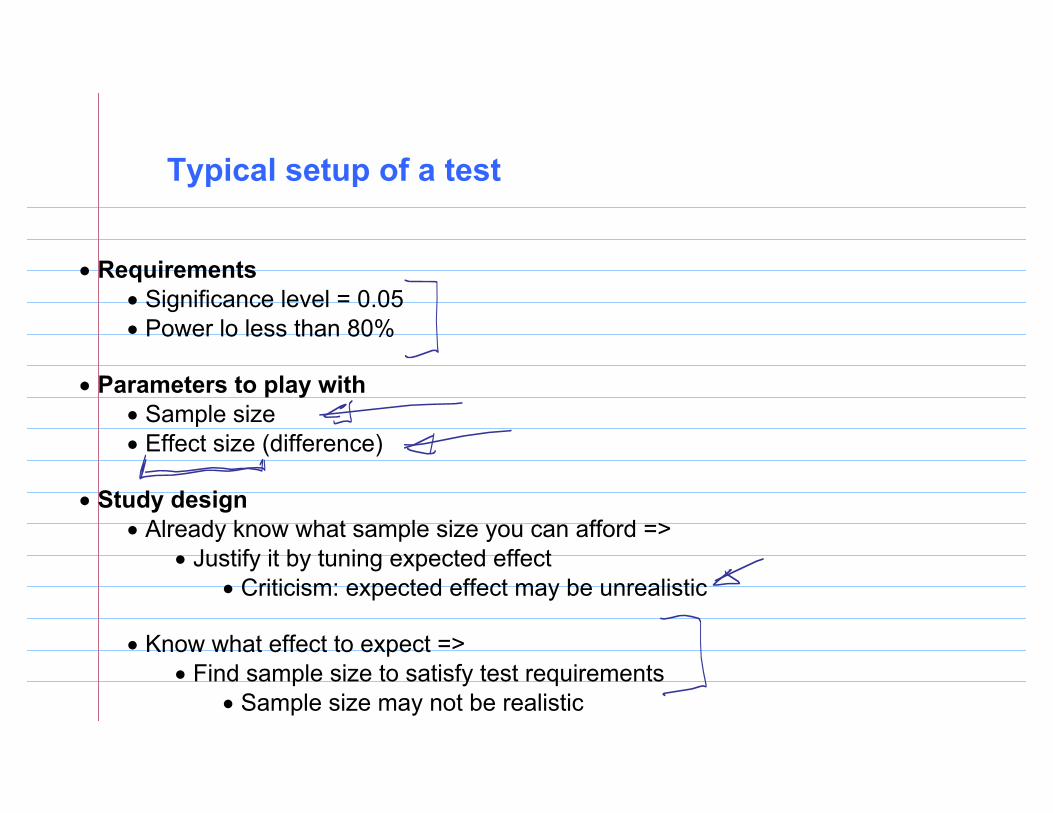
Typical setup of a test
• Requirements• Significance level = 0.05• Power lo less than 80%
• Parameters to play with• Sample size• Effect size (difference)
• Study design• Already know what sample size you can afford =>
• Justify it by tuning expected effect• Criticism: expected effect may be unrealistic
• Know what effect to expect =>• Find sample size to satisfy test requirements
• Sample size may not be realistic
Test statistic
d
0.0 0.2 0.4 0.6 0.8 1.0 1.20
1
2
3
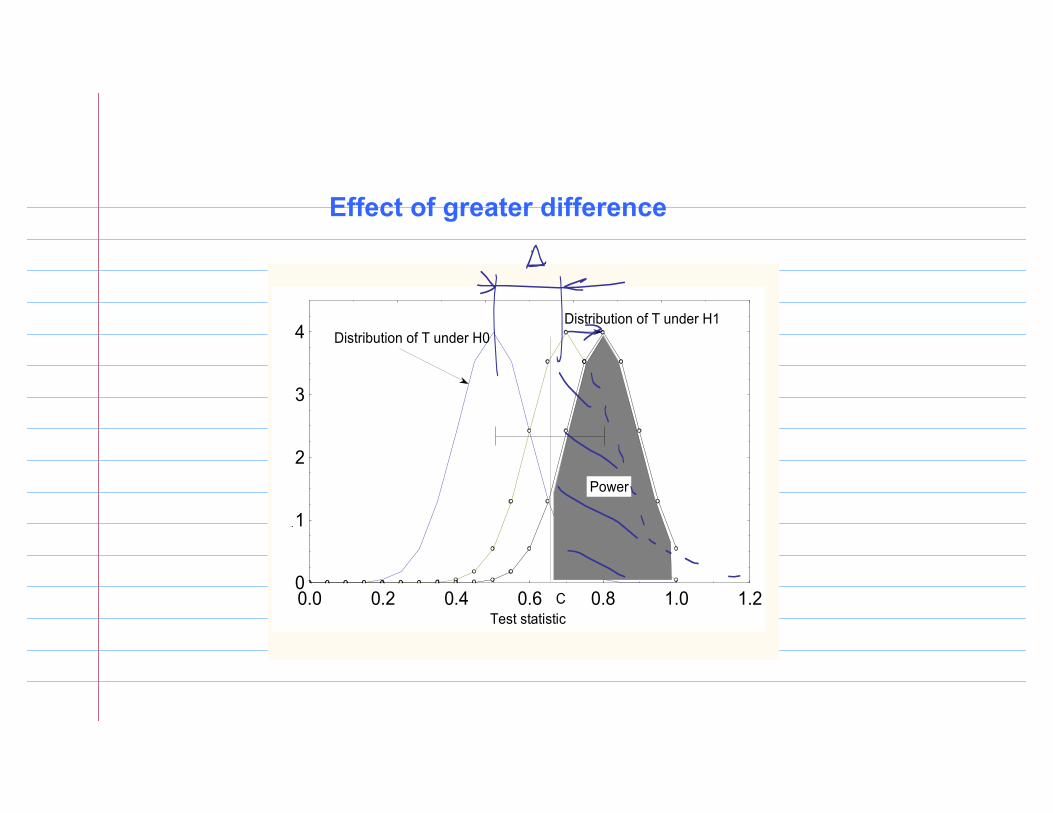
4 Distribution of T under H0Distribution of T under H1
C
Power
Effect of greater difference
Test statistic
dist
ribut
ion
dens
ity o
f T
0.0 0.2 0.4 0.6 0.8 1.0 1.20
1
2
3
4 Distribution of T under H0Distribution of T under H1
C
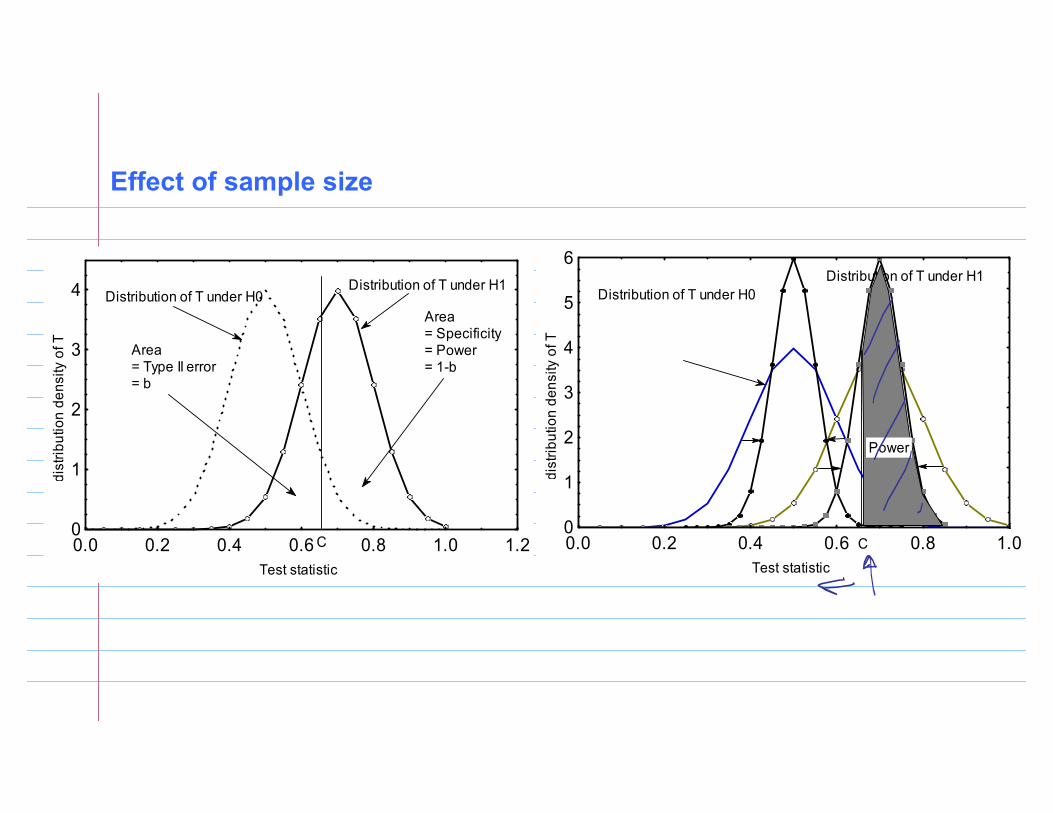
Area= Specificity= Power= 1-b
Area= Type II error= b
Test statisticdi
strib
utio
n de
nsity
of T
0.0 0.2 0.4 0.6 0.8 1.00
1
2
3
4
5
6
Distribution of T under H0Distribution of T under H1
C
Power
Effect of sample size
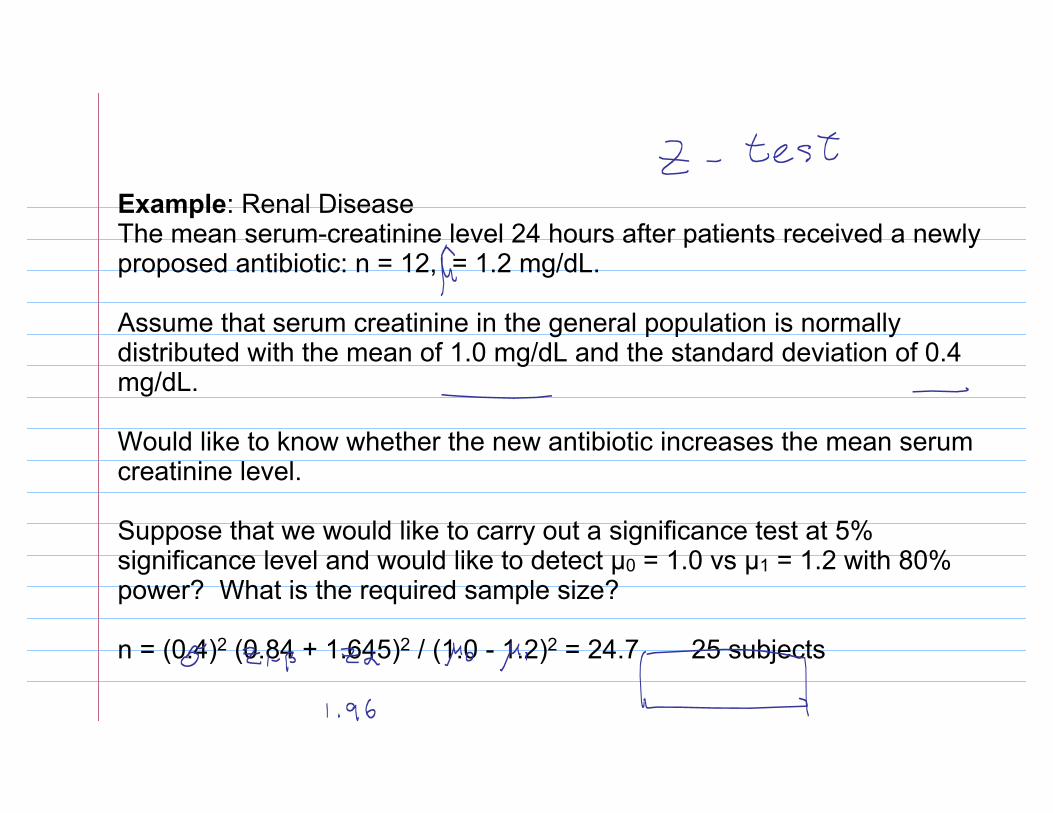
Example: Renal Disease The mean serum-creatinine level 24 hours after patients received a newly proposed antibiotic: n = 12, = 1.2 mg/dL.
Assume that serum creatinine in the general population is normally distributed with the mean of 1.0 mg/dL and the standard deviation of 0.4 mg/dL.
Would like to know whether the new antibiotic increases the mean serum creatinine level.
Suppose that we would like to carry out a significance test at 5% significance level and would like to detect µ0 = 1.0 vs µ1 = 1.2 with 80% power? What is the required sample size?
n = (0.4)2 (0.84 + 1.645)2 / (1.0 - 1.2)2 = 24.7 25 subjects
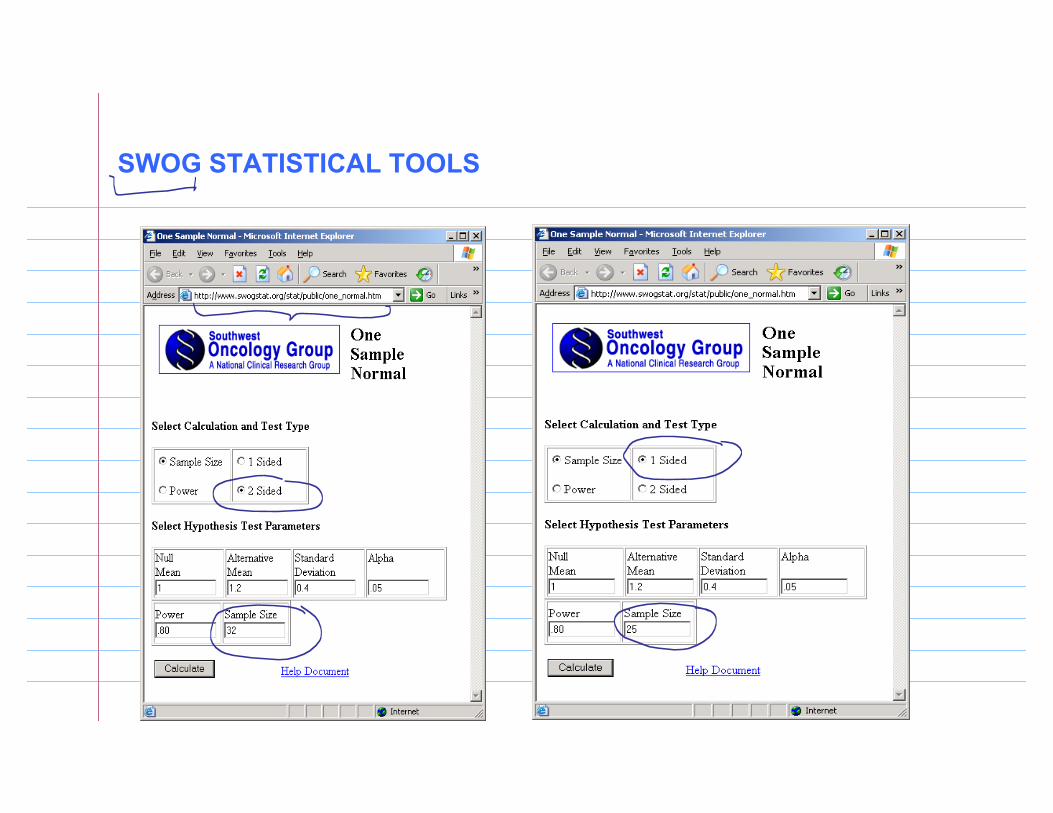
SWOG STATISTICAL TOOLS
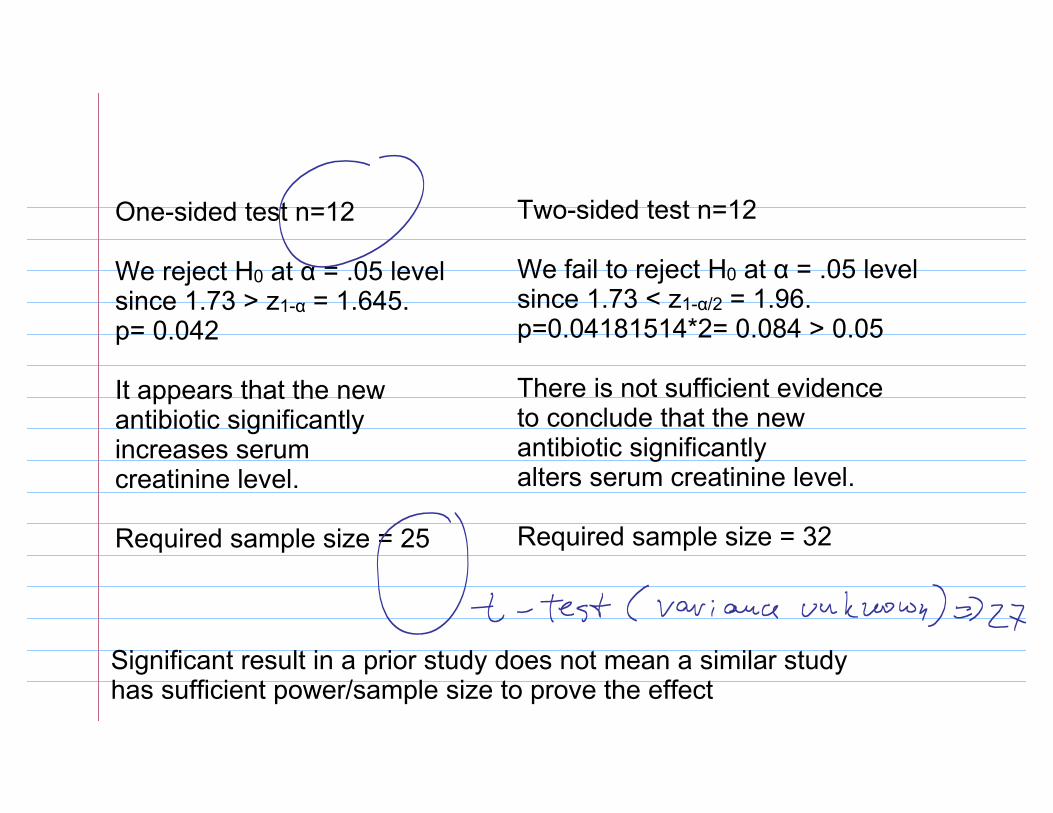
One-sided test n=12
We reject H0 at α = .05 level since 1.73 > z1-α = 1.645.p= 0.042
It appears that the new antibiotic significantly increases serum creatinine level.
Required sample size = 25
Two-sided test n=12
We fail to reject H0 at α = .05 level since 1.73 < z1-α/2 = 1.96.p=0.04181514*2= 0.084 > 0.05
There is not sufficient evidence to conclude that the new antibiotic significantly alters serum creatinine level.
Required sample size = 32
Significant result in a prior study does not mean a similar studyhas sufficient power/sample size to prove the effect
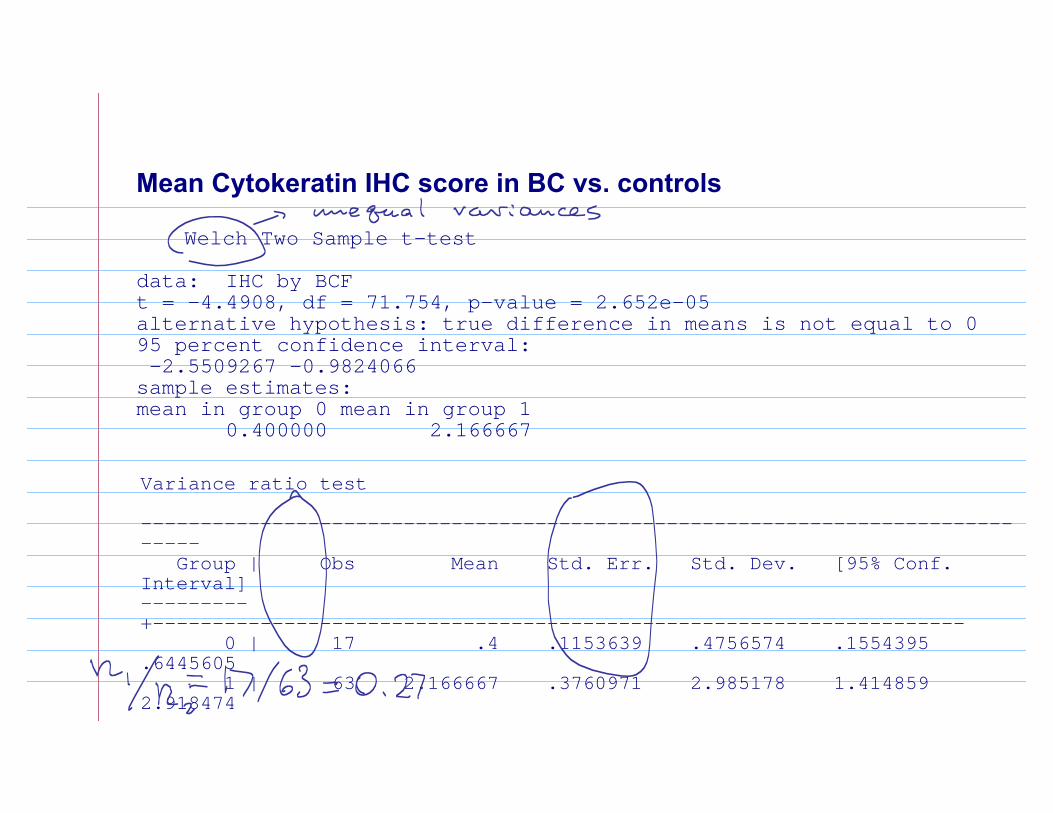
Mean Cytokeratin IHC score in BC vs. controls
Welch Two Sample t-test
data: IHC by BCF t = -4.4908, df = 71.754, p-value = 2.652e-05alternative hypothesis: true difference in means is not equal to 0 95 percent confidence interval: -2.5509267 -0.9824066 sample estimates:mean in group 0 mean in group 1 0.400000 2.166667
Variance ratio test
------------------------------------------------------------------------------ Group | Obs Mean Std. Err. Std. Dev. [95% Conf. Interval]---------+-------------------------------------------------------------------- 0 | 17 .4 .1153639 .4756574 .1554395 .6445605 1 | 63 2.166667 .3760971 2.985178 1.414859 2.918474
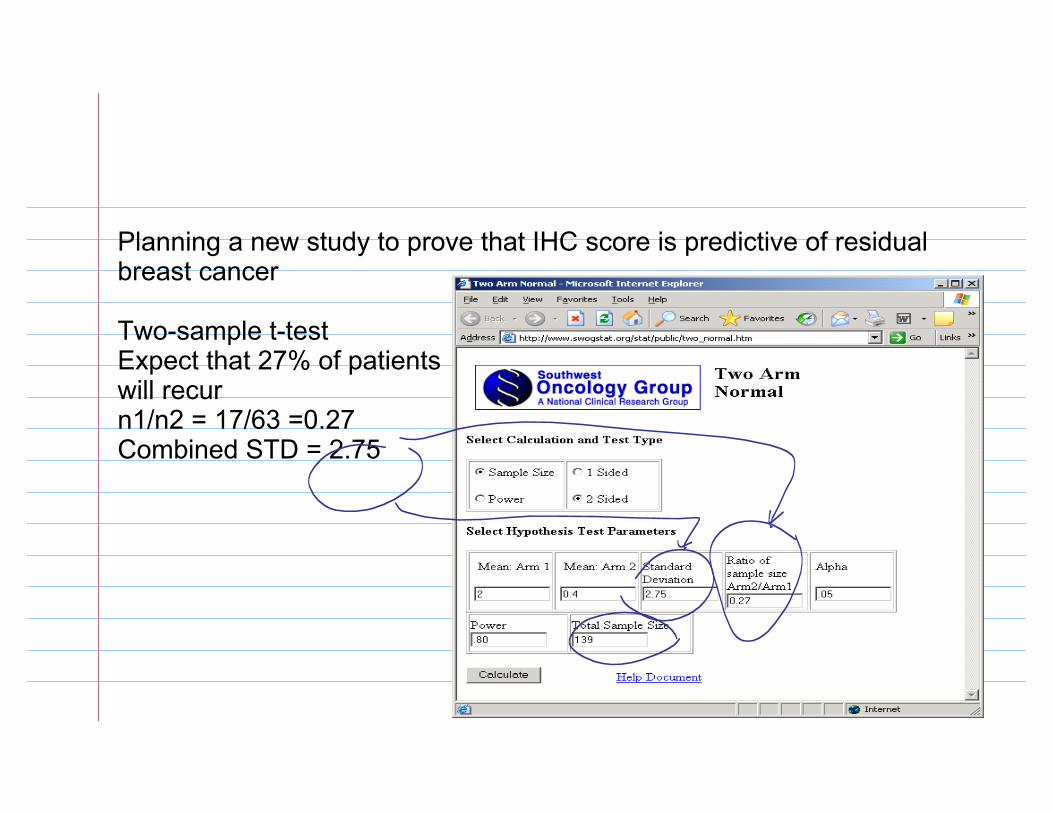
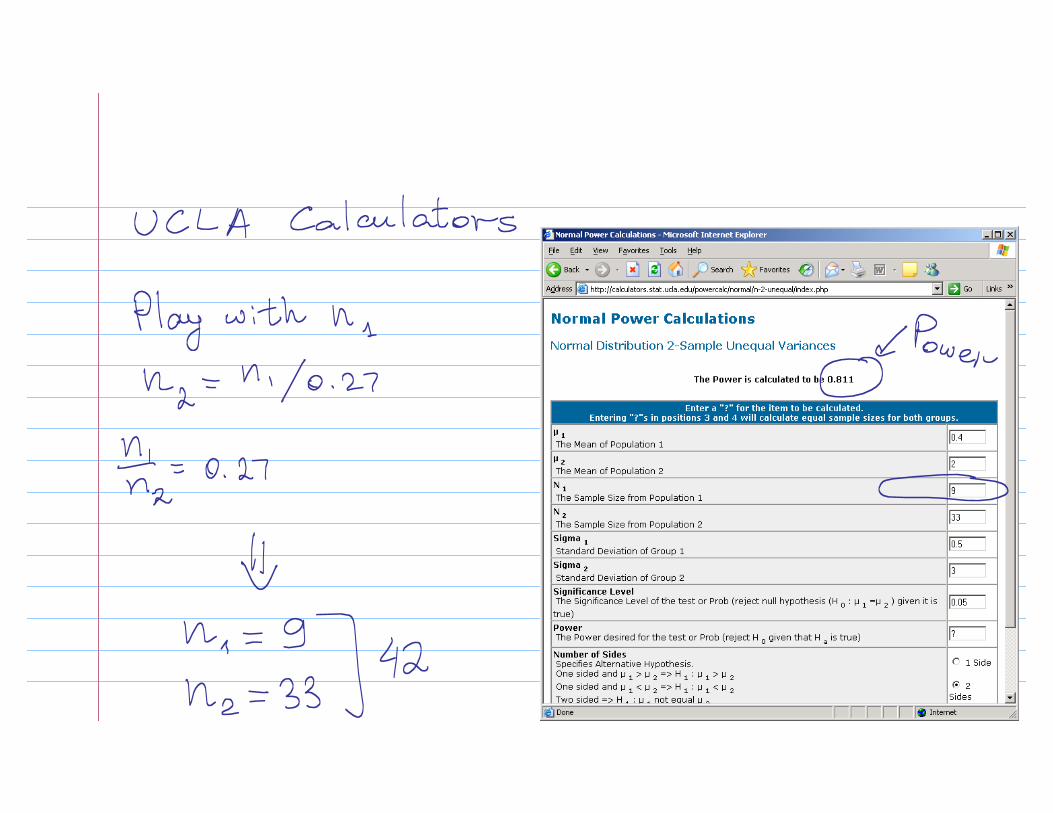
Planning a new study to prove that IHC score is predictive of residual breast cancer
Two-sample t-testExpect that 27% of patients will recurn1/n2 = 17/63 =0.27Combined STD = 2.75