EPA ENVIRONMENTAL MONITORING...EPA Identification point number Type of Monitoring Point Type of...
28
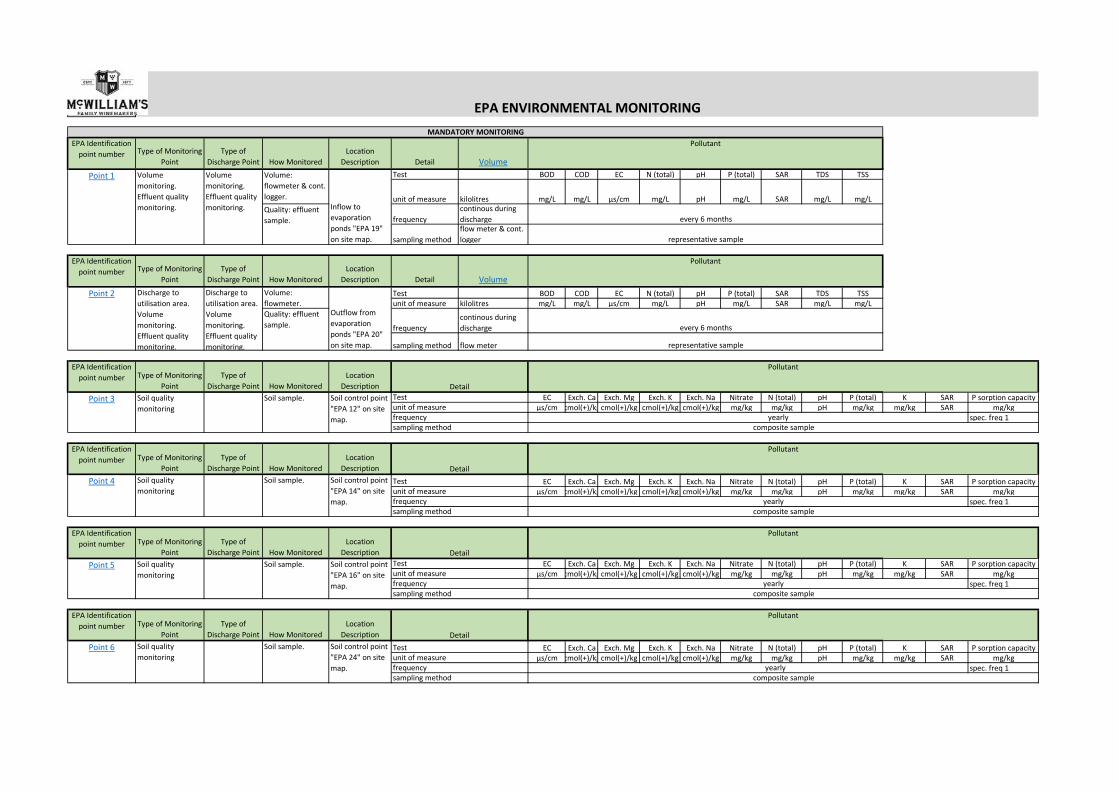
EPA Identification point number Type of Monitoring Point Type of Discharge Point How Monitored Location Description Detail Volume Test BOD COD EC N (total) pH P (total) SAR TDS TSS unit of measure kilolitres mg/L mg/L μs/cm mg/L pH mg/L SAR mg/L mg/L frequency continous during discharge sampling method flow meter & cont. logger EPA Identification point number Type of Monitoring Point Type of Discharge Point How Monitored Location Description Detail Volume Test BOD COD EC N (total) pH P (total) SAR TDS TSS unit of measure kilolitres mg/L mg/L μs/cm mg/L pH mg/L SAR mg/L mg/L frequency continous during discharge sampling method flow meter EPA Identification point number Type of Monitoring Point Type of Discharge Point How Monitored Location Description EC Exch. Ca Exch. Mg Exch. K Exch. Na Nitrate N (total) pH P (total) K SAR P sorption capacity μs/cm cmol(+)/kgcmol(+)/kg cmol(+)/kg cmol(+)/kg mg/kg mg/kg pH mg/kg mg/kg SAR mg/kg spec. freq 1 EPA Identification point number Type of Monitoring Point Type of Discharge Point How Monitored Location Description EC Exch. Ca Exch. Mg Exch. K Exch. Na Nitrate N (total) pH P (total) K SAR P sorption capacity μs/cm cmol(+)/kgcmol(+)/kg cmol(+)/kg cmol(+)/kg mg/kg mg/kg pH mg/kg mg/kg SAR mg/kg spec. freq 1 EPA Identification point number Type of Monitoring Point Type of Discharge Point How Monitored Location Description EC Exch. Ca Exch. Mg Exch. K Exch. Na Nitrate N (total) pH P (total) K SAR P sorption capacity μs/cm cmol(+)/kgcmol(+)/kg cmol(+)/kg cmol(+)/kg mg/kg mg/kg pH mg/kg mg/kg SAR mg/kg spec. freq 1 EPA Identification point number Type of Monitoring Point Type of Discharge Point How Monitored Location Description EC Exch. Ca Exch. Mg Exch. K Exch. Na Nitrate N (total) pH P (total) K SAR P sorption capacity μs/cm cmol(+)/kgcmol(+)/kg cmol(+)/kg cmol(+)/kg mg/kg mg/kg pH mg/kg mg/kg SAR mg/kg spec. freq 1 Pollutant Point 6 Soil quality monitoring Soil control point "EPA 24" on site map. yearly composite sample Detail Test unit of measure frequency sampling method Soil sample. Pollutant Point 5 Soil quality monitoring Soil control point "EPA 16" on site map. yearly composite sample Detail Test unit of measure frequency sampling method Soil sample. Volume: flowmeter. Quality: effluent sample. Soil sample. Pollutant every 6 months representative sample MANDATORY MONITORING Point 1 Volume monitoring. Effluent quality monitoring. Volume monitoring. Effluent quality monitoring. Inflow to evaporation ponds "EPA 19" on site map. Volume: flowmeter & cont. logger. Quality: effluent sample. Soil control point "EPA 12" on site map. Pollutant yearly composite sample Detail unit of measure frequency sampling method Test EPA ENVIRONMENTAL MONITORING Pollutant Point 4 Soil quality monitoring Soil control point "EPA 14" on site map. yearly composite sample Detail Test unit of measure frequency sampling method Soil sample. Pollutant Point 2 Discharge to utilisation area. Volume monitoring. Effluent quality monitoring. Discharge to utilisation area. Volume monitoring. Effluent quality monitoring. Outflow from evaporation ponds "EPA 20" on site map. every 6 months representative sample Point 3 Soil quality monitoring
Transcript of EPA ENVIRONMENTAL MONITORING...EPA Identification point number Type of Monitoring Point Type of...
EPA Identification point number Type of Monitoring
PointType of
Discharge Point How MonitoredLocation
Description Detail VolumeTest BOD COD EC N (total) pH P (total) SAR TDS TSS
unit of measure kilolitres mg/L mg/L μs/cm mg/L pH mg/L SAR mg/L mg/L
frequencycontinous during discharge
sampling methodflow meter & cont. logger
EPA Identification point number Type of Monitoring
PointType of
Discharge Point How MonitoredLocation
Description Detail VolumeTest BOD COD EC N (total) pH P (total) SAR TDS TSSunit of measure kilolitres mg/L mg/L μs/cm mg/L pH mg/L SAR mg/L mg/L
frequencycontinous during discharge
sampling method flow meter
EPA Identification point number Type of Monitoring
PointType of
Discharge Point How MonitoredLocation
DescriptionEC Exch. Ca Exch. Mg Exch. K Exch. Na Nitrate N (total) pH P (total) K SAR P sorption capacity
μs/cm cmol(+)/kgcmol(+)/kg cmol(+)/kg cmol(+)/kg mg/kg mg/kg pH mg/kg mg/kg SAR mg/kgspec. freq 1
EPA Identification point number Type of Monitoring
PointType of
Discharge Point How MonitoredLocation
Description
EC Exch. Ca Exch. Mg Exch. K Exch. Na Nitrate N (total) pH P (total) K SAR P sorption capacityμs/cm cmol(+)/kgcmol(+)/kg cmol(+)/kg cmol(+)/kg mg/kg mg/kg pH mg/kg mg/kg SAR mg/kg
spec. freq 1
EPA Identification point number Type of Monitoring
PointType of
Discharge Point How MonitoredLocation
DescriptionEC Exch. Ca Exch. Mg Exch. K Exch. Na Nitrate N (total) pH P (total) K SAR P sorption capacity
μs/cm cmol(+)/kgcmol(+)/kg cmol(+)/kg cmol(+)/kg mg/kg mg/kg pH mg/kg mg/kg SAR mg/kgspec. freq 1
EPA Identification point number Type of Monitoring
PointType of
Discharge Point How MonitoredLocation
Description
EC Exch. Ca Exch. Mg Exch. K Exch. Na Nitrate N (total) pH P (total) K SAR P sorption capacityμs/cm cmol(+)/kgcmol(+)/kg cmol(+)/kg cmol(+)/kg mg/kg mg/kg pH mg/kg mg/kg SAR mg/kg
spec. freq 1
Pollutant
Point 6 Soil quality monitoring
Soil control point "EPA 24" on site map. yearly
composite sample
DetailTestunit of measurefrequencysampling method
Soil sample.
Pollutant
Point 5 Soil quality monitoring
Soil control point "EPA 16" on site map. yearly
composite sample
DetailTestunit of measurefrequencysampling method
Soil sample.
Volume: flowmeter. Quality: effluent sample.
Soil sample.
Pollutant
every 6 months
representative sample
MANDATORY MONITORING
Point 1 Volume monitoring. Effluent quality monitoring.
Volume monitoring. Effluent quality monitoring. Inflow to
evaporation ponds "EPA 19" on site map.
Volume: flowmeter & cont. logger. Quality: effluent sample.
Soil control point "EPA 12" on site map.
Pollutant
yearlycomposite sample
Detail
unit of measurefrequencysampling method
Test
EPA ENVIRONMENTAL MONITORING
Pollutant
Point 4 Soil quality monitoring
Soil control point "EPA 14" on site map. yearly
composite sample
DetailTestunit of measurefrequencysampling method
Soil sample.
Pollutant
Point 2 Discharge to utilisation area. Volume monitoring. Effluent quality monitoring.
Discharge to utilisation area. Volume monitoring. Effluent quality monitoring.
Outflow from evaporation ponds "EPA 20" on site map.
every 6 months
representative sample
Point 3 Soil quality monitoring
EPA ENVIRONMENTAL MONITORINGEPA Identification
point number Type of Monitoring Point
Type of Discharge Point How Monitored
Location Description
EC Exch. Ca Exch. Mg Exch. K Exch. Na Nitrate N (total) pH P (total) K SAR P sorption capacityμs/cm cmol(+)/kgcmol(+)/kg cmol(+)/kg cmol(+)/kg mg/kg mg/kg pH mg/kg mg/kg SAR mg/kg
spec. freq 1
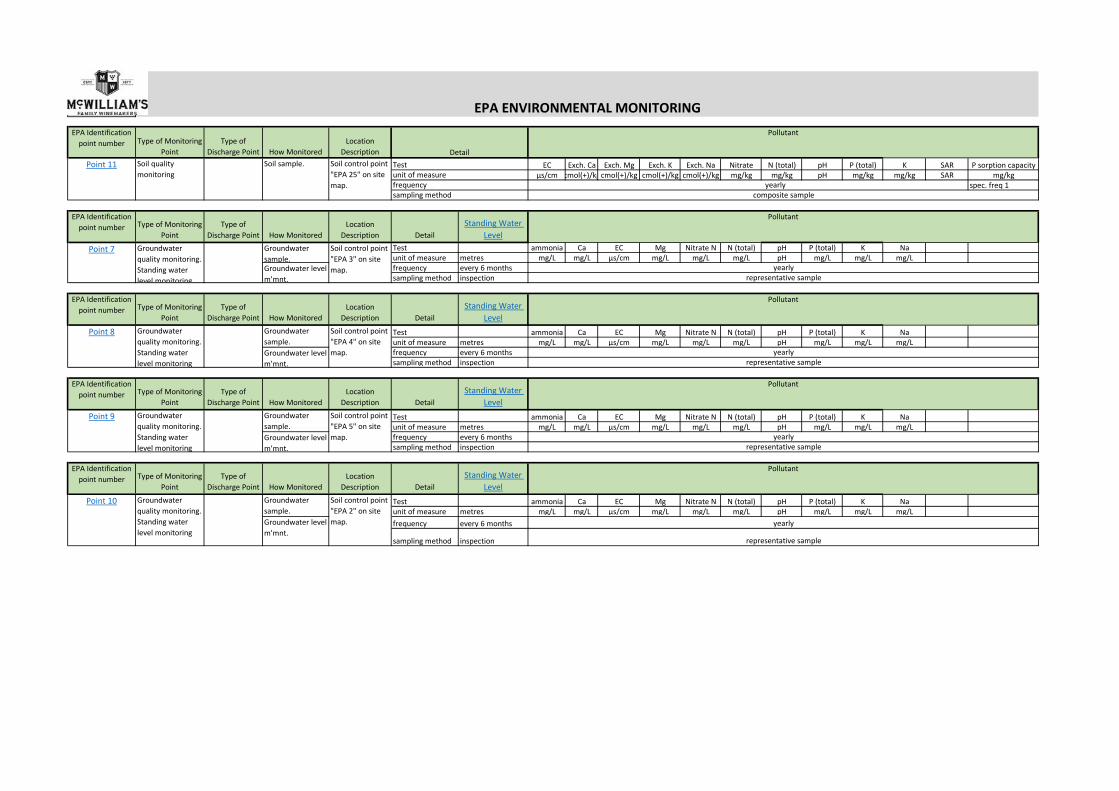
EPA Identification point number Type of Monitoring
PointType of
Discharge Point How MonitoredLocation
Description DetailStanding Water
LevelTest ammonia Ca EC Mg Nitrate N N (total) pH P (total) K Naunit of measure metres mg/L mg/L μs/cm mg/L mg/L mg/L pH mg/L mg/L mg/Lfrequency every 6 monthssampling method inspection
EPA Identification point number Type of Monitoring
PointType of
Discharge Point How MonitoredLocation
Description DetailStanding Water
LevelTest ammonia Ca EC Mg Nitrate N N (total) pH P (total) K Naunit of measure metres mg/L mg/L μs/cm mg/L mg/L mg/L pH mg/L mg/L mg/Lfrequency every 6 months
sampling method inspection
Groundwater sample. Groundwater level m'mnt.
Groundwater sample. Groundwater level m'mnt.
Pollutant
Point 9 Groundwater quality monitoring. Standing water level monitoring
Soil control point "EPA 5" on site map.
Point 10 Groundwater quality monitoring. Standing water level monitoring
Soil control point "EPA 2" on site map.
yearlyrepresentative sample
Pollutant
yearly
representative sample
Pollutant
Point 8 Groundwater quality monitoring. Standing water level monitoring
Soil control point "EPA 4" on site map. yearly
representative sample
Groundwater sample. Groundwater level m'mnt.
Pollutant
Point 7 Groundwater quality monitoring. Standing water level monitoring
Soil control point "EPA 3" on site map.
representative sampleyearly
Groundwater sample. Groundwater level m'mnt.
Pollutant
Point 11 Soil quality monitoring
Soil control point "EPA 25" on site map. yearly
composite sample
DetailTestunit of measurefrequencysampling method
Soil sample.
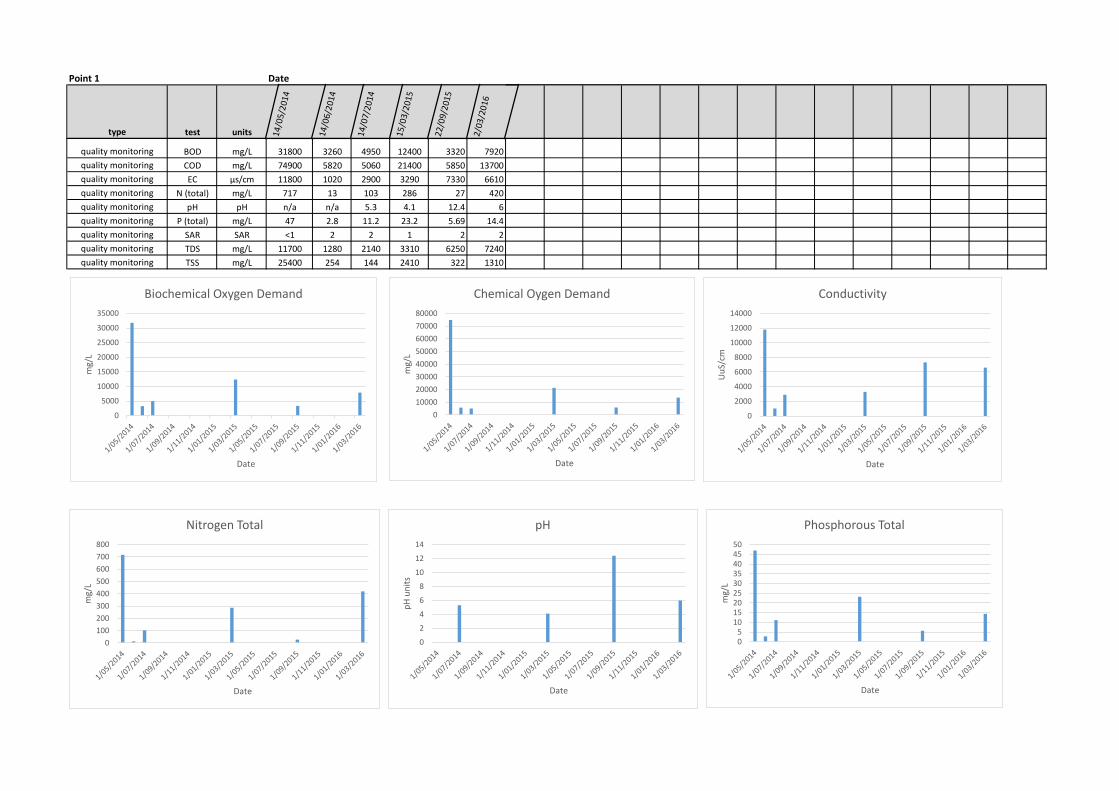
Point 1 Date
type test units 14/0
5/20
14
14/0
6/20
14
14/0
7/20
14
15/0
3/20
15
22/0
9/20
15
2/03
/201
6
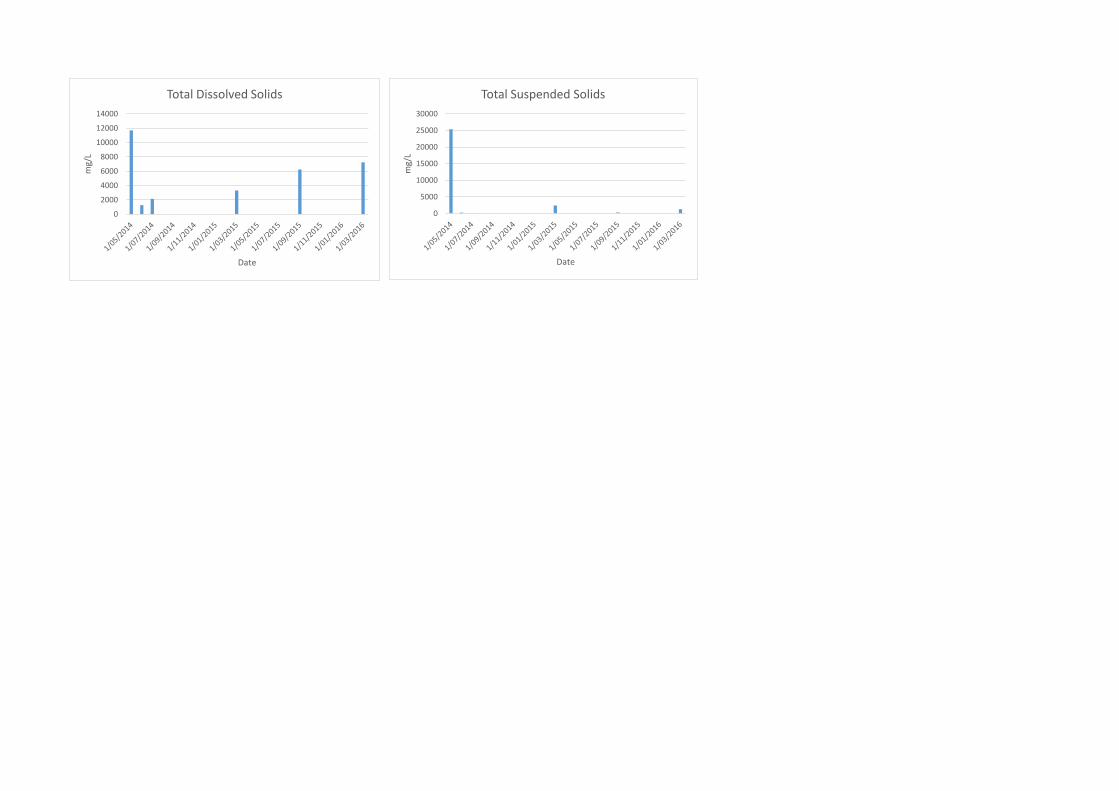
quality monitoring BOD mg/L 31800 3260 4950 12400 3320 7920quality monitoring COD mg/L 74900 5820 5060 21400 5850 13700quality monitoring EC μs/cm 11800 1020 2900 3290 7330 6610quality monitoring N (total) mg/L 717 13 103 286 27 420quality monitoring pH pH n/a n/a 5.3 4.1 12.4 6quality monitoring P (total) mg/L 47 2.8 11.2 23.2 5.69 14.4quality monitoring SAR SAR <1 2 2 1 2 2quality monitoring TDS mg/L 11700 1280 2140 3310 6250 7240quality monitoring TSS mg/L 25400 254 144 2410 322 1310
0
5000
10000
15000
20000
25000
30000
35000
mg/
L
Date
Biochemical Oxygen Demand
01000020000300004000050000600007000080000
mg/
L
Date
Chemical Oygen Demand
0
2000
4000
6000
8000
10000
12000
14000
UuS
/cm
Date
Conductivity
0100200300400500600700800
mg/
L
Date
Nitrogen Total
0
2
4
6
8
10
12
14
pH u
nits
Date
pH
05
101520253035404550
mg/
L
Date
Phosphorous Total
0
2000
4000
6000
8000
10000
12000
14000
mg/
L
Date
Total Dissolved Solids
0
5000
10000
15000
20000
25000
30000
mg/
L
Date
Total Suspended Solids
Point 2 Date
type test units 14/0
5/20
14
14/0
7/20
14
15/0
3/20
15
22/0
9/20
15
2/03
/201
6
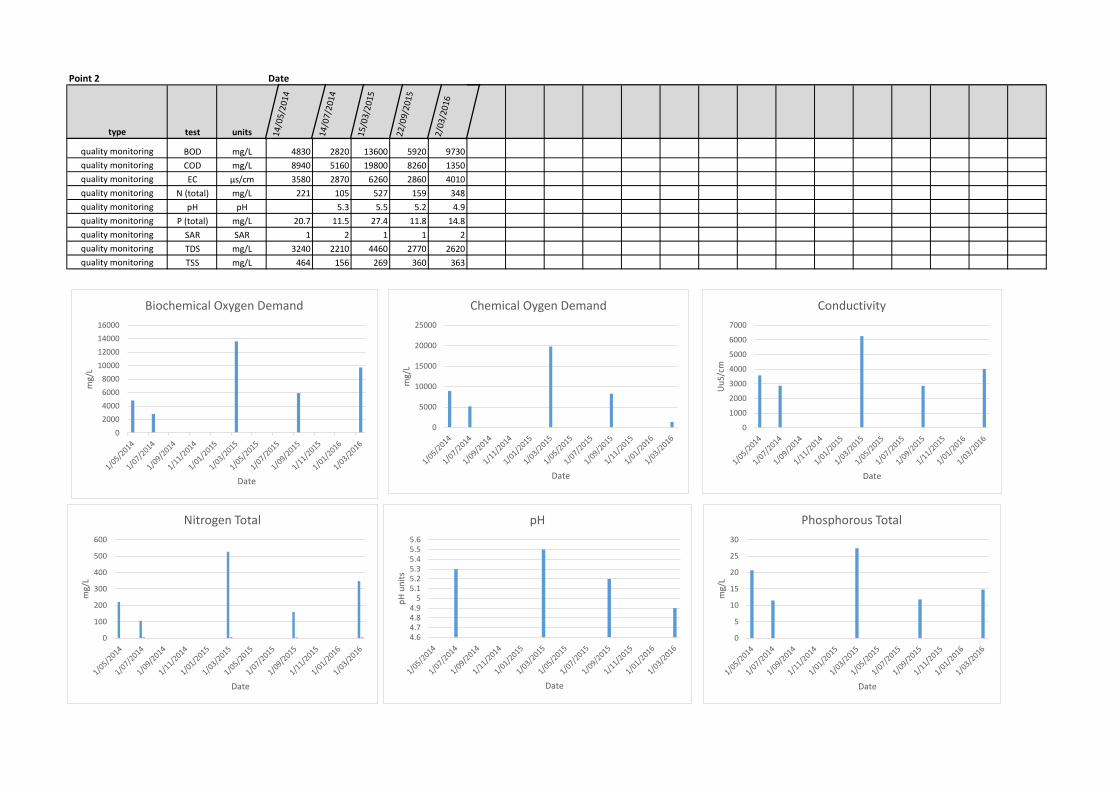
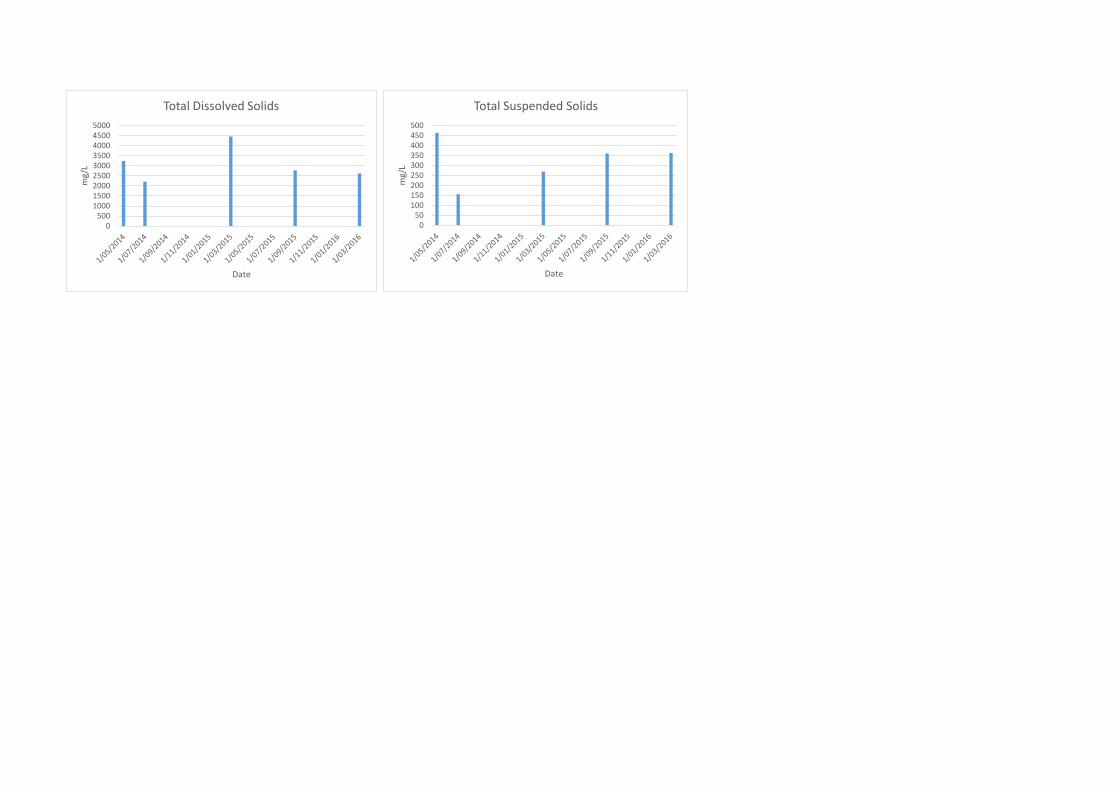
quality monitoring BOD mg/L 4830 2820 13600 5920 9730quality monitoring COD mg/L 8940 5160 19800 8260 1350quality monitoring EC μs/cm 3580 2870 6260 2860 4010quality monitoring N (total) mg/L 221 105 527 159 348quality monitoring pH pH 5.3 5.5 5.2 4.9quality monitoring P (total) mg/L 20.7 11.5 27.4 11.8 14.8quality monitoring SAR SAR 1 2 1 1 2quality monitoring TDS mg/L 3240 2210 4460 2770 2620quality monitoring TSS mg/L 464 156 269 360 363
02000400060008000
10000120001400016000
mg/
L
Date
Biochemical Oxygen Demand
0
5000
10000
15000
20000
25000
mg/
L
Date
Chemical Oygen Demand
0
1000
2000
3000
4000
5000
6000
7000
UuS
/cm
Date
Conductivity
0
100
200
300
400
500
600
mg/
L
Date
Nitrogen Total
4.64.74.84.9
55.15.25.35.45.55.6
pH u
nits
Date
pH
0
5
10
15
20
25
30
mg/
L
Date
Phosphorous Total
0500
100015002000250030003500400045005000
mg/
L
Date
Total Dissolved Solids
050
100150200250300350400450500
mg/
L
Date
Total Suspended Solids
DateInflow ( point 1)
Outflow (point 2)
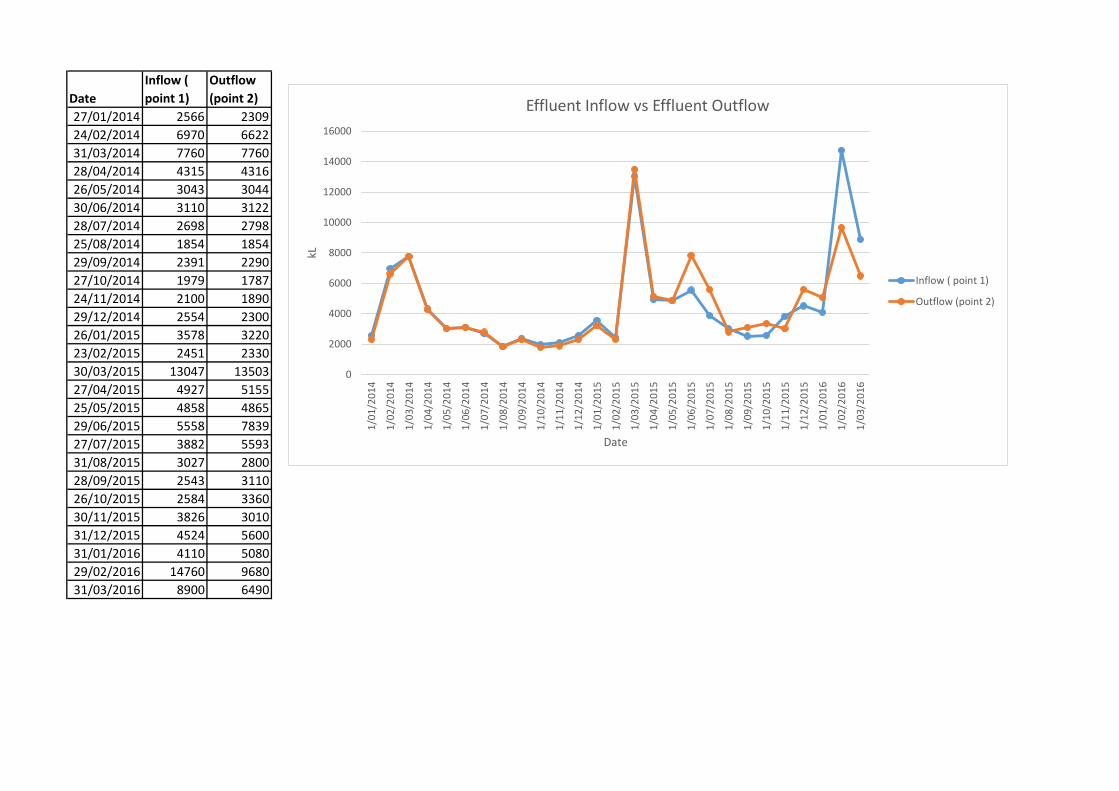
27/01/2014 2566 230924/02/2014 6970 662231/03/2014 7760 776028/04/2014 4315 431626/05/2014 3043 304430/06/2014 3110 312228/07/2014 2698 279825/08/2014 1854 185429/09/2014 2391 229027/10/2014 1979 178724/11/2014 2100 189029/12/2014 2554 230026/01/2015 3578 322023/02/2015 2451 233030/03/2015 13047 1350327/04/2015 4927 515525/05/2015 4858 486529/06/2015 5558 783927/07/2015 3882 559331/08/2015 3027 280028/09/2015 2543 311026/10/2015 2584 336030/11/2015 3826 301031/12/2015 4524 560031/01/2016 4110 508029/02/2016 14760 968031/03/2016 8900 6490
0
2000
4000
6000
8000
10000
12000
14000
16000
1/01
/201
4
1/02
/201
4
1/03
/201
4
1/04
/201
4
1/05
/201
4
1/06
/201
4
1/07
/201
4
1/08
/201
4
1/09
/201
4
1/10
/201
4
1/11
/201
4
1/12
/201
4
1/01
/201
5
1/02
/201
5
1/03
/201
5
1/04
/201
5
1/05
/201
5
1/06
/201
5
1/07
/201
5
1/08
/201
5
1/09
/201
5
1/10
/201
5
1/11
/201
5
1/12
/201
5
1/01
/201
6
1/02
/201
6
1/03
/201
6
kL
Date
Effluent Inflow vs Effluent Outflow
Inflow ( point 1)
Outflow (point 2)
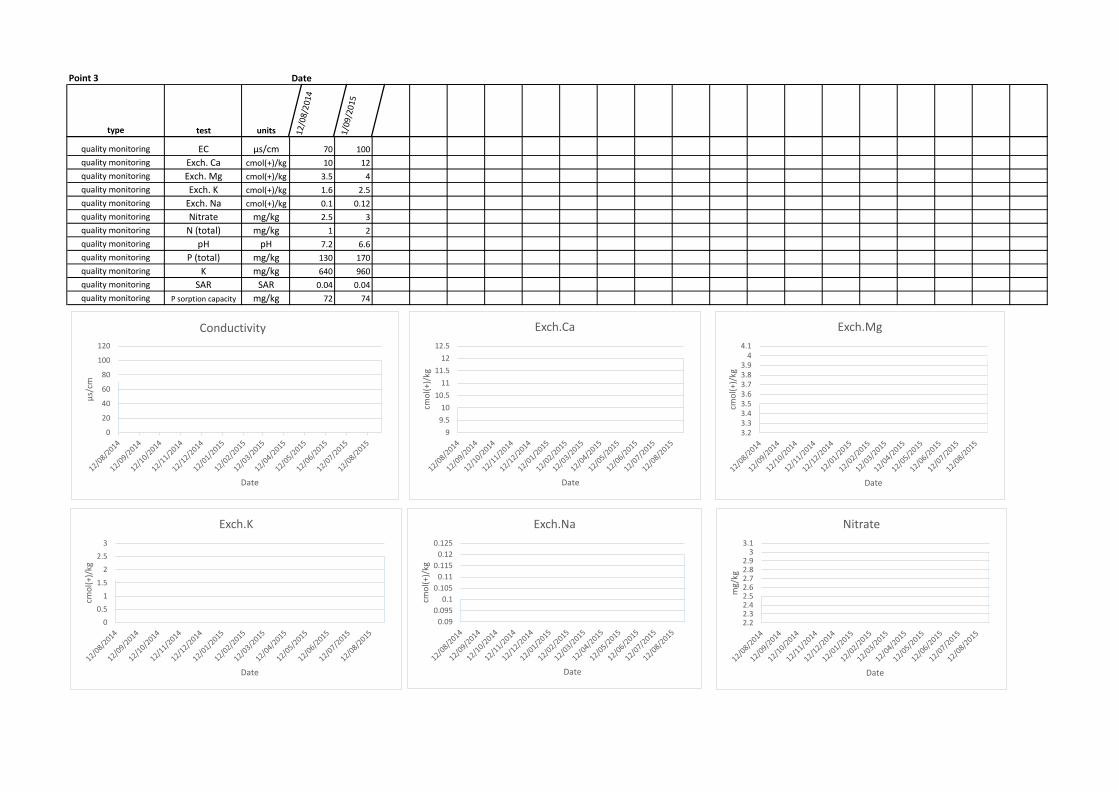
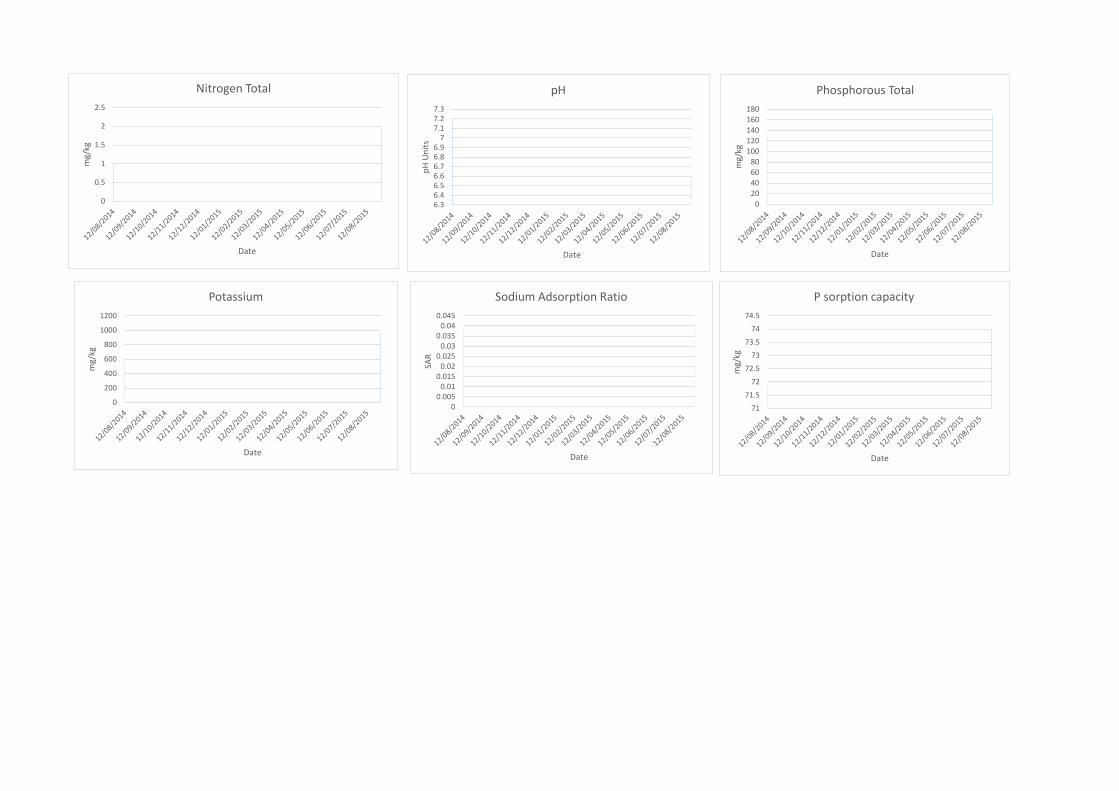
Point 3 Date
type test units 12/0
8/20
14
1/09
/201
5
quality monitoring EC μs/cm 70 100quality monitoring Exch. Ca cmol(+)/kg 10 12quality monitoring Exch. Mg cmol(+)/kg 3.5 4quality monitoring Exch. K cmol(+)/kg 1.6 2.5quality monitoring Exch. Na cmol(+)/kg 0.1 0.12quality monitoring Nitrate mg/kg 2.5 3quality monitoring N (total) mg/kg 1 2quality monitoring pH pH 7.2 6.6quality monitoring P (total) mg/kg 130 170quality monitoring K mg/kg 640 960quality monitoring SAR SAR 0.04 0.04quality monitoring P sorption capacity mg/kg 72 74
0
20
40
60
80
100
120
μs/c
m
Date
Conductivity
99.510
10.511
11.512
12.5
cmol
(+)/
kg
Date
Exch.Ca
3.23.33.43.53.63.73.83.9
44.1
cmol
(+)/
kg
Date
Exch.Mg
00.5
11.5
22.5
3
cmol
(+)/
kg
Date
Exch.K
0.090.095
0.10.105
0.110.115
0.120.125
cmol
(+)/
kg
Date
Exch.Na
2.22.32.42.52.62.72.82.9
33.1
mg/
kg
Date
Nitrate
0
0.5
1
1.5
2
2.5
mg/
kg
Date
Nitrogen Total
6.36.46.56.66.76.86.9
77.17.27.3
pH U
nits
Date
pH
020406080
100120140160180
mg/
kg
Date
Phosphorous Total
0
200
400
600
800
1000
1200
mg/
kg
Date
Potassium
00.005
0.010.015
0.020.025
0.030.035
0.040.045
SAR
Date
Sodium Adsorption Ratio
7171.5
7272.5
7373.5
7474.5
mg/
kg
Date
P sorption capacity
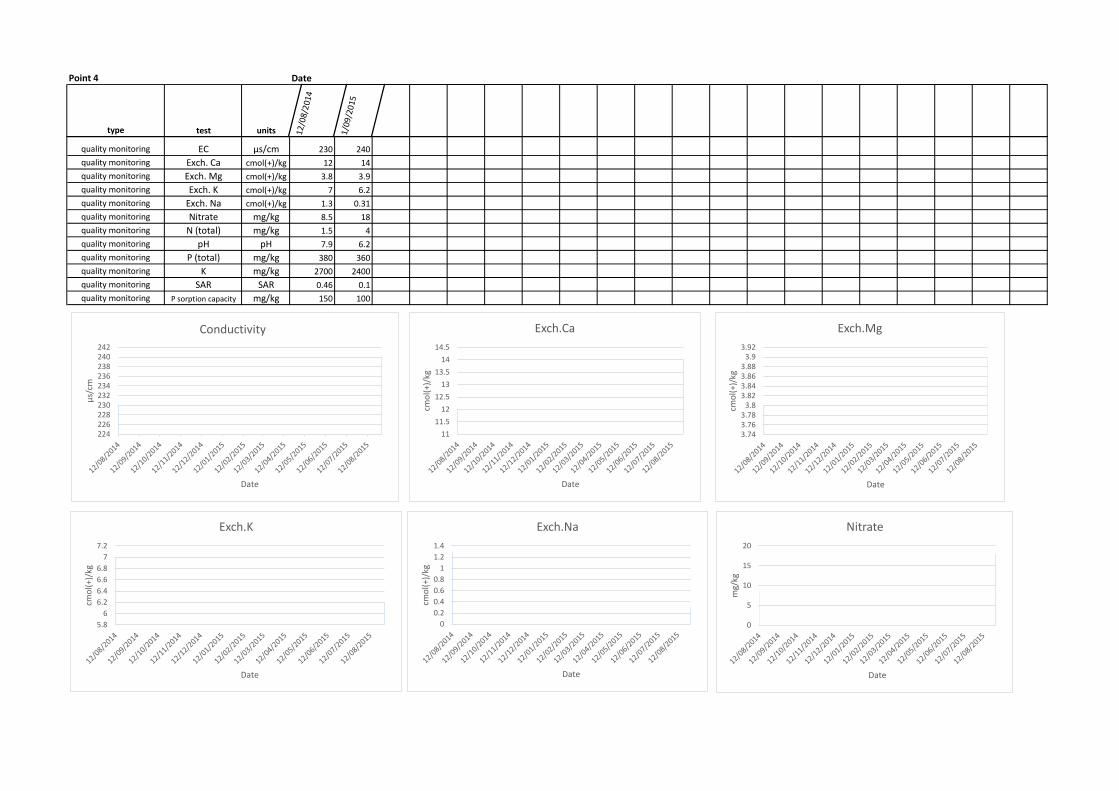
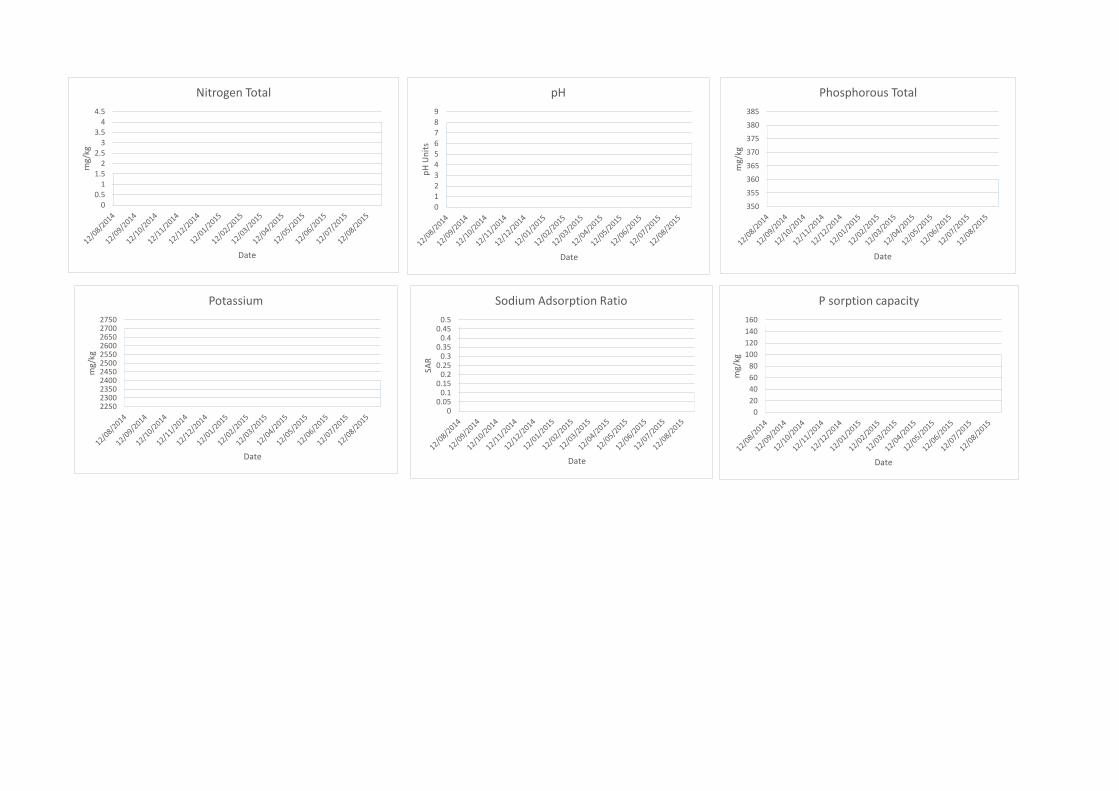
Point 4 Date
type test units 12/0
8/20
14
1/09
/201
5
quality monitoring EC μs/cm 230 240quality monitoring Exch. Ca cmol(+)/kg 12 14quality monitoring Exch. Mg cmol(+)/kg 3.8 3.9quality monitoring Exch. K cmol(+)/kg 7 6.2quality monitoring Exch. Na cmol(+)/kg 1.3 0.31quality monitoring Nitrate mg/kg 8.5 18quality monitoring N (total) mg/kg 1.5 4quality monitoring pH pH 7.9 6.2quality monitoring P (total) mg/kg 380 360quality monitoring K mg/kg 2700 2400quality monitoring SAR SAR 0.46 0.1quality monitoring P sorption capacity mg/kg 150 100
224226228230232234236238240242
μs/c
m
Date
Conductivity
1111.5
1212.5
1313.5
1414.5
cmol
(+)/
kg
Date
Exch.Ca
3.743.763.78
3.83.823.843.863.88
3.93.92
cmol
(+)/
kg
Date
Exch.Mg
5.86
6.26.46.66.8
77.2
cmol
(+)/
kg
Date
Exch.K
00.20.40.60.8
11.21.4
cmol
(+)/
kg
Date
Exch.Na
0
5
10
15
20
mg/
kg
Date
Nitrate
00.5
11.5
22.5
33.5
44.5
mg/
kg
Date
Nitrogen Total
0123456789
pH U
nits
Date
pH
350
355
360
365
370
375
380
385
mg/
kg
Date
Phosphorous Total
22502300235024002450250025502600265027002750
mg/
kg
Date
Potassium
00.05
0.10.15
0.20.25
0.30.35
0.40.45
0.5
SAR
Date
Sodium Adsorption Ratio
020406080
100120140160
mg/
kg
Date
P sorption capacity
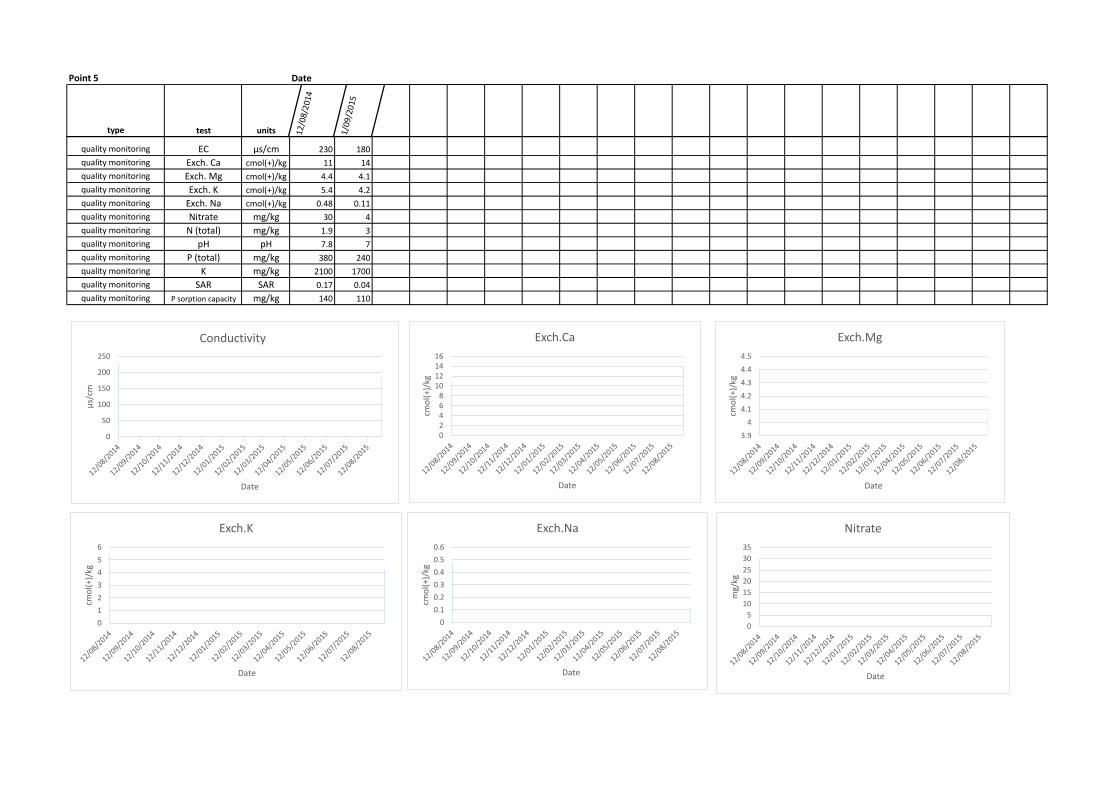
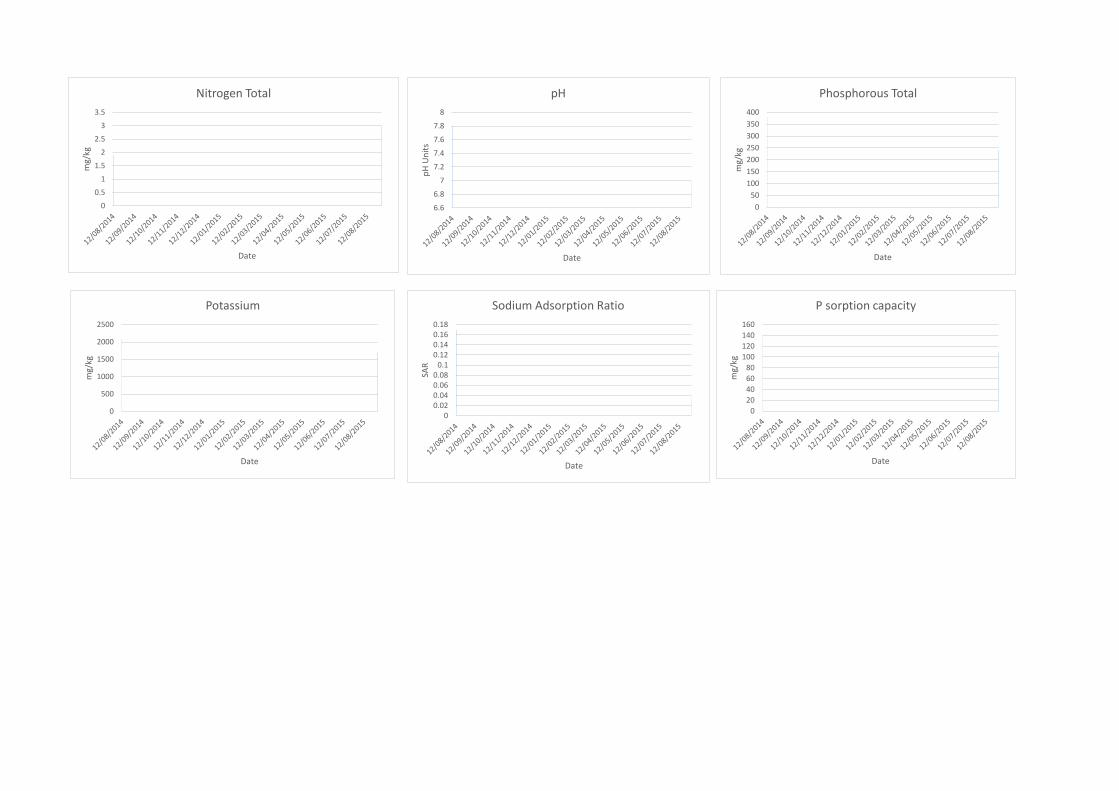
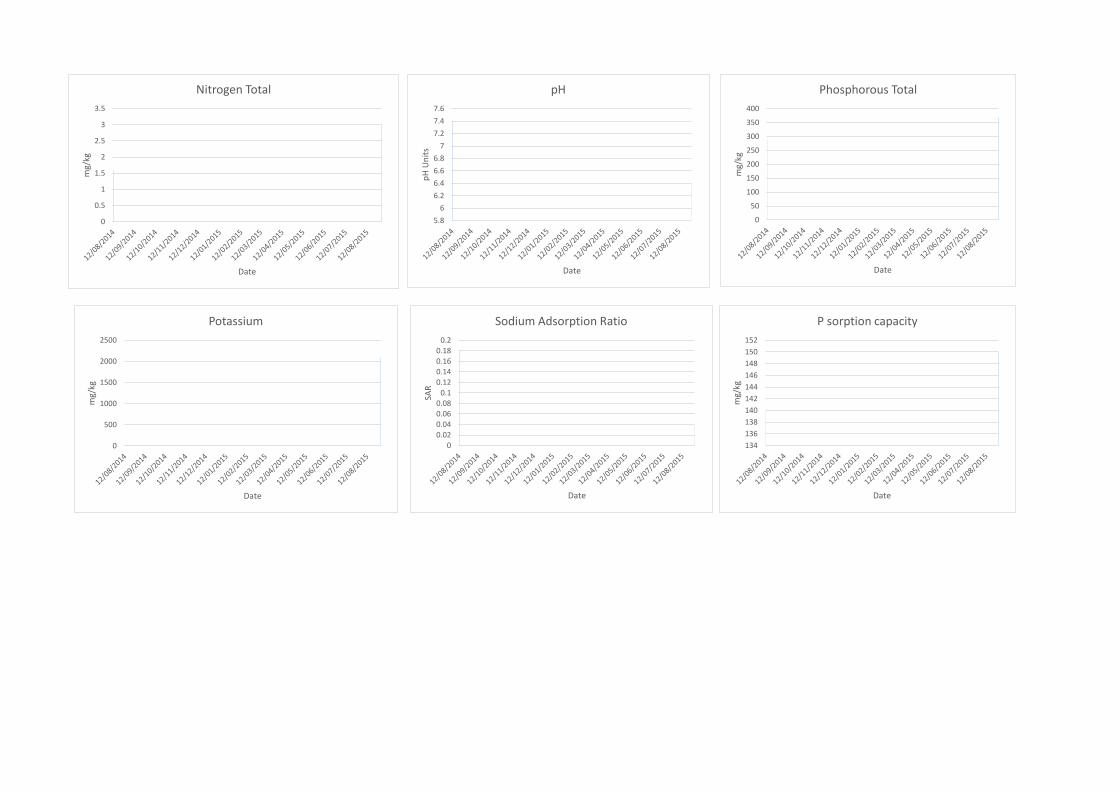
Point 5 Date
type test units 12/0
8/20
14
1/09
/201
5
quality monitoring EC μs/cm 230 180quality monitoring Exch. Ca cmol(+)/kg 11 14quality monitoring Exch. Mg cmol(+)/kg 4.4 4.1quality monitoring Exch. K cmol(+)/kg 5.4 4.2quality monitoring Exch. Na cmol(+)/kg 0.48 0.11quality monitoring Nitrate mg/kg 30 4quality monitoring N (total) mg/kg 1.9 3quality monitoring pH pH 7.8 7quality monitoring P (total) mg/kg 380 240quality monitoring K mg/kg 2100 1700quality monitoring SAR SAR 0.17 0.04quality monitoring P sorption capacity mg/kg 140 110
0
50
100
150
200
250
μs/c
m
Date
Conductivity
02468
10121416
cmol
(+)/
kg
Date
Exch.Ca
3.94
4.14.24.34.44.5
cmol
(+)/
kg
Date
Exch.Mg
0123456
cmol
(+)/
kg
Date
Exch.K
00.10.20.30.40.50.6
cmol
(+)/
kg
Date
Exch.Na
05
101520253035
mg/
kg
Date
Nitrate
0
0.5
1
1.5
2
2.5
3
3.5
mg/
kg
Date
Nitrogen Total
6.6
6.8
7
7.2
7.4
7.6
7.8
8
pH U
nits
Date
pH
050
100150200250300350400
mg/
kg
Date
Phosphorous Total
0
500
1000
1500
2000
2500
mg/
kg
Date
Potassium
00.020.040.060.08
0.10.120.140.160.18
SAR
Date
Sodium Adsorption Ratio
020406080
100120140160
mg/
kg
Date
P sorption capacity

Point 6 Date
type test units 12/0
8/20
14
1/09
/201
5
quality monitoring EC μs/cm 680 170quality monitoring Exch. Ca cmol(+)/kg 16 11quality monitoring Exch. Mg cmol(+)/kg 2.6 1.6quality monitoring Exch. K cmol(+)/kg 5 5.3quality monitoring Exch. Na cmol(+)/kg 0.57 0.11quality monitoring Nitrate mg/kg 5.2 5quality monitoring N (total) mg/kg 1.6 3quality monitoring pH pH 7.4 6.4quality monitoring P (total) mg/kg 290 370quality monitoring K mg/kg 21 2100quality monitoring SAR SAR 0.18 0.04quality monitoring P sorption capacity mg/kg 140 150
0100200300400500600700800
μs/c
m
Date
Conductivity
02468
1012141618
cmol
(+)/
kg
Date
Exch.Ca
00.5
11.5
22.5
3
cmol
(+)/
kg
Date
Exch.Mg
4.84.9
55.15.25.35.4
cmol
(+)/
kg
Date
Exch.K
00.10.20.30.40.50.6
cmol
(+)/
kg
Date
Exch.Na
4.94.95
55.05
5.15.15
5.25.25
mg/
kg
Date
Nitrate
0
0.5
1
1.5
2
2.5
3
3.5
mg/
kg
Date
Nitrogen Total
5.86
6.26.46.66.8
77.27.47.6
pH U
nits
Date
pH
0
50
100
150
200
250
300
350
400
mg/
kg
Date
Phosphorous Total
0
500
1000
1500
2000
2500
mg/
kg
Date
Potassium
00.020.040.060.08
0.10.120.140.160.18
0.2
SAR
Date
Sodium Adsorption Ratio
134136138140142144146148150152
mg/
kg
Date
P sorption capacity
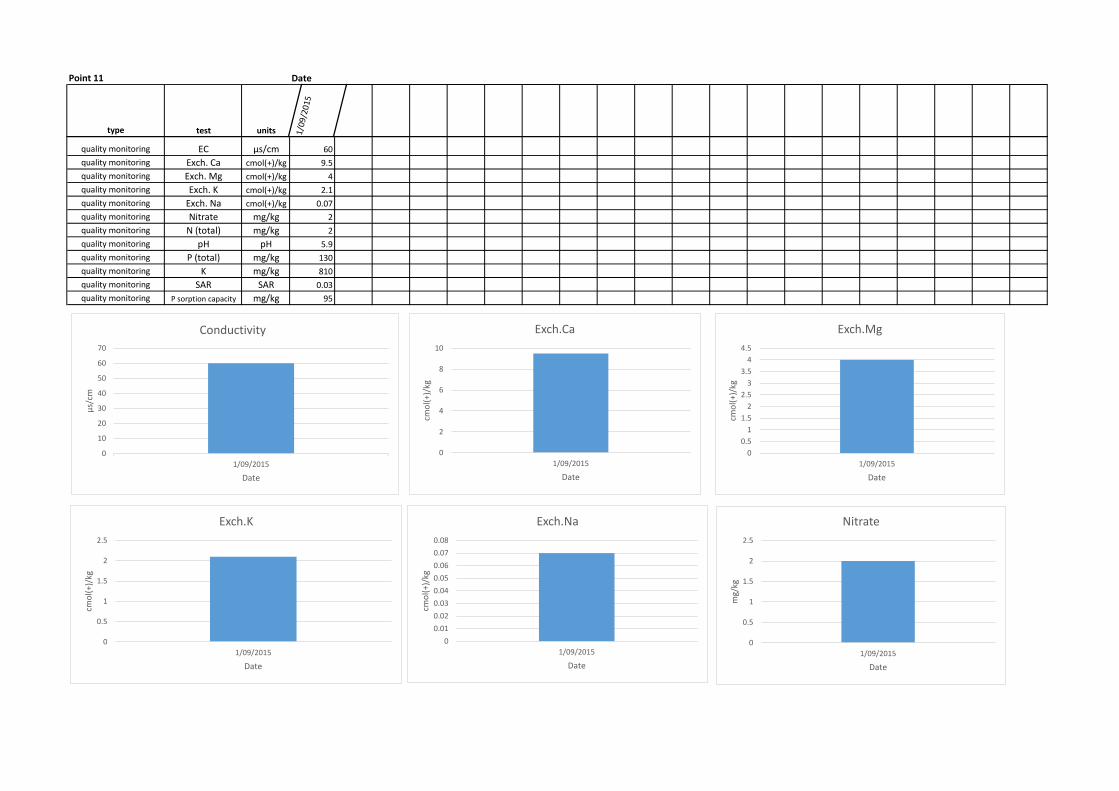
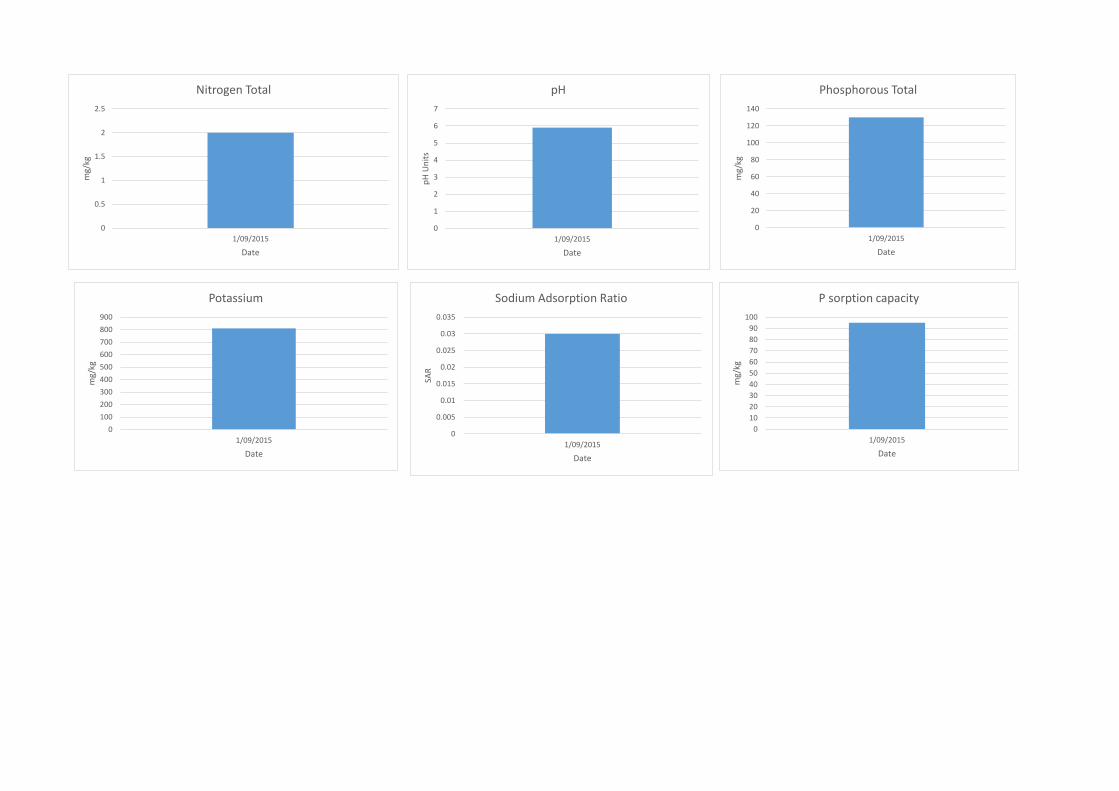
Point 11 Date
type test units 1/09
/201
5
quality monitoring EC μs/cm 60quality monitoring Exch. Ca cmol(+)/kg 9.5quality monitoring Exch. Mg cmol(+)/kg 4quality monitoring Exch. K cmol(+)/kg 2.1quality monitoring Exch. Na cmol(+)/kg 0.07quality monitoring Nitrate mg/kg 2quality monitoring N (total) mg/kg 2quality monitoring pH pH 5.9quality monitoring P (total) mg/kg 130quality monitoring K mg/kg 810quality monitoring SAR SAR 0.03quality monitoring P sorption capacity mg/kg 95
0
10
20
30
40
50
60
70
1/09/2015
μs/c
m
Date
Conductivity
0
2
4
6
8
10
1/09/2015
cmol
(+)/
kg
Date
Exch.Ca
00.5
11.5
22.5
33.5
44.5
1/09/2015
cmol
(+)/
kg
Date
Exch.Mg
0
0.5
1
1.5
2
2.5
1/09/2015
cmol
(+)/
kg
Date
Exch.K
00.010.020.030.040.050.060.070.08
1/09/2015
cmol
(+)/
kg
Date
Exch.Na
0
0.5
1
1.5
2
2.5
1/09/2015
mg/
kg
Date
Nitrate
0
0.5
1
1.5
2
2.5
1/09/2015
mg/
kg
Date
Nitrogen Total
0
1
2
3
4
5
6
7
1/09/2015
pH U
nits
Date
pH
0
20
40
60
80
100
120
140
1/09/2015
mg/
kg
Date
Phosphorous Total
0100200300400500600700800900
1/09/2015
mg/
kg
Date
Potassium
0
0.005
0.01
0.015
0.02
0.025
0.03
0.035
1/09/2015
SAR
Date
Sodium Adsorption Ratio
0102030405060708090
100
1/09/2015
mg/
kg
Date
P sorption capacity
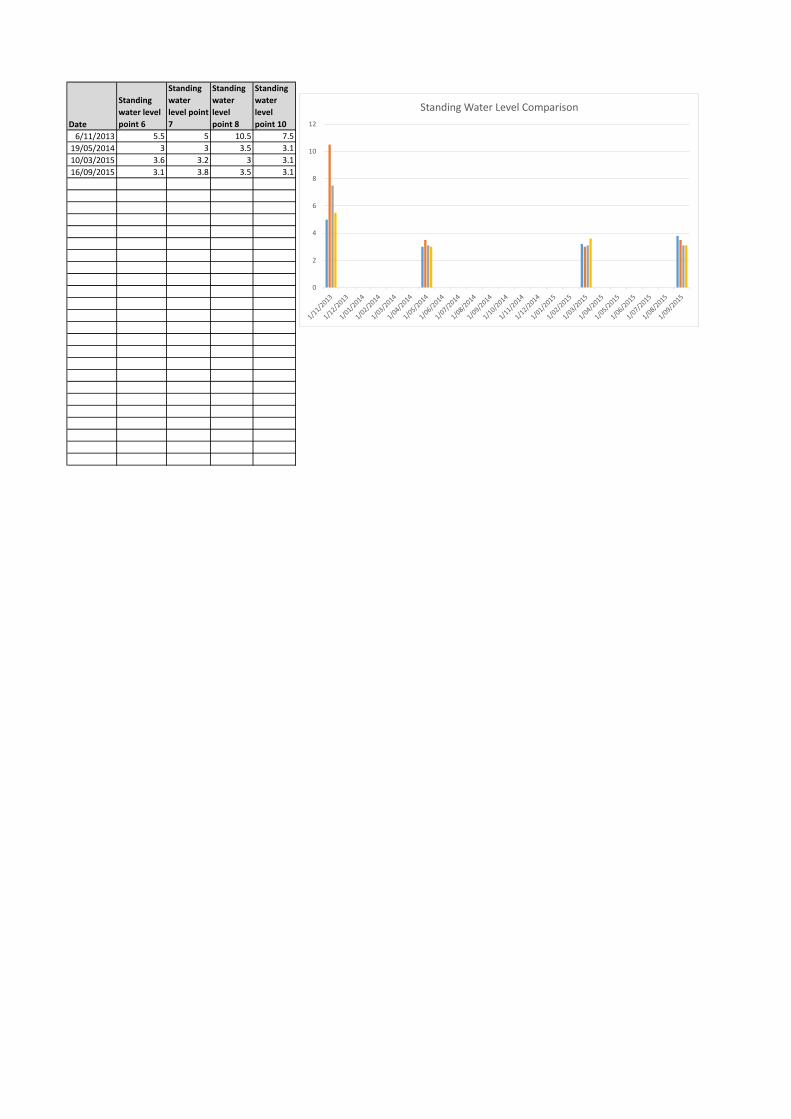
Date
Standing water level point 6
Standing water level point 7
Standing water level point 8
Standing water level point 10
6/11/2013 5.5 5 10.5 7.519/05/2014 3 3 3.5 3.110/03/2015 3.6 3.2 3 3.116/09/2015 3.1 3.8 3.5 3.1
0
2
4
6
8
10
12
Standing Water Level Comparison
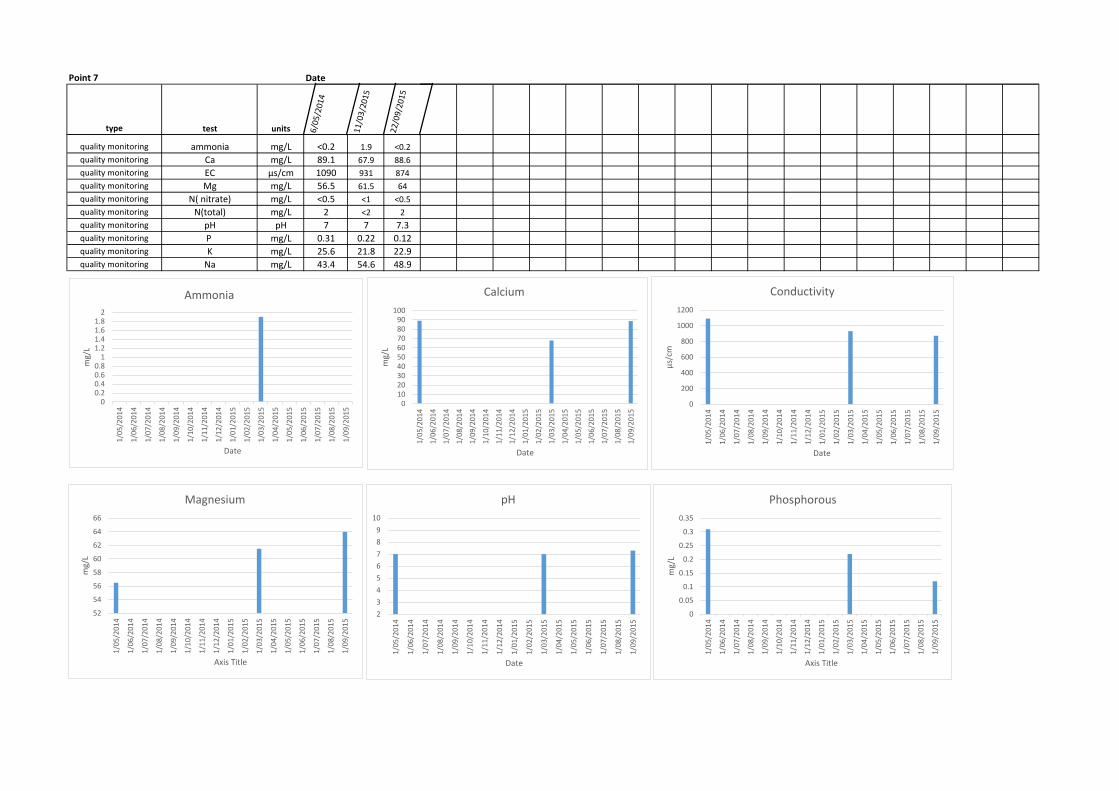
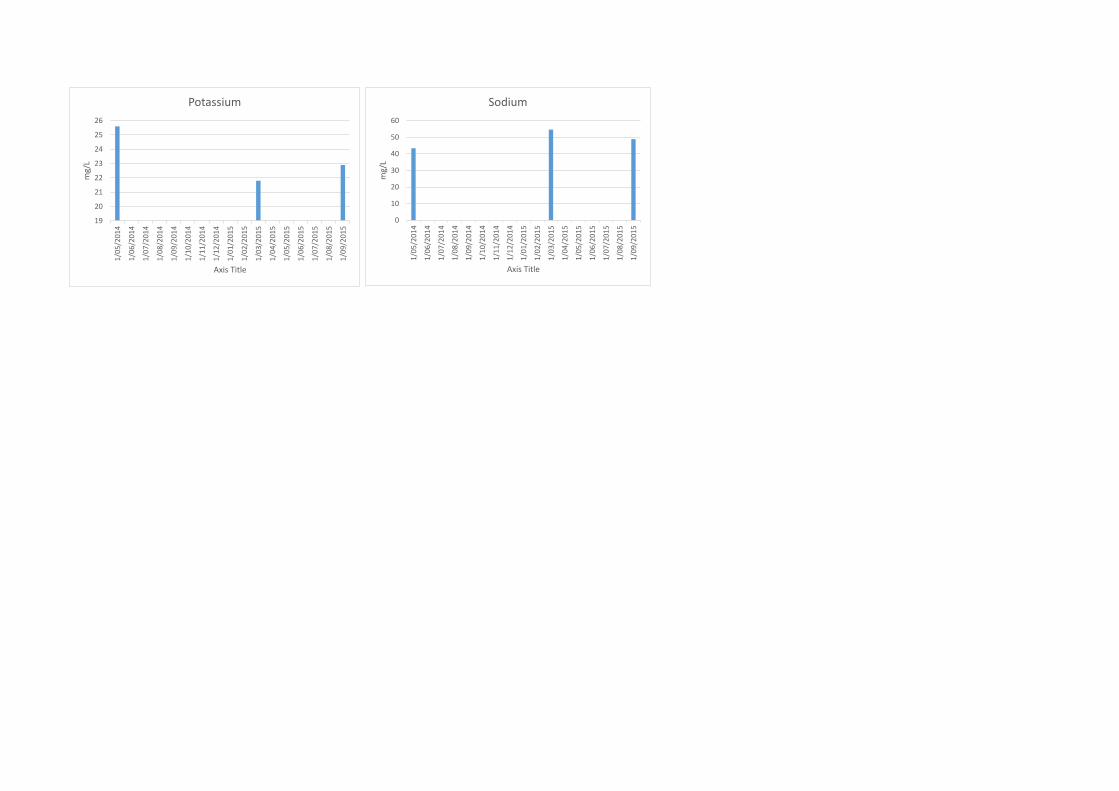
Point 7 Date
type test units 6/05
/201
4
11/0
3/20
15
22/0
9/20
15
quality monitoring ammonia mg/L <0.2 1.9 <0.2quality monitoring Ca mg/L 89.1 67.9 88.6quality monitoring EC μs/cm 1090 931 874quality monitoring Mg mg/L 56.5 61.5 64quality monitoring N( nitrate) mg/L <0.5 <1 <0.5quality monitoring N(total) mg/L 2 <2 2quality monitoring pH pH 7 7 7.3quality monitoring P mg/L 0.31 0.22 0.12quality monitoring K mg/L 25.6 21.8 22.9quality monitoring Na mg/L 43.4 54.6 48.9
00.20.40.60.8
11.21.41.61.8
2
1/05
/201
4
1/06
/201
4
1/07
/201
4
1/08
/201
4
1/09
/201
4
1/10
/201
4
1/11
/201
4
1/12
/201
4
1/01
/201
5
1/02
/201
5
1/03
/201
5
1/04
/201
5
1/05
/201
5
1/06
/201
5
1/07
/201
5
1/08
/201
5
1/09
/201
5
mg/
L
Date
Ammonia
0102030405060708090
100
1/05
/201
4
1/06
/201
4
1/07
/201
4
1/08
/201
4
1/09
/201
4
1/10
/201
4
1/11
/201
4
1/12
/201
4
1/01
/201
5
1/02
/201
5
1/03
/201
5
1/04
/201
5
1/05
/201
5
1/06
/201
5
1/07
/201
5
1/08
/201
5
1/09
/201
5
mg/
L
Date
Calcium
0
200
400
600
800
1000
1200
1/05
/201
4
1/06
/201
4
1/07
/201
4
1/08
/201
4
1/09
/201
4
1/10
/201
4
1/11
/201
4
1/12
/201
4
1/01
/201
5
1/02
/201
5
1/03
/201
5
1/04
/201
5
1/05
/201
5
1/06
/201
5
1/07
/201
5
1/08
/201
5
1/09
/201
5
μs/c
m
Date
Conductivity
52
54
56
58
60
62
64
66
1/05
/201
4
1/06
/201
4
1/07
/201
4
1/08
/201
4
1/09
/201
4
1/10
/201
4
1/11
/201
4
1/12
/201
4
1/01
/201
5
1/02
/201
5
1/03
/201
5
1/04
/201
5
1/05
/201
5
1/06
/201
5
1/07
/201
5
1/08
/201
5
1/09
/201
5
mg/
L
Axis Title
Magnesium
23456789
10
1/05
/201
4
1/06
/201
4
1/07
/201
4
1/08
/201
4
1/09
/201
4
1/10
/201
4
1/11
/201
4
1/12
/201
4
1/01
/201
5
1/02
/201
5
1/03
/201
5
1/04
/201
5
1/05
/201
5
1/06
/201
5
1/07
/201
5
1/08
/201
5
1/09
/201
5
Date
pH
0
0.05
0.1
0.15
0.2
0.25
0.3
0.35
1/05
/201
4
1/06
/201
4
1/07
/201
4
1/08
/201
4
1/09
/201
4
1/10
/201
4
1/11
/201
4
1/12
/201
4
1/01
/201
5
1/02
/201
5
1/03
/201
5
1/04
/201
5
1/05
/201
5
1/06
/201
5
1/07
/201
5
1/08
/201
5
1/09
/201
5
mg/
LAxis Title
Phosphorous
19
20
21
22
23
24
25
261/
05/2
014
1/06
/201
4
1/07
/201
4
1/08
/201
4
1/09
/201
4
1/10
/201
4
1/11
/201
4
1/12
/201
4
1/01
/201
5
1/02
/201
5
1/03
/201
5
1/04
/201
5
1/05
/201
5
1/06
/201
5
1/07
/201
5
1/08
/201
5
1/09
/201
5
mg/
L
Axis Title
Potassium
0
10
20
30
40
50
60
1/05
/201
4
1/06
/201
4
1/07
/201
4
1/08
/201
4
1/09
/201
4
1/10
/201
4
1/11
/201
4
1/12
/201
4
1/01
/201
5
1/02
/201
5
1/03
/201
5
1/04
/201
5
1/05
/201
5
1/06
/201
5
1/07
/201
5
1/08
/201
5
1/09
/201
5
mg/
L
Axis Title
Sodium
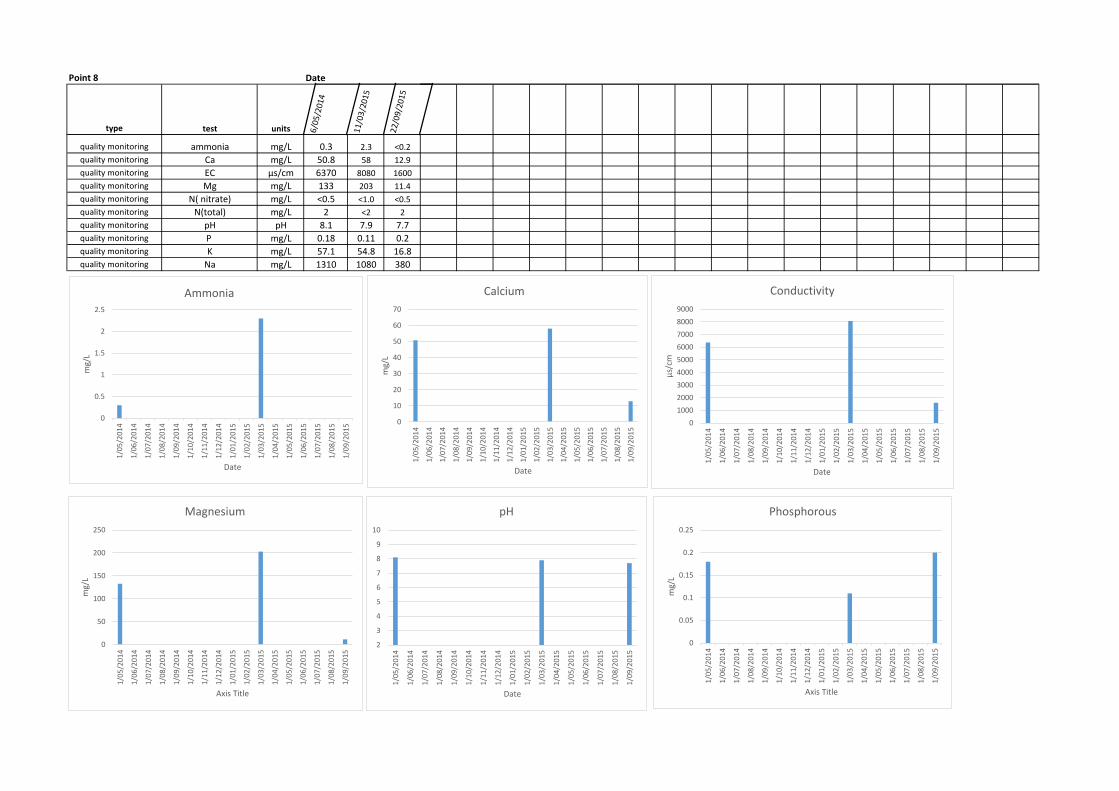
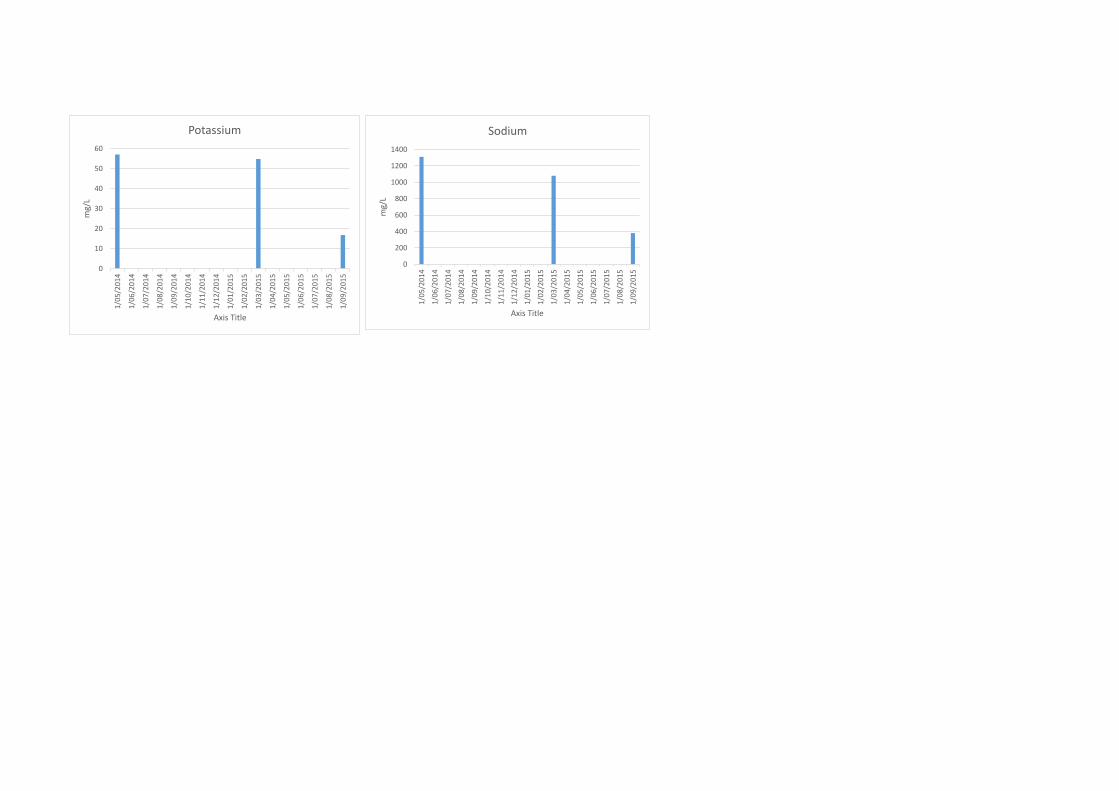
Point 8 Date
type test units 6/05
/201
4
11/0
3/20
15
22/0
9/20
15
quality monitoring ammonia mg/L 0.3 2.3 <0.2quality monitoring Ca mg/L 50.8 58 12.9quality monitoring EC μs/cm 6370 8080 1600quality monitoring Mg mg/L 133 203 11.4quality monitoring N( nitrate) mg/L <0.5 <1.0 <0.5quality monitoring N(total) mg/L 2 <2 2quality monitoring pH pH 8.1 7.9 7.7quality monitoring P mg/L 0.18 0.11 0.2quality monitoring K mg/L 57.1 54.8 16.8quality monitoring Na mg/L 1310 1080 380
0
0.5
1
1.5
2
2.5
1/05
/201
4
1/06
/201
4
1/07
/201
4
1/08
/201
4
1/09
/201
4
1/10
/201
4
1/11
/201
4
1/12
/201
4
1/01
/201
5
1/02
/201
5
1/03
/201
5
1/04
/201
5
1/05
/201
5
1/06
/201
5
1/07
/201
5
1/08
/201
5
1/09
/201
5
mg/
L
Date
Ammonia
0
10
20
30
40
50
60
70
1/05
/201
4
1/06
/201
4
1/07
/201
4
1/08
/201
4
1/09
/201
4
1/10
/201
4
1/11
/201
4
1/12
/201
4
1/01
/201
5
1/02
/201
5
1/03
/201
5
1/04
/201
5
1/05
/201
5
1/06
/201
5
1/07
/201
5
1/08
/201
5
1/09
/201
5
mg/
L
Date
Calcium
0100020003000400050006000700080009000
1/05
/201
4
1/06
/201
4
1/07
/201
4
1/08
/201
4
1/09
/201
4
1/10
/201
4
1/11
/201
4
1/12
/201
4
1/01
/201
5
1/02
/201
5
1/03
/201
5
1/04
/201
5
1/05
/201
5
1/06
/201
5
1/07
/201
5
1/08
/201
5
1/09
/201
5
μs/c
m
Date
Conductivity
0
50
100
150
200
250
1/05
/201
4
1/06
/201
4
1/07
/201
4
1/08
/201
4
1/09
/201
4
1/10
/201
4
1/11
/201
4
1/12
/201
4
1/01
/201
5
1/02
/201
5
1/03
/201
5
1/04
/201
5
1/05
/201
5
1/06
/201
5
1/07
/201
5
1/08
/201
5
1/09
/201
5
mg/
L
Axis Title
Magnesium
2
3
4
5
6
7
8
9
10
1/05
/201
4
1/06
/201
4
1/07
/201
4
1/08
/201
4
1/09
/201
4
1/10
/201
4
1/11
/201
4
1/12
/201
4
1/01
/201
5
1/02
/201
5
1/03
/201
5
1/04
/201
5
1/05
/201
5
1/06
/201
5
1/07
/201
5
1/08
/201
5
1/09
/201
5
Date
pH
0
0.05
0.1
0.15
0.2
0.25
1/05
/201
4
1/06
/201
4
1/07
/201
4
1/08
/201
4
1/09
/201
4
1/10
/201
4
1/11
/201
4
1/12
/201
4
1/01
/201
5
1/02
/201
5
1/03
/201
5
1/04
/201
5
1/05
/201
5
1/06
/201
5
1/07
/201
5
1/08
/201
5
1/09
/201
5
mg/
L
Axis Title
Phosphorous
0
10
20
30
40
50
60
1/05
/201
4
1/06
/201
4
1/07
/201
4
1/08
/201
4
1/09
/201
4
1/10
/201
4
1/11
/201
4
1/12
/201
4
1/01
/201
5
1/02
/201
5
1/03
/201
5
1/04
/201
5
1/05
/201
5
1/06
/201
5
1/07
/201
5
1/08
/201
5
1/09
/201
5
mg/
L
Axis Title
Potassium
0
200
400
600
800
1000
1200
1400
1/05
/201
4
1/06
/201
4
1/07
/201
4
1/08
/201
4
1/09
/201
4
1/10
/201
4
1/11
/201
4
1/12
/201
4
1/01
/201
5
1/02
/201
5
1/03
/201
5
1/04
/201
5
1/05
/201
5
1/06
/201
5
1/07
/201
5
1/08
/201
5
1/09
/201
5
mg/
L
Axis Title
Sodium
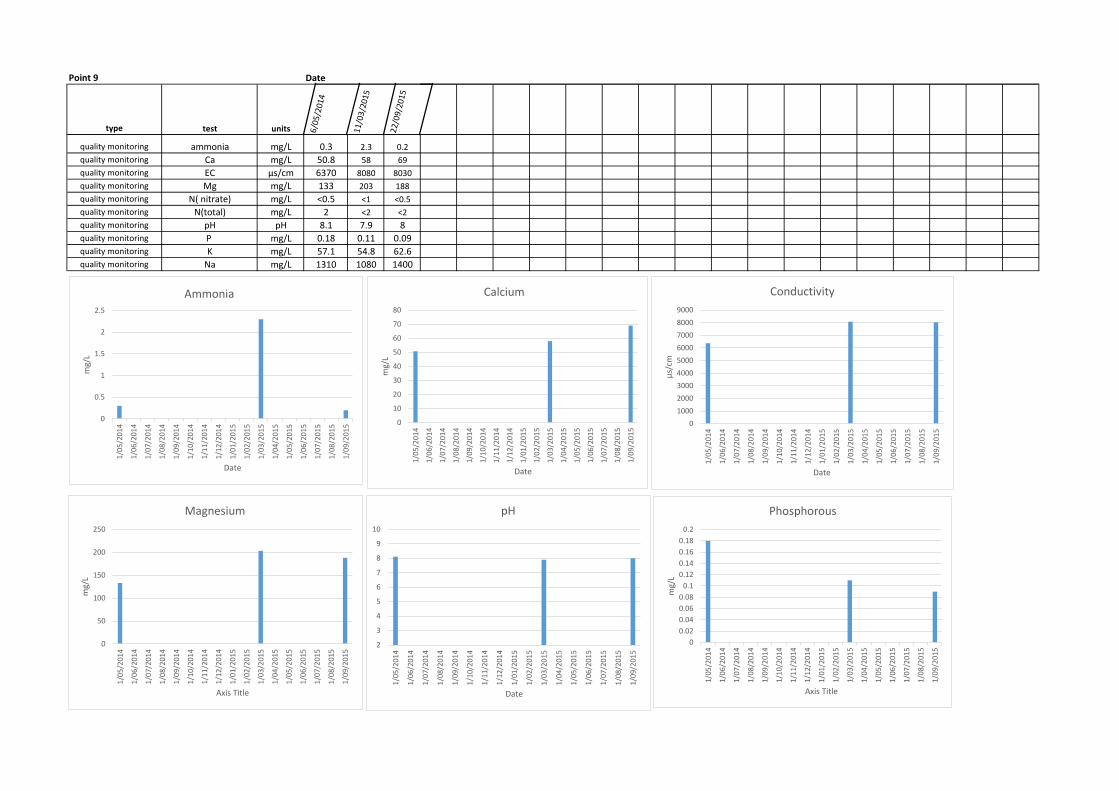
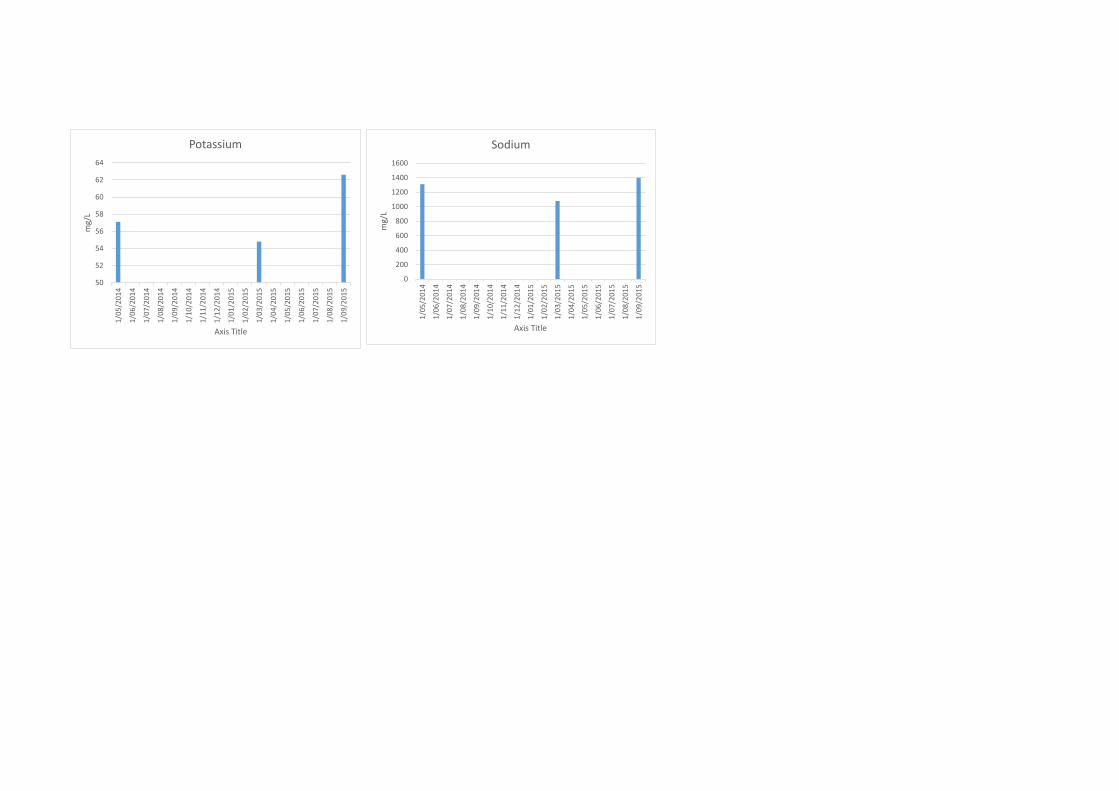
Point 9 Date
type test units 6/05
/201
4
11/0
3/20
15
22/0
9/20
15
quality monitoring ammonia mg/L 0.3 2.3 0.2quality monitoring Ca mg/L 50.8 58 69quality monitoring EC μs/cm 6370 8080 8030quality monitoring Mg mg/L 133 203 188quality monitoring N( nitrate) mg/L <0.5 <1 <0.5quality monitoring N(total) mg/L 2 <2 <2quality monitoring pH pH 8.1 7.9 8quality monitoring P mg/L 0.18 0.11 0.09quality monitoring K mg/L 57.1 54.8 62.6quality monitoring Na mg/L 1310 1080 1400
0
0.5
1
1.5
2
2.5
1/05
/201
4
1/06
/201
4
1/07
/201
4
1/08
/201
4
1/09
/201
4
1/10
/201
4
1/11
/201
4
1/12
/201
4
1/01
/201
5
1/02
/201
5
1/03
/201
5
1/04
/201
5
1/05
/201
5
1/06
/201
5
1/07
/201
5
1/08
/201
5
1/09
/201
5
mg/
L
Date
Ammonia
0
10
20
30
40
50
60
70
80
1/05
/201
4
1/06
/201
4
1/07
/201
4
1/08
/201
4
1/09
/201
4
1/10
/201
4
1/11
/201
4
1/12
/201
4
1/01
/201
5
1/02
/201
5
1/03
/201
5
1/04
/201
5
1/05
/201
5
1/06
/201
5
1/07
/201
5
1/08
/201
5
1/09
/201
5
mg/
L
Date
Calcium
0100020003000400050006000700080009000
1/05
/201
4
1/06
/201
4
1/07
/201
4
1/08
/201
4
1/09
/201
4
1/10
/201
4
1/11
/201
4
1/12
/201
4
1/01
/201
5
1/02
/201
5
1/03
/201
5
1/04
/201
5
1/05
/201
5
1/06
/201
5
1/07
/201
5
1/08
/201
5
1/09
/201
5
μs/c
m
Date
Conductivity
0
50
100
150
200
250
1/05
/201
4
1/06
/201
4
1/07
/201
4
1/08
/201
4
1/09
/201
4
1/10
/201
4
1/11
/201
4
1/12
/201
4
1/01
/201
5
1/02
/201
5
1/03
/201
5
1/04
/201
5
1/05
/201
5
1/06
/201
5
1/07
/201
5
1/08
/201
5
1/09
/201
5
mg/
L
Axis Title
Magnesium
2
3
4
5
6
7
8
9
10
1/05
/201
4
1/06
/201
4
1/07
/201
4
1/08
/201
4
1/09
/201
4
1/10
/201
4
1/11
/201
4
1/12
/201
4
1/01
/201
5
1/02
/201
5
1/03
/201
5
1/04
/201
5
1/05
/201
5
1/06
/201
5
1/07
/201
5
1/08
/201
5
1/09
/201
5
Date
pH
00.020.040.060.08
0.10.120.140.160.18
0.2
1/05
/201
4
1/06
/201
4
1/07
/201
4
1/08
/201
4
1/09
/201
4
1/10
/201
4
1/11
/201
4
1/12
/201
4
1/01
/201
5
1/02
/201
5
1/03
/201
5
1/04
/201
5
1/05
/201
5
1/06
/201
5
1/07
/201
5
1/08
/201
5
1/09
/201
5
mg/
L
Axis Title
Phosphorous
50
52
54
56
58
60
62
64
1/05
/201
4
1/06
/201
4
1/07
/201
4
1/08
/201
4
1/09
/201
4
1/10
/201
4
1/11
/201
4
1/12
/201
4
1/01
/201
5
1/02
/201
5
1/03
/201
5
1/04
/201
5
1/05
/201
5
1/06
/201
5
1/07
/201
5
1/08
/201
5
1/09
/201
5
mg/
L
Axis Title
Potassium
0
200
400
600
800
1000
1200
1400
1600
1/05
/201
4
1/06
/201
4
1/07
/201
4
1/08
/201
4
1/09
/201
4
1/10
/201
4
1/11
/201
4
1/12
/201
4
1/01
/201
5
1/02
/201
5
1/03
/201
5
1/04
/201
5
1/05
/201
5
1/06
/201
5
1/07
/201
5
1/08
/201
5
1/09
/201
5
mg/
L
Axis Title
Sodium
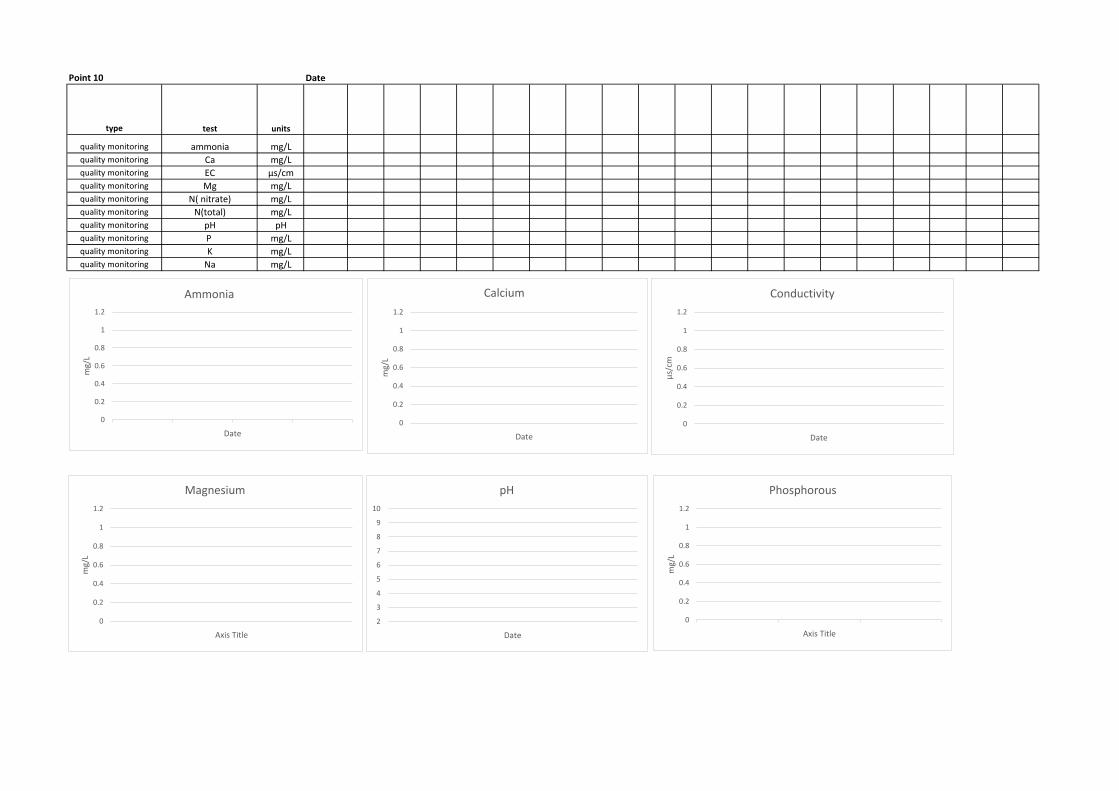
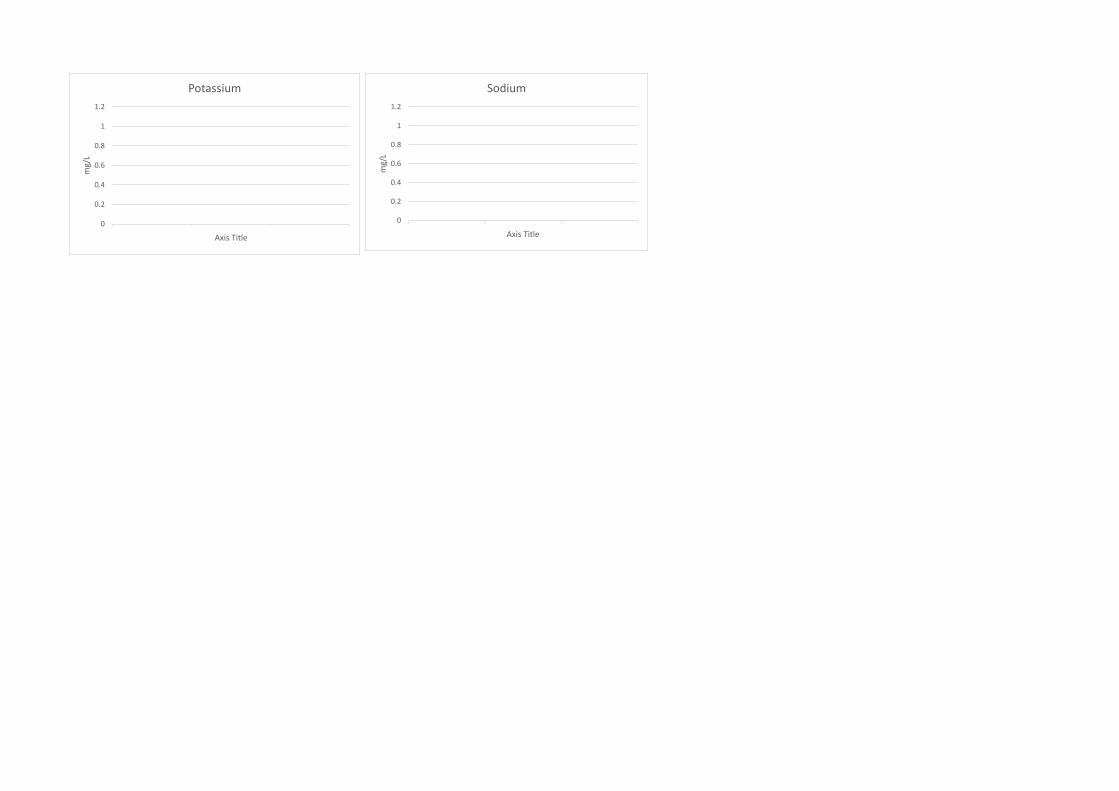
Point 10 Date
type test units
quality monitoring ammonia mg/Lquality monitoring Ca mg/Lquality monitoring EC μs/cmquality monitoring Mg mg/Lquality monitoring N( nitrate) mg/Lquality monitoring N(total) mg/Lquality monitoring pH pHquality monitoring P mg/Lquality monitoring K mg/Lquality monitoring Na mg/L
0
0.2
0.4
0.6
0.8
1
1.2
mg/
L
Date
Ammonia
0
0.2
0.4
0.6
0.8
1
1.2
mg/
L
Date
Calcium
0
0.2
0.4
0.6
0.8
1
1.2
μs/c
m
Date
Conductivity
0
0.2
0.4
0.6
0.8
1
1.2
mg/
L
Axis Title
Magnesium
2
3
4
5
6
7
8
9
10
Date
pH
0
0.2
0.4
0.6
0.8
1
1.2
mg/
L
Axis Title
Phosphorous
0
0.2
0.4
0.6
0.8
1
1.2
mg/
L
Axis Title
Potassium
0
0.2
0.4
0.6
0.8
1
1.2
mg/
L
Axis Title
Sodium
Type of Monitoring Point How Monitored Location Description Frequency
Type of Monitoring Point How Monitored Location Description Frequency
Type of Monitoring Point How Monitored Location Description Frequency
Type of Monitoring Point How Monitored Location Description Frequency
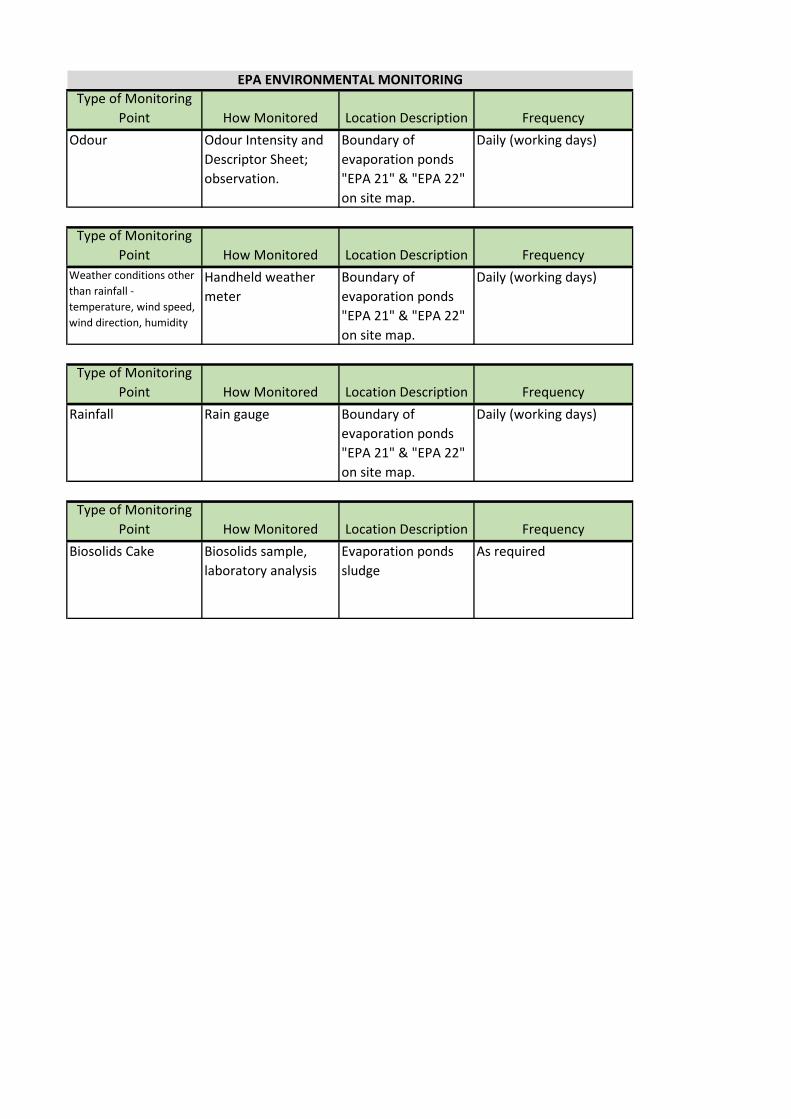
EPA ENVIRONMENTAL MONITORING
Odour Odour Intensity and Descriptor Sheet; observation.
Boundary of evaporation ponds "EPA 21" & "EPA 22" on site map.
Daily (working days)
Biosolids Cake Biosolids sample, laboratory analysis
Evaporation ponds sludge
As required
Weather conditions other than rainfall - temperature, wind speed, wind direction, humidity
Handheld weather meter
Boundary of evaporation ponds "EPA 21" & "EPA 22" on site map.
Daily (working days)
Rainfall Rain gauge Boundary of evaporation ponds "EPA 21" & "EPA 22" on site map.
Daily (working days)
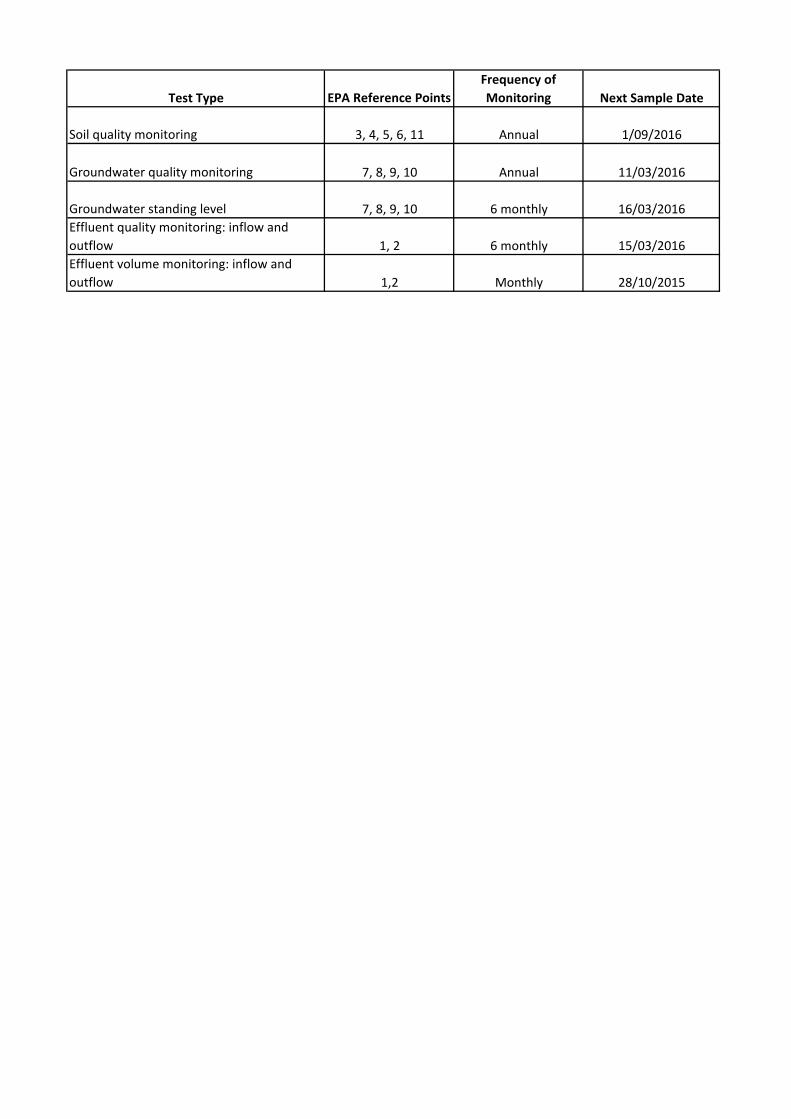
Test Type EPA Reference PointsFrequency of Monitoring Next Sample Date
Soil quality monitoring 3, 4, 5, 6, 11 Annual 1/09/2016
Groundwater quality monitoring 7, 8, 9, 10 Annual 11/03/2016
Groundwater standing level 7, 8, 9, 10 6 monthly 16/03/2016Effluent quality monitoring: inflow and outflow 1, 2 6 monthly 15/03/2016Effluent volume monitoring: inflow and outflow 1,2 Monthly 28/10/2015