Electronic Supplementary Information (ESI) · After cutting into 8 μm-sections using CM1850...
18
S-1 Electronic Supplementary Information (ESI) Ultra-pH-responsive split i-motif based aptamer anchoring strategy for specific activatable imaging of acidic tumor microenvironment Yanli Lei, Xiaoxiao He, Jinlu Tang, Hui Shi,* Dinggeng He, Lv’an Yan, Jianbo Liu, Yu Zeng and Kemin Wang* State Key Laboratory of Chemo/Biosensing and Chemometrics, College of Biology, College of Chemistry and Chemical Engineering, Hunan University, Key Laboratory for Bio-Nanotechnology and Molecular Engineering of Hunan Province, Changsha 410082, China * Corresponding authors. Email: [email protected]; [email protected]. Contents Experimental Section ...…………………………..……..………...…………..….....….....…......... S-2 Supporting Table ...…………………………..……..………..………….………….….....….....…. S-5 Supporting Figures ………………………………..………..…..……....…………...….....….....… S-6 Electronic Supplementary Material (ESI) for ChemComm. This journal is © The Royal Society of Chemistry 2018
Transcript of Electronic Supplementary Information (ESI) · After cutting into 8 μm-sections using CM1850...
S-1
Electronic Supplementary Information (ESI)
Ultra-pH-responsive split i-motif based aptamer anchoring strategy
for specific activatable imaging of acidic tumor microenvironment
Yanli Lei, Xiaoxiao He, Jinlu Tang, Hui Shi,* Dinggeng He, Lv’an Yan, Jianbo Liu, Yu Zeng and
Kemin Wang*
State Key Laboratory of Chemo/Biosensing and Chemometrics, College of Biology, College of
Chemistry and Chemical Engineering, Hunan University, Key Laboratory for Bio-Nanotechnology and
Molecular Engineering of Hunan Province, Changsha 410082, China
* Corresponding authors. Email: [email protected]; [email protected].
Contents
Experimental Section ...…………………………..……..………...…………..….....….....…......... S-2
Supporting Table ...…………………………..……..………..………….………….….....….....…. S-5
Supporting Figures ………………………………..………..…..……....…………...….....….....… S-6
Electronic Supplementary Material (ESI) for ChemComm.This journal is © The Royal Society of Chemistry 2018
S-2
Experimental Section
Chemicals and Materials. All the DNA probes used in this study were custom-designed and then
synthesized by Sangon Biotechnology Co. Ltd. (China). Before use, the DNA probes were purified
with high performance liquid chromatography (HPLC) and further identified using mass spectrometry,
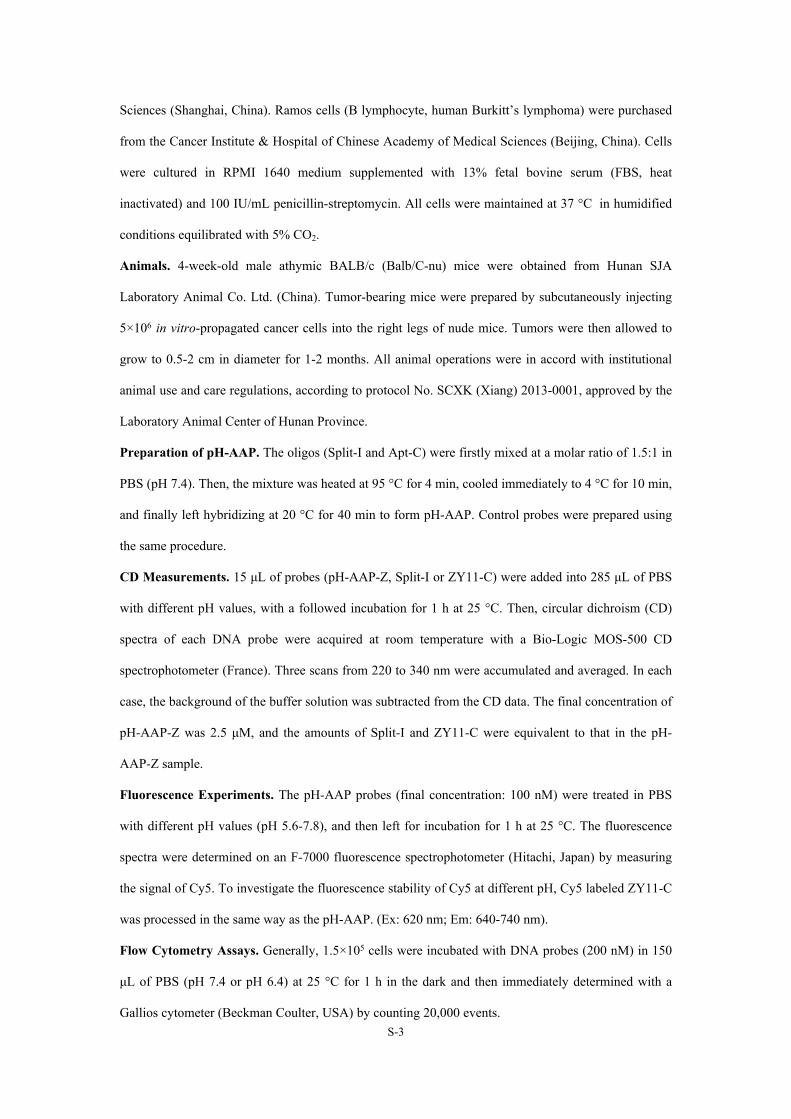
by Sangon Biotechnology Co. Ltd. (China). Sequences of the oligos are listed in Table S1. The
modification strategies of Cy5 fluorophore (A) and BHQ2 quencher (B) to DNA strands are as follows:
Cell medium RPMI 1640 was obtained from Thermo Fisher Scientific (MA, U.S.A). Optimal
Cutting Temperature Compound (OCT) was obtained from SAKURA (Torrance, U.S.A). All other
reagents were of the highest grade available and obtained from Sinopharm Chemical Reagent Co. Ltd.
(Shanghai, China). Deionized water was produced by the Milli-Q ultrapure water system. A stock
phosphate buffer (0.1 M PB) with different pH value was prepared by mixing 100 mM Na2HPO4 and
100 mM NaH2PO4 in a proper ratio. Phosphate buffered saline (0.01 M PBS) was obtained from the
corresponding PB by ten-fold dilution, and then added with 130 mM NaCl, 4.6 mM KCl and 5 mM
MgCl2. The pH of each buffer was calibrated with a Thermo Scientific Orion 3 Star pH-meter (MA,
U.S.A).
Cells. SMMC-7721 cells (human hepatoma cell line), HeLa cells (human cervical cancer cell line) and
CCRF-CEM cells (T lymphoblast, human acute lymphoblastic leukemia) used in this study were
obtained from the Cell Bank of the Committee on Type Culture Collection of the Chinese Academy of
S-3
Sciences (Shanghai, China). Ramos cells (B lymphocyte, human Burkitt’s lymphoma) were purchased
from the Cancer Institute & Hospital of Chinese Academy of Medical Sciences (Beijing, China). Cells
were cultured in RPMI 1640 medium supplemented with 13% fetal bovine serum (FBS, heat
inactivated) and 100 IU/mL penicillin-streptomycin. All cells were maintained at 37 °C in humidified
conditions equilibrated with 5% CO2.
Animals. 4-week-old male athymic BALB/c (Balb/C-nu) mice were obtained from Hunan SJA
Laboratory Animal Co. Ltd. (China). Tumor-bearing mice were prepared by subcutaneously injecting
5×10⁶ in vitro-propagated cancer cells into the right legs of nude mice. Tumors were then allowed to
grow to 0.5-2 cm in diameter for 1-2 months. All animal operations were in accord with institutional
animal use and care regulations, according to protocol No. SCXK (Xiang) 2013-0001, approved by the
Laboratory Animal Center of Hunan Province.
Preparation of pH-AAP. The oligos (Split-I and Apt-C) were firstly mixed at a molar ratio of 1.5:1 in
PBS (pH 7.4). Then, the mixture was heated at 95 °C for 4 min, cooled immediately to 4 °C for 10 min,
and finally left hybridizing at 20 °C for 40 min to form pH-AAP. Control probes were prepared using
the same procedure.
CD Measurements. 15 μL of probes (pH-AAP-Z, Split-I or ZY11-C) were added into 285 μL of PBS
with different pH values, with a followed incubation for 1 h at 25 °C. Then, circular dichroism (CD)
spectra of each DNA probe were acquired at room temperature with a Bio-Logic MOS-500 CD
spectrophotometer (France). Three scans from 220 to 340 nm were accumulated and averaged. In each
case, the background of the buffer solution was subtracted from the CD data. The final concentration of
pH-AAP-Z was 2.5 μM, and the amounts of Split-I and ZY11-C were equivalent to that in the pH-
AAP-Z sample.
Fluorescence Experiments. The pH-AAP probes (final concentration: 100 nM) were treated in PBS
with different pH values (pH 5.6-7.8), and then left for incubation for 1 h at 25 °C. The fluorescence
spectra were determined on an F-7000 fluorescence spectrophotometer (Hitachi, Japan) by measuring
the signal of Cy5. To investigate the fluorescence stability of Cy5 at different pH, Cy5 labeled ZY11-C
was processed in the same way as the pH-AAP. (Ex: 620 nm; Em: 640-740 nm).
Flow Cytometry Assays. Generally, 1.5×10⁵ cells were incubated with DNA probes (200 nM) in 150
μL of PBS (pH 7.4 or pH 6.4) at 25 °C for 1 h in the dark and then immediately determined with a
Gallios cytometer (Beckman Coulter, USA) by counting 20,000 events.
S-4
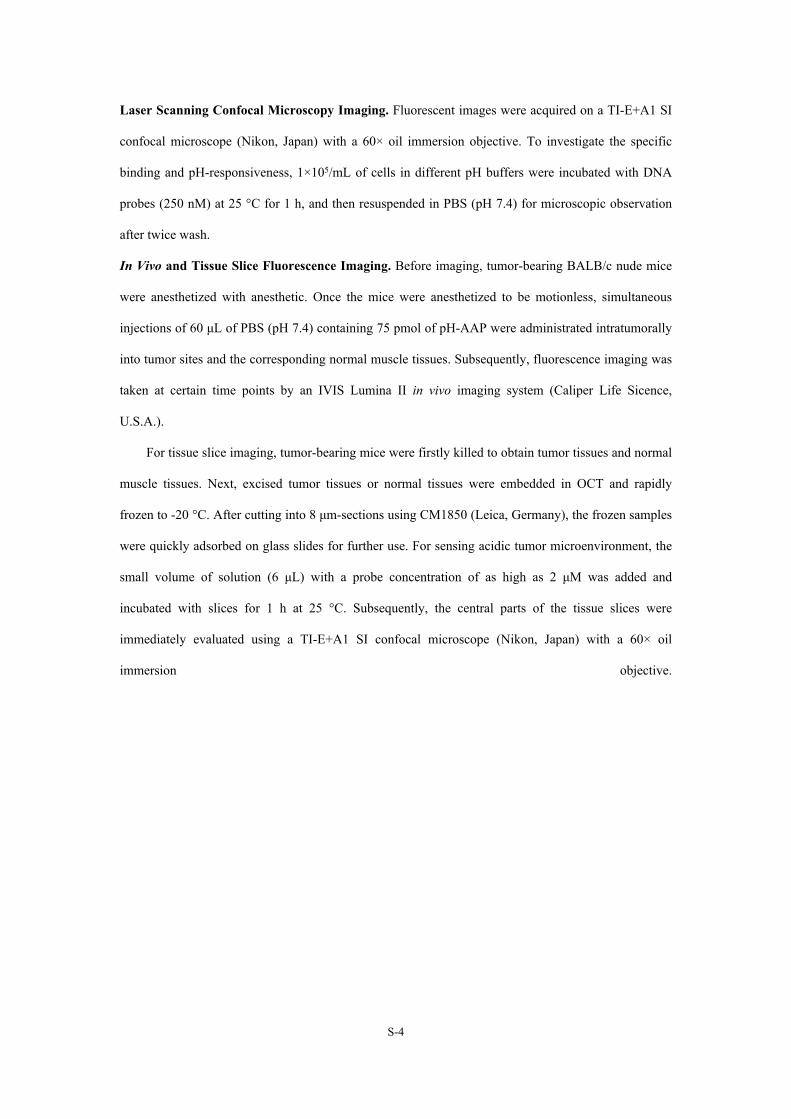
Laser Scanning Confocal Microscopy Imaging. Fluorescent images were acquired on a TI-E+A1 SI
confocal microscope (Nikon, Japan) with a 60× oil immersion objective. To investigate the specific
binding and pH-responsiveness, 1×10⁵/mL of cells in different pH buffers were incubated with DNA
probes (250 nM) at 25 °C for 1 h, and then resuspended in PBS (pH 7.4) for microscopic observation
after twice wash.
In Vivo and Tissue Slice Fluorescence Imaging. Before imaging, tumor-bearing BALB/c nude mice
were anesthetized with anesthetic. Once the mice were anesthetized to be motionless, simultaneous
injections of 60 μL of PBS (pH 7.4) containing 75 pmol of pH-AAP were administrated intratumorally
into tumor sites and the corresponding normal muscle tissues. Subsequently, fluorescence imaging was
taken at certain time points by an IVIS Lumina II in vivo imaging system (Caliper Life Sicence,
U.S.A.).
For tissue slice imaging, tumor-bearing mice were firstly killed to obtain tumor tissues and normal
muscle tissues. Next, excised tumor tissues or normal tissues were embedded in OCT and rapidly
frozen to -20 °C. After cutting into 8 μm-sections using CM1850 (Leica, Germany), the frozen samples
were quickly adsorbed on glass slides for further use. For sensing acidic tumor microenvironment, the
small volume of solution (6 μL) with a probe concentration of as high as 2 μM was added and
incubated with slices for 1 h at 25 °C. Subsequently, the central parts of the tissue slices were
immediately evaluated using a TI-E+A1 SI confocal microscope (Nikon, Japan) with a 60× oil
immersion objective.
S-5
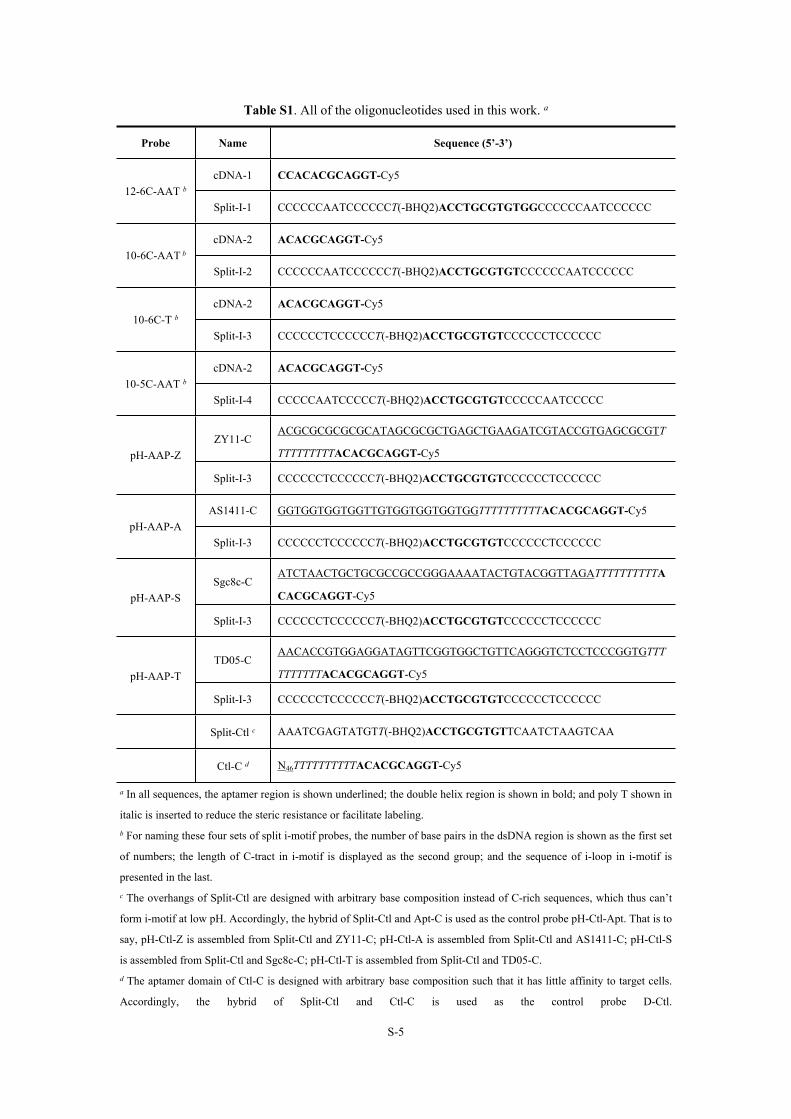
Table S1. All of the oligonucleotides used in this work. a
Probe Name Sequence (5’-3’)
cDNA-1 CCACACGCAGGT-Cy512-6C-AAT b
Split-I-1 CCCCCCAATCCCCCCT(-BHQ2)ACCTGCGTGTGGCCCCCCAATCCCCCC
cDNA-2 ACACGCAGGT-Cy510-6C-AAT b
Split-I-2 CCCCCCAATCCCCCCT(-BHQ2)ACCTGCGTGTCCCCCCAATCCCCCC
cDNA-2 ACACGCAGGT-Cy510-6C-T b
Split-I-3 CCCCCCTCCCCCCT(-BHQ2)ACCTGCGTGTCCCCCCTCCCCCC
cDNA-2 ACACGCAGGT-Cy510-5C-AAT b
Split-I-4 CCCCCAATCCCCCT(-BHQ2)ACCTGCGTGTCCCCCAATCCCCC
ZY11-CACGCGCGCGCGCATAGCGCGCTGAGCTGAAGATCGTACCGTGAGCGCGTT
TTTTTTTTTACACGCAGGT-Cy5pH-AAP-Z
Split-I-3 CCCCCCTCCCCCCT(-BHQ2)ACCTGCGTGTCCCCCCTCCCCCC
AS1411-C GGTGGTGGTGGTTGTGGTGGTGGTGGTTTTTTTTTTACACGCAGGT-Cy5pH-AAP-A
Split-I-3 CCCCCCTCCCCCCT(-BHQ2)ACCTGCGTGTCCCCCCTCCCCCC
Sgc8c-CATCTAACTGCTGCGCCGCCGGGAAAATACTGTACGGTTAGATTTTTTTTTTA
CACGCAGGT-Cy5pH-AAP-S
Split-I-3 CCCCCCTCCCCCCT(-BHQ2)ACCTGCGTGTCCCCCCTCCCCCC
TD05-CAACACCGTGGAGGATAGTTCGGTGGCTGTTCAGGGTCTCCTCCCGGTGTTT
TTTTTTTACACGCAGGT-Cy5pH-AAP-T
Split-I-3 CCCCCCTCCCCCCT(-BHQ2)ACCTGCGTGTCCCCCCTCCCCCC
Split-Ctl c AAATCGAGTATGTT(-BHQ2)ACCTGCGTGTTCAATCTAAGTCAA
Ctl-C d N46TTTTTTTTTTACACGCAGGT-Cy5
a In all sequences, the aptamer region is shown underlined; the double helix region is shown in bold; and poly T shown in
italic is inserted to reduce the steric resistance or facilitate labeling. b For naming these four sets of split i-motif probes, the number of base pairs in the dsDNA region is shown as the first set
of numbers; the length of C-tract in i-motif is displayed as the second group; and the sequence of i-loop in i-motif is
presented in the last. c The overhangs of Split-Ctl are designed with arbitrary base composition instead of C-rich sequences, which thus can’t
form i-motif at low pH. Accordingly, the hybrid of Split-Ctl and Apt-C is used as the control probe pH-Ctl-Apt. That is to
say, pH-Ctl-Z is assembled from Split-Ctl and ZY11-C; pH-Ctl-A is assembled from Split-Ctl and AS1411-C; pH-Ctl-S
is assembled from Split-Ctl and Sgc8c-C; pH-Ctl-T is assembled from Split-Ctl and TD05-C. d The aptamer domain of Ctl-C is designed with arbitrary base composition such that it has little affinity to target cells.
Accordingly, the hybrid of Split-Ctl and Ctl-C is used as the control probe D-Ctl.
S-6
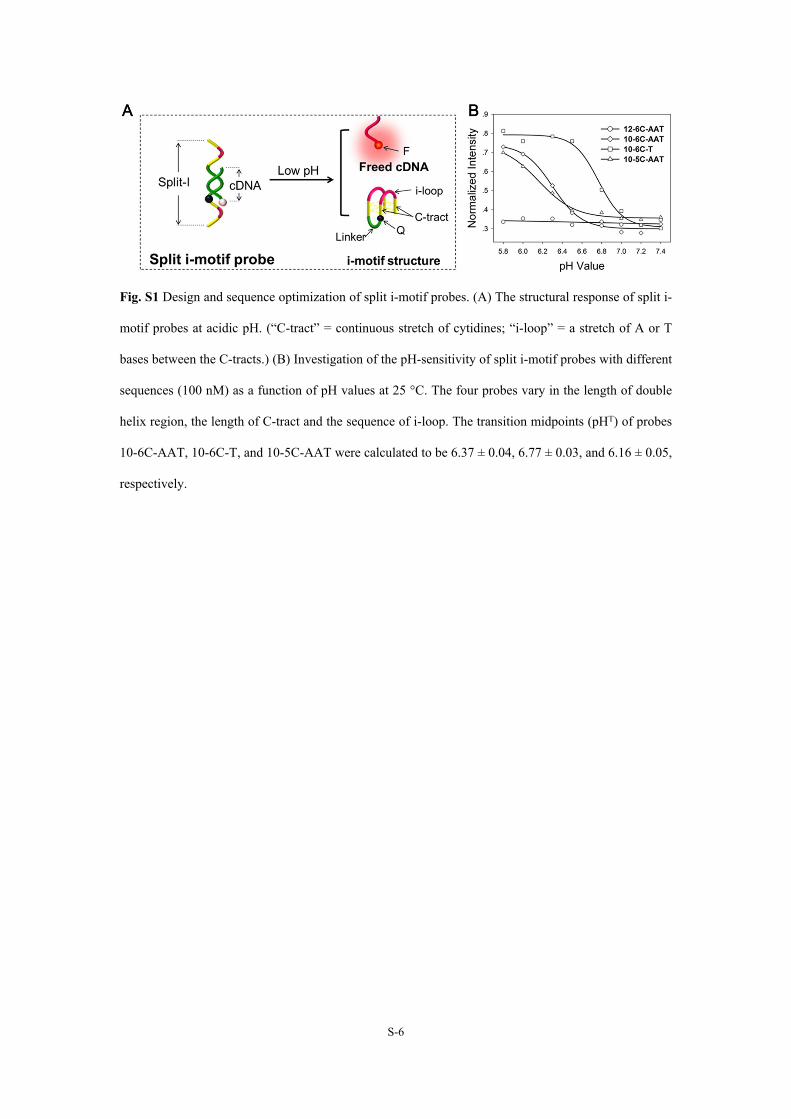
Fig. S1 Design and sequence optimization of split i-motif probes. (A) The structural response of split i-
motif probes at acidic pH. (“C-tract” = continuous stretch of cytidines; “i-loop” = a stretch of A or T
bases between the C-tracts.) (B) Investigation of the pH-sensitivity of split i-motif probes with different
sequences (100 nM) as a function of pH values at 25 °C. The four probes vary in the length of double
helix region, the length of C-tract and the sequence of i-loop. The transition midpoints (pHT) of probes
10-6C-AAT, 10-6C-T, and 10-5C-AAT were calculated to be 6.37 ± 0.04, 6.77 ± 0.03, and 6.16 ± 0.05,
respectively.
S-7
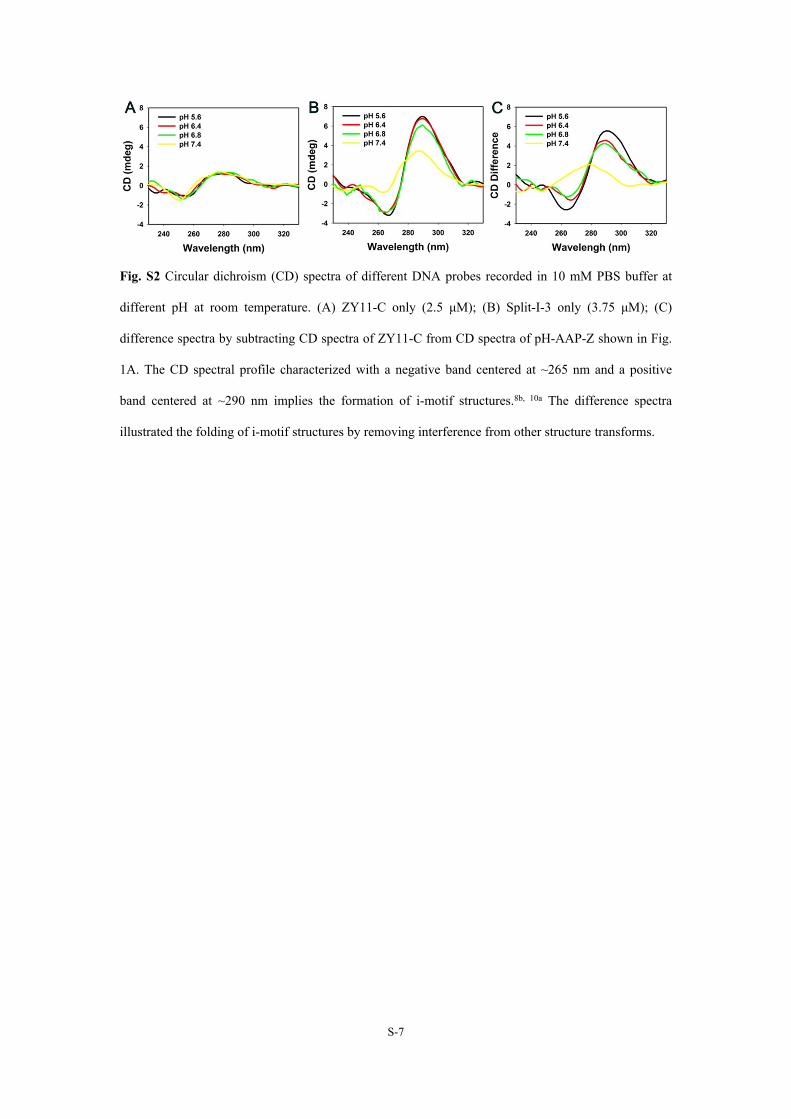
Fig. S2 Circular dichroism (CD) spectra of different DNA probes recorded in 10 mM PBS buffer at
different pH at room temperature. (A) ZY11-C only (2.5 μM); (B) Split-I-3 only (3.75 μM); (C)
difference spectra by subtracting CD spectra of ZY11-C from CD spectra of pH-AAP-Z shown in Fig.
1A. The CD spectral profile characterized with a negative band centered at ~265 nm and a positive
band centered at ~290 nm implies the formation of i-motif structures.8b, 10a The difference spectra
illustrated the folding of i-motif structures by removing interference from other structure transforms.
S-8
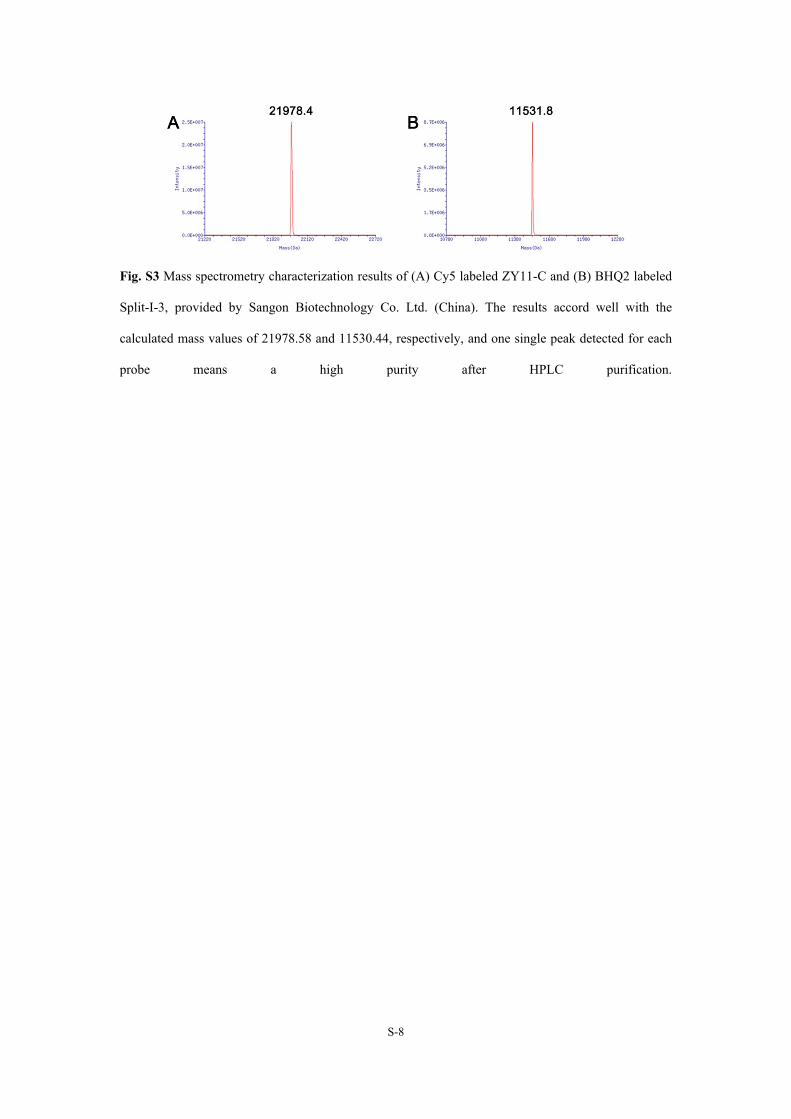
Fig. S3 Mass spectrometry characterization results of (A) Cy5 labeled ZY11-C and (B) BHQ2 labeled
Split-I-3, provided by Sangon Biotechnology Co. Ltd. (China). The results accord well with the
calculated mass values of 21978.58 and 11530.44, respectively, and one single peak detected for each
probe means a high purity after HPLC purification.
S-9
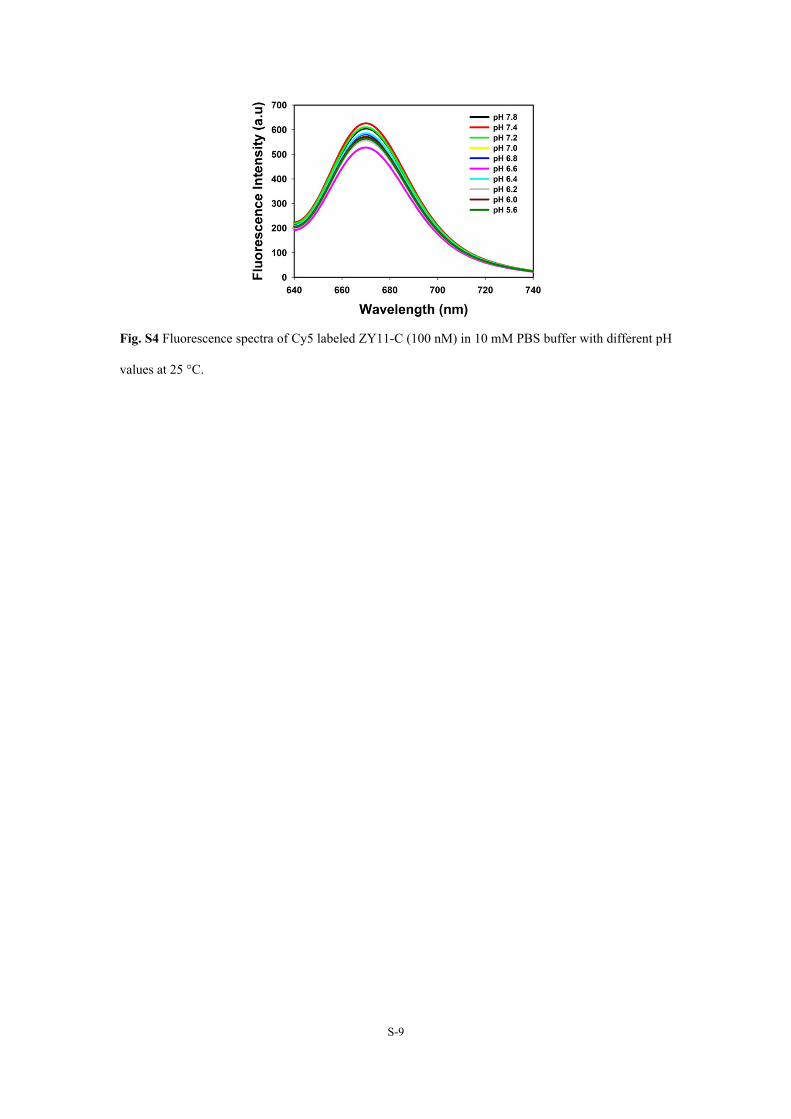
Fig. S4 Fluorescence spectra of Cy5 labeled ZY11-C (100 nM) in 10 mM PBS buffer with different pH
values at 25 °C.
S-10
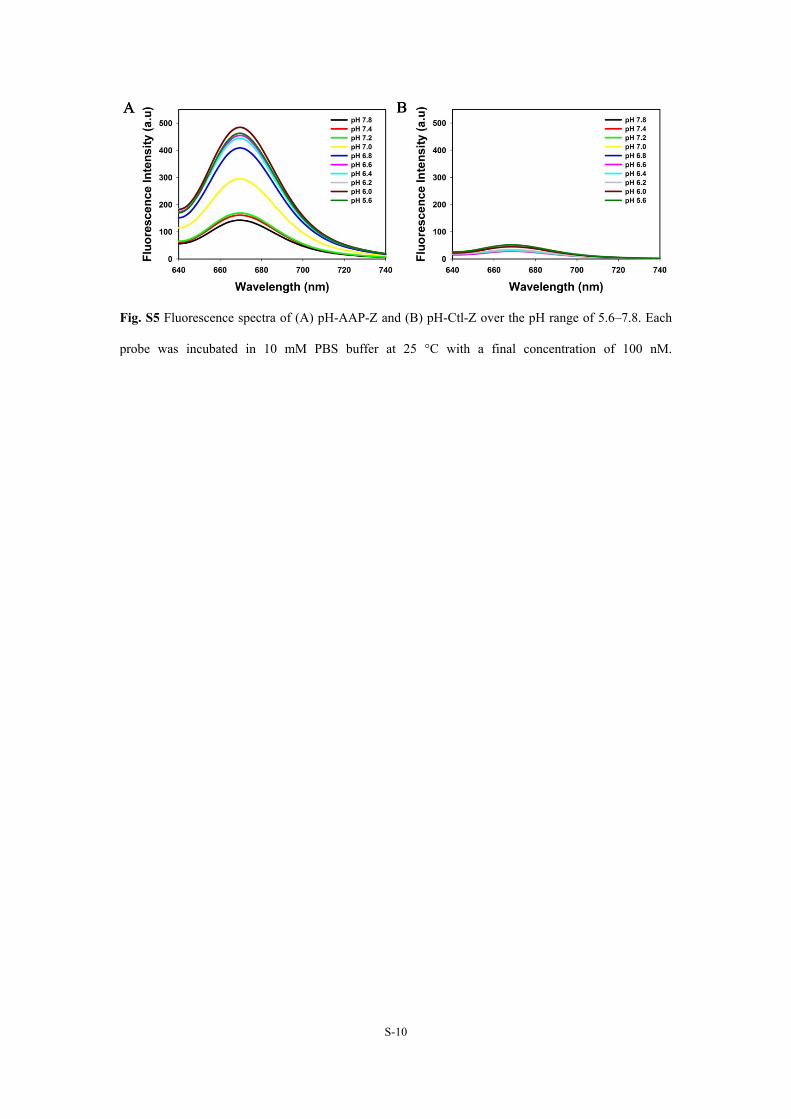
Fig. S5 Fluorescence spectra of (A) pH-AAP-Z and (B) pH-Ctl-Z over the pH range of 5.6–7.8. Each
probe was incubated in 10 mM PBS buffer at 25 °C with a final concentration of 100 nM.
S-11
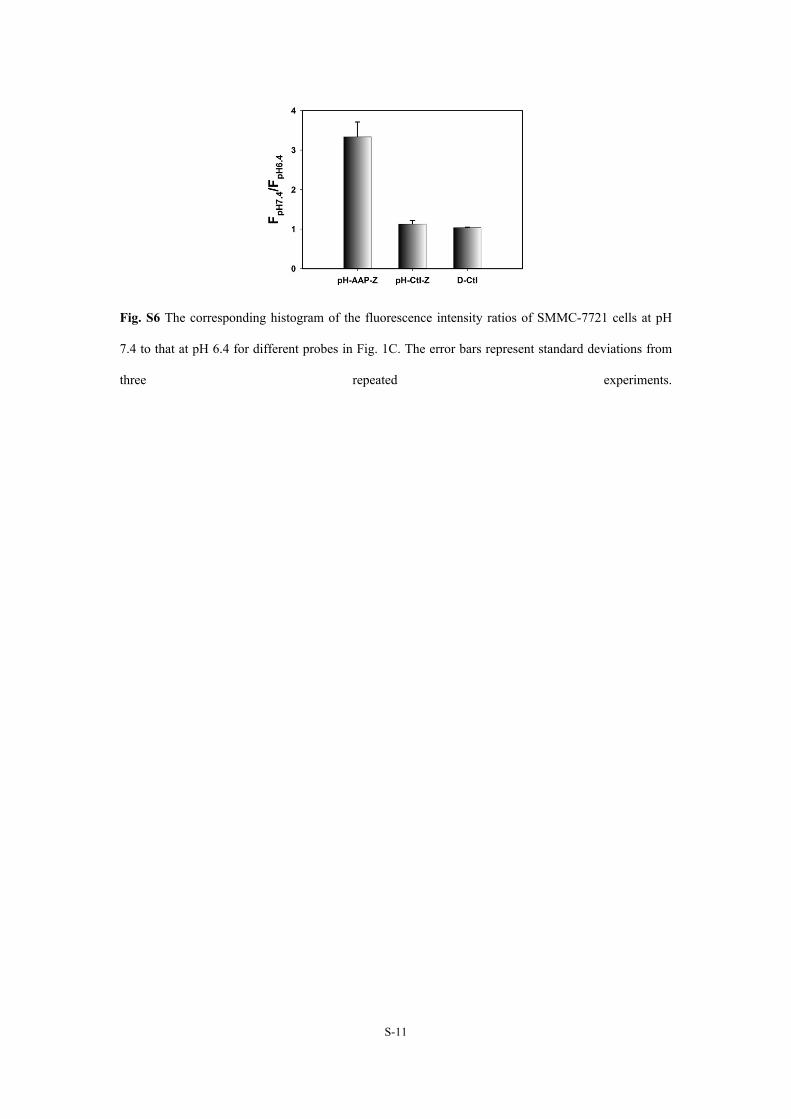
Fig. S6 The corresponding histogram of the fluorescence intensity ratios of SMMC-7721 cells at pH
7.4 to that at pH 6.4 for different probes in Fig. 1C. The error bars represent standard deviations from
three repeated experiments.
S-12
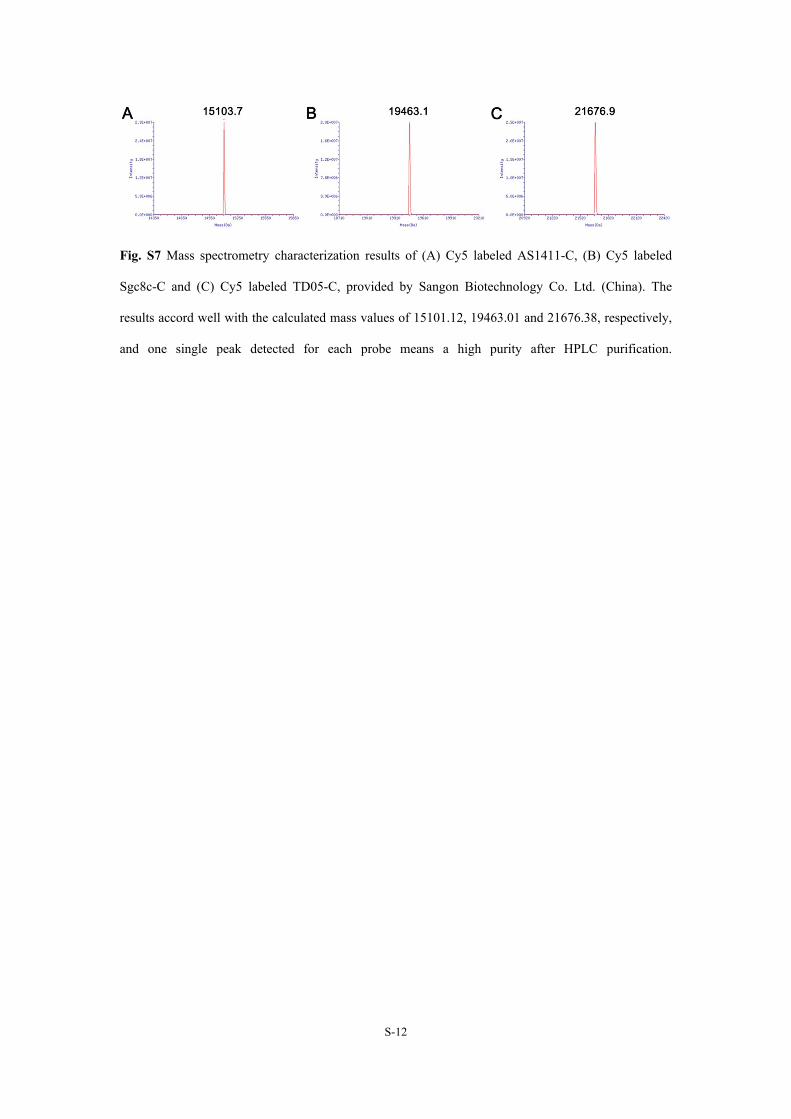
Fig. S7 Mass spectrometry characterization results of (A) Cy5 labeled AS1411-C, (B) Cy5 labeled
Sgc8c-C and (C) Cy5 labeled TD05-C, provided by Sangon Biotechnology Co. Ltd. (China). The
results accord well with the calculated mass values of 15101.12, 19463.01 and 21676.38, respectively,
and one single peak detected for each probe means a high purity after HPLC purification.
S-13
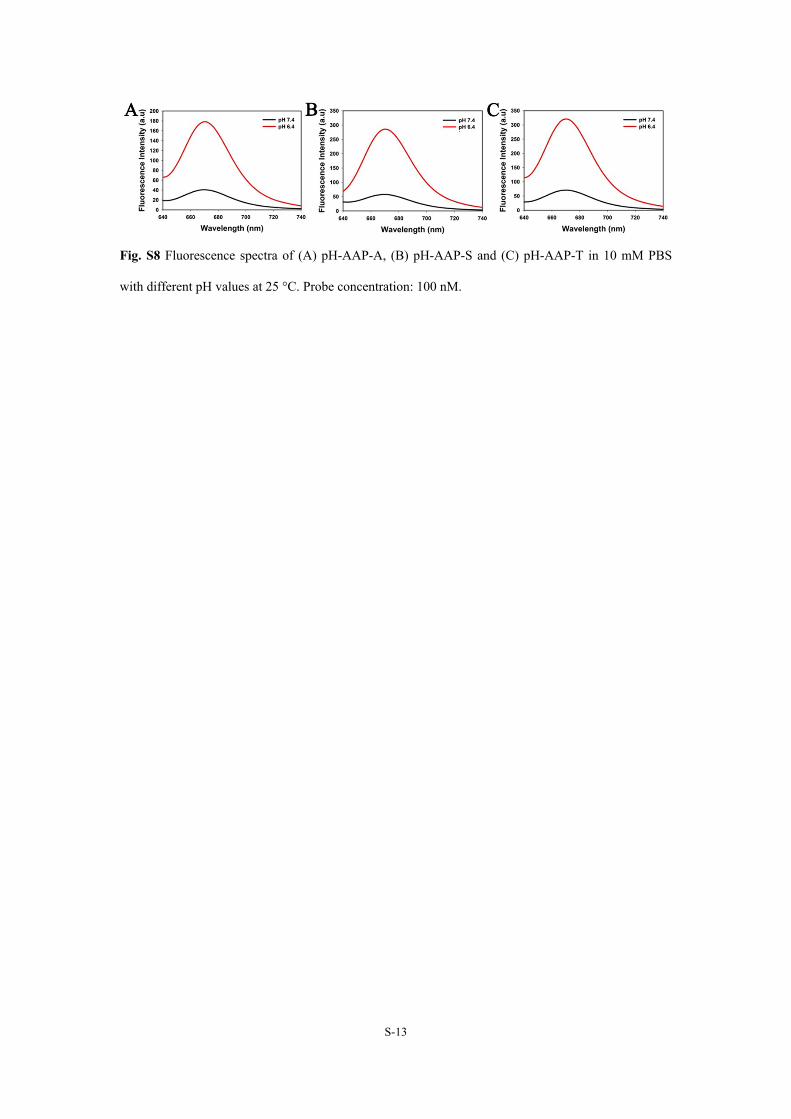
Fig. S8 Fluorescence spectra of (A) pH-AAP-A, (B) pH-AAP-S and (C) pH-AAP-T in 10 mM PBS
with different pH values at 25 °C. Probe concentration: 100 nM.
S-14
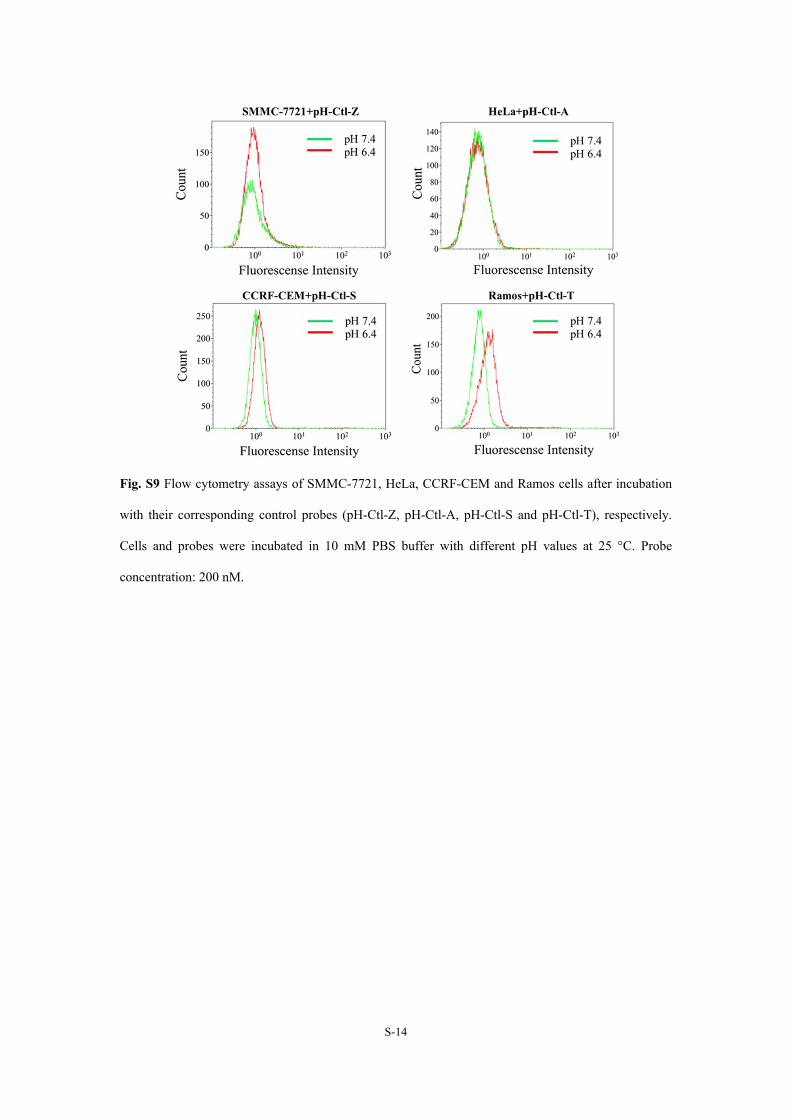
Fig. S9 Flow cytometry assays of SMMC-7721, HeLa, CCRF-CEM and Ramos cells after incubation
with their corresponding control probes (pH-Ctl-Z, pH-Ctl-A, pH-Ctl-S and pH-Ctl-T), respectively.
Cells and probes were incubated in 10 mM PBS buffer with different pH values at 25 °C. Probe
concentration: 200 nM.
S-15
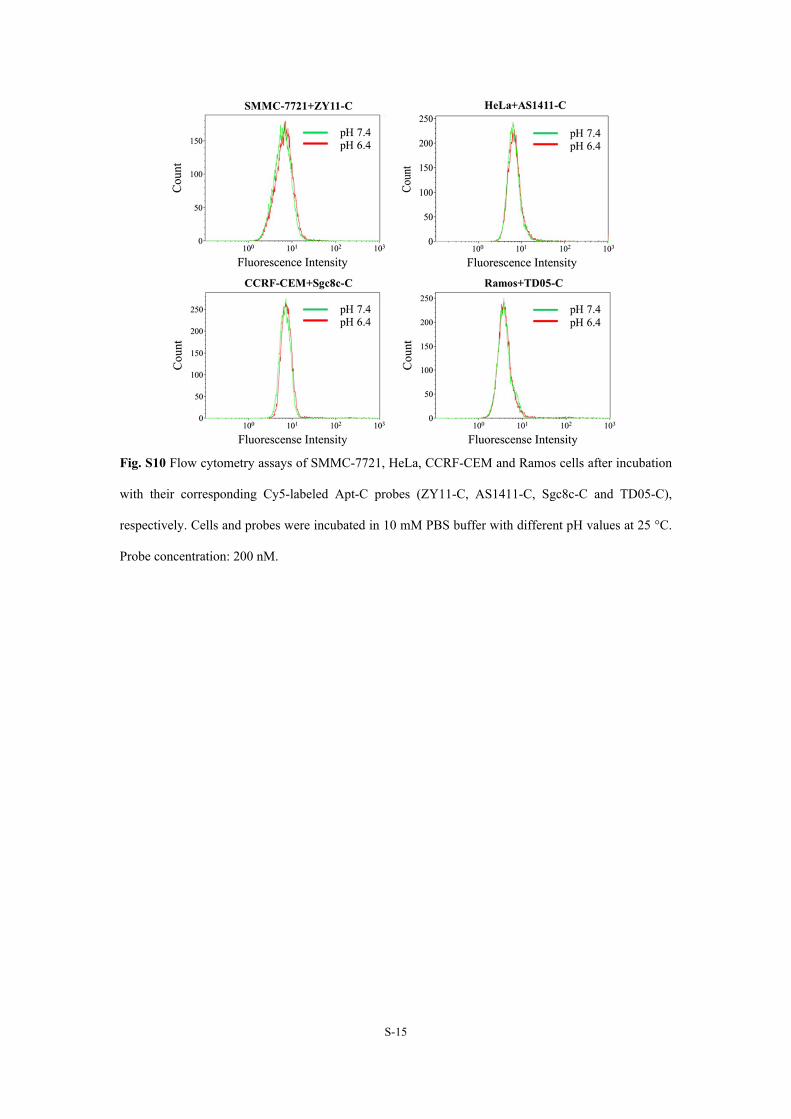
Fig. S10 Flow cytometry assays of SMMC-7721, HeLa, CCRF-CEM and Ramos cells after incubation
with their corresponding Cy5-labeled Apt-C probes (ZY11-C, AS1411-C, Sgc8c-C and TD05-C),
respectively. Cells and probes were incubated in 10 mM PBS buffer with different pH values at 25 °C.
Probe concentration: 200 nM.
S-16
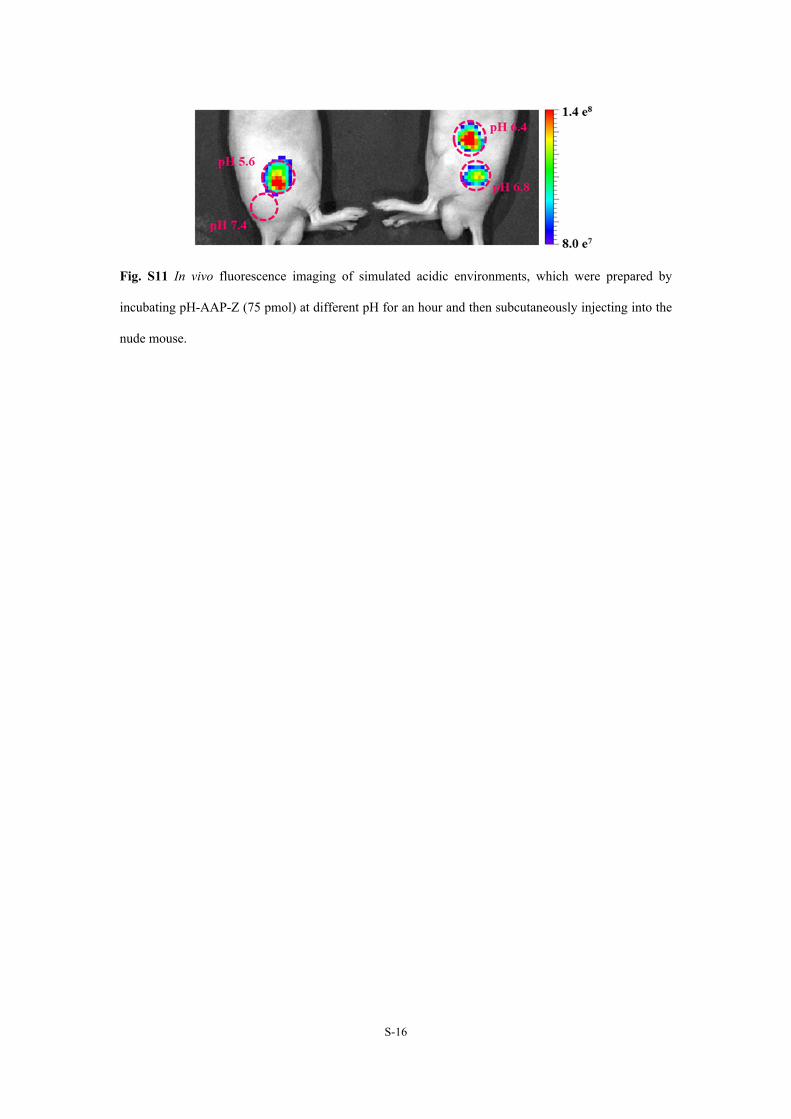
Fig. S11 In vivo fluorescence imaging of simulated acidic environments, which were prepared by
incubating pH-AAP-Z (75 pmol) at different pH for an hour and then subcutaneously injecting into the
nude mouse.
S-17
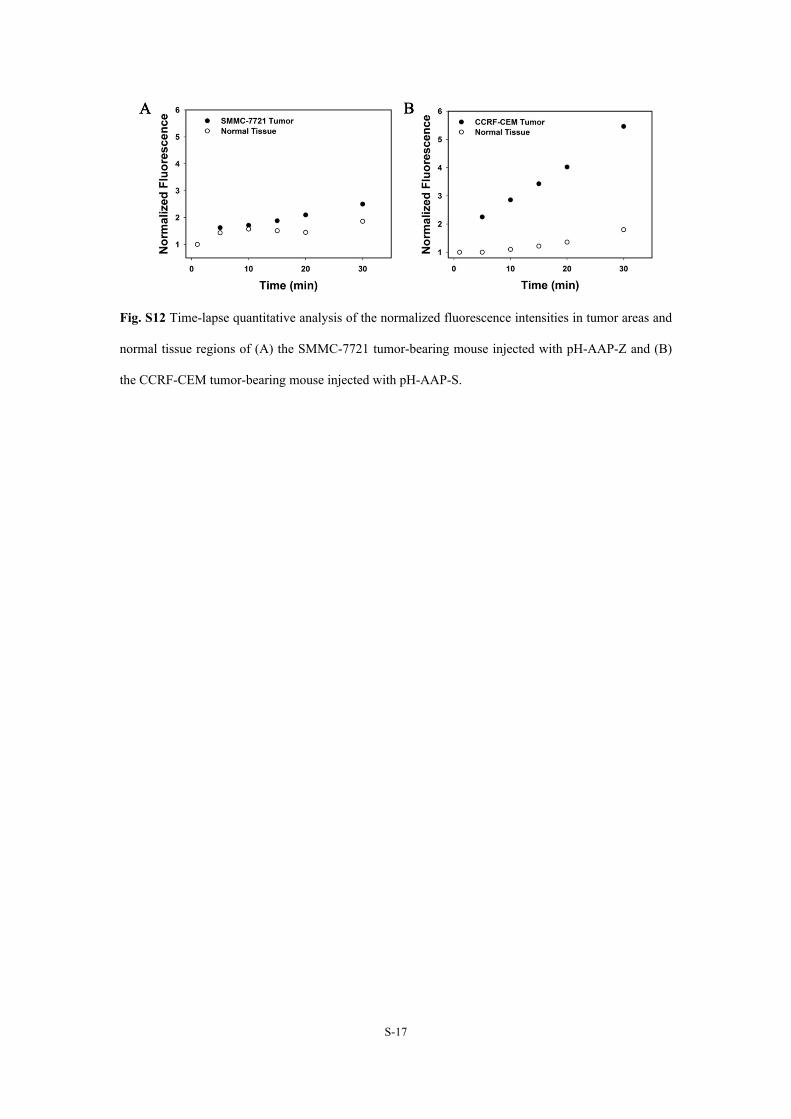
Fig. S12 Time-lapse quantitative analysis of the normalized fluorescence intensities in tumor areas and
normal tissue regions of (A) the SMMC-7721 tumor-bearing mouse injected with pH-AAP-Z and (B)
the CCRF-CEM tumor-bearing mouse injected with pH-AAP-S.
S-18
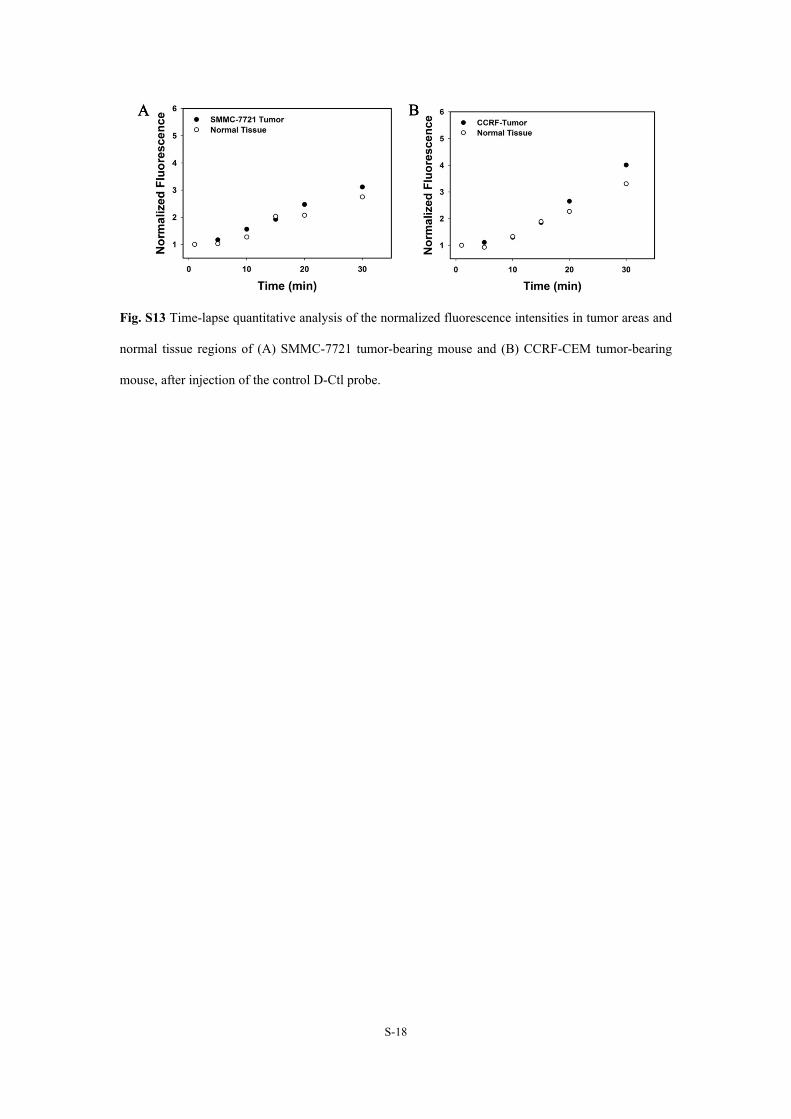
Fig. S13 Time-lapse quantitative analysis of the normalized fluorescence intensities in tumor areas and
normal tissue regions of (A) SMMC-7721 tumor-bearing mouse and (B) CCRF-CEM tumor-bearing
mouse, after injection of the control D-Ctl probe.