Jens Blauert, Bochum Binaural Hearing and Human Sound Localization.
HEARING: A 21ST CENTURY PARADIGMincluding, ELECTROCHEMISTRYOF THE NEURONThis material is excerpted from the full β-version of the text. The finalprinted version will be more concise due to further editing and economicalconstraints. A Table of Contents and an index are at the end of this paper.
James T. FultonHEARING CONCEPTS 1 (949) [email protected]
Disorders in hearing 10- 1
1Released: 2 June 20092Griffith, A. & Friedman, T. (1999) Making sense out of sound Nature Genetics vol 21
10 Disorders of the Auditory System1
10.1 Introduction
10.1.1 Categorizing auditory pathologies
Disorders of the auditory system can be broken into two major categories, mechanical and neural disorders.The former consist of disorders related to the outer, middle and non-neural portions of the inner ear.Clinically, these are generally described as conduction loss diseases. The latter can be subdivided intoneural based disorders. Those associated with the sensory neurons (and called sensorineural loss diseases)and those associated with later stages of neural circuitry. These last have not been further categorizedwithin the field of otolaryngology and subjects with these types of problems are frequently referred to aneurologist. Some investigators have divided the above disorders into three distinct categories, conductive,sensory and neural. In this case, the sensory category applies only to the sensory neurons.
An alternate subdivision of disorders of the auditory system occurs at the logarithmic conversion occurringat the axon pedicle. This division places the majority (if not all) of the analog signal processing ahead ofthis conversion and all of the phasic signal processing subsequent to this demarcation. It is also importantto note the major, but poorly named phenomenon of “recruitment” is intimately involved in the logarithmicconversion at this juncture. Recognizing this functional demarcation leads to three major subdivisionswithin hearing disorders;
1. conductive (defined as stage 0 disorders)2. sensory neuron (defines as stage 1disorders), and 3. neural (stage 2 and higher disorders), other than sensory.
A curious disorder that may not fit either the conventional (2-section) or the proposed (3-section)categorization is commonly labeled the sea-shell effect. While many investigators attempt to assign thiseffect to anomolous performance associated with either the mechanical or the neural category, Tonndorf[page 37 in Jahn, 1988] gives an alternate explanation that appears plausible. He attributes it to theBrownian Motion associated with a confined volume of air molecules. He notes that in his experience, theeffect is proportional to the volume of the confined air volume. The spectrum of this noise is known todecrease with frequency and the magnitude is known to increase with enclosed air volume. Even themasking associated with this effect has been measured. Bigger shells produce a greater effect, a greaterRMS pressure variation on a given size tympanic membrane. Under this interpretation, the effect is aninteresting external phenomenon and cannot be considered pathological to the auditory system.
Genetics has unearthed a large number of hearing disorders that can be loosely related to geneticabnormalities but there has not been great success in attributing a specific genetic defect to a particulararea or mechanism of hearing. Griffith & Friedman have described the situation2.
[xxx geisel pg 275-318 ]
[xxx chapter seven of shambaugh & glasscock on inflammatory diseases ]
10.1.2 Background
2 Biological Hearing
3Shambaugh, G. & Glasscock, M. (1980) Surgery of the Ear. London: W. B. Saunders pg 572
Many auditory disorders affect only one ear and its associated circuitry. This allows both qualitative andquantitative evaluation of the disorder through binaural testing.
The auditory system, like all known sensory modalities, is designed to operate in a constant amplitudesignal environment following the sensory neurons. This feature means that most hearing abnormalities,other than those due to trauma, inflamation or other pathological conditions, are associated with thesensory neurons. These abnormalities are generally grouped into sensorineural disorders. They arediscussed in Section xxx below.
10.1.2.1 DC coupling of neurons introduces a complication
A complication related to the sensorinerual disorders is related to how individual circuits are coupledtogether in hearing, and all of the neural system. All of the neural signaling channels of biology are DCcoupled. There are no capacitors (or transformers) separating the individual circuits (connexuses).Instead, they are coupled by synapses that consist of an Activa and a minimum of associated circuitry.While the Activa are three-terminal devices, the synapses function as two-terminal diodes when properlybiased. They form a diode between the axon of one neuron and a neurite of a second serially connectedneuron.
While the morphologist will frequently describe a synapse between an axon of one neuron and thesoma of a second, this labeling is inappropriate. Functionally, the receiving circuit element is alwaysa dendrite or podite, even if it is enclosed within the outer envelope of the soma.
The problem in analyzing DC connected serial circuits is that a change in the potential or current flow atone point can cause a ripple effect in subsequent orthodromic circuits. Following a summation process, thesource of a single error may be traceable to any of the signaling channels participating in the summation.
10.1.2.2 The continuous audiometer of Bekesy[xxx pages 81-91 in Bekesy ]
10.1.3 Pathologies of the auditory system
[xxx see Geisler chapter 16
This work will differentiate between auditory diseases which can be clinically identified from outside ofthe patients body from those that cannot (autoacoustic emission versus tinnitus, as defined below, as anexample).
10.1.3.1 Meniere’s disease
Meniere’s disease is also known by the scientific name, endolymphatic hydrops. It is characteristicallyin one audio channel initially but may become bilateral.
This major syndrome is characterized by four major symptoms, vertigo, hearing impairment, tinnitus andfullness or pressure3. A characteristic condition related to the hearing loss is the ballooning of Reissner’smembrane. This probably interferes with the launching of the surface acoustic wave within the tectorialmembrane due to distortion of the launcher near the oval window.
The tinnitus in this condition is usually at low frequencies and described as a “roaring.”
10.1.3.2 Echoes within the auditory system
[xxx consider a misalignment of the IHC and Hensen’s Stripe. ]
Disorders in hearing 10- 3
4Moller, A. (2000) Hearing: its Physiology and Pathophysiology. NY: Academic Press pp 461-470
Two different types of echoes occur in the human auditory system. The most obvious are those perceivedby the subject. Another type is perceived primarily by the medical staff during examinations. These mayor may not be heard by the subject. These echo types occur within the human auditory system under threedifferent conditions. First, some occur within an interval of less than three milliseconds and relate directlyto acousto-mechanical reflections associated with the outer and middle ear. Second, many occur withina period of a three to 30 milliseconds and relate directly to the operation of the cochlear partition of theinner ear. These echoes are associated with interference with the propagation of energy along the cochlearpartition. Third, a few people have claimed they heard echoes at intervals up to one second delay. Echoesoccurring after more than 30 milliseconds must be associated with the neural system and probably thehigher cognitive processes.
Any physical deformity or physical interference with the surface of Hensen’s stripe can result in an echothat is observable by a clinician. The physical location of the problem is easily computed from the time ofthe echo. The problem may also result in the loss of hearing by the subject at frequencies below thefrequency associated with that location along the stripe.
Unusually sharp bends in the cochlear partition can result in the perception of sounds at frequencieshigher than their actual frequency. If severe, the bend can cause termination of hearing at a specificfrequency and the perception of sounds of lower frequency as if they were at or near the terminationfrequency.
Any extraneous material contacting the outside of Hensen’s stripe, with an acoustic impedance differentfrom that of the endolymph, can cause a reflection in the dielectric waveguide formed by Hensen’s stripe.Such a disturbance is frequently observable by the clinician at a level on the order of 20 dB below thesource intensity. The delay between the source pulse and the recorded echo can be related to a specificposition along Hensen’s stripe.
10.1.3.3 Clinically observable spontaneous sources within the auditory system
[xxx consider ringing gell trapped between input structure and a discontinuity due to the gel or the sensoryneurons (even kinocilia).
10.1.3.3.1 Auto acoustic effects EMPTY
[xxx sounds generated by the hearing apparatus and observed by external investigator ]
10.1.3.4 Clinically unobservable sources within the hearing system--Tinnitus
[xxx offer a circuit diagram if possible Form into a website page like Snowy Vision ]WV 272 T591-6, 2000 is quite complete on this subjectWV 272 T591 1981 has a good epidemiology sectionWV 272 K27p 1983 is good
Most of the above is clinical and empirical psychological data
Kiang 1970, pg 263 and the discussion, pg 268 on
[xxx pages 81-91 in Bekesy ]
[xxx see Geisler 1998, pg 292-294[xxx AT reports her tinnitus ]
[xxx develop how the external feedback loop may well play a role in controlling, or suppressing tinnitus.Section 5.4.6 ]
Moller has included an overview of tinnitus4. Tyler has provided the most complete and current handbook
4 Biological Hearing
5Tyler, R. ed. (2000) Tinnitus Handbook. Singapore: Singular–Thomson Learning6Harrison, R. (1988) The Biology of Hearing and Deafness. Springfield, Il: Charles C. Thomas pg 57
on Tinnitus5. It is limited to clinical situations and offers little on the source of the condition. Theepidemiology chapter by Davis & Rafaie is quite complete as is the chapter on the “psychological profiles”of tinnitus patients by Erlansson. Tinnitus is a disease exhibiting a variety of symptoms in different patients. Like snowy vision, thesymptoms reflect the introduction of extraneous noise into the signaling channels of hearing. While snowyvision is suffered by at most a few subjects per million, tinnitus is reported broadly (probably more than10%) in the population of those over 50 years of age. The author encountered the bilateral form of theproblem starting at about 60 years of age. Coincidentally, or not, a variety of drugs were taken beginningin this time period for other reasons. It is quite reasonable to suspect some sensory hair cell damage fromthese drugs. However, the transient nature of his condition suggests his tinnitus is not due to physicaldamage but to bias problems based on chemical factors.
Recently, during a night where I encountered a very dry mouth at two different intervals (4 June, 2005),the tinnitus in my left ear disappeared completely. Upon arising, the tinnitus in both ears was absent fora matter of hours. After that period, it became noticeable again but not at its nominal intensity. Notinnitus was noticeable in my left ear after 18 hours. The tinnitus in my right ear was only noticeablewhen I concentrated on it.
During intervals when the tinnitus is absent from the left ear, the tinnitus in the right ear is perceived asoriginating at the peripheral portion of the system, somewhere between the cochlea and the outer ear.
Tyler, in his preface, says: “Tinnitus remains one of the most difficult hearing disorders to treat. . . .tinnitus has numerous causes and many neurophysiological mechanisms are likely to be involved.” Evendefining tinnitus has become a challenge. Davis & Rafaie quote McFadden (1982) that “Tinnitus is theconscious expression of a sound that originates in an involuntary manner in the head of its owner, or mayappear to him to do so.” In the context of this work, the use of the term “conscious expression of sound”is questioned. This wording seems to imply willful action. In the majority of cases, there is nothing willfulabout tinnitus. In the context of this work, tinnitus can be defined as, The awareness of a sound percept not caused by external acoustic sources, and generally not audible to aclinician due to the generation of sound waves by the middle or inner ear. This definition places mostsources of tinnitus within the neural component of the hearing and cognitive systems. It is also compatiblewith the definition of Jacobson (Tyler, page 181), “tinnitus represents the perception of sound when noneis present, . . .”
As Davis & Rafaie note, “Classification of tinnitus could play a constructive role in research and treatment.However, the lack of a clear understanding of a mechanism of generation and perception makes a singleclassification difficult to envisage.” They describe the general nature of the classification systemsattempted and used to date. A useful feature of tinnitus in some patients is its monaural character, thatallows binaural evaluation of the symptom(s). Both Davis & Rafaie and Erlandsson stress the lack of anypotent treatment for the condition. They both stress the importance of managing the subjects emotionalinvolvement more than actual medical treatment.
Jacobson offers several pertinent comments. “Investigators have utilized in tinnitus investigations allavailable auditory assessment techniques. . . .” “Inherent to all investigations has been the idea thattinnitus results from a ‘hyperactive’ auditory system.” “Despite the ready availability of patients, . . . thefindings reported by investigators to date have been inconclusive. There has not bee, as yet, unanimoussupport for any positive finding.”
Harrison has provided a general introduction to tinnitus6. “To start with, it must be stated that the termtinnitus covers a range of diverse phenomena. Some useful subclassification of tinnitus types have beenmade, although categorizing is, in most cases, not easy.” “The distinction between ‘roaring’ tinnitus andsingle pitch or narrow band tinnitus is not easy when most often the patient’s description falls betweenthese two extremes.”
Four distinct types of tinnitus can be identified from a theoretical perspective:
Disorders in hearing 10- 5
7Javel, E. (1986) Basic response properties of auditory nerve fibers In Altschuler, R. Hoffman, D. & Bobbin,R. eds. Neurobiology of Hearing: The Cochlea NY: Raven Press. Chapter 13, pg 215
Figure 10.1.1-1 EMPTY Potential sources oftinnitus.
1. tonal tinnitus (the perception of a narrowband background signal),2. white noise tinnitus (the perception of a broadband background signal exhibiting equal energy contentas a function of frequency over a wide acoustic frequency band),3. colored noise tinnitus (the perception of a broadband background signal where the energy content variessignificantly as a function of frequency), and4. later stage tinnitus (the perception of a complex signal largely independent of the signals delivered fromthe peripheral neural system).
Patients have described a wide range of sounds in a clinical environment (Tyler, page 152) that can beassociated with these four categories.
Harrison gives some additional information on pages 352-353.
Many musically trained subjects suffering from tonal tinnitus can walk up to a piano and select the keythat most nearly represents their perceived signal. AT (80 years old) reports her narrowband tinnitus isquite continuous and is represented by a frequency near B above middle C or nominally 987 Hz.
Many subjects exhibit the second type of tinnitus, a broadband, equal energy spectrum that they describeas a roaring sound, not unlike a waterfall.
The authors tinnitus is of the third type, consisting of a broadband noise with the energy density highestat a frequency near 1000 Hz. The signal is perceived as a buzz.
Tinnitus exhibits the unusual property that its can be perceived intermittently, and frequently exhibitstwo unusual properties. First, many subjects report it is not observed during periods of concentration onspecific tasks. Second, the condition may not mask the sensing of other external acoustic signals. Bothof these properties suggest the condition originates in the CNS or is subject to some level of control withinthe CNS.
The introduction of extraneous signals into the hearing system can occur at a variety of locations. Figure10.1.1-1 highlights some of these sites.
Javel has noted that tinnitus often exists when haircells are completely absent7. It is not clear if hemeans stereocilia are completely absent or theentire cell is absent.
10.1.3.4.1 The character of tintinnitis
The disease known as tintinnitis or ringing in theears is usually described in terms suggesting a puretone. Such a pure tone consists of a single narrowfrequency suggestive of that from a well made bell.The word tintinnabulum means small bell.However, this occasional sufferer has noted that theillusory internal sound I perceive is not that of apure tone, nor is it bell-like. The sound exhibits thecharacteristics of a broad band noise source. Inparticular, it is very similar to the “colored noise”heard in the speaker of a police or taxi radioreceiver (of the type used from about 1950 to thelate 1990's) when the squelch circuit is left open.This colored noise is characteristic of the signalproduced by the output circuit of a phase
6 Biological Hearing
8Tinevez, J-Y. Martin, P. & Julicher, F. (2008) Active hiar-bundle motility by the vertebrate hair cell a.k.a.Unifying the various incarnations of active hair-bundle motility by the vertebrate hair cell In Cooper, N. &Kemp, D. eds. Mechanics of Hearing Workshop 2008 pg 172
modulation system in the absence of any de-emphasis.
With the advance of time, it is becoming common to use the contraction tinnitus (most often with two n’s)to represent the word tintinnitis.
Salvi, et. al. writing in Tyler (page 152) have provided a table of tinnitus characteristics based on leadingquestions to 528 tinnitus patients. The list of qualities of the subject’s perceived sound included a seriesof adjectives and noun names; ringing, bussing, cricket, hissing, whistling, humming, roaring, musical note,steam whistle, pulsing, cracking, clicking, popping, etc. While more than one-third of the subjects selectedringing, ten other names were chosen at least two percent of the time.
In the future, it would be preferable to provide the subjects with a series of more technically defined andcarefully prepared prerecorded samples, at an appropriate sound level.
An anonymous blogger has contributed his perception of tinnitus. His condition is obviously different fromthat reported by most people. It appears to be more like a neural hallucination, like those encounteredafter an amputation. “The right ear is so silent and surreal with tinnitus sounds it's as if it is wired tolisten in to a different planet. Tinnitus is hard to describe, as it always changes. I took some notes on it lastnight and came up with this:
8-9pm: Three Arias from Don Giovanni mixed with the song of the Southern Pacific blue whale.9-9:30pm: Trucks downshift while warm rain falls.9:30-10pm: A rainbow unfurls and flaps in the wind. Japanese geishas titter.10-11pm: Sound of waves receding. A woman walks by in a dress made of string. Did I forget to turn offthe dishwasher?11-11:30pm: Music for giant space babies.”
This blogger’s form of tinnitus appears to relate to Stage 4 signal manipulation and subsequent Stage 5cognition problems more than the typical Stage 1, 2 & 3 signaling problems. He is perceiving sounds thatare not introducible by simple errors in the early stages of hearing.
10.1.3.4.2 Previous theories of tinnitus
Eggermont, writing in Tyler, has provided the broadest review of tinnitus from a research perspective.However, it is reasonable to say the literature and the review do not converge on an answer to thefundamental question, “what is the source of the disease known as tinnitus?” This is largelyunderstandable based on the character of the symptoms described by Tyler on page 152. Eggermontexplores the possibility that the source is at one of five different levels within the hearing system; thesystem, network, neuron, synapse or molecular level. He suggests the sources could be virtually anywherein the morphologically defined auditory system.
Tinevez, Martin & Julicher have recently discussed a potential source of tinnitus related to the chemicalenvironment surrounding neurons in general8. Based on this environment, the source they speak of couldeffect tinnitus, one of its analogs identified as “snowy vision” (see Chapter 19 of Processes in BiologicalVision, 2005) and many other possible neural disorders.
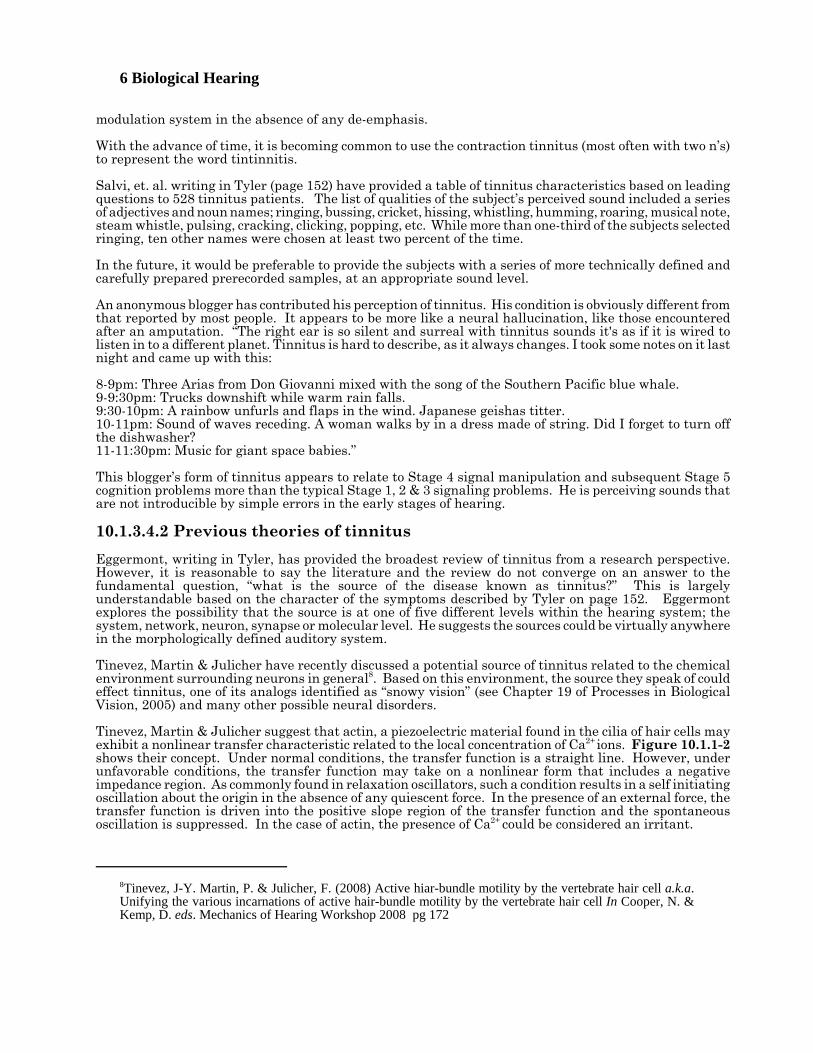
Tinevez, Martin & Julicher suggest that actin, a piezoelectric material found in the cilia of hair cells mayexhibit a nonlinear transfer characteristic related to the local concentration of Ca2+ ions. Figure 10.1.1-2shows their concept. Under normal conditions, the transfer function is a straight line. However, underunfavorable conditions, the transfer function may take on a nonlinear form that includes a negativeimpedance region. As commonly found in relaxation oscillators, such a condition results in a self initiatingoscillation about the origin in the absence of any quiescent force. In the presence of an external force, thetransfer function is driven into the positive slope region of the transfer function and the spontaneousoscillation is suppressed. In the case of actin, the presence of Ca2+ could be considered an irritant.
Disorders in hearing 10- 7
9Harding, G. & Bohne, B. (2004) Noise-induced hair-cell loss and total exposure energy: analysis of a largedata set J Acoust Soc Am vol. 115(5) Pt 1, pp 2207-2220
A spontaneous oscillation of this type in the cilia of an IHC could result in the generation of a responseperceived as a pure tone by the subject. If sufficiently large, the oscillation could generate an acoustic forcethat could travel back up the cochlear partition, through the middle ear, and be radiated from the externalear. A similar oscillation in an OHC could result in a similar effect. However, the necessity of crossing anexpanse of the tectorial membrane before entering Hensen’s stripe and projecting back through the outerear reduces the probability that an oscillation at the OHC would be strong enough to be observedexternally. Such an oscillation could still produce a signal that would be perceived by the subject.
10.1.3.4.3 Cilia loss within the cochlea
[xxx see pg 17 in Jesteadt Best cut at it]
[xxx see fig 16.5 in Geisler]
[xxx See pg 20-21 in Jesteadt ]
Harding & Bohne have recently provided extensivedata on this problem9.
10.1.3.4.4 Other experimental evidence
[xxx see Tyler, specifically Eggermont and Tyler’schapter 6 and Jacobson’s chapter 7 in Tyler]
10.1.3.4.5 A theory of tinnitus
[xxx compare to snowy vision and generate a map ortable of potential sources. ]Figure 6-4 in Tyler provides valuable information related to the source of some tinnitus, although thecaption appears to contain editorial errors. Referring to the referenced original contains the sameawkward wording. The form of these curves suggests that the type of tinnitus they are exploring occursin the system prior to the internal feedback circuit of the adaptation amplifier of the sensory neurons, andparticularly the OHC neurons.
The characteristics described by in Tyler are not limited to simple waveforms. They consist of a broadrange of waveforms, ranging from a musical note to various intermittent sounds (e. g., a cricket chirping).Based on the theory of this work, tinnitus is quickly recognized as having multiple sources within thesystem, not unlike the multiple sources described for snowy vision in the closely related visual modality.Many of the symptoms can be considered similar to the somatosensory responses observed by a subjectfollowing amputation of a limb.
The Theory of Hearing [xxx use formal designation ] presented here clearly distinguishes between percepts,interps, and other cochleotopic signals within the hearing system. The mechanisms generating each ofthese classes of signals are theoretically capable of generating extraneous outputs. Figure 10.1.1-3displays some of these sites. [xxx see next section ]
Figure 10.1.1-2 A potential chemical source oftinnitus and similar conditions. The graph plots thepotential, E, generated in response to a force, F.
8 Biological Hearing
10Hallpike, C. (1976) Sensori-neural deafness and derangements of loudness function In Keidel, W. & Neff,W. eds. Auditory system. NY: Springer-Verlag pp 1-25
Figure 10.1.1-3 Sources of extraneous signalswithin the auditory system EMPTY.
10.1.3.5 Clinically recognizable formsof tinnitus
The record supports three distinct forms of tinnitus.
A.T. & S.W. describe a pure tone type of tinnitusthat appears to relate to the failure of an individualsignature channel in the tonal portion of the neuralsystem. The failure provides a signature at theCNS that, as far as is known, is presentconstantly.
The apparently broader band form of tinnitus ofJ.F. suggests the introduction of a noise sourcefollowing some degree of processing in themidbrain. Its variability in amplitude andoccasional disappearance for intervals of a fewhours suggest it is not the result of a permanentcircuit failure but more likely is the result of a biaserror. The fact that it does not mask external audioinputs, and that it has a finite bandwidth suggestsit may be directly related to the “critical band”mechanism. The latter is closely associated withthe concept of attention, a feature normallyassociated with the frontal lobe and possibly theparietal lobe.
The reports of the anonymous blogger suggest a higher level failure. The failure appears to consist of afalse percept that is passed to the saliency map of the parietal lobe. The variety of the perceivedinformation suggests the false percept may be due to a false interp combined with other correctinformation.
10.2 Sensorineural disorders related to intensity level
A wide range of disorders have been loosely identified by clinicians in the absence of a detailed model ofthe hearing system. Many of these disorders can be combined into one based on a better model.Historically, many of these disorders have been associated with a loss in threshold sensitivity. Others,such as the inappropriately named recruitment, have been associated with an apparent increase inloudness changes in response to a standardized change in stimulus intensity. Hallpike provided anextensive discussion of sensorineural losses in 197610. Many of his conclusions are not supported herebased on more recent data and interpretations.
The clinically recognized disorders related to intensity level in hearing can be described based on simplegraphs derived from Figure 10.2.1-1 developed in Section 5.xxx. Unfortunately, understanding the basisof this figure requires considerable knowledge of neural electrolytic circuitry and the conventional electricalcircuit techniques upon which it is based. This section will not discuss these techniques since theirapplication is discussed in Chapter 5, along with references to the underlying literature. This figuredescribes the operation of the tonal (OHC) sensory neurons in general Using the performance of the OHCneurons with a characteristic frequency and characteristic bandwidth including 1000 Hz.
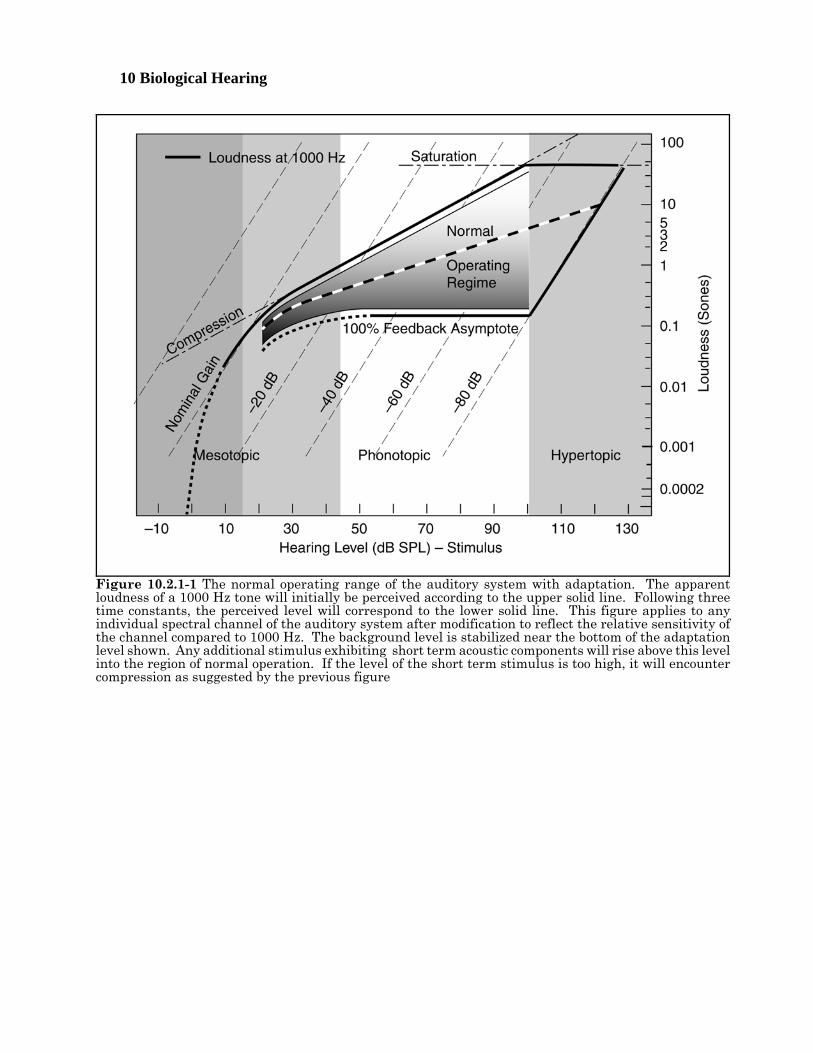
Disorders in hearing 10- 9[xxx relook at stimulus levels and make agree with Standard Ear. ]The upper solid line connecting to the dotted line describes the nominal output voltage at the pedicle of thesensory neuron in the absence of the mechanism known as adaptation. In this figure, the voltage isdescribed in units of loudness called Sones for convenience. Note that both scales in the figure arelogarithmic. In the absence of the logarithmic conversion performed at the pedicle, the gain of the overallsensory neuron would continue to rise along the dashed line at the bend in the solid and dotted curve. Sucha condition is not sustainable in any electrical circuit. In the sensory neurons, the maximum outputpotential is as shown, the gain of the circuit decreases with increased stimulus intensity as shown. Theeffect is described as compression in the vernacular. The point where compression becomes effective iscontrolled by the base potential associated with the distribution Activa of the sensory neuron. At somepoint, the Activa associated with the adaptation amplifier is driven into saturation (as shown). Noadditional signal amplification can occur above this level. Above this level, the shape of the signalrepresenting any stimulus will be greatly distorted. Various forms of pain become apparent as thestimulus conditions drive the sensory neurons farther into saturation.
Negative internal feedback is employed in each of the OHC neurons of hearing. If this feedback was 100%effective, the resulting output characteristic would be shown by the lower (horizontal) solid line. Note thatthere is no output as a function of stimulus intensity under this condition. It is not a useful condition. Inpractice, the nominal feedback used in the hearing system approximates xxx %, with the upper solid curverepresenting 0%. The level of feedback is controlled by the impedance in the common emitter to groundcircuit of the sensory neurons.
Not shown in this figure is an equivalent background noise level due to the internal noise performance ofthe auditory system. For purposes of discussion, this highly variable loudness level (across the population)will be considered equal to 0.01 Sones.
The major sensorineural disorders of tonal hearing are related to abnormalities in these curves due toabnormal conditions within the circuitry of the sensory neuron. Several of these disorders can be describedby replotting only the central region of this figure.
10 Biological Hearing
Figure 10.2.1-1 The normal operating range of the auditory system with adaptation. The apparentloudness of a 1000 Hz tone will initially be perceived according to the upper solid line. Following threetime constants, the perceived level will correspond to the lower solid line. This figure applies to anyindividual spectral channel of the auditory system after modification to reflect the relative sensitivity ofthe channel compared to 1000 Hz. The background level is stabilized near the bottom of the adaptationlevel shown. Any additional stimulus exhibiting short term acoustic components will rise above this levelinto the region of normal operation. If the level of the short term stimulus is too high, it will encountercompression as suggested by the previous figure
Disorders in hearing 10- 11
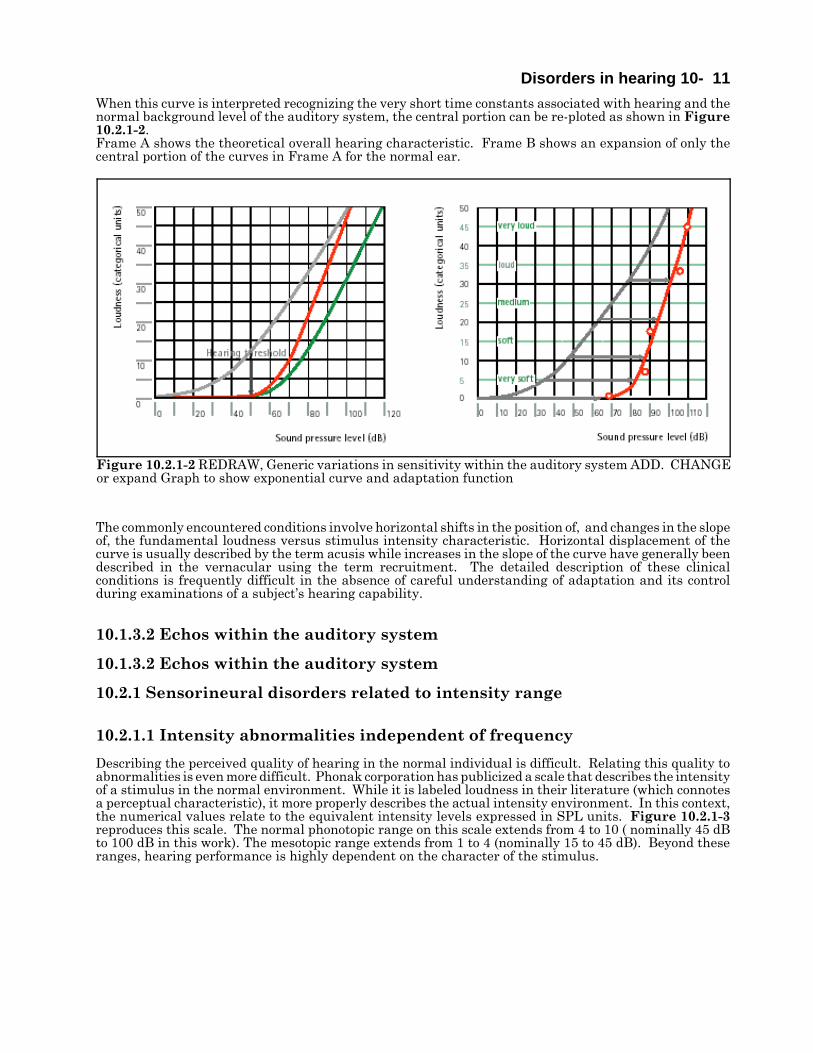
Figure 10.2.1-2 REDRAW, Generic variations in sensitivity within the auditory system ADD. CHANGEor expand Graph to show exponential curve and adaptation function
When this curve is interpreted recognizing the very short time constants associated with hearing and thenormal background level of the auditory system, the central portion can be re-ploted as shown in Figure10.2.1-2. Frame A shows the theoretical overall hearing characteristic. Frame B shows an expansion of only thecentral portion of the curves in Frame A for the normal ear.
The commonly encountered conditions involve horizontal shifts in the position of, and changes in the slopeof, the fundamental loudness versus stimulus intensity characteristic. Horizontal displacement of thecurve is usually described by the term acusis while increases in the slope of the curve have generally beendescribed in the vernacular using the term recruitment. The detailed description of these clinicalconditions is frequently difficult in the absence of careful understanding of adaptation and its controlduring examinations of a subject’s hearing capability.
10.1.3.2 Echos within the auditory system
10.1.3.2 Echos within the auditory system
10.2.1 Sensorineural disorders related to intensity range
10.2.1.1 Intensity abnormalities independent of frequency
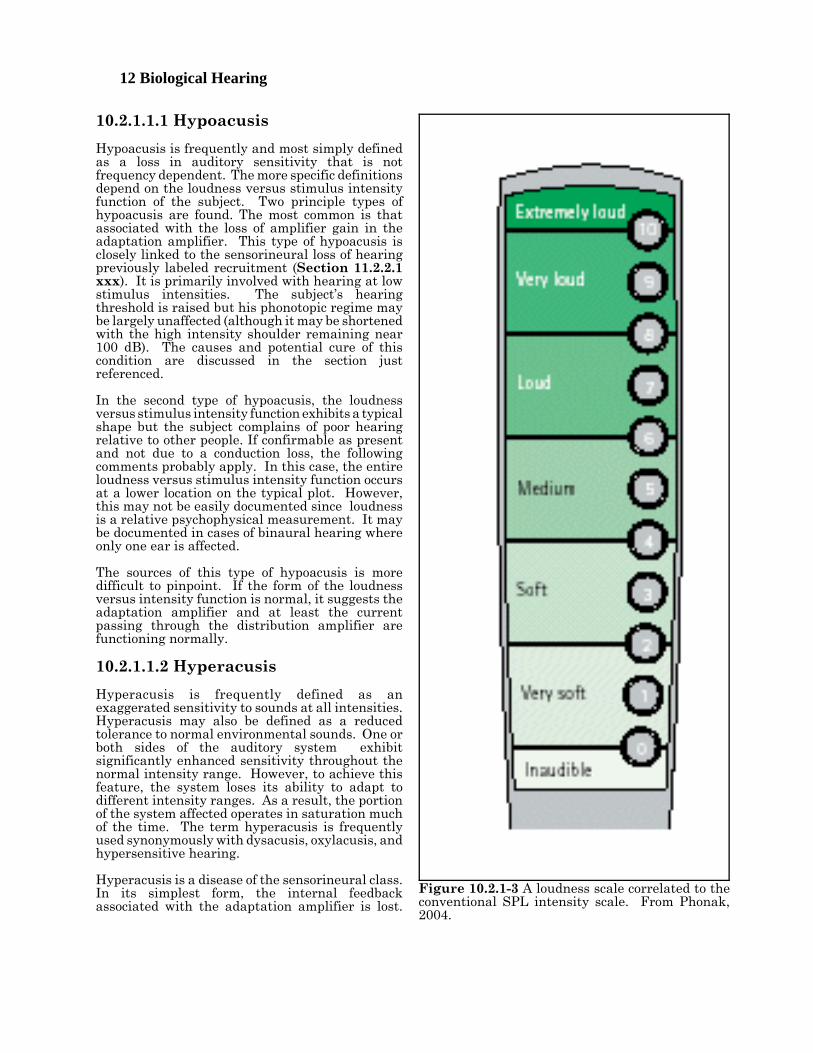
Describing the perceived quality of hearing in the normal individual is difficult. Relating this quality toabnormalities is even more difficult. Phonak corporation has publicized a scale that describes the intensityof a stimulus in the normal environment. While it is labeled loudness in their literature (which connotesa perceptual characteristic), it more properly describes the actual intensity environment. In this context,the numerical values relate to the equivalent intensity levels expressed in SPL units. Figure 10.2.1-3reproduces this scale. The normal phonotopic range on this scale extends from 4 to 10 ( nominally 45 dBto 100 dB in this work). The mesotopic range extends from 1 to 4 (nominally 15 to 45 dB). Beyond theseranges, hearing performance is highly dependent on the character of the stimulus.
12 Biological Hearing
Figure 10.2.1-3 A loudness scale correlated to theconventional SPL intensity scale. From Phonak,2004.
10.2.1.1.1 Hypoacusis
Hypoacusis is frequently and most simply definedas a loss in auditory sensitivity that is notfrequency dependent. The more specific definitionsdepend on the loudness versus stimulus intensityfunction of the subject. Two principle types ofhypoacusis are found. The most common is thatassociated with the loss of amplifier gain in theadaptation amplifier. This type of hypoacusis isclosely linked to the sensorineural loss of hearingpreviously labeled recruitment (Section 11.2.2.1xxx). It is primarily involved with hearing at lowstimulus intensities. The subject’s hearingthreshold is raised but his phonotopic regime maybe largely unaffected (although it may be shortenedwith the high intensity shoulder remaining near100 dB). The causes and potential cure of thiscondition are discussed in the section justreferenced.
In the second type of hypoacusis, the loudnessversus stimulus intensity function exhibits a typicalshape but the subject complains of poor hearingrelative to other people. If confirmable as presentand not due to a conduction loss, the followingcomments probably apply. In this case, the entireloudness versus stimulus intensity function occursat a lower location on the typical plot. However,this may not be easily documented since loudnessis a relative psychophysical measurement. It maybe documented in cases of binaural hearing whereonly one ear is affected.
The sources of this type of hypoacusis is moredifficult to pinpoint. If the form of the loudnessversus intensity function is normal, it suggests theadaptation amplifier and at least the currentpassing through the distribution amplifier arefunctioning normally.
10.2.1.1.2 Hyperacusis
Hyperacusis is frequently defined as anexaggerated sensitivity to sounds at all intensities.Hyperacusis may also be defined as a reducedtolerance to normal environmental sounds. One orboth sides of the auditory system exhibitsignificantly enhanced sensitivity throughout thenormal intensity range. However, to achieve thisfeature, the system loses its ability to adapt todifferent intensity ranges. As a result, the portionof the system affected operates in saturation muchof the time. The term hyperacusis is frequentlyused synonymously with dysacusis, oxylacusis, andhypersensitive hearing.
Hyperacusis is a disease of the sensorineural class.In its simplest form, the internal feedbackassociated with the adaptation amplifier is lost.
Disorders in hearing 10- 13
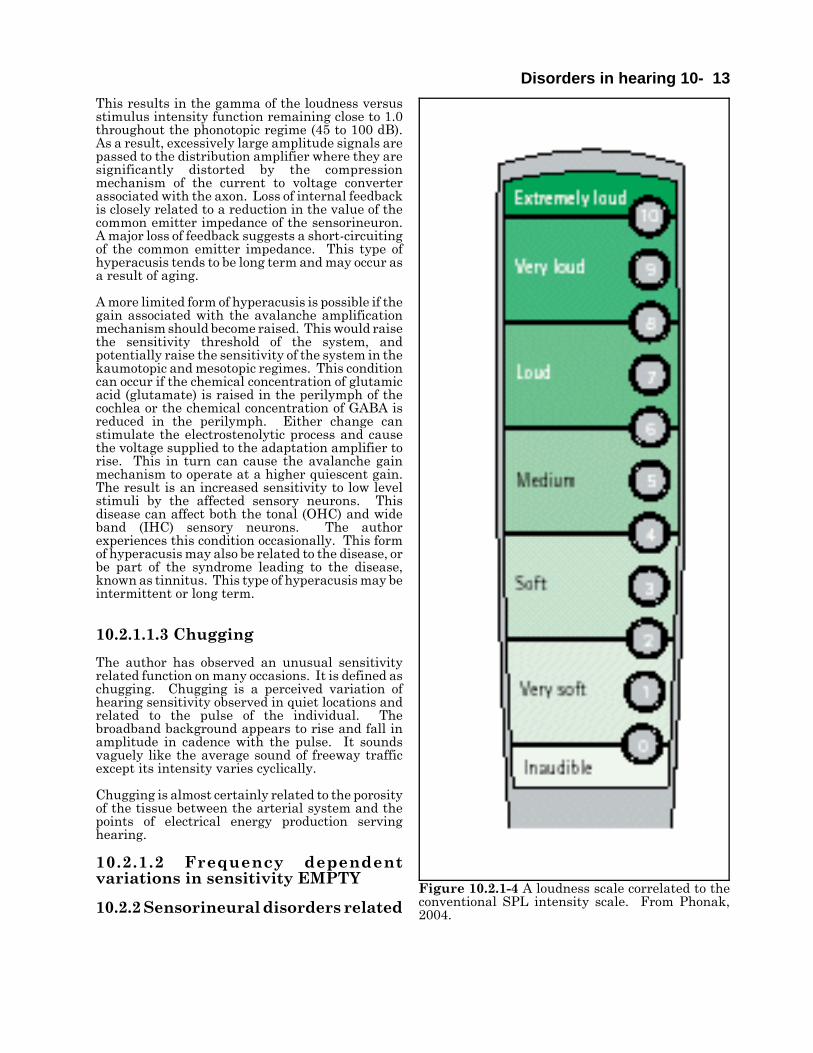
Figure 10.2.1-4 A loudness scale correlated to theconventional SPL intensity scale. From Phonak,2004.
This results in the gamma of the loudness versusstimulus intensity function remaining close to 1.0throughout the phonotopic regime (45 to 100 dB).As a result, excessively large amplitude signals arepassed to the distribution amplifier where they aresignificantly distorted by the compressionmechanism of the current to voltage converterassociated with the axon. Loss of internal feedbackis closely related to a reduction in the value of thecommon emitter impedance of the sensorineuron.A major loss of feedback suggests a short-circuitingof the common emitter impedance. This type ofhyperacusis tends to be long term and may occur asa result of aging.
A more limited form of hyperacusis is possible if thegain associated with the avalanche amplificationmechanism should become raised. This would raisethe sensitivity threshold of the system, andpotentially raise the sensitivity of the system in thekaumotopic and mesotopic regimes. This conditioncan occur if the chemical concentration of glutamicacid (glutamate) is raised in the perilymph of thecochlea or the chemical concentration of GABA isreduced in the perilymph. Either change canstimulate the electrostenolytic process and causethe voltage supplied to the adaptation amplifier torise. This in turn can cause the avalanche gainmechanism to operate at a higher quiescent gain.The result is an increased sensitivity to low levelstimuli by the affected sensory neurons. Thisdisease can affect both the tonal (OHC) and wideband (IHC) sensory neurons. The authorexperiences this condition occasionally. This formof hyperacusis may also be related to the disease, orbe part of the syndrome leading to the disease,known as tinnitus. This type of hyperacusis may beintermittent or long term.
10.2.1.1.3 Chugging
The author has observed an unusual sensitivityrelated function on many occasions. It is defined aschugging. Chugging is a perceived variation ofhearing sensitivity observed in quiet locations andrelated to the pulse of the individual. Thebroadband background appears to rise and fall inamplitude in cadence with the pulse. It soundsvaguely like the average sound of freeway trafficexcept its intensity varies cyclically.
Chugging is almost certainly related to the porosityof the tissue between the arterial system and thepoints of electrical energy production servinghearing.
10.2.1.2 Frequency dependentvariations in sensitivity EMPTY
10.2.2 Sensorineural disorders related
14 Biological Hearing
11Pierce, J. & David, E. (1958) Man’s World of Sound. NY: Doubleday. pg 17512Moody, D. (1973) Behavioral studies of noise-induced hearing loss to primates: loudness recruitment In AdvOto-Rhino-Laryng, Vol. 20 Basel: S. Karger. pp 82-101 Figure is shown in Smith & Vernon, 1976.13Moore, B. (1977) Introduction to the Psychology of Hearing. London: Macmillan Press pgp 83-8514Plack, C. & Carlyon, R. (1995) Loudness perception and intensity coding In Moore, B. ed. Hearing. NYAcademic Press pp 127-12815Allen, J. (1997) Derecruitment by multiband compression in hearing aids In Jesteadt, W. ed. Modelingsesorineural hearing loss Mahwah, NJ: Lawrence Erlbaum Associates pp 99-11216Moore, B. & Glasberg, B. (1993) Simulation of the effects of loudness recruitment and threshold elevationon the intelligibility of speech in quiet and in a background of speech J Acoust Soc Am vol. 94(4), pp 2050-206217Allen, J. Hall, J. & Jeng, P. (1990) Loudness growth in ½-octave bands (LGOB)–a procedure for theassessment of loudness J Acoust Soc Am vol. 88(2), pp 745-753
to differential sensitivity
10.2.2.1 Loudness Recruitment (loss in adaptation amplifier gain)
[xxx much of the following belongs in Chapters 8 or 9 ]The variation in sensitivity with intensity has long been studied empirically, generally associated with thedescriptor “recruitment” based on an early theory of the proposed underlying process. A wide variety ofexplanations for it appear in the general and clinical literature. These are generally described using thevernacular. When addressed in the scientific literature, the condition lacks a clear definition. Because ofthe confusion, recruitment is frequently described as a paradoxical phenomenon. Pierce & David describedit as a peculiar phenomenon and then failed to define it in words that were consistent with otherinvestigators11.
Moody has provided a hypothetical explanation of recruitment based on its relationship to the latency ofa response12. This quantity is not the latency of the transduction process. It includes both cognition andmotor response time and tends to be in the hundreds of milliseconds. It is difficult to uncover anytheoretical mechanisms that would support the proposed theoretical interpretation.
[xxx should define gamma before this comment ]Moore provides a two-page discussion of recruitment circa 197713. No graphical treatment or tabular datais provided. The word picture suggests a gamma of 2.5 for the average situation. It is simplistic. Itignores any role for the adaptation mechanism in normal or abnormal hearing.
Plack & Carlyon have provided a recent one-page discussion of the subject using a graph with looselydefined relative scales and no data points14. They associate the problem with sesorineural impairment andnote that it can be evaluated binaurally if present in only one ear. Their list of citations is limited. Theydid note an early study by Hood (1950) that said the ear exhibiting recruitment frequently exhibited anabnormally fast loudness adaptation characteristic.
Allen has provided one of the broader discussions of recruitment15. His multiple definitions and his figure6.4 are converging on the model and definitions of this work. His figure 6.3 from Fletcher is fundamentalto understanding recruitment. Recruitment is not the increase in something; normal hearing, within thephonotopic regime, is a reduction in something (the gamma of the amplification process due to feedback).
The above treatments have not discussed the change in slope of the hypothesized recruitment mechanismwhen illustrated on a (perceived) loudness versus intensity graph. The slope of such a curve on a log-logplot of this type is generally called γ (gamma). A gamma of 1.0 implies a linear process. Any other valueof gamma implies a nonlinear process (in the absence of changes in the signal content in the frequencydomain that can have a similar effect). The value of gamma can be evaluated on a local basis. It need notbe a constant. A value of gamma below one is generally associated with a feedback mechanism,particularly if the value of gamma remains constant over a significant range.
Moore & Glasberg16 and Allen, et. al17. have provided papers describing various clinical evaluationsdesigned to improve loudness assessment and recruitment description. The Moore & Glasberg paper
Disorders in hearing 10- 15
18Carney, L. (1994) Spatiotemporal encoding of sound level: models for normal encoding and recruitment ofloudness Hear Res vol. 76, pp 31-4419Heinz, M. & Young, E. (2004) Response growth with sound level in auditory-nerve fibers after noise-inducedhearing loss J Neurophysiol vol. 91, pp 784-79520Buus, S. & Florentine, M. (2003) Growth of loudness in listeners with cochlear hearing losses: recruitmentreconsidered J Assoc Res Otolaryngol vol. 3, pp 120-13921Moore, B. (1977) The Psychology of Hearing. London: Macmillan pg 97
makes the following comment. “Our method for simulating the effects of loudness recruitment is basedupon a consideration of its probable underlying cause.” It does not appear they feel they have determinedthat cause with confidence. However, their later comments are very useful. If we accept this account ofrecruitment as a working hypothesis, then we may regard the normal ear as containing a compressivenonlinearity ( a kind of automatic gain control, AGC), whereas the impaired ear lacks this nonlinearity.The exact time cours of operation of the compressive nonlinearity is a normal ear does not appear to beknown. However, it clearly works very rapidly, within a few ms.” These specific points are supported bythis work over a portion of the hearing range. However, a more complete and detailed model covering theentire dynamic range of hearing is offered here. Their conclusion is relevant. “The main conclusion of thisstudy is that threshold elevation combined with loudness recruitment is sufficient to produce a substantialdecrease in the ability to understand speech in the presence of a single competing talker, especially whenthe recruitment is associated with a sloping hearign loss. Linear amplification of the type typically usedin hearing aids compensates for this effect only to a limited extent, and does not restore performance tonormal.”
Carney has provided a mathematical model attempting to describe recruitment for modeling purposes18.While the model includes many of the elements expected in such a model, no details of the individualelements showing they are directly related to the underlying physiology are offered. This is particularlytrue of his time-varying narrowband filter prior to the traveling wave delay associated with the cochlea.
Heinz & Young have provided considerable empirical data in a recent paper19. Their introduction doesprovide a wide bibliography. However, they did not focus on the mechanism underlying their “recruitment.”They adopt a simple definition of the effect and refer to the review to a 1995 review by Moore. Their figure1A clearly and correctly describes the sensorineural hearing loss generally described by the clinical termrecruitment, except the label on the ordinate mis-assigns the source of the problem. The root cause is theloss of neural amplification within the sensory neurons as developed in the following figure.
Buus & Florentine have provided a well defined data set and related discussion20. They illustrated thedifficulty in working without a physiologically compatible theoretical model by their comparison of twodefinitions of recruitment in item 6 of their conclusions:
1. Recruitment– An abnormally large loudness at an elevated threshold. (Buus & Florentine, 2003)
2. Recruitment– An abnormally rapid growth in loudness above an elevated threshold. (“Classical”)
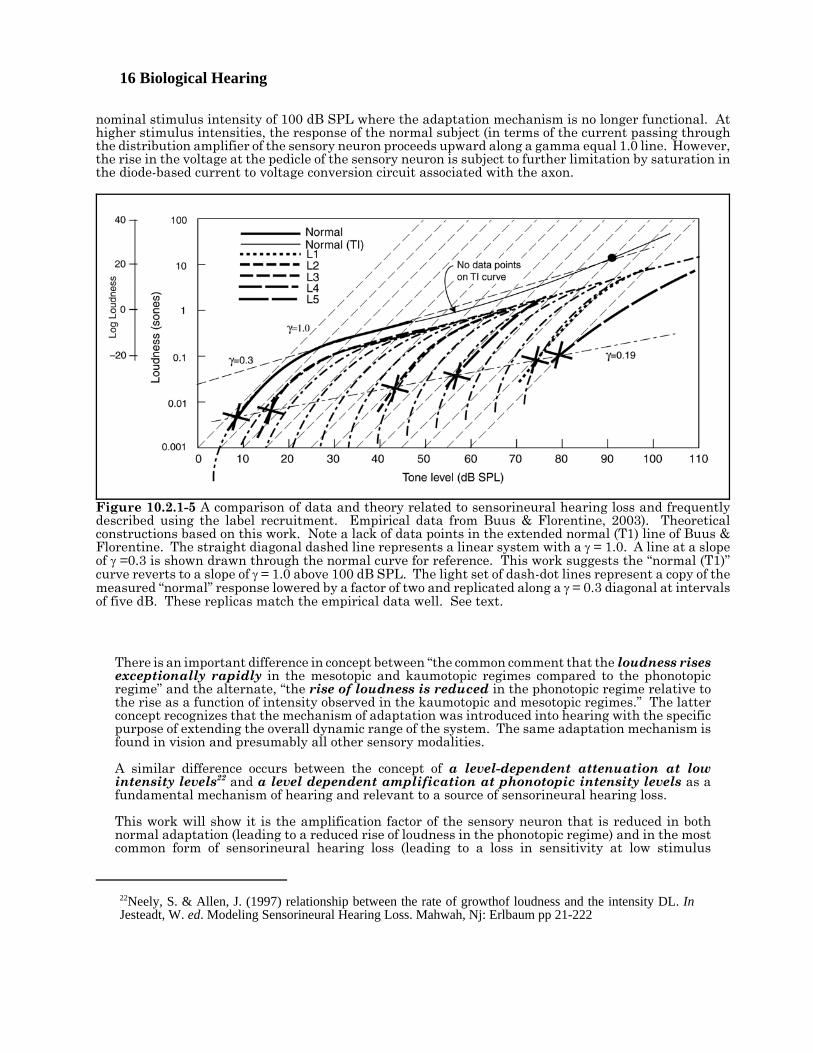
These two definitions continue to miss the subtle details of the condition as shown most clearly in theirfigure 3, reproduced here as Figure 10.2.1-5. The figure has been supplemented by construction basedon the theoretical model of this work. A premise of this work is that the perceived loudness is proportionalto the intensity of the stimulus within the mesotopic regime between 15 dB and 45 dB SPL. Above thislevel, adaptation introduced a significant reduction in the slope of the loudness to intensity relationshipthat extends up to the 100 dB SPL level. Moore made an astute observation in 1977 related to normalvision21. “At low sensation levels (around 10–20 dB SL) the loudness of a complex sound is roughlyindependent of bandwidth. This is also easy to explain. At these low levels firing rates change relativelyrapidly with intensity and so does loudness. The loudness of a single critical band changes almost in directproportion to intensity, . . .” This is precisely the condition described in the figure.
The range from 45 dB to 100 dB defines the phonotopic regime of hearing. A series of diagonal lines havebeen drawn for a gamma of 1.0. A system performing linearly and at a constant gain will follow one ofthese lines. Also shown is a dashed line sloping up to the right at a gamma of 0.3 and passing through themeasured data points of the normal subject. This is the slope usually associated with the plateau in thehuman response defined as the phonotopic regime. This slope is controlled by the internal feedback factorassociated with the adaptation amplifier of the “normal” sensory neurons. This regime extends to a
16 Biological Hearing
22Neely, S. & Allen, J. (1997) relationship between the rate of growthof loudness and the intensity DL. InJesteadt, W. ed. Modeling Sensorineural Hearing Loss. Mahwah, Nj: Erlbaum pp 21-222
Figure 10.2.1-5 A comparison of data and theory related to sensorineural hearing loss and frequentlydescribed using the label recruitment. Empirical data from Buus & Florentine, 2003). Theoreticalconstructions based on this work. Note a lack of data points in the extended normal (T1) line of Buus &Florentine. The straight diagonal dashed line represents a linear system with a γ = 1.0. A line at a slopeof γ =0.3 is shown drawn through the normal curve for reference. This work suggests the “normal (T1)”curve reverts to a slope of γ = 1.0 above 100 dB SPL. The light set of dash-dot lines represent a copy of themeasured “normal” response lowered by a factor of two and replicated along a γ = 0.3 diagonal at intervalsof five dB. These replicas match the empirical data well. See text.
nominal stimulus intensity of 100 dB SPL where the adaptation mechanism is no longer functional. Athigher stimulus intensities, the response of the normal subject (in terms of the current passing throughthe distribution amplifier of the sensory neuron proceeds upward along a gamma equal 1.0 line. However,the rise in the voltage at the pedicle of the sensory neuron is subject to further limitation by saturation inthe diode-based current to voltage conversion circuit associated with the axon.
There is an important difference in concept between “the common comment that the loudness risesexceptionally rapidly in the mesotopic and kaumotopic regimes compared to the phonotopicregime” and the alternate, “the rise of loudness is reduced in the phonotopic regime relative tothe rise as a function of intensity observed in the kaumotopic and mesotopic regimes.” The latterconcept recognizes that the mechanism of adaptation was introduced into hearing with the specificpurpose of extending the overall dynamic range of the system. The same adaptation mechanism isfound in vision and presumably all other sensory modalities.
A similar difference occurs between the concept of a level-dependent attenuation at lowintensity levels22 and a level dependent amplification at phonotopic intensity levels as afundamental mechanism of hearing and relevant to a source of sensorineural hearing loss.
This work will show it is the amplification factor of the sensory neuron that is reduced in bothnormal adaptation (leading to a reduced rise of loudness in the phonotopic regime) and in the mostcommon form of sensorineural hearing loss (leading to a loss in sensitivity at low stimulus
Disorders in hearing 10- 17
23Buus, S. Musch, H. & Florentine, M. (1998) On loudness at threshold J Acous Soc Am vol. 104, pp 399-410
intensities.
The data of Buus & Florentine can be interpreted with considerable specificity based on their data and thistheoretical construction. First, the reduction in amplitude of the response by a factor of two in sones willbe ignored temporarily. Under this condition, the presumed sensorineural hearing losses associated withsubjects L1 through L4, and probably L5, can be described as a loss in maximum adaptation amplifier gain.The loss predicted by this work for L1 is 55 dB using the weighted curve of Buus & Florentine. They givethis subjects loss as between 50 and 65 dB HL for frequencies between 1 and 8 kHz and ignoring theirvalues for 250 and 500 Hz. 55 dB approximates the total gain associated with the adaptation mechanismin the Standard Ear of this work. The loss for L2 is 30 dB (versus the un-weighted 40 dB of Buus &Florentine at 1000 Hz). The loss for L3 is only 5 dB (versus 10 dB at 1000 Hz). L4 shows a loss of 40 dB(which equals the value of Buus & Florentine). The responses of these subjects all follow the dash-dotreplicas of the normal ear quite well. Subject L5 is the only one showing a significantly different shapethan that of the replicas. This work suggests his loss was 60 dB versus the un-weighted 70 dB of Buus &Florentine. It would be interesting to see the actual data points for the experiment using this subject andsee if any of them could be considered out outliers.
Look now at the small vertical displacement in the data points of the normal versus the subjects withsensorineural hearing loss that was ignored earlier. Buus & Florentine describe their explanation for thisdisplacement on page 132. “The model predicts a small loudness-level loss owing to loudness summationnear threshold because it assumes that the loudness increases more rapidly than intensity (i. e., the localexponent is larger than unity) near a threshold that is elevated by masking. If the local exponent is unity,no loudness-level gain (or loss) owing to loudness summation should be obtained, . . . .” No mechanism forachieving a local exponent (gamma) greater than one has been identified in the circuitry of the hearingsystem in this work. Buus & Florentine did not identify any mechanism providing a gamma greater thanone. They introduced a fitting function in their mathematical model that allowed the local exponent(gamma) to be greater than one. This work suggests that any calculated local exponent greater than oneis due to statistical problems (and possibly preconceived ideas based on earlier proposals) unrelated to theunderlying mechanisms.
The effect of the loss of adaptation amplifier gain is to narrow the plateau region associated withphonotopic hearing. As a result, the subject encounters a higher gamma experience over most of hisauditory range. At the simplest level, the overall response can be averaged to approximate the pedagogicalgraph by Plack & Carlyon in Moore (page 127). However, this action obscures the potential causes of theproblem.
Buus & Florentine struggle with the gamma of the hearing mechanism at levels near threshold andspecifically with their interpretation of the perceived intensity (loudness) expressed in sones (page 122).They note, “Although many authors have proposed loudness functions according to which loudness atthreshold is zero (for review, see Buus et al. 1998), our finding of nonzero loudness at threshold shouldhardly be surprising.” Reviewing this referenced paper23 surfaces a fundamental problem found in theliterature. All of the equations cited are first order mathematical equations that were proposed based onvery limited empirical data and no significant model of the physiological processes involved. They areexamples of curve fitting a single (simple) continuous equation to a compound response due to multipleunderlying mechanisms. This procedure is obviously inadequate. None of the discussed equations aresufficiently flexible to describe the actual loudness-intensity relationship or the phenomenon labeledrecruitment. Any mathematical treatment describing loudness (perceived intensity) as a function ofstimulus intensity must recognize the roles of avalanche gain, non-linear negative internal feedback andthe nonlinearity of the current-to-voltage conversion process in that function.
Buus & Florentine show a threshold for each of their measured loudness versus stimulus functions(indicated by the X symbols). The thresholds appear to align along a slope they describe as γ = 0.19. Thisvalue of gamma was one of four free parameters plus a scale factor in their final empirical equation. Theseparameters could not be interpreted as applying to any physiological model. They did note that thisparameter “showed substantial differences across listeners. They ranged from 0.14 to 0.62 for the threelisteners with hearing losses that varied considerably across the range of component frequencies, whichindicates that loudness at threshold increases systematically with the amount of hearing loss within eachlistener, but the rate of increase differs across listeners.” Their threshold values will not be addresses
18 Biological Hearing
further here.
The 1998 paper also suffers from a lack of mathematical rigor in its mathematical framework. One of thekeystones of the paper concerned their proposal that the perceived intensity (loudness) in sones did notbegin at zero value at threshold, a common assertion in the pedagogy of recruitment. Although itrecognizes both a loudness parameter and a loudness function which is defined as the logarithm of theloudness parameter (the perceived intensity), they are inconsistent when discussing them. Loudness istraditionally been plotted using a logarithmic scale, in consonance with the conventional intensity scale.These are both relative scales that exhibit no absolute zero value. This fact is illustrated in their figures1 and 3. In the caption to figure 5, they use the term loudness function in the vernacular, instead of theirtechnical meaning, to describe a relationship shown by a line on a graph. When the logarithm of theintensity parameter is taken, the resulting scale is given a zero value corresponding to an intensity of 20micropascals. When the logarithm of the loudness parameter is taken, the resulting loudness function canbe assigned a value of zero wherever desired. It is absolutely arbitrary. It can be taken as zero at onesone—which is itself arbitrarily defined relative to 40 dB SPL—which is itself arbitrarily defined relativeto 20 micropascals). Alternately, it can be taken at a “threshold value” read from a graph. The paper alsospeaks of the sum and difference of random variables in the simplest language. They describe an “absolutethreshold” instead of a threshold defined relative to the RMS value of a random noise source.
All of their data was manipulated extensively in arriving at the average estimates of loss versus intensityplotted in their figure. This discussion is based largely on the assumption that their results still containthe essence of the loudness versus intensity relationship. It would be useful to repeat their experimentsusing the protocol developed in their paper except using only one stimulus frequency at a time and plottingthat data without using an arbitrary summation protocol.
The loss of hearing sensitivity associated with the term recruitment does not involve neural circuitsorthodromic to the adaptation amplifier. In particular, the internal negative feedback introduced by thecommon emitter impedance is not affected (except for the fact that the current through the impedance isreduced at a given level of stimulus intensity). The effect of this lower current level is to shift thetransition between a gamma of 1.0 and a nominal gamma of 0.3 to the right along with the thresholdintensity level.
Disorders in hearing 10- 19
Figure 10.2.1-6 A loudness scale correlated to theconventional SPL intensity scale. From Phonak,2004.
10.2.2.1.1 Redefinition of thephenomenon previously known asrecruitment
Based on this data and this interpretation, thevernacular term recruitment can be definedscientifically and very precisely.
3a. Recruitment– (as a phenomenon) The reductionin the maximum average amplification factorachievable within the adaptation amplifiers of agroup of sensory neurons forming a single signalingchannel and responding within a specific criticalbandwidth.
3b. Recruitment– (as a clinical condition) A loss ofauditory sensitivity recognized by a horizontal shiftin the loudness versus intensity function.
These definitions are specifically applicable to OHCneurons. The loss can be evaluated on a channel bychannel basis where each channel exhibits adistinct critical frequency. A loss of 10 dB in thismaximum amplification factor results in asensorineural loss (measured clinically) of 10 dB.
The term recruitment is completely inappropriatebased on the underlying physiological problem. Itis antiquated and should be discarded by thecommunity. The deficit does not involve therecruitment of signals from separate individualsensory (or signaling) channels as originallyproposed.
The new definition has little in common with theearlier definitions given above.
Based on this theoretical interpretation, thescientific literature concerning recruitment prior to1998 should be discarded. The description ofrecruitment by Phonak shown on the world wideweb, in conjunction with their Claro product line,should also be updated when more than a consumerversion of the effect is needed.
20 Biological Hearing
24Yoshie, N. & Ohashi, T. (1969) Clinical use of cochlear nerve action potential responses in man fordifferential diagnosis of hearing losses Acta Oto-laryng Supp 252, pp 71-87
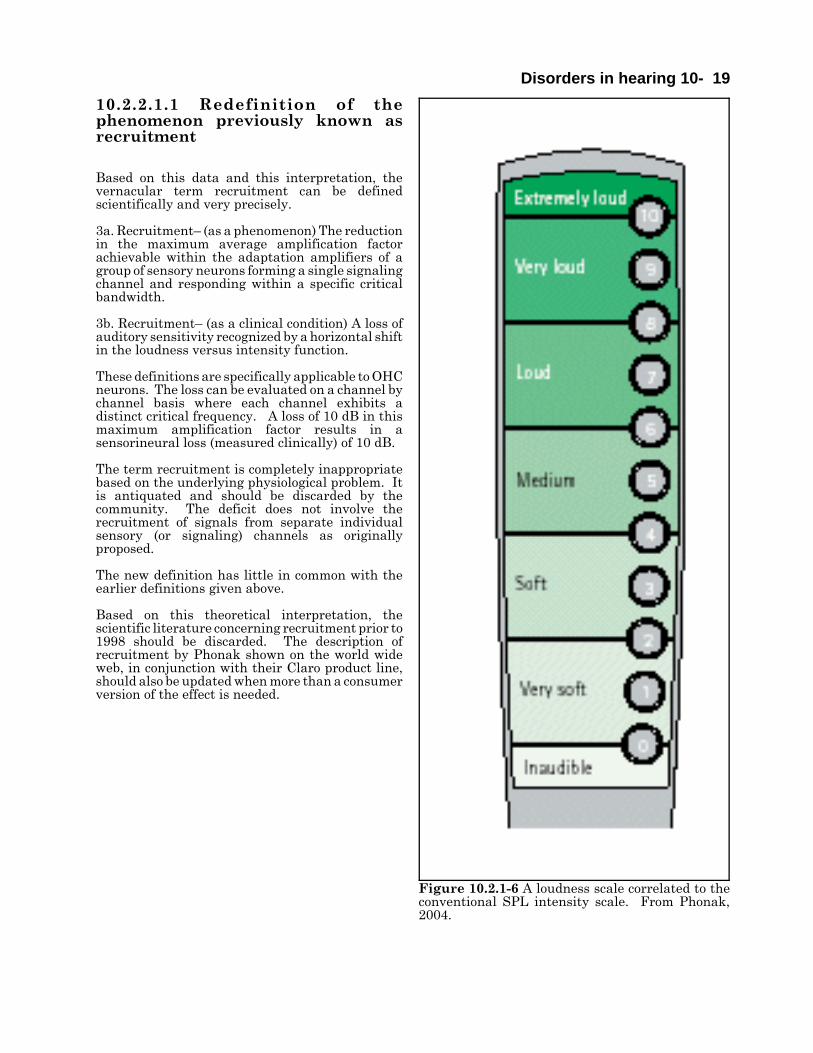
Figure 10.2.1-7 Conceptual forms of loudnessrecruitment EMPTY ADD.
[xxx what to do with this figure ]Figure 10.2.1-7 illustrates the possible forms of recruitment. The upper frame shows the generalsituation as proposed by this theory. The lower frame shows an expanded view of the region between thepresumed noise floor and hypertopic operation.
10.2.2.1.2 Potential causes of XXX aliasRecruitment
The potential causes of sensorineural hearing lossof the type previously associated with the concept ofrecruitment. can be described based on theElectrolytic Theory of the Neuron and theassociated model. It involves the partial tocomplete failure of the gain mechanism associatedwith (at least) the OHC sensory neurons. It islikely the loss is also found among the IHC. Twoprimary causes of the problem are readilyidentified. The first would involve a physicaldeformation (primarily thickening, of the type 2dendroplasm in the immediate vicinity of eachstereocilia of the sensory neuron. This couldinvolve the replacement of the triglyceride moleculenormally found there with one of greater axiallength. This would entail a genetic code-basedchange that is unlikely to occur in mid to laterlifetimes.
The second likely cause involves a change in theelectrical potential supplied to the collector fo theActiva of the adaptation amplifier within eachsensory neuron. This failure can be caused by several changes in the metabolic system supporting theelectrostenolytic process on the surface of the type 2 dendroplasm. Currently, they can only be placed inan un-ordered list.
1. Isolation of the stereo-specific electrostenolytic sites due to occupation by “foreign” molecules.
2. Insufficient concentration of the neuro-facilitator, glutamic acid, in the perilymph fluid supplying thesensory neurons.
3. Excessive concentration of the neuro-inhibitor, GABA, in the perilymph fluid supplying the sensoryneurons.
4. The presence of other neuro-inhibitors within the perilymph.
The cause of the incorrect chemical concentrations can obviously be referred back along the cardiovascularsupply chain to the blood stream.
10.2.2.2 Minimally invasive data on human hearing losses
Yoshie and Ohashi have obtained minimally intrusive data reflecting the cumulative static performanceof the human hearing modality at the pedicle of the sensory neurons to clicks24. Unfortunately, theirnotation is dated. They describe the signals they recorded as consisting of action potentials (which have
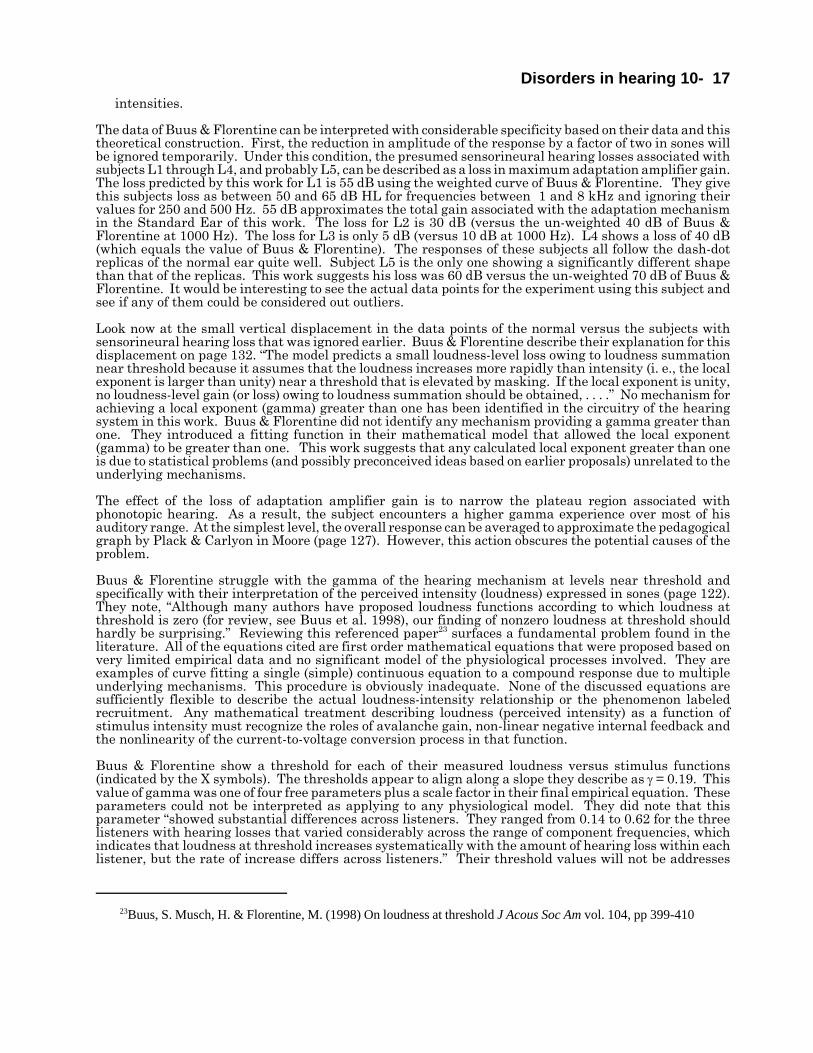
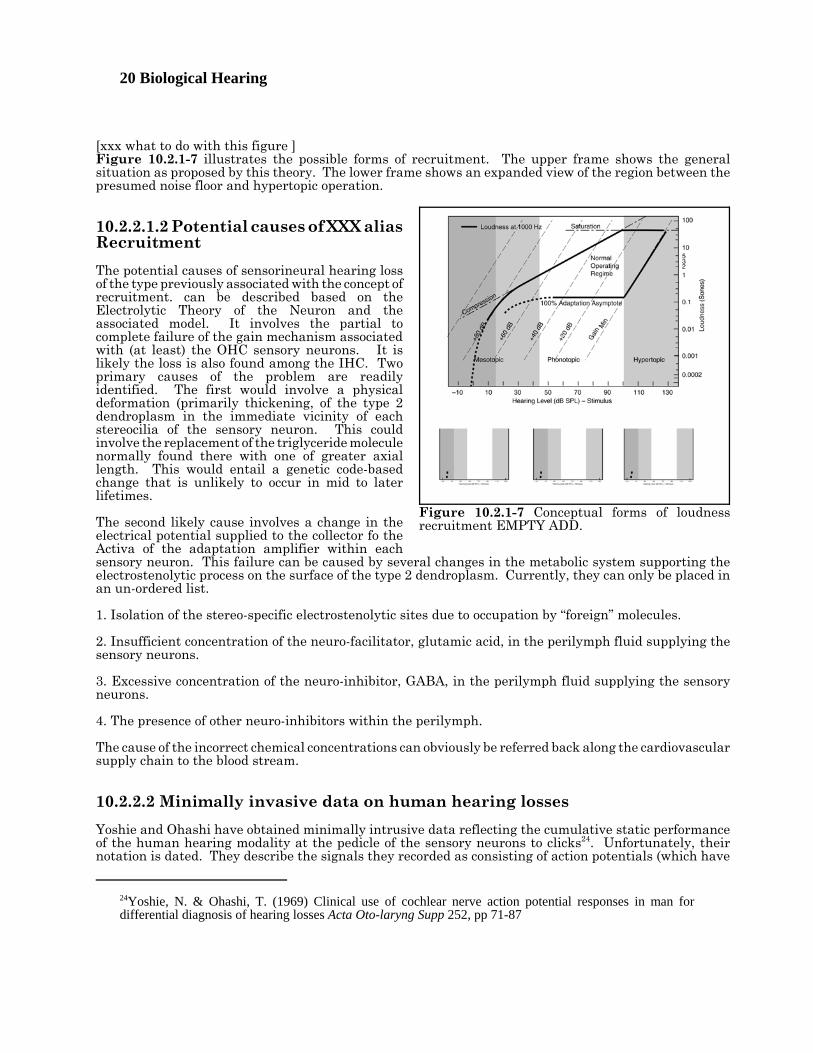
Disorders in hearing 10- 21constant amplitude). Their data actually reflects the generator potential at the pedicles of the sensoryneurons upon excitation. Their latency data is also based on the clinical protocol of measuring delay to thetop of the waveform instead of to the beginning of the response (as in the relevant physiology andmathematics). Their data was collected by averaging the responses to 500 clicks at each intensity level inorder to isolate the low signal level from the high background. Figure 10.2.1-8 illustrates their data withadditional annotation.
The upper dotted line labeled A.F. represents asubject with normal hearing. It has been overlaidby a diode characteristic and two lines with slopesof 1.0 and 0.3. Together, they illustrate that thenormal first order human generator responsefollows the diode characteristic proposed as the loadimpedance of the sensory neuron distributionamplifier. The response also exhibits a slope in the1.0-1.5 region for stimulus intensities below 45 dBSPL and a slope in the region of 0.3 for stimulusintensities above 45 dB SPL. The response clearlyexhibits a slope associated with recruitment bymany in the clinical community. However, it is anormal feature of all auditory systems.
As noted in Section 5.5xxx, the absolutemagnitudes shown on the ordinate are not reliablebecause they vary with the precise location of thesensing electrode. However, it is interesting tonote the similarity of the response of Y. S. (dashedline) to that of A.F. The loss appears to be a pureamplification loss of 29 dB occurring before thediode element in the circuit.
Interpretation of the other subjects is more difficultfrom this figure. Yoshie & Ohashi indicate they allrepresent sensorineural hearing losses. However,the curves do not extend to high enough levels toconfirm the ultimate shape of their responses. Thecurves appear to follow a diode characteristic untilthey begin to show an even more severe saturationat high levels. This would be the expected result ifthe distribution amplifier Activa went intosaturation earlier than expected. Such a conditioncould occur if the active area of the base of theActiva was reduced. It may also be associated witha higher than normal emitter potential in the distribution amplifier. This condition could be caused by achange in the common emitter impedance shared with the adaptation amplifier. The conditions in thisfigure do not suggest a bias error between the pedicles of the sensory neurons and their orthodromicsynapses.
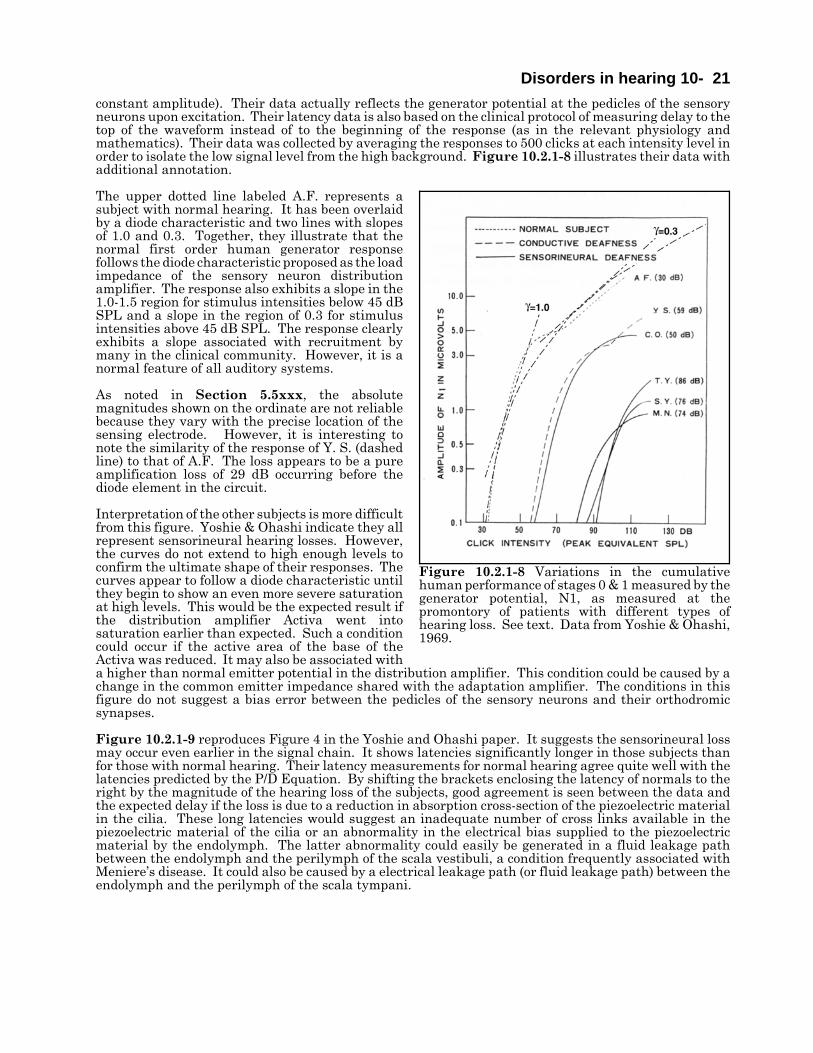
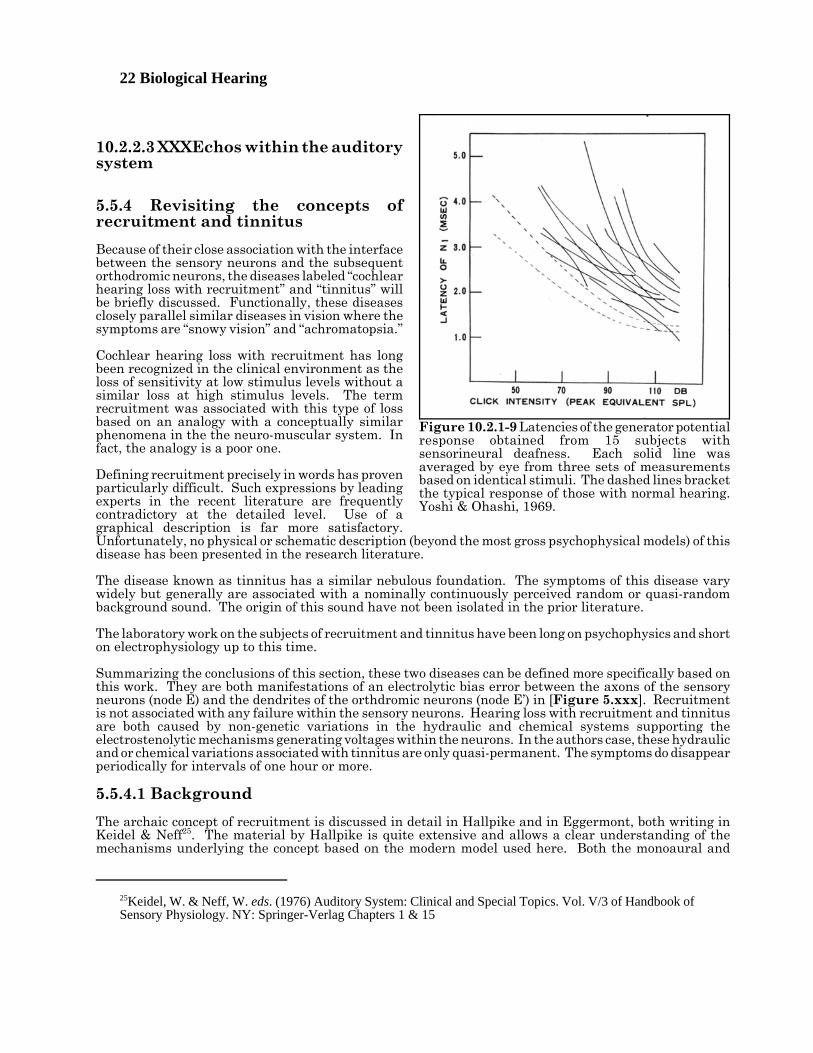
Figure 10.2.1-9 reproduces Figure 4 in the Yoshie and Ohashi paper. It suggests the sensorineural lossmay occur even earlier in the signal chain. It shows latencies significantly longer in those subjects thanfor those with normal hearing. Their latency measurements for normal hearing agree quite well with thelatencies predicted by the P/D Equation. By shifting the brackets enclosing the latency of normals to theright by the magnitude of the hearing loss of the subjects, good agreement is seen between the data andthe expected delay if the loss is due to a reduction in absorption cross-section of the piezoelectric materialin the cilia. These long latencies would suggest an inadequate number of cross links available in thepiezoelectric material of the cilia or an abnormality in the electrical bias supplied to the piezoelectricmaterial by the endolymph. The latter abnormality could easily be generated in a fluid leakage pathbetween the endolymph and the perilymph of the scala vestibuli, a condition frequently associated withMeniere’s disease. It could also be caused by a electrical leakage path (or fluid leakage path) between theendolymph and the perilymph of the scala tympani.
Figure 10.2.1-8 Variations in the cumulativehuman performance of stages 0 & 1 measured by thegenerator potential, N1, as measured at thepromontory of patients with different types ofhearing loss. See text. Data from Yoshie & Ohashi,1969.
22 Biological Hearing
25Keidel, W. & Neff, W. eds. (1976) Auditory System: Clinical and Special Topics. Vol. V/3 of Handbook ofSensory Physiology. NY: Springer-Verlag Chapters 1 & 15
10.2.2.3 XXXEchos within the auditorysystem
5.5.4 Revisiting the concepts ofrecruitment and tinnitus
Because of their close association with the interfacebetween the sensory neurons and the subsequentorthodromic neurons, the diseases labeled “cochlearhearing loss with recruitment” and “tinnitus” willbe briefly discussed. Functionally, these diseasesclosely parallel similar diseases in vision where thesymptoms are “snowy vision” and “achromatopsia.”
Cochlear hearing loss with recruitment has longbeen recognized in the clinical environment as theloss of sensitivity at low stimulus levels without asimilar loss at high stimulus levels. The termrecruitment was associated with this type of lossbased on an analogy with a conceptually similarphenomena in the the neuro-muscular system. Infact, the analogy is a poor one.
Defining recruitment precisely in words has provenparticularly difficult. Such expressions by leadingexperts in the recent literature are frequentlycontradictory at the detailed level. Use of agraphical description is far more satisfactory.Unfortunately, no physical or schematic description (beyond the most gross psychophysical models) of thisdisease has been presented in the research literature.
The disease known as tinnitus has a similar nebulous foundation. The symptoms of this disease varywidely but generally are associated with a nominally continuously perceived random or quasi-randombackground sound. The origin of this sound have not been isolated in the prior literature.
The laboratory work on the subjects of recruitment and tinnitus have been long on psychophysics and shorton electrophysiology up to this time.
Summarizing the conclusions of this section, these two diseases can be defined more specifically based onthis work. They are both manifestations of an electrolytic bias error between the axons of the sensoryneurons (node E) and the dendrites of the orthdromic neurons (node E’) in [Figure 5.xxx]. Recruitmentis not associated with any failure within the sensory neurons. Hearing loss with recruitment and tinnitusare both caused by non-genetic variations in the hydraulic and chemical systems supporting theelectrostenolytic mechanisms generating voltages within the neurons. In the authors case, these hydraulicand or chemical variations associated with tinnitus are only quasi-permanent. The symptoms do disappearperiodically for intervals of one hour or more.
5.5.4.1 Background
The archaic concept of recruitment is discussed in detail in Hallpike and in Eggermont, both writing inKeidel & Neff25. The material by Hallpike is quite extensive and allows a clear understanding of themechanisms underlying the concept based on the modern model used here. Both the monoaural and
Figure 10.2.1-9 Latencies of the generator potentialresponse obtained from 15 subjects withsensorineural deafness. Each solid line wasaveraged by eye from three sets of measurementsbased on identical stimuli. The dashed lines bracketthe typical response of those with normal hearing.Yoshi & Ohashi, 1969.
Disorders in hearing 10- 23
26Harrison, R. (1988) The Biology of Hearing and Deafness. Springfield, Il: Charles C. Thomas pp 353-35527Allen, J. (1997) Derecruitment by multiband compression in hearing aids In Jesteadt, W. ed. Modelingsensorineural hearing loss. Mahwah, NJ: Lawrence Erlbaum Assoc. pp 99-11228Neely, S. & Allen, J. (1997) Relation between the rate of growth of loudness and the intensity DL In Jesteadt,W. ed. Modeling sensorineural hearing loss. Mahwah, NJ: Lawrence Erlbaum Assoc. pp 213-22129Buus, S. & Florentine, M. (2001) Growth of loudness in listeners with cochlear hearing losses: recruitmentreconsidered JARO vol 3, pp 120-13930Florentine, M. & Buus, S. (2002) It’s not your father’s recruitment: a new view of loudness growth incochlear hearing loss. Abstract in J Acoust Soc Am vol 111(5), p 2353
binaural aspects of recruitment are discussed. [Xxx add words based on Hallpike figures.]
Eggermont, writing in 1976 asserted, recruitment is the abnormally rapid increase in the loudnesssensation with increase in intensity of an acoustic signal.
Harrison has also discussed recruitment briefly26. [xxx not very important unless I find other pages onsubject ]
Allen provides an alternate historical review of recruitment27. The first page of his material provides adifferent perspective on recruitment versus the common wisdom. It is in consonance with that providedhere. He notes the shaky introduction of the concept in the 1930's and says it is “generally misdefinedas the abnormally rapid growth of loudness. It is not well known that “loudness” in sones does not growmore rapidly in the recruiting ear; rather, it is the “loudness-level” in phons that grows more rapidly.” Tojustify this statement, he proceeds to define his terms in a less than simple manner. Subsequent materialin the Allen paper relies upon the conventional wisdom regarding the sensory neurons and is not supportedhere. His assertions in the caption to figure 6.4 requires further discussion. “The belief that the loudnessslope in the damaged ear is greater led to the belief that the JND in the damaged ear should be smaller.Both conclusions are false.” He defends his position based on his simulation of the psychophysical situationand an interesting observation; the algebraic difference between two pairs of real positive numbers isalways smallest for the pair with the smaller maximum number [algebra 101]. However, the ratio betweenthe same two pair of numbers is largest for the pair with the smaller maximum number. Two questionsarise. First, are algebraic differences or ratios are of primary interest in hearing? The empirical work ofFletcher and his contemporaries were clearly based on ratios. Second, should the sone be defined inalgebraic units or in dB? The assertion in the final paragraph of the paper is far from accepted by thosesuffering from the disease and from those studying the auditory system.
Neely & Allen put another face on the subject in the same volume28. They expand the framework byintroducing the term “loudness recruitment” and exploring the relationship between this term and the justnoticeable difference (JND) in normal and diseased systems. Initially, it must be noted that they madeno effort to empirically determine the location of the dominant noise source in the hearing modality. Theanalysis of this work suggests the signal processing neuron orthodromic to each sensory neuron presentsa threshold that limits the lowest perceived level of hearing while simultaneously preventing the lowerlevel noise contribution from the sensory neuron being passed up the auditory signaling chain. Becauseof this threshold, the dominant noise contribution to the system originates in the decoding circuit, generallyassociated with a stellate neuron, in stage 3. It is this source that establishes the JND in the healthysystem. The JND of systems exhibiting the symptoms of tinnitus is controlled by a different noise source.The source becomes the internal noise associated with the sensory neuron.
In their last paragraph, they drew a specific conclusion. “Loudness recruitment should not be defined as‘a more rapid growth in loudness.’ Loudness recruitment represents a loss of the dynamic-rangecompression normally provided by outer hair cells.” This conclusion is inherently based on the assumptionthat the outer hair cells are active moto-neurons rather than sensory neurons. In fact, both the inner haircells and the outer hair cells incorporate the logarithmic conversion of current to voltage that is interpretedas dynamic-range compression in their analysis. Their final sentence addresses the question of how thesone is defined. “This results in a steeper log-loudness slope; however, it does not imply that the impairedear has a steeper loudness slope (with loudness plotted on a linear coordinate, ed.) when the comparisonis made at the same intensity.”
Buus & Florentine reviewed the argument over loudness change based on inadequate agreement ondefinition in 200129. Buus & Florentine have continued the debate over the definition of recruitment30.
24 Biological Hearing
31Moore, B. (2004) Testing the concept of softness imperception: loudness near threshold for hearing-impairedears J Acoust Soc Am vol 115(6), pp 3103-311132Heinz, M. Issa, J. & Young, E. (2005) Auditory-nerve rate responses are inconsistent with commonhypotheses for the neural correlates of loudness recruitment JARO vol 6, pp 91-10533Moore, B. & Glasberg, B. (2004) A revised model of loudness perception applied to cochlear hearing lossHear Res vol 188, pp 70-8834Moore, B. * Glasberg, B. (1997) A model of loudness perception applied to cochlear hearing loss AuditNeurosci vol 3, pp 289-311
They maintain, “listeners with cochlear hearing losses not only have reduced dynamic range of audibility;they also have reduced dynamic range of loudness.”
Moore entered this discussion by testing the Buus & Florentine proposal according to his understanding.He asserts that their proposed “softness imperception” is not realized31. “The results show that, for levelsvery close to absolute threshold, a given SL leads to approximately the same loudness for an ear with ahearing impairment at the test frequency and an ear with normal hearing at the test frequency.” “Thisoccurs for Sls in the imparied ear up to 4-10 dB, depending on the subject. For Sls above 4-10 dB in animpaired ear, the rate of growth of loudness with increasing level is greater than normal; this is the mainbasis of the loudness-recruitment effect.”
The problem with this tempest in a teapot is that the different groups are talking about different situationsand frequently do not define their terms and framework adequately. The sensory modalities of biology allface wide ranges of signal intensity in their environments and have been designed specifically to handlethis range. As a result, they contain an intrinsic logarithmic transformer plus a number of adaptiveelements. Even using this transformer, the range of signals is large with respect to the dynamic range ofthe individual neurons. As a result, virtually all of the neurons operate under large signal conditions.Nonlinear operation, signal compression and saturation are to be expected within the system. Toappreciate the performance of these systems requires the use of logarithmic scaling in most descriptionsof their performance. In the logarithmic environment, it is the ratio of two signals that is most oftenrelevant. In the rare case where small signals are of primary interest, it is easy to use the mathematicalapproximation relating small arguments of a logarithm to the logarithm of that argument. The proposalby Allen that the loudness slope, dL/dI plotted against logI, should be used rather than the conventionald(logL)/d(logI) plotted against logI appears to offer little. The lower right frame of his figure 13.1 does showthe conventional slope is continuing to rise near 0 dB SPL in the normal system, as predicted by thistheory. His function can be overlaid with the same exponential used to describe the diode at the axon ofthe sensory neuron. It is this exponential function that defines the phenomenon associated with the termrecruitment. No other mechanism is required. The slopes (local exponents) of 1.25 and 1.31 noted by Buus& Florentine for those with and without hearing loss both correspond to a stimulus of about 20 dB SL andtheir difference is probably not statistically relevant.
With the above considerations in mind, a stimulus consisting of a stair step waveform where the ratio ofthe stimulus level of one step to the next is a fixed value is preferred.
The following material will demonstrate that the slope of the perceived intensity, or loudness, in sones indB as a function of the stimulus in dB SPL is finite at and near threshold and that this slope is higher thanthe slope in regions of higher stimulus level due to the compression normally encountered. This effect isdefined by the logarithmic relationship between the stimulus and the loudness, or perceived intensity. Theslope of the response in the impaired ear is typically similar to that of the unimpaired ear near threshold.
Heinz et al. have recently provided an extensive paper on hearing loss and recruitment in cats32. It isimportant to note they equate noise induced hearing loss (NIHL) with sensorineural hearing loss (SNHL).This places an inappropriate limitation on the scope of SNHL. They also rely upon the common frequency(or rate) histogram which distorts their data at the detailed level (Section xxx).
Moore & Glasberg have written extensively on the disease associated with the label recruitment. However,their work has been limited to abstract mathematical models describing their conceptualization of themechanisms involved33. The 2004 paper, and its predecessor34, have employed the concepts of broad filters
Disorders in hearing 10- 25
35Trobe, J. (2001) The Neurology of Vision. NY: Oxford University Press pg 36936Fletcher, H. (xxx) Speech and Hearing in Communications. NY: Van Nostrand
within the system first studied by Zwicker. Unfortunately, they did not localize these filters or explain howthe narrow bandwidth of the individual sound channels described by others are obtained. They did notean unusual feature of these filters and reference Zwicker & Fastl, 1990. The masking noise, whichostensibly defines the filter, is effective in masking the signal frequency even when the signal frequencyis several octaves higher than the masker frequency. This feature is key to understanding the correlationmechanism found within stage 4 of hearing (Chapter 8).
The above researchers have not defined a viable physical or physiological model of the cochlear partition.
5.5.4.2 Framework for discussion of hearing abnormalities
The neurology community has separated the types of sensory system failures into those that are organicand those that are nonorganic35. Organic failures are either anatomic or chemical. Nonorganic areassociated with psychiatric or behavioral symptoms untraceable to anatomic or chemical problems. Thissegregation leaves a large range of problems associated with electrophysiological abnormalities withouta home. Additional classifications relating to failures at the molecular level (frequently genetic in origin),involving chemical transport (frequently a hydraulic problem), or involving electrical circuit failures areneeded.
The hearing community has segregated hearing failures in to what are called conductive hearing loss andneural hearing loss. The simple analogy is that conductive losses occur in the acousto-mechanical portionof the system prior to any neural activity while neural losses occur within the neural system. Theconductive losses are frequently associated with signal amplitude losses independent of the frequency.Unfortunately, the largest potential losses in both the acousto-mechanical signal level and theelectrophysiological signal amplitude occur within the sensory neurons. Segregation of hearing losses intoconductive losses and neural losses does not result in independent sets.
The ISO has now defined the sone as a unit of loudness or psychologically perceived intensity in a Standard(ISO Resolution 131-1959). One sone is defined at 1000 Hz as 40 dB above threshold. The loudnessfunction (in sones) is defined as the sound pressure raised to the power of 0.6 for intensities above 40 dB(above threshold). Therefore, at 70 dB above threshold, the loudness is ten sones. Below 40 dB, theexponent varies significantly. This definition is restricted to the applicable region of Steven’s Law. A moreprecise definition would follow Fechner’s (logarithmic) Law without restriction as to source intensity level.
This work defines the loudness level, in phons, in object space as the sound pressure at a given frequencythat equals the sound pressure of a 1000 Hz tone of specified SPL as perceived by a standard human ear.If the given frequency is 1000 Hz, the loudness level in phons equals the Standard Pressure Level in dB.This definition follows Fletcher, although the reader is cautioned that his paper contains a remarkablenumber of typographical errors and inconsistencies36.
5.5.4.3 Threshold level hearing losses
Figure 10.2.2-1 describes the clinically recorded condition known as recruitment. The data in the middleand lower frames was obtained at 1000 Hz. Note the labels on the left frame in the middle row. Theydescribe the major functional operating regimes of normal hearing. The nominal operating system operatesat full amplification throughout the region below 45 dB SPL. However, below about 15 dB SPL, thenominal system is performance limited by noise introduced in the later stages of the system (nominallystage 3). Between 0 and 45 dB, the system normally operates at constant amplification. As a result, theinternal signal level increases in proportion to the stimulus level. Above 45 dB, the system introducescompression into the signal stream by at least two separate mechanisms. The sensitivity of thepiezoelectric transducer is reduced in proportion to the stimulus level and the diode load of the distributionamplifier further compresses the largest signal amplitudes. This is the phonotopic operating regime wheresignals are perceived as increasing only slowly in intensity as the stimulus level increases. Above 90-100dB SPL, the amplification available within the sensory neurons reaches a minimum and the system goesinto an advanced stage of saturation. The system encounters considerable distortion in this hypertopicregime.
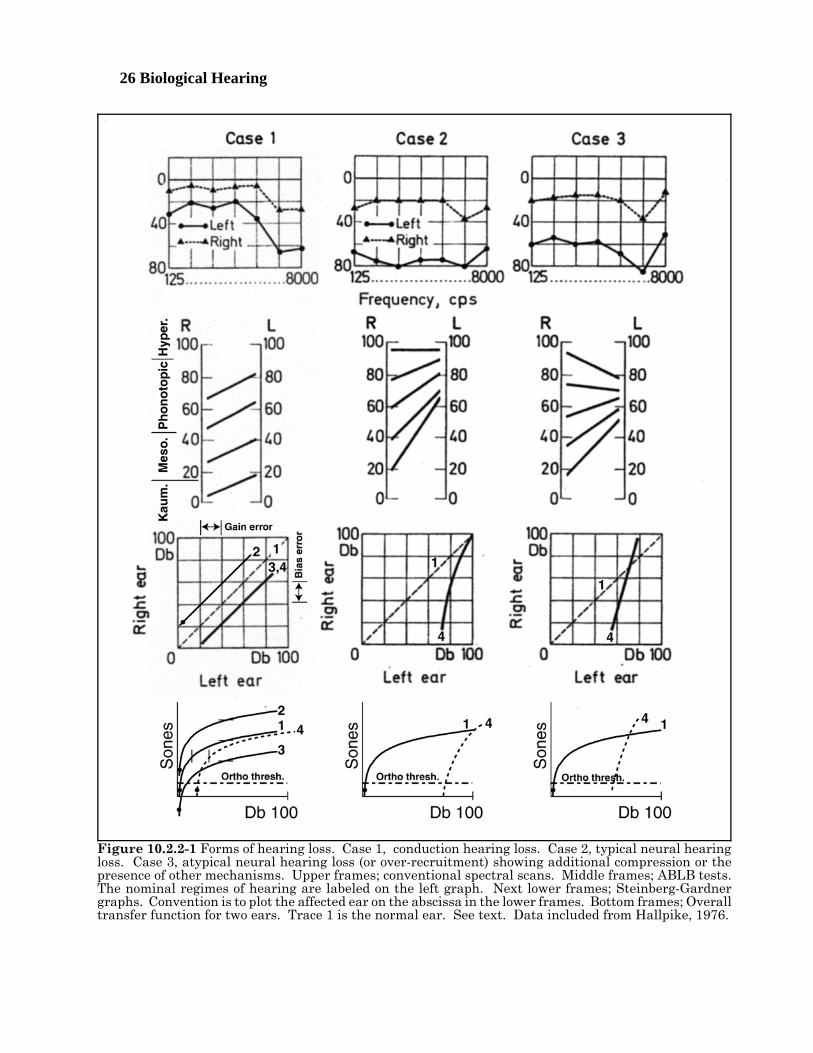
26 Biological Hearing
Figure 10.2.2-1 Forms of hearing loss. Case 1, conduction hearing loss. Case 2, typical neural hearingloss. Case 3, atypical neural hearing loss (or over-recruitment) showing additional compression or thepresence of other mechanisms. Upper frames; conventional spectral scans. Middle frames; ABLB tests.The nominal regimes of hearing are labeled on the left graph. Next lower frames; Steinberg-Gardnergraphs. Convention is to plot the affected ear on the abscissa in the lower frames. Bottom frames; Overalltransfer function for two ears. Trace 1 is the normal ear. See text. Data included from Hallpike, 1976.
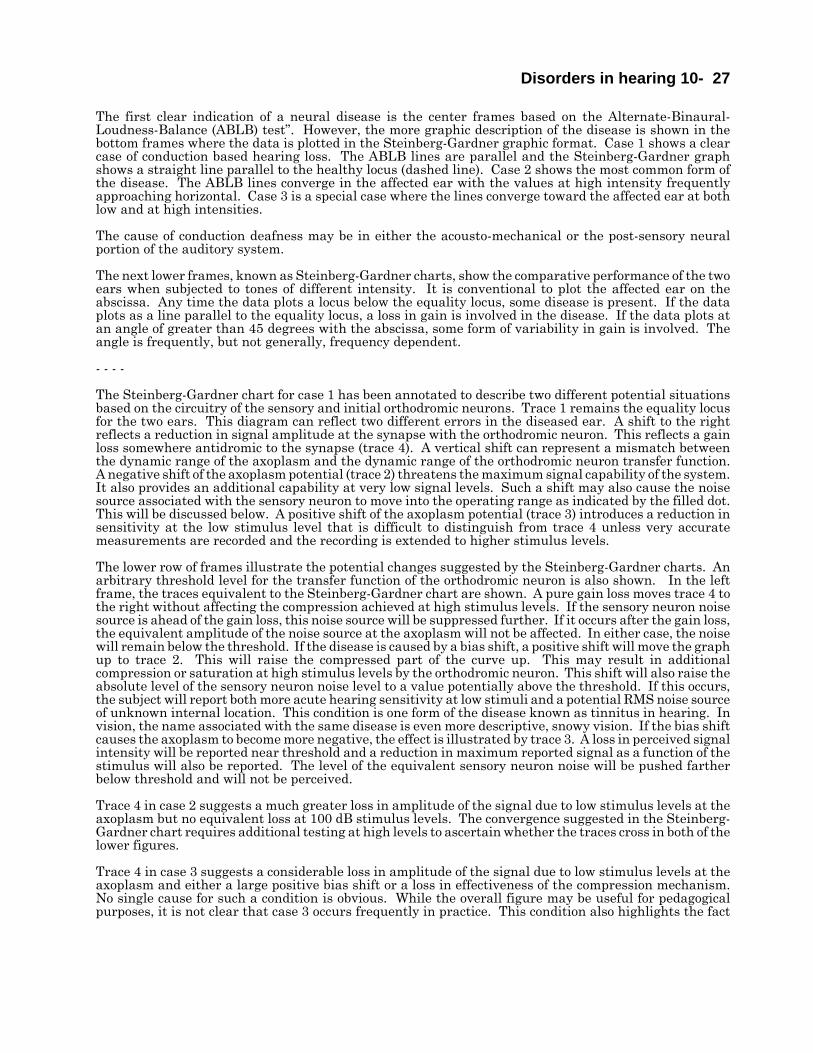
Disorders in hearing 10- 27
The first clear indication of a neural disease is the center frames based on the Alternate-Binaural-Loudness-Balance (ABLB) test”. However, the more graphic description of the disease is shown in thebottom frames where the data is plotted in the Steinberg-Gardner graphic format. Case 1 shows a clearcase of conduction based hearing loss. The ABLB lines are parallel and the Steinberg-Gardner graphshows a straight line parallel to the healthy locus (dashed line). Case 2 shows the most common form ofthe disease. The ABLB lines converge in the affected ear with the values at high intensity frequentlyapproaching horizontal. Case 3 is a special case where the lines converge toward the affected ear at bothlow and at high intensities.
The cause of conduction deafness may be in either the acousto-mechanical or the post-sensory neuralportion of the auditory system.
The next lower frames, known as Steinberg-Gardner charts, show the comparative performance of the twoears when subjected to tones of different intensity. It is conventional to plot the affected ear on theabscissa. Any time the data plots a locus below the equality locus, some disease is present. If the dataplots as a line parallel to the equality locus, a loss in gain is involved in the disease. If the data plots atan angle of greater than 45 degrees with the abscissa, some form of variability in gain is involved. Theangle is frequently, but not generally, frequency dependent.
- - - -
The Steinberg-Gardner chart for case 1 has been annotated to describe two different potential situationsbased on the circuitry of the sensory and initial orthodromic neurons. Trace 1 remains the equality locusfor the two ears. This diagram can reflect two different errors in the diseased ear. A shift to the rightreflects a reduction in signal amplitude at the synapse with the orthodromic neuron. This reflects a gainloss somewhere antidromic to the synapse (trace 4). A vertical shift can represent a mismatch betweenthe dynamic range of the axoplasm and the dynamic range of the orthodromic neuron transfer function.A negative shift of the axoplasm potential (trace 2) threatens the maximum signal capability of the system.It also provides an additional capability at very low signal levels. Such a shift may also cause the noisesource associated with the sensory neuron to move into the operating range as indicated by the filled dot.This will be discussed below. A positive shift of the axoplasm potential (trace 3) introduces a reduction insensitivity at the low stimulus level that is difficult to distinguish from trace 4 unless very accuratemeasurements are recorded and the recording is extended to higher stimulus levels.
The lower row of frames illustrate the potential changes suggested by the Steinberg-Gardner charts. Anarbitrary threshold level for the transfer function of the orthodromic neuron is also shown. In the leftframe, the traces equivalent to the Steinberg-Gardner chart are shown. A pure gain loss moves trace 4 tothe right without affecting the compression achieved at high stimulus levels. If the sensory neuron noisesource is ahead of the gain loss, this noise source will be suppressed further. If it occurs after the gain loss,the equivalent amplitude of the noise source at the axoplasm will not be affected. In either case, the noisewill remain below the threshold. If the disease is caused by a bias shift, a positive shift will move the graphup to trace 2. This will raise the compressed part of the curve up. This may result in additionalcompression or saturation at high stimulus levels by the orthodromic neuron. This shift will also raise theabsolute level of the sensory neuron noise level to a value potentially above the threshold. If this occurs,the subject will report both more acute hearing sensitivity at low stimuli and a potential RMS noise sourceof unknown internal location. This condition is one form of the disease known as tinnitus in hearing. Invision, the name associated with the same disease is even more descriptive, snowy vision. If the bias shiftcauses the axoplasm to become more negative, the effect is illustrated by trace 3. A loss in perceived signalintensity will be reported near threshold and a reduction in maximum reported signal as a function of thestimulus will also be reported. The level of the equivalent sensory neuron noise will be pushed fartherbelow threshold and will not be perceived.
Trace 4 in case 2 suggests a much greater loss in amplitude of the signal due to low stimulus levels at theaxoplasm but no equivalent loss at 100 dB stimulus levels. The convergence suggested in the Steinberg-Gardner chart requires additional testing at high levels to ascertain whether the traces cross in both of thelower figures.
Trace 4 in case 3 suggests a considerable loss in amplitude of the signal due to low stimulus levels at theaxoplasm and either a large positive bias shift or a loss in effectiveness of the compression mechanism.No single cause for such a condition is obvious. While the overall figure may be useful for pedagogicalpurposes, it is not clear that case 3 occurs frequently in practice. This condition also highlights the fact
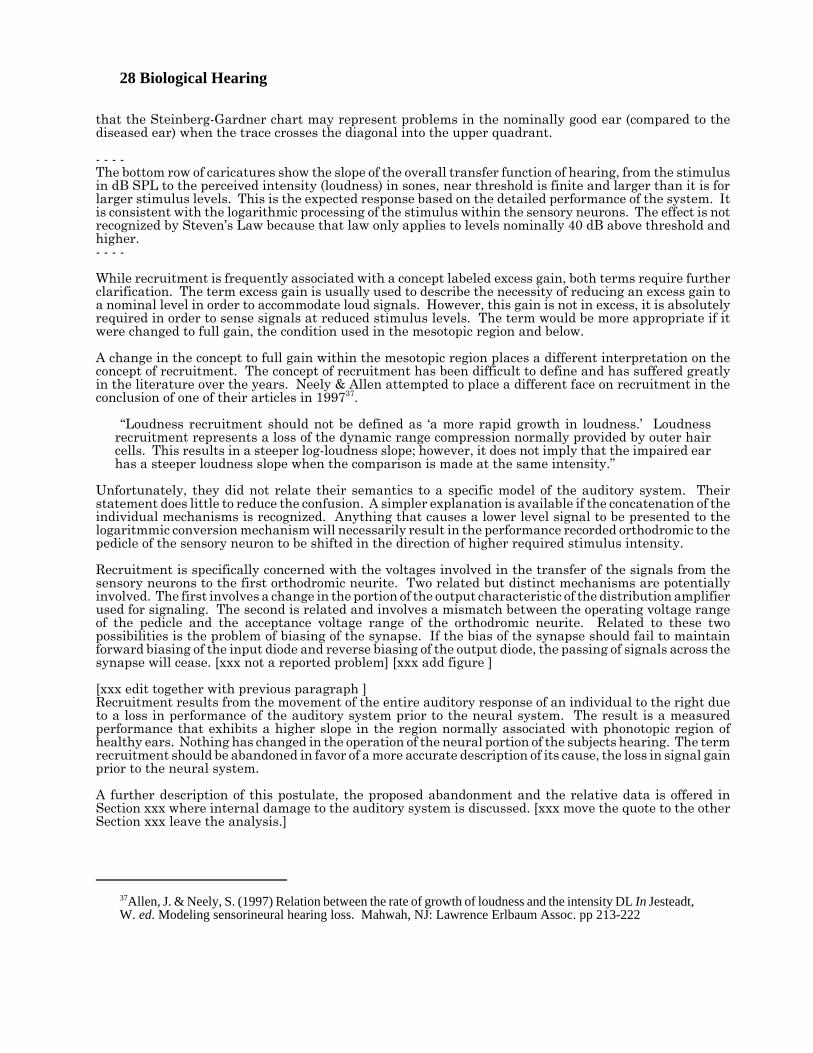
28 Biological Hearing
37Allen, J. & Neely, S. (1997) Relation between the rate of growth of loudness and the intensity DL In Jesteadt,W. ed. Modeling sensorineural hearing loss. Mahwah, NJ: Lawrence Erlbaum Assoc. pp 213-222
that the Steinberg-Gardner chart may represent problems in the nominally good ear (compared to thediseased ear) when the trace crosses the diagonal into the upper quadrant.
- - - -The bottom row of caricatures show the slope of the overall transfer function of hearing, from the stimulusin dB SPL to the perceived intensity (loudness) in sones, near threshold is finite and larger than it is forlarger stimulus levels. This is the expected response based on the detailed performance of the system. Itis consistent with the logarithmic processing of the stimulus within the sensory neurons. The effect is notrecognized by Steven’s Law because that law only applies to levels nominally 40 dB above threshold andhigher.- - - -
While recruitment is frequently associated with a concept labeled excess gain, both terms require furtherclarification. The term excess gain is usually used to describe the necessity of reducing an excess gain toa nominal level in order to accommodate loud signals. However, this gain is not in excess, it is absolutelyrequired in order to sense signals at reduced stimulus levels. The term would be more appropriate if itwere changed to full gain, the condition used in the mesotopic region and below.
A change in the concept to full gain within the mesotopic region places a different interpretation on theconcept of recruitment. The concept of recruitment has been difficult to define and has suffered greatlyin the literature over the years. Neely & Allen attempted to place a different face on recruitment in theconclusion of one of their articles in 199737.
“Loudness recruitment should not be defined as ‘a more rapid growth in loudness.’ Loudnessrecruitment represents a loss of the dynamic range compression normally provided by outer haircells. This results in a steeper log-loudness slope; however, it does not imply that the impaired earhas a steeper loudness slope when the comparison is made at the same intensity.”
Unfortunately, they did not relate their semantics to a specific model of the auditory system. Theirstatement does little to reduce the confusion. A simpler explanation is available if the concatenation of theindividual mechanisms is recognized. Anything that causes a lower level signal to be presented to thelogaritmmic conversion mechanism will necessarily result in the performance recorded orthodromic to thepedicle of the sensory neuron to be shifted in the direction of higher required stimulus intensity.
Recruitment is specifically concerned with the voltages involved in the transfer of the signals from thesensory neurons to the first orthodromic neurite. Two related but distinct mechanisms are potentiallyinvolved. The first involves a change in the portion of the output characteristic of the distribution amplifierused for signaling. The second is related and involves a mismatch between the operating voltage rangeof the pedicle and the acceptance voltage range of the orthodromic neurite. Related to these twopossibilities is the problem of biasing of the synapse. If the bias of the synapse should fail to maintainforward biasing of the input diode and reverse biasing of the output diode, the passing of signals across thesynapse will cease. [xxx not a reported problem] [xxx add figure ]
[xxx edit together with previous paragraph ]Recruitment results from the movement of the entire auditory response of an individual to the right dueto a loss in performance of the auditory system prior to the neural system. The result is a measuredperformance that exhibits a higher slope in the region normally associated with phonotopic region ofhealthy ears. Nothing has changed in the operation of the neural portion of the subjects hearing. The termrecruitment should be abandoned in favor of a more accurate description of its cause, the loss in signal gainprior to the neural system.
A further description of this postulate, the proposed abandonment and the relative data is offered inSection xxx where internal damage to the auditory system is discussed. [xxx move the quote to the otherSection xxx leave the analysis.]
Disorders in hearing 10- 29
Loudness is a psychophysical perception related to the intensity of a stimulus.
The intensity of the stimulus is defined in engineering units. This intensity is specified in terms of theabsolute intensity scale (not power ) and known as the specific pressure level (SPL) relative to an intensityof 20 micro-Pascal.
Volume is a measurement of the intensity of the stimulus.
The relationship between the loudness (perceived intensity) and the actual applied intensity as a functionof frequency was first described in 1927-29. The fundamental relationship is that at threshold level. Thisrelationship is reproduced faithfully within the mesotopic region. However, the relationship becomes timedependent as well as frequency dependent in the phonotopic region. It is greatly distorted in the hypertopicregion. Iso-loudness levels are given using a phon scale based on the threshold level as a reference. Theydescribe the intensity of two or more tones that will be perceived as equal in loudness. This relationshipis a complex one. For tones separated in frequency by more than a specific percentage, different OHC andsignaling channels will be excited. As a result, the tones will be subject to different levels of adaptationbased on events immediately prior to the test. In addition, the level of the tones will be perceiveddifferently in the mesotopic region than in the phonotopic region.
During the 1950's high quality audio amplifiers, such as those made by Harmon-Kardon, providedboth a volume control and a loudness compensation control on their front panels. The manufacturerrecognized that the distance of the listener from the speakers introduced a variable in the perceivedsound.
[xxx Work in Allen pg 99 in Jesteadt ‘97 on “de-recruitment” ]
5.5.4.3 xxx (aka recruitment) is a definable disease
[xxx broaden the following ]Figure 10.2.2-2 describes the source of the disease known as recruitment. The lower portion of the figureshows a simplified circuit diagram at the output of the sensory neurons; the distribution amplifier on theleft, the orthodromic neuron on the right, and the intervening synapse acting as a virtual diode. Tomaintain a signal path through the synapse, it is absolutely mandatory that the emitter to base potential,EEB, be positive at all times. Since the neural circuitry is direct coupled and uses distributed powersupplies, the impedance between the local grounds, RG, is critical to the operation of this interface.
The upper portion of the figure describes the output characteristic of the distribution amplifier (upper left)under two bias conditions, and the transfer characteristic of the orthodromic neuron (upper right) alsounder two conditions. The voltage scales in the middle of the upper portion are defined as relative. Theabsolute potentials of these two elements are critically important to the operation of the overall circuit. The convention of using a sine wave is followed in this figure as it allows easier understanding of anydistortions involved. Except at stimulus frequencies well below the integration frequency of the neuron,the actual signal is the envelope of the stimulus.
The waveform of example #1 represents the nominal operating condition for the system. The currentthrough the collector of the distribution amplifier is shown as 15 pA. The output at upper right is a goodfacsimile of the input at lower left. On the other hand, example #2 shows two potential problems. First,at the nominal current of 33 pA, the transfer function exhibits a nominal slope of 1.0 instead of the typical0.3. This results in a considerably larger output voltage amplitude at the collector than otherwise expected(a hallmark of the disease called recruitment). As a result, part of the signal voltage waveform is outsideof the acceptance range of the transfer function of the orthodromic neuron. The result is considerabledistortion in the output waveform at the collector of this neuron.
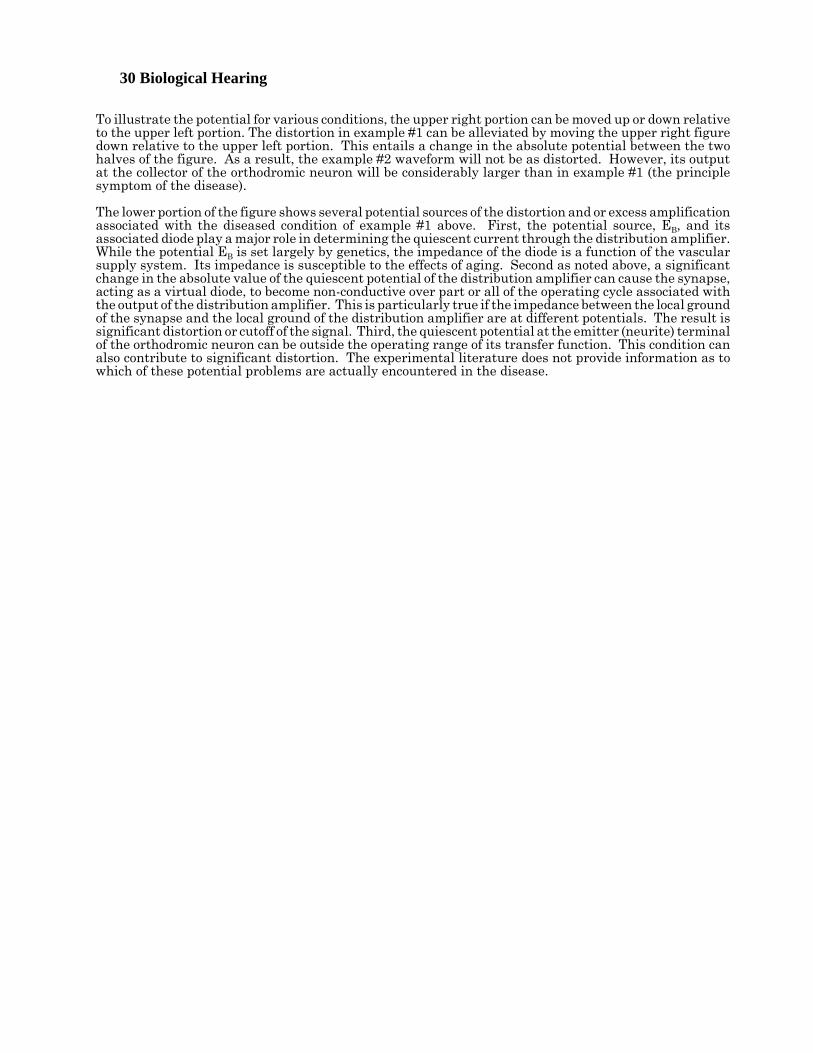
30 Biological Hearing
To illustrate the potential for various conditions, the upper right portion can be moved up or down relativeto the upper left portion. The distortion in example #1 can be alleviated by moving the upper right figuredown relative to the upper left portion. This entails a change in the absolute potential between the twohalves of the figure. As a result, the example #2 waveform will not be as distorted. However, its outputat the collector of the orthodromic neuron will be considerably larger than in example #1 (the principlesymptom of the disease).
The lower portion of the figure shows several potential sources of the distortion and or excess amplificationassociated with the diseased condition of example #1 above. First, the potential source, EB, and itsassociated diode play a major role in determining the quiescent current through the distribution amplifier.While the potential EB is set largely by genetics, the impedance of the diode is a function of the vascularsupply system. Its impedance is susceptible to the effects of aging. Second as noted above, a significantchange in the absolute value of the quiescent potential of the distribution amplifier can cause the synapse,acting as a virtual diode, to become non-conductive over part or all of the operating cycle associated withthe output of the distribution amplifier. This is particularly true if the impedance between the local groundof the synapse and the local ground of the distribution amplifier are at different potentials. The result issignificant distortion or cutoff of the signal. Third, the quiescent potential at the emitter (neurite) terminalof the orthodromic neuron can be outside the operating range of its transfer function. This condition canalso contribute to significant distortion. The experimental literature does not provide information as towhich of these potential problems are actually encountered in the disease.
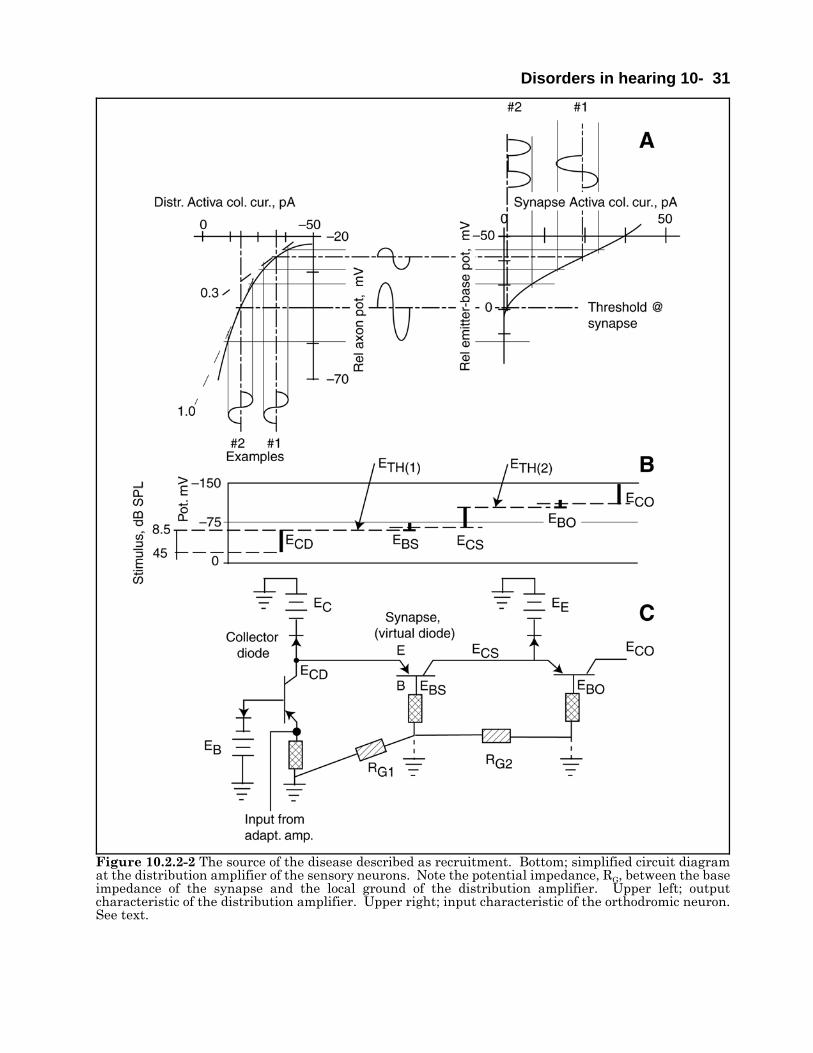
Disorders in hearing 10- 31
Figure 10.2.2-2 The source of the disease described as recruitment. Bottom; simplified circuit diagramat the distribution amplifier of the sensory neurons. Note the potential impedance, RG, between the baseimpedance of the synapse and the local ground of the distribution amplifier. Upper left; outputcharacteristic of the distribution amplifier. Upper right; input characteristic of the orthodromic neuron.See text.
32 Biological Hearing
38Lee, K. (1989) Textbook of Otolaryngology and Head and Neck Surgery NY: Elsevier pp 106-10939Sidtis, J. (1988) Dichotic listening after commissurotomy In Hugdahl, K. ed. Handbook of Dichotic Listening:Theory, Methods and Research NY: Wiley pp161-184
10.3 Sensorineural disorders related to frequency
10.4 Sensorineural disorders related to pharmacology
Damage to the hearing system based on inappropriate pharmacology is difficult to quantify. Severalfamilies of widely used pharmaceuticals are known to adversely affect the hearing system when used athigh dosage. However, the definition of high is unclear. The family of aminoglycosides is of particularconcern38. These are the -mycins of pharmacology. Their value in medicine is great. However, theototoxicity of streptomycin was first reported in 1945, shortly after its development. Neomycin has a welldocumented and marked ototoxicity potential.
The ototoxicity potential of aspirin has been recognized since its introduction in 1899. 10.5 Selected results of surgical intervention
10.5.1 Effect of total commissurotomy EMPTY
Sidtis has provided a summary of the effect of surgical severing of the corpus callosum on human hearing39.The results appear very similar to the effect on vision.
The discussion in Sidtis is based on the conventional wisdom; that all of the interconnections between thetwo hemispheres are via the corpus callosum. As shown in Section xxx and in “Processes In BiologicalVision,” this is not the case, especially for the more important information processed probably exclusivelyin the diencephalon. This material is shared between the two halves of the pulvinar via the corpusprincipia. Such neural pathways are not affected by a commissurotomy. Sidtis did not address the roleof the diencephalon and the corpus principia in hearing.
The Sidtis material is well organized. As a result, he uncovered a variety of peculiarities not explainedsatisfactorily by the conventional wisdom. As he noted, “With respect to auditory function, unilateraltemporal lobe damage does not result in deafness in one ear nor does it result in sensory deficits analogousto the scotomas or hemianopsias than may be observe with lesions to the primary geniculo-striatal visualsystem.” The first point emphasizes the secondary role of the temporal lobes in extracting informationrelated to hearing. The role of these lobes is focused more on the quality and the coloring of the auditorystimulus than on the abstract information it carries. The extraction of the more important informationis carried out within the diencephalon. The second point is probably stated too broadly. While a scotomaof either lateral geniculate nucleus, LGN, typically affects either the left or right half of the peripheral fieldof vision, it does not cause major loss of vision relative to the foveola. As in hearing, the more criticalportion of visual information extraction is carried out within the pulvinar and perigeniculate nuclei, PGN,of the diencephalon. Area 17 of the cerebral cortex is usually associated with his reference to the striatedarea. This area plays a role analogous to the role the temporal lobes play in hearing. It is now documentedthat total functional loss of this so-called primary visual area of the cortex does not result in totalblindness. Such a loss is functionally similar to that documented by Sidtis for the temporal lobes anddescribed above.
Quoting Sidtis again, “After commissurotomy, verbal report of stimuli presented monaurally to either earis typically normal.” He describes the more complex effects when the stimuli are presented to subjectsdichotically. At that point, the term paradoxical enters his discussion. This suggests a lack of an adequatemodel underlying the remainder of his discussion. In fact, he introduces a series of rhetorical questionsas subject headings. He says, “Unfortunately there is little or no direct data on the variability of callosalauditory function in humans.” The paper concludes with some excellent data on psychophysical
Disorders in hearing 10- 33
40DiGiovanni, J. (2008) Hearing Aid Handbook: 2008-2009. Clifton Park, NY: Delmar41- - - - (1983) Cochlear Prostheses: An International Symposium. Ann New York Acad Sci vol 405
experiments using complex speech as a stimulus.
10.6 Auditory prosthetic devices up to 2009
White, et. al. {analog multichannel cochlear prosthetics }
Loeb 85
[xxx page 168-169 of Roederer on potential uses of a prosthesis containing a programmable randommemory capable of sending signals down a particular lead to the auditory nerve ].
- - - - -
The auditory community has investigated prosthetic devices focused on three discrete points of incursioninto the system;
1. Augmentation of the overall system through amplification and signal shaping prior to stage 0 (externalhearing aids).
2. Introduction of electrically simulated signals prior to stage 2 using cochlear implants
3. Introduction of electrically simulated signals following stage 2 and before stage 4 using electricallysimulated signals applied to the brainstem.
All of these approaches have suffered from a lack of an adequate schematic and circuit model of theauditory modality. This fact is epitomized by the difficulty of compensating for the effect known as“recruitment” that is actually the natural logarithmic compression at the axon pedicle of the sensoryneurons.
While spectacular results have been obtained with implantable audio prostheses recently from the patientsperspective, it is still a very early day in the field. The devices take advantage of the easy physical accessto the scala tympani via the round window. The procedure is to introduce a long thin probe with electricalterminals placed periodically along its length. These terminals are used to apply a high electrical pulsebetween the individual terminals and a common ground, or between individual pairs of terminals. Thepulses are meant to shock the system and cause some response in the optic nerve.
10.6.1 Prostheses introduced at stages 0 & 1 EMPTY
Using electrical augmentation to hearing via fully functional hair cells is described as electrophonichearing by Hartmann and Kral (page224).
DiGiovanni has provided a catalog of virtually all commercially available stage 0 prostheses40.
10.6.2 The pre-stage 2 cochlear implant prosthesis
While a variety of cochlear implants have been rushed to market to satisfy a considerable patient demandfor the devices, the field is only beginning to emerge from a long period of exploratory research. As of 2009,not a single cochlear implant has been designed based on an adequate knowledge of the auditory modalityto insure operational success.
10.6.2.1 An annotated history of cochlear prosthetic devices
The New York Academy of Science provided a special edition of their journal on this subject in 198341.
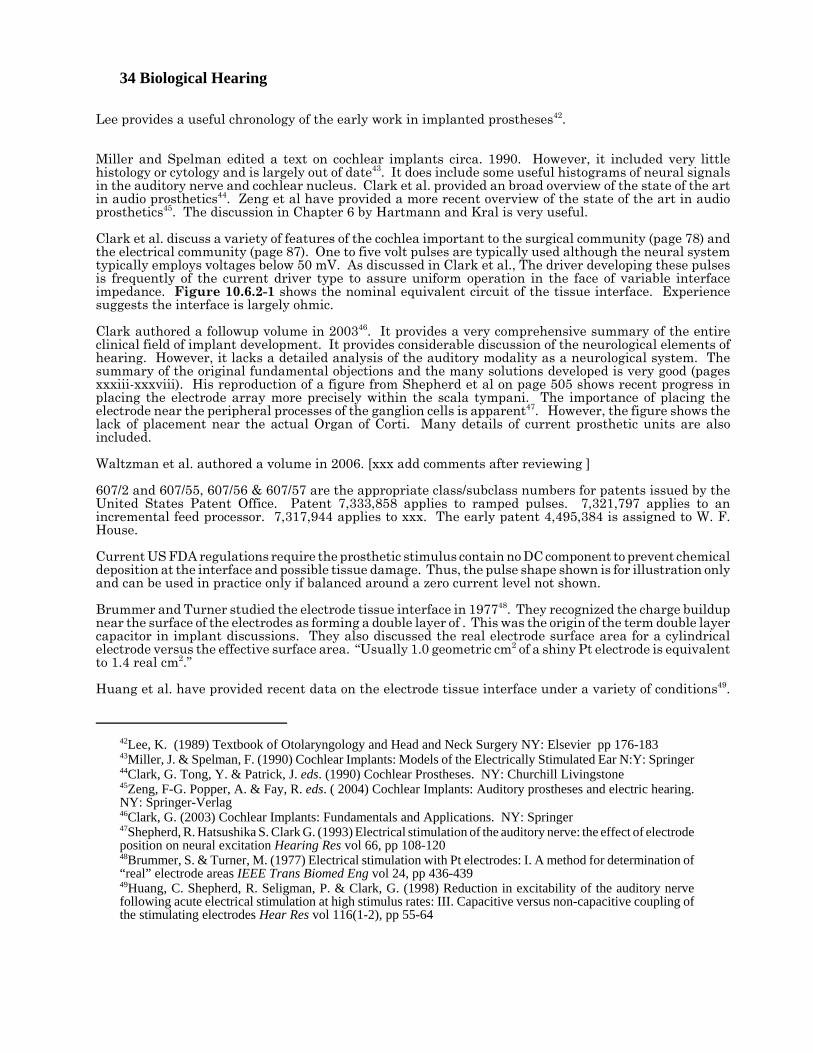
34 Biological Hearing
42Lee, K. (1989) Textbook of Otolaryngology and Head and Neck Surgery NY: Elsevier pp 176-18343Miller, J. & Spelman, F. (1990) Cochlear Implants: Models of the Electrically Stimulated Ear N:Y: Springer44Clark, G. Tong, Y. & Patrick, J. eds. (1990) Cochlear Prostheses. NY: Churchill Livingstone45Zeng, F-G. Popper, A. & Fay, R. eds. ( 2004) Cochlear Implants: Auditory prostheses and electric hearing.NY: Springer-Verlag46Clark, G. (2003) Cochlear Implants: Fundamentals and Applications. NY: Springer47Shepherd, R. Hatsushika S. Clark G. (1993) Electrical stimulation of the auditory nerve: the effect of electrodeposition on neural excitation Hearing Res vol 66, pp 108-12048Brummer, S. & Turner, M. (1977) Electrical stimulation with Pt electrodes: I. A method for determination of“real” electrode areas IEEE Trans Biomed Eng vol 24, pp 436-43949Huang, C. Shepherd, R. Seligman, P. & Clark, G. (1998) Reduction in excitability of the auditory nervefollowing acute electrical stimulation at high stimulus rates: III. Capacitive versus non-capacitive coupling ofthe stimulating electrodes Hear Res vol 116(1-2), pp 55-64
Lee provides a useful chronology of the early work in implanted prostheses42.
Miller and Spelman edited a text on cochlear implants circa. 1990. However, it included very littlehistology or cytology and is largely out of date43. It does include some useful histograms of neural signalsin the auditory nerve and cochlear nucleus. Clark et al. provided an broad overview of the state of the artin audio prosthetics44. Zeng et al have provided a more recent overview of the state of the art in audioprosthetics45. The discussion in Chapter 6 by Hartmann and Kral is very useful.
Clark et al. discuss a variety of features of the cochlea important to the surgical community (page 78) andthe electrical community (page 87). One to five volt pulses are typically used although the neural systemtypically employs voltages below 50 mV. As discussed in Clark et al., The driver developing these pulsesis frequently of the current driver type to assure uniform operation in the face of variable interfaceimpedance. Figure 10.6.2-1 shows the nominal equivalent circuit of the tissue interface. Experiencesuggests the interface is largely ohmic.
Clark authored a followup volume in 200346. It provides a very comprehensive summary of the entireclinical field of implant development. It provides considerable discussion of the neurological elements ofhearing. However, it lacks a detailed analysis of the auditory modality as a neurological system. Thesummary of the original fundamental objections and the many solutions developed is very good (pagesxxxiii-xxxviii). His reproduction of a figure from Shepherd et al on page 505 shows recent progress inplacing the electrode array more precisely within the scala tympani. The importance of placing theelectrode near the peripheral processes of the ganglion cells is apparent47. However, the figure shows thelack of placement near the actual Organ of Corti. Many details of current prosthetic units are alsoincluded.
Waltzman et al. authored a volume in 2006. [xxx add comments after reviewing ]
607/2 and 607/55, 607/56 & 607/57 are the appropriate class/subclass numbers for patents issued by theUnited States Patent Office. Patent 7,333,858 applies to ramped pulses. 7,321,797 applies to anincremental feed processor. 7,317,944 applies to xxx. The early patent 4,495,384 is assigned to W. F.House.
Current US FDA regulations require the prosthetic stimulus contain no DC component to prevent chemicaldeposition at the interface and possible tissue damage. Thus, the pulse shape shown is for illustration onlyand can be used in practice only if balanced around a zero current level not shown.
Brummer and Turner studied the electrode tissue interface in 197748. They recognized the charge buildupnear the surface of the electrodes as forming a double layer of . This was the origin of the term double layercapacitor in implant discussions. They also discussed the real electrode surface area for a cylindricalelectrode versus the effective surface area. “Usually 1.0 geometric cm2 of a shiny Pt electrode is equivalentto 1.4 real cm2.”
Huang et al. have provided recent data on the electrode tissue interface under a variety of conditions49.
Disorders in hearing 10- 35
50Black, R. & Clark, G. (1980) Differential electrical excitation of the auditory nerve J Acoust Soc Am vol67(3), pp 868-874
They quantify the damage inherent in DC stimulation.
This network represents a volumetric impedance.Charge injected into the tissue has been found tospread significantly according to Black and Clark50.Their studies were of a simple resistor-onlyequivalent network that did not represent theheterogenous nature of the cochlear partition well.More recent data appears in the special edition ofEar & Hearing, vol 23(1), 2002. The data appearsclear that the inserted electrode array should hugthe surface of the basilar membrane immediatelybelow Corti’s tunnel. to be close to the first Nodes ofRanvier or other ganglion neuron components.This presumes it is the first Node of Ranvier is ofprimary efficacy because of its unmyelinated pre-nodal axon. Figures 2.3.4–3 through 2.3.4–5 detailthis area. Based on the theory of this work, thearray should be as close as possible to the firstNodes, individually located directly below both theIHC and the OHC, and always before the habenulaperforata (the area labeled “d” in the figure ofShepherd et al.). Placing the array between thehabenula perforata and the area closest to themodiolus reduces the effectiveness of thestimulation. This is shown for the “bipolar”configuration of Shepherd et al. where a currentnearly an order of magnitude less is required in thearea labeled “dendritic” versus other areas in thescala tympani to cause an evoked brainstemresponse.
The challenge of transmitting the sensed signals through the skin to the implanted circuitry was a problemin the early days but has now been largely resolved using inductive techniques.
Several signal generation strategies have been developed and implemented (see Wilson in Zeng, et. al. fora review). No significant attempts to emulate the encoded pulse streams normally generated by ganglionneurons has been reported in the literature to date.
Clark reviewed, “Feature extraction: for and against” in 1990 (page 54). He compared the speech featureextraction and presentation approach (using vocoder principles) versus the maximum signal informationapproach (using multiple band pass filters). The features involved were typically the first formant (F1) andsecond formant (F2) with the option of including an estimate of the fundamental frequency of the speaker(F0).
Clark’s assertion related to the feature extraction approach, “Each selected feature is then separately codedin a way that is known to be robust in transmission through the neural interface and into the perceptualsystem of the implantee.” is open to considerable argument. In fact, the neural interface using amplitudemodulated pulses was entirely non-functional. Later investigators accepted the fact the feature extractionapproach failed. The end-to-end emulation of the implant and the implantee presented by Blamey et alin 1984 in no way represented a realistic situation as suggested by Clark (page 58). As Wilson notes inZeng, et. al. (2004, page 40), “All present processing strategies for cochlear implants use a “filter-bank” or“waveform” approach. Explicit extraction and representation of specific features of speech was abandonedin the early 1990s.”
Gantz, Turner & Gfeller have addressed the virtue of implanting an electrode array in those subjects with
Figure 10.6.2-1 Equivalent circuit of prosthesis-tissue interface. The electrode voltage is shown fora square current pulse, i. Va represents dissipationacross the resistor Ra. Modified from Clark et al.,1990.
36 Biological Hearing
51Gantz, B. Turner, C. & Gfeller, K. (2006) Acoustical and electrical speech processing In Waltzman, S. &Roland, J. eds. Cochlear Implants, 2nd Ed.. NY: Thieme Chapter 1952Turner, C. Gantz, B. Vidal, C. Behrens, A. & Henry, B. (2004) Speech recognition in noise for coclearimplant listeneres: beefits of residual acoust hearing J Acoust Soc Am vol 115, pp 1729-173553Edwards, B. (2004) Hearing aids and hearing impairment In Greenberg, S. Ainsworth, W et al. eds. SpeechProcessing in the Auditory System. NY: Springer Chap 754Clark, C. ( 2004) Cochlear Implants In Greenberg, S. Ainsworth, W et al. eds. Speech Processing in theAuditory System. NY: Springer Chap 855Drennan, W. & Rubinstein, J. (2006) Sound processors in cochlear implants In Waltzman, S. & Roland, J.eds. Cochlear Implants, 2nd Ed.. NY: Thieme page 44
some residual hearing51. Writing in 2006, they note the limited spectral resolution achieved with currentelectrode arrays. They developed a short electrode array that was initially placed in the basal turn toaugment the subjects residual low frequency hearing. A complaint was the perceived augmentation wastoo high pitched and even unpleasant. Subsequent testing placed a 6-element, 10 mm long augmentationarray farther into the cochlear partition. The authors provide their views concerning the performanceachieved. They stress the need of surgeons to preserve any residual hearing available to the subject whenproviding an augmented capability.
Gantz, Turner & Gfeller appear to have demonstrated the ability to excite the higher frequency (basal)OHC neurons as well as the basal IHC. Their work also suggests it is important to excite the basal IHCto achieve good temporal performance while it is more important to excite the mid-range OHC to achievegood mid frequency (1500-6000 Hz) tonal performance52.
- - - - -Edwards has recently provided another review of the exploited technology approaches53. He focuses on thedesign of the various applications rather than discussing the hearing mechanism or its failings that arethe subject of auditory loss compensation. Edwards noted, “A more important factor has been the absenceof a scientific consensus on precisely what a hearing aid should do to properly compensate for a hearingloss.”
Graeme Clark has provided a discussion of cochlear implants in the same volume54. This discussion alsoavoids discussing the physiology of the Organ of Corti and concentrates on the circuitry chosen for the losscompensation device. No discussion of the geometry of the electrode bundle inserted into the ScalaTympani was provided.
As a result of the above strategies, the subject tends to perceive sound as if it were generated by non-voicedutterances (from shocking the temporal IHC channels) accompanied by tonal artifacts (from shocking thetonal OHC channels). It is not clear whether the artificial signals stimulate the sensory neurons or theganglion neurons of the cochlear nerve. The very limited dynamic range encountered in practice (6-12 dB,Clark, et. al., pg 107) suggests the shock is effective in generating signals beyond the point of adaptation.It appears the shock primarily affects the ganglion neurons or one of the Nodes of Ranvier associated withthose ganglion neurons.
The current used in the early Clark work resulted in charge densities of up to 25.7 μC/cm2 geom. per phase(page 86). Several recent units capable of generating up to 914 μC/cm2 geom. per phase (Clark, 2003, page490). More recent investigations have used bipolar excitation with the charge limited to xxx in accordancewith FDA guidelines.
A major problem of cochlear implants up to this time has been their inability to pass the temporal finestructure of acoustic waves needed for speech interpretation55. This work demonstrates that properstimulation to achieve this result requires precise electrode array placement and specific electricalstimulation waveforms.
Drennan and Rubenstein proposed three criteria for passing the fine structure in acoustic speech via animplant satisfactorily based on only their unstated conceptual model (page 44). The first is to use pulseexcitation at greater than 2000 pps. This work stresses the fact that exciting the neural system at pulserates greater than about 1000 pps is of negligible value. The normal action potential interval, actionpotential duration plus the following refractory period, leaves the regeneration of action potentials at rates
Disorders in hearing 10- 37
56Hartmann, R. & Kral, A. (2004) Central responses to electrical stimulation In Zeng, F-G. Popper, A. & Fay,R. eds. ( 2004) Cochlear Implants: Auditory prostheses and electric hearing. NY: Springer-Verlag page 236
significantly higher than 1000 pps very inefficient and undependable. Hartmann & Kral suggest the limitis closer to 600 pps56. The Drennan and Rubenstein discussion also suggests stochastic pulse firing withinthe neural system is useful. This work stresses the deterministic character of all (information carrying)neural pulses. The only action potentials in the neural system that appear to be non-deterministic arethose due to long step excitation applied to the low frequency encoding (ganglion) neurons. The result canbe multiple pulses indicating the duration of the excitation, not its intensity (See Section xxx).
10.6.2.2 The use of formant filters in previous implants
Speech processors were explored during the 1970's and 1980's that extracted formants from the appliedacoustic signals and then used signals based on those formants to drive multi-electrode arrays implantedin the cochlear partition. The features involved were typically the first formant (F1) and second formant(F2) of vocal signals with the option of including an estimate of the fundamental frequency of the speaker(F0). F1 and F2 were the most obvious spectral features of the signals within the lower frequenciesdisplayed in a spectrogram. Little effort was made to extract the variation in frequency of the individualformant versus time. The formant extractors were typically based on fixed filter characteristics.
As noted above, efforts to develop formant based speech processors ahead of an implanted electrode arraydissipated at the end of the 1980's. The reason was fundamental. The human auditory modalityincorporates a very sophisticated formant extraction mechanism as described in Section 9.xxx. The useof a crude formant extractor ahead of a frequency and temporally indiscriminate electrode array, basedprimarily on position within the cochlear partition, led to considerable confusion within the hearingmodality. The signals presented to the natural feature extraction correlator of the CNS did not resemblethe signals it was evolved over many millennia to process.
As a minimum, an auxiliary feature extractor, used to augment the natural feature extractor, mustmaintain the octave-based harmonic relationships of the original signal. It must also maintain the relativedelays associated with those harmonic relationships when reintroduced into the neural signaling system.Finally, the reintroduced signals must excite the appropriate frequency-based sensory channels based onthe signals frequency content. Finally, the auxiliary feature extractor must be able to reproduce thefrequency variations with time of the original formants. This requirement calls for the use of frequencytracking formant extractors as active filters in place of fixed bandwidth filters.
Otherwise the signals from the man-made feature extractor must be introduced at a point in the hearingmodality after the natural feature extractor of the perigeniculate nucleus (PGN). This will remain anunrewarding clinical approach for a long time, at least until we learn to understand the detailed outputof the natural feature extractor.
10.6.2.3 Signal compression in the analog circuitry of previous implants
Acoustic signal compression has been widely used in cochlear implants based on a fundamentally erroneousassumption.
The fundamental assumption has been that the neural signals of the auditory nerve are some form ofamplitude modulated representations of individual portions of the applied acoustic signals. In suchmodulation, the frequency of the signal is analogous to the frequency of the stimulus and the amplitudeof the signal is analogous to the amplitude of the stimulus. This is incorrect. The neural system employsa form of pulse position modulation where the amplitude of the pulses carries no information and the pulseinterval is proportional to the amplitude of the stimulant.
No information about the frequency of the stimulus is carried within the neural signaling channels.Frequency information is related to the place of the sensory neuron along the cochlear partition and theequivalent place of the delivery axon in the auditory correlator portion of the audio portion of theperigeniculate nucleus.
The fact that the experimentally verified susceptibility of the Nodes of Ranvier to amplitude variations(Section 10.xxx) is very limited provides two important pieces of information. First, it demonstrates the
38 Biological Hearing
57Hartmann, R. & Kral, A. (2004) Central responses to electrical stimulation In Zeng, F-G. Popper, A. & Fay,R. eds. ( 2004) Cochlear Implants: Auditory prostheses and electric hearing. NY: Springer-Verlag page 21958Chorost, M. (2005) Rebuilt : How Becoming Part Computer Made Me More Human. NY: Houghton-Mifflin59www.booktv.org Search for material by Chorost.60St. Clair, E. Golfinos, J. & Roland J. (2006) Auditory brainstem implants In Waltzman, S. & Roland, J. eds.Cochlear Implants. NY: Thieme Chapter 20
stimulation provided by laboratory probing and by early implants is affecting the signal regenerationNodes of Ranvier (subscripts labeled O,2 or I,2 and higher in [Figure 10.xxx ]) and not the signal encodingNodes of Ranvier (subscripts labeled O,1 or I,1 in [Figure 10.xxx ]). If the stimulation was affecting thesignal encoding NoR, the expected dynamic range of the circuit would be as large as the normal stimulusdynamic range (at least 30 dB) at the pedicle of the stage 1 sensory neurons. Hartmann and Kral definethis dynamic range as mostly between 20 to 60 dB57.
Second, it shows the signal regeneration Nodes of Ranvier are very efficient in their operation. Theyrequire only a small change in amplitude above their threshold value (less than a factor of two, 6 dB) togenerate a full amplitude action potential that is temporally correlated with the driving signal.
A compressed analog (CA) strategy is still available in many current commercial speech processorsdesigned to support implants (in the form of one of multiple software routines). The use of CA strategiesby patients has been limited in day-to-day usage.
10.6.2.4 The record of a cochlear implant prosthesis user
Chorost published a comprehensive book in 2005 on his experiences as an implant recipient58. One of hisinitial statements is striking and confirms the operating methodology described above. He noted thatduring his first session designed to interface the prosthesis to his neural system, he could clearly interpretthe ticking of a clock across the room. At the same time, the sounds and sentences presented by theaudiologist were completely un-interpretable. The prosthesis was obviously exciting the neurons associatedwith the temporal (LOC) channel of hearing. It may or may not have been exciting neurons of the tonal(MOC) channels. In his book, Mr. Chorost says he can now discriminate between tones with a frequencyspacing on the order of 30 Hz at 2,000 Hz, down from 70 Hz initially. Mr Chorost’s one-hour oralpresentation, as recorded by C-SPAN, is available for purchase or viewing over the internet59. His websiteis www.rebuilt-thebook.com
10.6.3 Prostheses introduced beyond stage 2 EMPTY
[xxx see chapter 20 in Waltzman & Roland ]
xxx Kuchta et. al. {multichannel brainstem implant.}
St. Clair, Golfinos & Roland have reported on efforts to provide a “brainstem implant” for those with severebilateral damage to the auditory nerve60. Their goal was to stimulate the cochlear nucleus (which is partof the brainstem). Their efforts employed an electrode structure that was laid upon the exterior of thecochlear nucleus. It excited a poorly defined portion of the cochlear nucleus. The results were of limitedvalue but showed feasibility of stimulation. Several undesireable side effects were noted with thisapproach.
Their discussion of the steps needed to achieve a degree of tonotopic stimulation in the future is useful.What they do not discuss is the multiple tonotopically and tempotopically oriented regions of the cochlearnucleus. These regions are tailored to support different feature extraction engines within the CNS asillustrated in Section 2.4.2. Thus, to avoid causing vertigo, anxiety and similar problems, it is importantthat only the appropriate neurons be stimulated. These are the neurons associated with the MOC pathand the awareness mode of hearing. The neurons associated with the alarm and source location tasksshould be avoided.
Conventional speech processors were modified for this application (although few details were provided).They also address the subject of non-auditory perceptions as a result of cochlear nucleus stimulation,
Disorders in hearing 10- 39including dizziness and other interferences with the vestibular signaling channels. On the order of 200patients have been treated with one or more of a variety of brainstem implants as of the article publicationdate.
10.7 Proposed future generation pre-stage 2 cochlear prostheses EMPTY
10.7.1 The state of the prosthesis art based on this work
The literature as of 2009 reports on efforts to build implantable prosthetic hearing devices designedwithout detailed knowledge of how to interface to the neural system of the hearing modality. As a result,the implantable devices have achieved a minimal level of performance primarily as a supplement to lipreading. While recipients are overjoyed by their ability to hear anything after implantation, their abilityto hear in the broader sense is not significantly increased.
The failure described above is highlighted by two events. First, the abandonment of efforts to useelectronic signal processing to optimize the interface with the neural system. Second the failure of multi-electrode interfaces spaced along the cochlear partition to achieve any significant perceived level of tonalhearing quality.
These failures are primarily due to four facts. 1. The researchers have failed to understand the transduction mechanism of the hearing modality. Inparticular,
A. They have failed to understand that the place-frequency relationship does not mean that acertain acoustic frequency is processed as an equivalent electrical frequency beginning at the sameplace. The “place” is mapped to the brain by anatomical computation. The only signal from thatplace represents the amplitude of the envelope of the acoustic signal measured at that point.
B. They have failed to recognize that there are two distinct groups of sensory neurons in hearing,the IHC (which are temporally selective) and the OHC (which are tonally selective).
2. They have failed to understand that no frequencies greater than 600-1000 Hz are passed from thesensory (stage 1) neurons to the signal projection (stage 3) neurons. The sensory neurons incorporate alow pass filter with a critical frequency of 600 Hz. 3. They have failed to appreciate that the maximum acoustic frequency that can be represented by thestage 3 signal projection neurons is less than 600 Hz (in accordance with Shannon’s Sampling Theorem).
4. The scale of the current man-made electrode arrays is not compatible with the scale of the auditorysensory mechanisms. Clark (page 508) shows a free-fitting silastic electrode carrier inserted into the scalatympani of a cat. The carrier fills the scala while the individual neurons are invisible (by at least a factorof ten) at the scale of the figure.
The diameters of the electrode arrays are typically 0.3 to 0.6 mm while the diameter of the neuronsthey are attempting to influence are typically 0.3 to 0.6 microns. As a result, the ratio of the size ofthe electrodes to the size of the neurons (1000:1) is like the size of a cottage to a key on a computerkeyboard (an order of magnitude worse than wearing boxing gloves while typing on a keyboard).
With measured fields with attenuation parameters measured in millimeters, exposing one thousandor more neurons to a single electrical pulse is a brute force approach. This is especially true sincethe pulse exhibits a single temporal characteristic while attempting to excite neurons wheretemporal differences of 0.01 seconds are important. With an octave represented by a distance ofnominally 2.3 mm along the partition, a single pulse can excite neural paths a full octave apart.
These represent formidable problems in prosthesis development. The ultimate goal will require severalmajor development cycles to approach a true prosthesis offering significant restoration of the hearingfunction. The community must adopt an entirely different model of the hearing modality if it hopes to aidthe profoundly deaf through the use of implantable prosthetic devices. Similarly, the electrode arrays mustmove from miniature wires grouped for insertion into the scala tympani, to microcircuits on substrates
40 Biological Hearing
61Shepherd, R. Hatsushika, S. Clark G. (1993) Electrical stimulation of the auditory nerve, the effect ofelectrode position on neural excitation Hear Res vol 66, pp 108-12062Drennan, W. & Rubinstein, J. (2006) Sound processors in cochlear implants In Waltzman, S. & Roland, J.eds. Cochlear Implants. NY: Thieme page 43
capable of positioning much closer to the tunnel of Corti. Closer positioning reduces the electrical fieldstrength, and hence charge required per unit area, to achieve stimulation of the desired neurons61.Individual wires of 25 micron diameter are used currently to provide the necessary flexibility in theimplant array. Printed wires on the order of five microns are easily achievable with current technology.
- - - - -
Several researchers have prepared lists of limitation on current cochlear implants. Most are poorlyconceived. The major limitation of cochlear implants listed by Drennan and Rubinstein in 2006 iserroneous62.
The current state of the art in implantable cochlear prosthetic devices is being limited by several falseassumptions.
1. The assumption that the individual neural channel must propagate both a frequency and amplitudeparameter to represent the signal applied to it. The brain relates the place of origin of the neural signalby means other than the information within the signal (just like a telephone mainframe identifies anincoming telephone pair by a physical label, not by the frequency and amplitude of the message content(or even an assigned telephone number).
The information carried by the auditory neuron, like all pulse neuron signals is propagated by pulse-to-pulse interval (PPI) modulation. The greater the stimulus amplitude, the shorter the intervalbetween pulses. Frequency modulation is a form of phase modulation, that is in turn a form of pulse-to-pulse interval modulation.
2. The assumption that the dynamic range available via implants is highly limited. This assumption isbased on the assumption that the amplitude of a stimulus is the variable parameter. In fact, it is the pulsefrequency of the action potentials that is the variable representing sound amplitude. This frequency variesbetween a low of about 10 pps and 500 pps. The system is pliable, it is the ratio between the two precedingpulse rates and not their absolute values that are important. The signal to noise in the channel is about30 dB or better and the dynamic range is about 50:1 on a logarithmic increment scale. All of the channelis available to a properly designed prosthetic device.
There are three distinct types of stage 3 circuits, the analog to pulse converters formed either withinthe ganglion neurons (or in their first Node of Ranvier in the case of hearing), the pulse repeatercircuits formed by all subsequent Nodes of Ranvier, and the pulse to analog converters described asstellate neurons in this work. The implant designer must determine whether he intends to excitean analog to pulse conversion circuit or a pulse repeater circuit. The signaling requirements aregrossly different. Past efforts have focused on exciting pulse repeater circuits. These circuits exhibita very narrow amplitude dynamic range (defined by their threshold sensitivity). Their mode ofsignaling is pulse frequency variation, not pulse amplitude variation.
3. The lack of ability of cochlear implants to pass the temporal fine structure of acoustic waves to theauditory nerve is another limitation. In fact, the cochlear implant is able to provide more fine structurethan the auditory nerve can process. However, it must do that with the proper phasing. The challengehere is to limit the longitudinal range of any stimulation applied by the implant.
10.7.1.1 Parametric limits on stimulation
A scala tympani electrode has to have a geometric shape and mechanical properties that enable thesurgeon to place contacts as close to excitable nerve structures as possible and avoid insults to the basilarpartition or to the bony spiral lamina.
Disorders in hearing 10- 41
63Clopton, B. Spelman, F. Glass, I. Pfingst, B. Miller, J. Lawrence, P. & Dean, D. (1983) Neural encoding ofelectrical signals Ann NY Acad Sci vol 405, pp 146-15864Brummer, S. Robblee, L. & Hambrecht, F. (1983) Criteria for selecting electrodes for electrical stimulation:Theoretical and practical considerations Ann NY Acad Sci vol 405, pp 159-17265Hochmair-Desoyer, I. Hochmair, E. & Burian, K. (1983) Design and fabrication of multiwire scala tympanielectrodes Ann NY Acad Sci vol 405, pp 173-18266White, R. Roberts, L. Cotter, N. & Kwon, O-H (1983) Thin-film electrode fabrication techniques Ann NYAcad Sci vol 405, pp 183-190
Clopton et al. have provided a summary of the literature circa 1983 that includes a variety of usefulcitations63. The following is from Brummer & Turner.
“An absolute limit on stimulus encoding is the charge density at which hydrogen is evolved at thesurface of the electrode. This has been estimated at 300 pC/cm2 per phase for platinum electrodes insimulated cerebrospinal fluid at 37 Celsius. This limit holds for the real surface area, which invariablyexceeds the geometric surface area. In our laboratory, spheres flamed at the ends of 1mil platinum-iridium wires show real surface areas of approximately 0.001 cm2 or greater. The gassing limitestimated for this surface area is 6.7 pA rms with 10-Hz stimulation increasing at 6 dB/octave withfrequency.”
Brummer, Robblee and Hambrecht have provided a good background on electrode selection criteriacirca 198364. Their data is all from non-biological solutions (1 N of HClO4) rather than actual tissue. They use a largely conceptual model of the neuron. They also assume it is the current passed throughneural tissue that affects the generation of action potentials by stage 3 neurons. This work proposesthe generation of action potentials at a Node of Ranvier by external means is controlled primarily bythe potential at the poditic terminal of the Node (Section xxx). Brummer, Robblee and Hambrechtprovide an annotate generic voltage characteristic for their electrode referenced to a reversiblehydrogen electrode (RHE).
Hochmair et al. have provided a good overview of molded electrode array design, stimulationperformance and surgical performance65.
White et al. have reported on a practical polyimide based flexible electrode leading to the moresophisticated next generation design using smaller contact areas and described below66.
10.7.2 A strategy for the next generation cochlear implant prosthesis
[xxx probably not looking far enough out ]The experience of the last 30 years should define the goals of a next generation cochlear implantprosthesis. The first requirement appears to be to provide a viable signal to the signal paths associatedwith the IHC neurons closest to the round window. This will provide at least an initial temporal signalto that system. The second, and probably lesser, requirement is to provide a viable signal to at least afew tonal channels associated with the OHC neurons. An ideal solution to this second requirementwould be to provide a series of tonal signals covering at least one octave of the musical scale. Analternate solution would be to provide a set of viable signals to OHC spaced by an octave plus one noteon the musical scale. This approach would require a longer, but more easily manufactured stimulusarray.
The operating block diagrams, circuit diagrams and figures 4.5.1–2, 4.3.3–6, 4.5.4–2, 4.6.1–2 & 6.1.1–2of this work should be reviewed before attempting to design the next generation cochlear implantprosthesis.These figures define an entirely different design philosophy for the implant and its interface with thenative neural circuits. A dual channel approach is optimum, exciting the appropriate sensory neuronsof the temporal signaling subsystem and the appropriate sensory neurons of the tonal signalingsubsystem.
Chapter 14 of Clark, 2003, should also be reviewed for thoughts about the future from otherinvestigators with more direct laboratory experience.
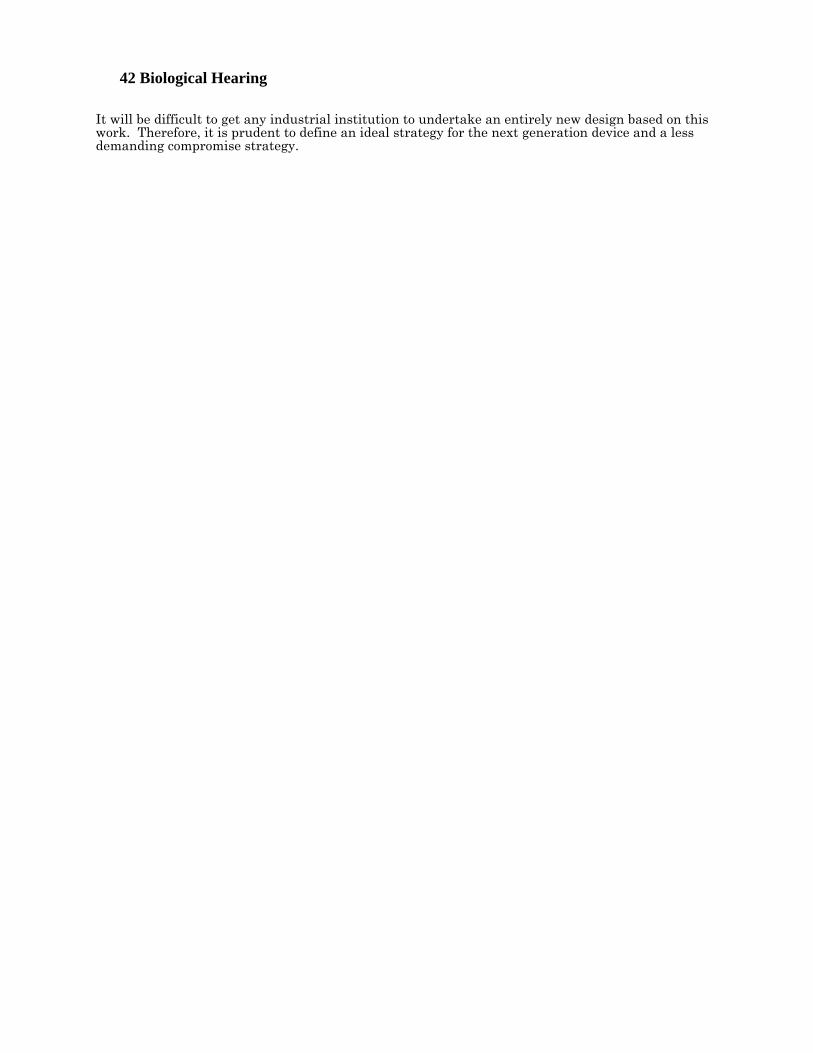
42 Biological Hearing
It will be difficult to get any industrial institution to undertake an entirely new design based on thiswork. Therefore, it is prudent to define an ideal strategy for the next generation device and a lessdemanding compromise strategy.
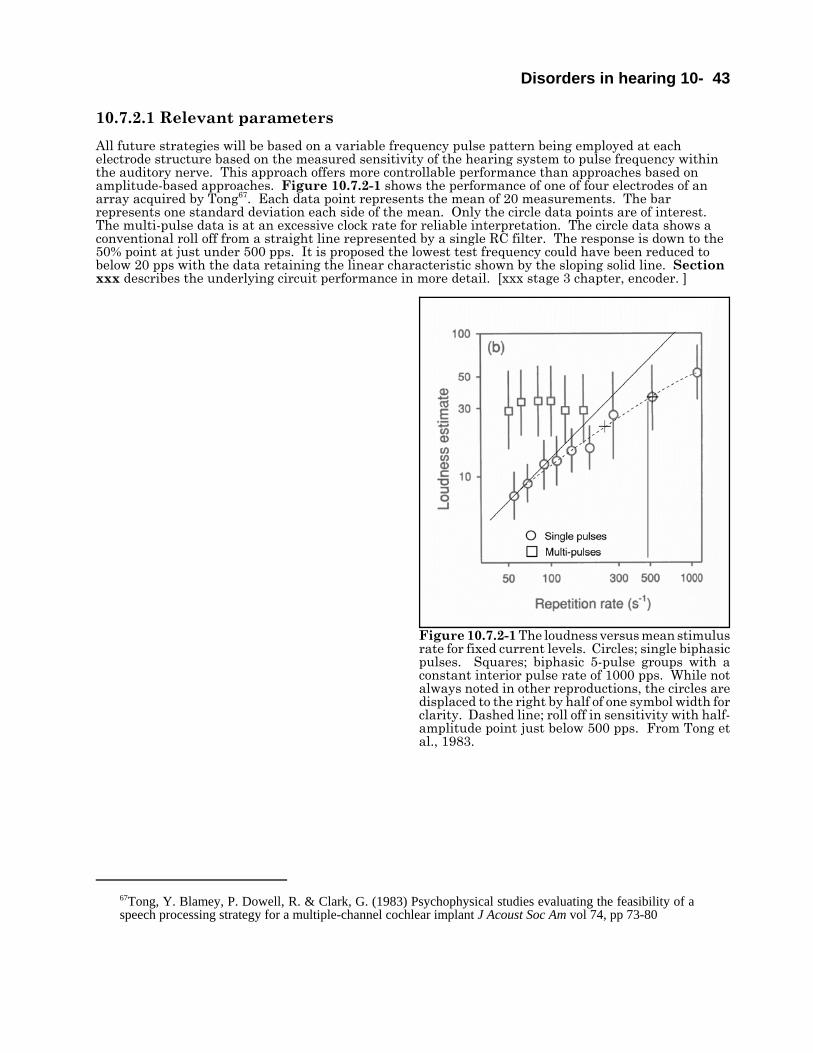
Disorders in hearing 10- 43
67Tong, Y. Blamey, P. Dowell, R. & Clark, G. (1983) Psychophysical studies evaluating the feasibility of aspeech processing strategy for a multiple-channel cochlear implant J Acoust Soc Am vol 74, pp 73-80
10.7.2.1 Relevant parameters
All future strategies will be based on a variable frequency pulse pattern being employed at eachelectrode structure based on the measured sensitivity of the hearing system to pulse frequency withinthe auditory nerve. This approach offers more controllable performance than approaches based onamplitude-based approaches. Figure 10.7.2-1 shows the performance of one of four electrodes of anarray acquired by Tong67. Each data point represents the mean of 20 measurements. The barrepresents one standard deviation each side of the mean. Only the circle data points are of interest. The multi-pulse data is at an excessive clock rate for reliable interpretation. The circle data shows aconventional roll off from a straight line represented by a single RC filter. The response is down to the50% point at just under 500 pps. It is proposed the lowest test frequency could have been reduced tobelow 20 pps with the data retaining the linear characteristic shown by the sloping solid line. Sectionxxx describes the underlying circuit performance in more detail. [xxx stage 3 chapter, encoder. ]
Figure 10.7.2-1 The loudness versus mean stimulusrate for fixed current levels. Circles; single biphasicpulses. Squares; biphasic 5-pulse groups with aconstant interior pulse rate of 1000 pps. While notalways noted in other reproductions, the circles aredisplaced to the right by half of one symbol width forclarity. Dashed line; roll off in sensitivity with half-amplitude point just below 500 pps. From Tong etal., 1983.
44 Biological Hearing
68Tong, Y. Clark, G. Blamey, P. Busby, P. & Dowell, R. (1982) Psychophysical studies for twomultiple-channel cochlear implant patients J Acoust Soc Am vol 71, pp 153-160
The complete data set of Tong et al., including their 1982 paper68, was difficult to interpret at the timeit was acquired due to a lack of a realistic model of the auditory system. The data in the 1983 paper isless relevant to this discussion because it centered on efforts to extract speech features from a studyusing multiple pulse groups as a stimulus. The multiple pulse groups introduce additional variablesthat confuse the issue.
They provided simpler data in the 1982 paper. The data show the perceived responses of two cochlearimplant patients were proportional to both the pulse frequency and the pulse amplitude of stimulation. Figure 10.7.2-2, repeated from Section 2.3.4 with additional notation, provides a clearerinterpretation of their results. Multi-element arrays were used and the elements could be and wereactivated separately. Biphase stimulation was used with the first pulse negative going relative toground. Each phase was approximately 180 μs long. For an unknown reason, the investigatorsstressed their pulses had zero rise and fall times. A sharpness ranking study using time-invariantsignals suggested that the hearing sensations produced by different electrodes varied from dull tosharp in an apical to basal direction in the scala tympani. A categorization study showed that thehearing sensations produced by two adjacent electrodes (1.5 mm apart) were rarely confused for arestricted range of time-invariant pulse rates.
The precise location of the electrode array in the scala tympani was unknown. It center could beanywhere along the locus shown diagrammatically. It is now known the Nodes of Ranvier labeled NO1in the narrow band channels emanating from OHC, and NI1 in the broadband channels emanating from
Figure 10.7.2-2 Schematic diagram showing innervation of the Organ of Corti. The Nodes of Ranvier arenumbered along both the IHC and OHC paths. See text. Modified from Warr, et. al., 1986.
Disorders in hearing 10- 45
69Schreiner, C. & Raggio, M. (1996) Neuronal responses in cat primary auditory cortex to electrical cochlearstimulation. II. Repetition rate coding J Neurophysiol vol 75(3), pp 1283-130070Raggio, M. & Schreiner, C. (1994) Neuronal responses in cat primary auditory cortex to electrical cochlearstimulation. I. Intensity J Neurophysiol vol. 72(5), pp 2334-2359
IHC are stage 3 encoding nodes. They accept analog signals and generate pulse trains. The nodeslabeled –2 and higher are pulse repeating nodes. They are designed to be receptive to pulse signals andregenerate those pulse signals at full amplitude for further propagation.
This schematic offers insight into the data of Tong et al. Excitation of any of the repeater nodes iseasily accomplished by a pulse (or pulses) with amplitudes at a node only slightly above its thresholdlevel. The pulse will be regenerated as a standard width action potential and propagated toward thebrain. It will be indistinguishable from any other action potential, except for its timing and the specificneural path it is on. If excited by a pulse stream of varying frequency, the node will regenerate thatprecise pulse stream over a wide dynamic range69. The amplitude dynamic range of the excitation isextremely small70 since the node is designed as a repeater of low amplitude pulses. Raising theexcitation intensity only marginally affects the timing of the regenerated pulse(s).
Nodes labeled –1's are designed as analog signal encoders. They accept an analog signal (or treat apulse as an analog signal) and generate a series of pulses at their output with a frequency proportionalto the amplitude of the stimulation. An excitation pulse must have a minimum pulse duration becausethese encoding circuits typically have a low pass filter in their input structure. Thus, the output of thenode is proportional to the amplitude of the pulses exciting it and a function of the excitation pulseduration.
The nodes labeled with the subscript O– are associated with the narrowband OHC neurons. Stimulation of these nodes will elicit responses related to specific acoustic frequencies. The commentsof Tong et al on page 155 are instructive. “The results revealed that the hearing sensations producedby electrode 1 and electrode 2 were rarely confused within the two ranges of pulse rates: 105 to 165pps, or 180 to 240 pps.” This statement shows their tonal character as well as confirming theprogression of neural signals from low frequencies near the apex to higher frequencies near the base. It is also of interest that their tonal range between the two groups was less than an octave as expectedfrom the model. An octave would require electrodes approximately 2.3 mm apart and would likelyintroduce confusion as discussed in Section 9.xxx. The ranges also suggest the frequency range ofneural paths excited by one electrode was on the order of 0.66 to 0.75 octaves. This range is too wide tosupport most speech feature-based signal processing approaches. Bringing the electrodes closer to thebasilar membrane surface would be helpful.
The nodes labeled with the subscript I– are associated with the broadband IHC neurons. Stimulationof these nodes will elicit responses related to specific temporal characteristics with sharp responsesassociated with excitation at basal locations and dull responses associated with more apical locations(as reported in Tong et al.) Tong et al. noted one case where an electrode number 9 was very close tothe round window and did not follow this pattern (page 154). It is proposed this electrode was beyondthe effective start of the cochlear partition as discussed in Section xxx.
Using the above figure and analyses, the data of Tong et al. can be interpreted in much greater detail. The following summary of conclusion from Tong et al. (page 158) are presented without the embeddedcitations.
“One of the most important observations made from the electrical stimulation of the humancochlea is the orderly increase in pitch and sharpness with the position of the intracochlearelectrodes. There is little doubt (from our results and those reported by other researchers) that atleast for postlingually deaf patients this phenomenon is real. The most likely mechanism for thisphenomenon is the activation of different groups of residual auditory nerve fibers by electriccurrent, and subsequent processing of this "place" information in the more central nuclei of theauditory system.
In addition to electrode position, pulse rate is another electrical parameter influencing the pitchpercept produced by an electrical stimulus. The major psychophysical results are summarized asfollows: (1) The discrimination performance for electrical pulse rate is much poorer than that for
46 Biological Hearing
71Black, R. Clark, G. Tong, Y. & Patrick, J. (1983) Current distributions in cochlear stimulation Ann New YorkAcad Sci vol 405, pp 137-14572Clark, G. Shepherd, R. Patrick, J. Black, R. & Tong, Y. (1983) Design and fabrication of the banded electrodeAnn New York Acad Sci vol 405, pp 191-201
acoustic signals such as pure tones and multicomponent tone complexes in normal hearingsubjects (Sec. IV), (2) the discrimination performance is poorer for pulse rates above 250 pps incomparison to that for lower pulse rates, (3) the increase in (scaled) pitch with pulse rate is lesspronounced above-250 pps, and (4) the pitch sensation produced by a single-electrode stimuluswith pulse rate below 250 pps can be matched to that for an acoustic pure tone with the samefrequency in a cochlear implant patient with residual hearing in the unimplantcd ear.“
10.7.2.1.1 Electrode configuration data EMPTY
Hartmann and Kral have noted, “Electrical stimulation of a node of Ranvier with a monopolar cathodicextracellular electrode leads to a depolarization . . . generating action potentials (page 225).” Thisquotation supports the position that most electrical stimulation by implants causes a more negativepotential to be applied to the poditic terminal of the NoR. This application results in a positive changein the axoplasm potential leading to the generation of one or more positive-going action potentials.
Black et al. have provided data showing the advantages of bipolar stimulation over monopolar71. Longitudinal excitation patterns in humans were narrower by a factor of 4:1.
Clark et al. have discussed the performance of various orientations of full and split ring multi-electrodearrays72 with a better graphic presented in Clark, 2003, page 268.. Their 1983 results “indicate thatwhile there are inevitable variations in thresholds and growth responses with a free-fit electrode of thistype, these will be significantly greater with a half-band electrode. Therefore, unless the placement androtation of the half-band electrode can be closely controlled, the full-band electrode has advantages inproviding minimum threshold and growth response variations.” Many of these problems have nowbeen overcome and various split ring configurations offer great potential in separately exciting OHCand IHC neurons.
Hartmann and Kral have provided useful data describing the frequency selectivity achievable withmono, bi- and tripolar electrode configurations (page 225). The best selectivity was obtained with thetripolar configuration. However, even this configuration led to selectivity only about one critical bandwide. Although not specified, the context of their remarks suggests the electrodes were inside the scalatympani near the modiolar wall. This level of performance leaves little chance of achievingperformance adequate for music appreciation of identification of a communicants voice.
10.7.2.2 The ideal strategy
The first challenge is to reliably excite as few IHC neurons as possible near the round window with awideband temporal representation of the acoustic environment. The precise IHC excited is not critical. Optimally, a broadband signal extending to at least four kilohertz would be provided. As noted in thediscussion accompanying figure 4.5.1–2, the energy in this signal will be integrated into a low passequivalent channel of 600–1000 Hertz before being used to encode the signal by stage 3 neuronspropagating to the cochlear nucleus. It is the timing of the first action potential generated by the stage3 neurons that is critically important to the perception of unvoiced features in human speech.
The second challenge is to excite as few OHC neurons as possible at specific spacings along the cochlearpartition. Ideally, the excitation would be optimized to excite OHC already wired together as a groupas suggested in Figure 6.1.1–2 adapted from Lorento. In general, about four OHC in a given row of thecochlear partition are wired together. The goal should be to excite one or multiples of these four cellgroups. The difficulty arises from the echelon arrangement of these groups relative to the longitudinalaxis of the cochlear partition.
Disorders in hearing 10- 47It is mandatory that the individual signals exciting the groups described above be properly phasedrelative to the earlier OHC groups and relative to the IHC excitation. Otherwise, the brain will not beable to perceive the desired relationships.
10.7.2.3 A compromise strategy
It may not be possible to design an electrode array in the short term able to separably excite the IHCand OHC neurons, much less optimal size groups of each type of neurons. Therefore, a compromisestrategy is desired demonstrating the majority of the long term goals using more readily availablecomponents from the current industrial base.
A minimalistic electrode array can be defined. It would have at least nine individual electrodes (orelectrode groups).
The intent of this design is to achieve both the perception of music by the recipient of thiscochlear implant for the first time, and to pass to the hearing system the temporal fine structurethat supports speech interpretation for the first time. To achieve this capability, it is importantthat the stimulating electrodes for the OHC neurons be spaced at submultiples of an octave alongthe longitudinal length of the cochlear partition. Currently, an octave is estimated to occur atdistances of 2.3 mm along the partition (except at very low frequencies where the apical hookmodifies this spacing below about 500 Hz as illustrated in Section 4.5.4. The use of animprecise spacing will lead to non-harmonic perceptions of acoustically harmonic signals.
1. An electrode array with at least one electrode designed to carry a wideband signal for stimulating agroup of IHC. The IHC oriented electrode would be inserted to approximately 6 mm from the roundwindow.
2. An electrode array with a set of electrodes designed to excite OHC neurons along not less than 4.5mm of the cochlear partition and beginning between 11 mm and 15 mm from the round window. Theset should be designed to have two electrodes separated by as close to one octave along the cochlearpartition as possible. See discussion accompanying [Figure 4.5.4–2]. The spacing between the otherelectrodes should be nominally equal. A nice feature would be to have them spaced in accordance withthe notes of the musical scale.
The organization of each electrode should be optimized for exciting the fewest possible number ofneurons longitudinally.
A key feature in future cochlear implants will be a structure that naturally seeks to place theelectrodes as close as possible to the Tunnel of Corti. This will probably require an array of thecomplexity found in the Nucleus Contour perimodiolar array (page 535 in Clark, 2003) but re-targetedto place the array quite far from the modiolar. The ideal array would be placed adjacent to the basilarmembrane and centered on the spiral artery.
The rapid advance in the manufacture of printed circuits both as microcircuits and as interconnectingcircuit boards makes a very sophisticated cochlear implant possible now. Fifty micron wide traces(printed wires) are currently used on the circuit boards in commercial cell phones. 0.5 micron traces(as well as 0.5 micron square transistor gates) are used in current consumer market microcircuits(100:1 finer than traces on circuit boards). The 50 micron technology can be adapted to printedcircuitry on flexible polyimide substrates of limited size with minimum difficulty. White et al.documented some of the specifics of this process in 1983 (although they used contacts five times largerthat reflected the state of the art of that time).
Figure 10.7.2-3 shows a potential printed circuit array overlaid on a graphic from Jahn & Santos-Sacchi (page 179). The array will be formed of printed circuits on a polyimide substrate that curls tofollow the scala tympani while positioning itself adjacent to the tunnel of Corti. The precise curl isdetermined by the silastic mold capturing the polyimide substrate, and any alignment fixturing neededfor insertion purposes.. It will employ a multi electrode configuration that can excite the OHC whendesired and the IHC when desired. It will minimize excitation of the complementary set of neurons bytreating the electrodes nearest that group as a monopolar ground. Simultaneously, it will excite thedesired set of neurons at a given longitudinal location using a biphasic (and potentially bipolar) electrode configuration on that side of the array.
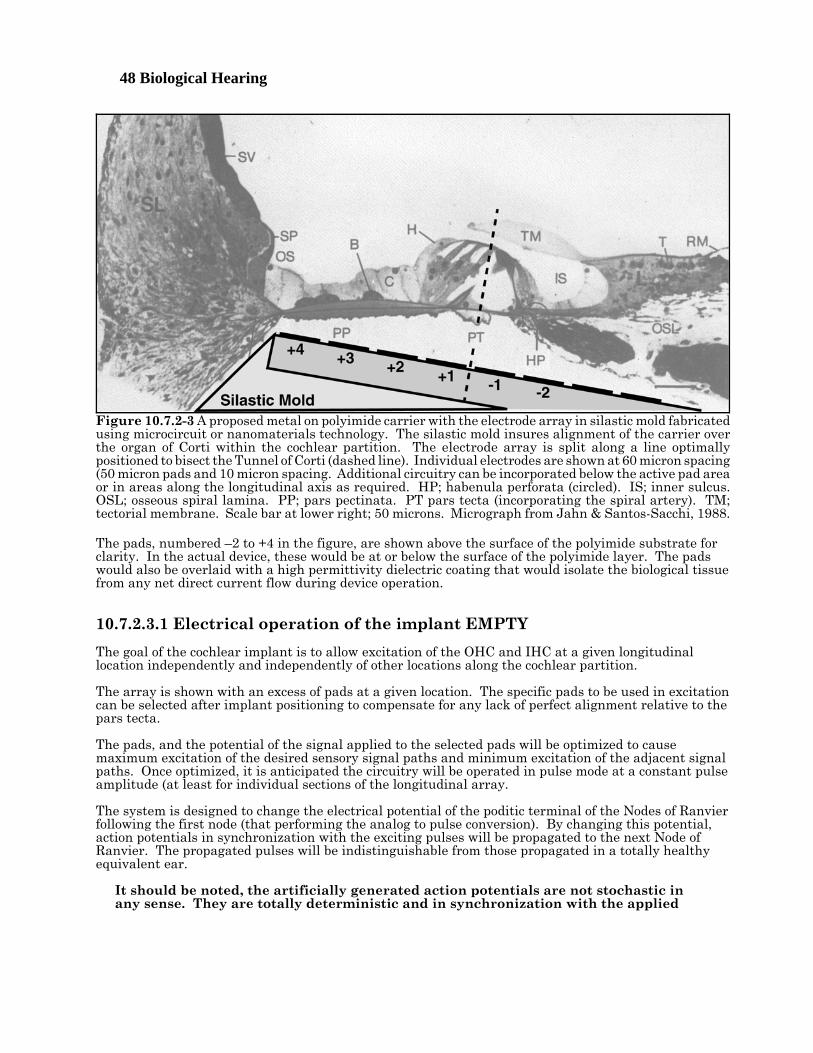
48 Biological Hearing
The pads, numbered –2 to +4 in the figure, are shown above the surface of the polyimide substrate forclarity. In the actual device, these would be at or below the surface of the polyimide layer. The padswould also be overlaid with a high permittivity dielectric coating that would isolate the biological tissuefrom any net direct current flow during device operation.
10.7.2.3.1 Electrical operation of the implant EMPTY
The goal of the cochlear implant is to allow excitation of the OHC and IHC at a given longitudinallocation independently and independently of other locations along the cochlear partition.
The array is shown with an excess of pads at a given location. The specific pads to be used in excitationcan be selected after implant positioning to compensate for any lack of perfect alignment relative to thepars tecta.
The pads, and the potential of the signal applied to the selected pads will be optimized to causemaximum excitation of the desired sensory signal paths and minimum excitation of the adjacent signalpaths. Once optimized, it is anticipated the circuitry will be operated in pulse mode at a constant pulseamplitude (at least for individual sections of the longitudinal array.
The system is designed to change the electrical potential of the poditic terminal of the Nodes of Ranvierfollowing the first node (that performing the analog to pulse conversion). By changing this potential,action potentials in synchronization with the exciting pulses will be propagated to the next Node ofRanvier. The propagated pulses will be indistinguishable from those propagated in a totally healthyequivalent ear.
It should be noted, the artificially generated action potentials are not stochastic inany sense. They are totally deterministic and in synchronization with the applied
Figure 10.7.2-3 A proposed metal on polyimide carrier with the electrode array in silastic mold fabricatedusing microcircuit or nanomaterials technology. The silastic mold insures alignment of the carrier overthe organ of Corti within the cochlear partition. The electrode array is split along a line optimallypositioned to bisect the Tunnel of Corti (dashed line). Individual electrodes are shown at 60 micron spacing(50 micron pads and 10 micron spacing. Additional circuitry can be incorporated below the active pad areaor in areas along the longitudinal axis as required. HP; habenula perforata (circled). IS; inner sulcus.OSL; osseous spiral lamina. PP; pars pectinata. PT pars tecta (incorporating the spiral artery). TM;tectorial membrane. Scale bar at lower right; 50 microns. Micrograph from Jahn & Santos-Sacchi, 1988.
Disorders in hearing 10- 49
73Roland, J. Huang, T. & Fishman, A. (2006) Cochlear implant electrode history, choices and insertiontechniques In Waltzman, S. & Roland, J. eds. Cochlear Implants, 2nd Ed.. NY: Thieme Chapter 9
stimulus.
The pulse frequency applied to a given set of pads will vary in frequency as a function of the desiredperceived amplitude. The frequency may be varied continuously in accordance with the amplitude ofthe acoustic energy to be simulated, or the frequency may be set for intervals of nominally 30 ms (basedon the average value of the acoustic stimulus during similar intervals.
The option of pulsing each array pad using a biphasic pulse will be preserved until demonstrated to beunnecessary.
The instantaneous electrical field designed to excite either the OHC or the IHC can be tailored by usingsignals applied to multiple pads. The optimization of the electrical fields have not been attempted atthis time. This optimization may involve bipolar pad operation as explored by Brummer, Robblee andHambrect.
10.7.2.3.2 Fabrication of the operational implant EMPTY
Maintaining the flexibility needed for implanting the proposed cochlear implant without damaging theelectrical circuitry is a non-trivial task. It is assumed the array must exhibit a straight planarconfiguration prior to insertion and follow the curvature of the cochlear partition afterward (over adistance of at least 20 mm). While the change in curvature of the polyimide substrate and attachedwiring is minimal in the plane perpendicular to the substrate surface (parallel to the modiolar axis),the change in curvature is significant in the plane of the substrate. This may require the longitudinalwiring traces be in zigzag form in the intervals between active pad locations. These active padlocations are expected to be concentrated at intervals of 1/8th of 2.3 mm or 287.5 microns along thelength of the implant for a nominal 20 mm.
Roland, Huang & Fishman provide interesting details of current electrode array practices73. - - - - -

50 Biological Hearing
Disorders in hearing 10- 51
Table of Contents 2 June 2009
10 Disorders of the Auditory System . . . . . . . . . . . . . . . . . . . . . . . . . . . . . . . . . . . . . . . . . . . . . . . . . . . . . . 110.1 Introduction . . . . . . . . . . . . . . . . . . . . . . . . . . . . . . . . . . . . . . . . . . . . . . . . . . . . . . . . . . . . . . . 1
10.1.1 Categorizing auditory pathologies . . . . . . . . . . . . . . . . . . . . . . . . . . . . . . . . . . . . . 110.1.2 Background . . . . . . . . . . . . . . . . . . . . . . . . . . . . . . . . . . . . . . . . . . . . . . . . . . . . . . . 1
10.1.2.1 DC coupling of neurons introduces a complication . . . . . . . . . . . . . . . . 210.1.2.2 The continuous audiometer of Bekesy . . . . . . . . . . . . . . . . . . . . . . . . . . 2
10.1.3 Pathologies of the auditory system . . . . . . . . . . . . . . . . . . . . . . . . . . . . . . . . . . . . . 210.1.3.1 Meniere’s disease . . . . . . . . . . . . . . . . . . . . . . . . . . . . . . . . . . . . . . . . . . . 210.1.3.2 Echoes within the auditory system . . . . . . . . . . . . . . . . . . . . . . . . . . . . . 210.1.3.3 Clinically observable spontaneous sources within the auditory system
. . . . . . . . . . . . . . . . . . . . . . . . . . . . . . . . . . . . . . . . . . . . . . . . . . . . . . . . . . 310.1.3.3.1 Auto acoustic effects EMPTY . . . . . . . . . . . . . . . . . . . . . . . . . 3
10.1.3.4 Clinically unobservable sources within the hearing system--Tinnitus. . . . . . . . . . . . . . . . . . . . . . . . . . . . . . . . . . . . . . . . . . . . . . . . . . . . . . . . . . 3
10.1.3.4.1 The character of tintinnitis . . . . . . . . . . . . . . . . . . . . . . . . . . . 510.1.3.4.2 Previous theories of tinnitus . . . . . . . . . . . . . . . . . . . . . . . . . 610.1.3.4.3 Cilia loss within the cochlea . . . . . . . . . . . . . . . . . . . . . . . . . . 710.1.3.4.4 Other experimental evidence . . . . . . . . . . . . . . . . . . . . . . . . . 710.1.3.4.5 A theory of tinnitus . . . . . . . . . . . . . . . . . . . . . . . . . . . . . . . . . 7
10.1.3.5 Clinically recognizable forms of tinnitus . . . . . . . . . . . . . . . . . . . . . . . . 810.2 Sensorineural disorders related to intensity level . . . . . . . . . . . . . . . . . . . . . . . . . . . . . . . . . 8
10.1.3.2 Echos within the auditory system . . . . . . . . . . . . . . . . . . . . . . . . . . . . 1110.1.3.2 Echos within the auditory system . . . . . . . . . . . . . . . . . . . . . . . . . . . . 11
10.2.1 Sensorineural disorders related to intensity range . . . . . . . . . . . . . . . . . . . . . . . 1110.2.1.1 Intensity abnormalities independent of frequency . . . . . . . . . . . . . . . 11
10.2.1.1.1 Hypoacusis . . . . . . . . . . . . . . . . . . . . . . . . . . . . . . . . . . . . . . . 1210.2.1.1.2 Hyperacusis . . . . . . . . . . . . . . . . . . . . . . . . . . . . . . . . . . . . . . 1210.2.1.1.3 Chugging . . . . . . . . . . . . . . . . . . . . . . . . . . . . . . . . . . . . . . . . 13
10.2.1.2 Frequency dependent variations in sensitivity EMPTY . . . . . . . . . . . 1310.2.2 Sensorineural disorders related to differential sensitivity . . . . . . . . . . . . . . . . . 14
10.2.2.1 Loudness Recruitment (loss in adaptation amplifier gain) . . . . . . . . . 1410.2.2.1.1 Redefinition of the phenomenon previously known as
recruitment . . . . . . . . . . . . . . . . . . . . . . . . . . . . . . . . . . . . . . . . 1910.2.2.1.2 Potential causes of XXX alias Recruitment . . . . . . . . . . . . . 20
10.2.2.3 XXXEchos within the auditory system . . . . . . . . . . . . . . . . . . . . . . . . . 225.5.4 Revisiting the concepts of recruitment and tinnitus . . . . . . . . . . . . . . . . . . . . . . . 22
5.5.4.1 Background . . . . . . . . . . . . . . . . . . . . . . . . . . . . . . . . . . . . . . . . . . . . . . . 225.5.4.2 Framework for discussion of hearing abnormalities . . . . . . . . . . . . . . . 255.5.4.3 Threshold level hearing losses . . . . . . . . . . . . . . . . . . . . . . . . . . . . . . . . 255.5.4.3 xxx (aka recruitment) is a definable disease . . . . . . . . . . . . . . . . . . . . . 30
10.3 Sensorineural disorders related to frequency . . . . . . . . . . . . . . . . . . . . . . . . . . . . . . . . . . . 3310.4 Sensorineural disorders related to pharmacology . . . . . . . . . . . . . . . . . . . . . . . . . . . . . . . . 3310.5 Selected results of surgical intervention . . . . . . . . . . . . . . . . . . . . . . . . . . . . . . . . . . . . . . . 33
10.5.1 Effect of total commissurotomy EMPTY . . . . . . . . . . . . . . . . . . . . . . . . . . . . . . . 3310.6 Auditory prosthetic devices up to 2009 . . . . . . . . . . . . . . . . . . . . . . . . . . . . . . . . . . . . . . . . 34
10.6.1 Prostheses introduced at stages 0 & 1 EMPTY . . . . . . . . . . . . . . . . . . . . . . . . . . 3410.6.2 The pre-stage 2 cochlear implant prosthesis . . . . . . . . . . . . . . . . . . . . . . . . . . . . 34
10.6.2.1 An annotated history of cochlear prosthetic devices . . . . . . . . . . . . . . 3410.6.2.2 The use of formant filters in previous implants . . . . . . . . . . . . . . . . . . 3810.6.2.3 Signal compression in the analog circuitry of previous implants . . . . 3810.6.2.4 The record of a cochlear implant prosthesis user . . . . . . . . . . . . . . . . 39
10.6.3 Prostheses introduced beyond stage 2 EMPTY . . . . . . . . . . . . . . . . . . . . . . . . . . 3910.7 Proposed future generation pre-stage 2 cochlear prostheses EMPTY . . . . . . . . . . . . . . . . 40
10.7.1 The state of the prosthesis art based on this work . . . . . . . . . . . . . . . . . . . . . . . 4010.7.1.1 Parametric limits on stimulation . . . . . . . . . . . . . . . . . . . . . . . . . . . . . 41
10.7.2 A strategy for the next generation cochlear implant prosthesis . . . . . . . . . . . . . 4210.7.2.1 Relevant parameters . . . . . . . . . . . . . . . . . . . . . . . . . . . . . . . . . . . . . . . 44
52 Biological Hearing
10.7.2.1.1 Electrode configuration data EMPTY . . . . . . . . . . . . . . . . . 4710.7.2.2 The ideal strategy . . . . . . . . . . . . . . . . . . . . . . . . . . . . . . . . . . . . . . . . . 4710.7.2.3 A compromise strategy . . . . . . . . . . . . . . . . . . . . . . . . . . . . . . . . . . . . . 48
10.7.2.3.1 Electrical operation of the implant EMPTY . . . . . . . . . . . . 4910.7.2.3.2 Fabrication of the operational implant EMPTY . . . . . . . . . 50
Disorders in hearing 10- 53
List of Figures 6/2/09
Figure 10.1.1-1 EMPTY Potential sources of tinnitus . . . . . . . . . . . . . . . . . . . . . . . . . . . . . . . . . . . . . . . 5Figure 10.1.1-2 A potential chemical source of tinnitus and similar conditions . . . . . . . . . . . . . . . . . . . 7Figure 10.1.1-3 Sources of extraneous signals within the auditory system EMPTY . . . . . . . . . . . . . . . 7Figure 10.2.1-1 The normal operating range of the auditory system with adaptation . . . . . . . . . . . . . 10Figure 10.2.1-2 REDRAW, Generic variations in sensitivity within the auditory system ADD . . . . . 11Figure 10.2.1-3 A loudness scale correlated to the conventional SPL intensity scale . . . . . . . . . . . . . 11Figure 10.2.1-4 A loudness scale correlated to the conventional SPL intensity scale . . . . . . . . . . . . . 13Figure 10.2.1-5 A comparison of data and theory related to sensorineural hearing loss . . . . . . . . . . . 16Figure 10.2.1-6 A loudness scale correlated to the conventional SPL intensity scale . . . . . . . . . . . . . 18Figure 10.2.1-7 Conceptual forms of loudness recruitment EMPTY ADD . . . . . . . . . . . . . . . . . . . . . . 20Figure 10.2.1-8 Variations in the cumulative human performance of stages 0 & 1 measured by the
generator potential . . . . . . . . . . . . . . . . . . . . . . . . . . . . . . . . . . . . . . . . . . . . . . . . . . . . . . . . . . . . 21Figure 10.2.1-9 Latencies of the generator potential response obtained from 15 subjects with
sensorineural deafness . . . . . . . . . . . . . . . . . . . . . . . . . . . . . . . . . . . . . . . . . . . . . . . . . . . . . . . . . 22Figure 10.2.2-1 Forms of hearing loss . . . . . . . . . . . . . . . . . . . . . . . . . . . . . . . . . . . . . . . . . . . . . . . . . . . 27Figure 10.2.2-2 The source of the disease described as recruitment . . . . . . . . . . . . . . . . . . . . . . . . . . . 32Figure 10.6.2-1 Equivalent circuit of prosthesis-tissue interface . . . . . . . . . . . . . . . . . . . . . . . . . . . . . 35Figure 10.7.2-1 The loudness versus mean stimulus rate for fixed current levels . . . . . . . . . . . . . . . . 44Figure 10.7.2-2 Schematic diagram showing innervation of the Organ of Corti . . . . . . . . . . . . . . . . . . 45Figure 10.7.2-3 A proposed metal on polyimide carrier with the electrode array in silastic mold . . . 49
54 Biological Hearing
SUBJECT INDEX (using advanced indexing option)
acoustic environment . . . . . . . . . . . . . . . . . . . . . . . . . . . . . . . . . . . . . . . . . . . . . . . . . . . . . . . . . . . . . . . . . 47actin . . . . . . . . . . . . . . . . . . . . . . . . . . . . . . . . . . . . . . . . . . . . . . . . . . . . . . . . . . . . . . . . . . . . . . . . . . . . . . . . 6action potential . . . . . . . . . . . . . . . . . . . . . . . . . . . . . . . . . . . . . . . . . . . . . . . . . . . . . . . . . . 20, 37, 39, 46, 47activa . . . . . . . . . . . . . . . . . . . . . . . . . . . . . . . . . . . . . . . . . . . . . . . . . . . . . . . . . . . . . . . . . . . . . . . 2, 9, 20, 21adaptation . . . . . . . . . . . . . . . . . . . . . . . . . . . . . . . . . . . . . . . . . . . . . . . . . . . . . . . . . . . . . . . . 7, 9-21, 30, 37adaptation amplifier . . . . . . . . . . . . . . . . . . . . . . . . . . . . . . . . . . . . . . . . . . . . . . . . 7, 9, 12-14, 16-18, 20, 21anatomical computation . . . . . . . . . . . . . . . . . . . . . . . . . . . . . . . . . . . . . . . . . . . . . . . . . . . . . . . . . . . . . . . 40attention . . . . . . . . . . . . . . . . . . . . . . . . . . . . . . . . . . . . . . . . . . . . . . . . . . . . . . . . . . . . . . . . . . . . . . . . . . . . 8auditory nerve . . . . . . . . . . . . . . . . . . . . . . . . . . . . . . . . . . . . . . . . . . . . . . . . . . . 5, 34-36, 38, 39, 41, 44, 46awareness mode . . . . . . . . . . . . . . . . . . . . . . . . . . . . . . . . . . . . . . . . . . . . . . . . . . . . . . . . . . . . . . . . . . . . . 39axoplasm . . . . . . . . . . . . . . . . . . . . . . . . . . . . . . . . . . . . . . . . . . . . . . . . . . . . . . . . . . . . . . . . . . . . . . . . 28, 47broadband . . . . . . . . . . . . . . . . . . . . . . . . . . . . . . . . . . . . . . . . . . . . . . . . . . . . . . . . . . . . . . . . . . 5, 13, 45-47cochlear nucleus . . . . . . . . . . . . . . . . . . . . . . . . . . . . . . . . . . . . . . . . . . . . . . . . . . . . . . . . . . . . . . . 35, 39, 47cochleotopic . . . . . . . . . . . . . . . . . . . . . . . . . . . . . . . . . . . . . . . . . . . . . . . . . . . . . . . . . . . . . . . . . . . . . . . . . . 7compensation . . . . . . . . . . . . . . . . . . . . . . . . . . . . . . . . . . . . . . . . . . . . . . . . . . . . . . . . . . . . . . . . . . . . . 30, 37consonance . . . . . . . . . . . . . . . . . . . . . . . . . . . . . . . . . . . . . . . . . . . . . . . . . . . . . . . . . . . . . . . . . . . . . . . 18, 23diencephalon . . . . . . . . . . . . . . . . . . . . . . . . . . . . . . . . . . . . . . . . . . . . . . . . . . . . . . . . . . . . . . . . . . . . . . . . 33diode . . . . . . . . . . . . . . . . . . . . . . . . . . . . . . . . . . . . . . . . . . . . . . . . . . . . . . . . . . . . . . 2, 16, 21, 24, 25, 29-31double layer . . . . . . . . . . . . . . . . . . . . . . . . . . . . . . . . . . . . . . . . . . . . . . . . . . . . . . . . . . . . . . . . . . . . . . . . . 35dynamic range . . . . . . . . . . . . . . . . . . . . . . . . . . . . . . . . . . . . . . . . . . . . . . . 15, 16, 24, 28, 29, 37, 39, 41, 46electrostenolytic process . . . . . . . . . . . . . . . . . . . . . . . . . . . . . . . . . . . . . . . . . . . . . . . . . . . . . . . . . . . . 13, 20encoder . . . . . . . . . . . . . . . . . . . . . . . . . . . . . . . . . . . . . . . . . . . . . . . . . . . . . . . . . . . . . . . . . . . . . . . . . . . . . 44external feedback . . . . . . . . . . . . . . . . . . . . . . . . . . . . . . . . . . . . . . . . . . . . . . . . . . . . . . . . . . . . . . . . . . . . . 3GABA . . . . . . . . . . . . . . . . . . . . . . . . . . . . . . . . . . . . . . . . . . . . . . . . . . . . . . . . . . . . . . . . . . . . . . . . . . . 13, 20ganglion neuron . . . . . . . . . . . . . . . . . . . . . . . . . . . . . . . . . . . . . . . . . . . . . . . . . . . . . . . . . . . . . . . . . . . . . 36glutamate . . . . . . . . . . . . . . . . . . . . . . . . . . . . . . . . . . . . . . . . . . . . . . . . . . . . . . . . . . . . . . . . . . . . . . . . . . 13habenula . . . . . . . . . . . . . . . . . . . . . . . . . . . . . . . . . . . . . . . . . . . . . . . . . . . . . . . . . . . . . . . . . . . . . . . . 36, 49habenula perforata . . . . . . . . . . . . . . . . . . . . . . . . . . . . . . . . . . . . . . . . . . . . . . . . . . . . . . . . . . . . . . . . 36, 49half-amplitude . . . . . . . . . . . . . . . . . . . . . . . . . . . . . . . . . . . . . . . . . . . . . . . . . . . . . . . . . . . . . . . . . . . . . . . 44Hensen’s stripe . . . . . . . . . . . . . . . . . . . . . . . . . . . . . . . . . . . . . . . . . . . . . . . . . . . . . . . . . . . . . . . . . . . 2, 3, 7interp . . . . . . . . . . . . . . . . . . . . . . . . . . . . . . . . . . . . . . . . . . . . . . . . . . . . . . . . . . . . . . . . . . . . . . . . . . . . . . . 8kaumotopic . . . . . . . . . . . . . . . . . . . . . . . . . . . . . . . . . . . . . . . . . . . . . . . . . . . . . . . . . . . . . . . . . . . . . . 13, 16lateral geniculate . . . . . . . . . . . . . . . . . . . . . . . . . . . . . . . . . . . . . . . . . . . . . . . . . . . . . . . . . . . . . . . . . . . . 33launcher . . . . . . . . . . . . . . . . . . . . . . . . . . . . . . . . . . . . . . . . . . . . . . . . . . . . . . . . . . . . . . . . . . . . . . . . . . . . . 2masking . . . . . . . . . . . . . . . . . . . . . . . . . . . . . . . . . . . . . . . . . . . . . . . . . . . . . . . . . . . . . . . . . . . . . . . 1, 17, 25mesotopic . . . . . . . . . . . . . . . . . . . . . . . . . . . . . . . . . . . . . . . . . . . . . . . . . . . . . . . . . . . . 11, 13, 15, 16, 29, 30midbrain . . . . . . . . . . . . . . . . . . . . . . . . . . . . . . . . . . . . . . . . . . . . . . . . . . . . . . . . . . . . . . . . . . . . . . . . . . . . 8MOC path . . . . . . . . . . . . . . . . . . . . . . . . . . . . . . . . . . . . . . . . . . . . . . . . . . . . . . . . . . . . . . . . . . . . . . . . . . 39modiolus . . . . . . . . . . . . . . . . . . . . . . . . . . . . . . . . . . . . . . . . . . . . . . . . . . . . . . . . . . . . . . . . . . . . . . . . . . . 36modulation . . . . . . . . . . . . . . . . . . . . . . . . . . . . . . . . . . . . . . . . . . . . . . . . . . . . . . . . . . . . . . . . . . . . . 6, 38, 41N1 . . . . . . . . . . . . . . . . . . . . . . . . . . . . . . . . . . . . . . . . . . . . . . . . . . . . . . . . . . . . . . . . . . . . . . . . . . . . . . . . . 21narrow band . . . . . . . . . . . . . . . . . . . . . . . . . . . . . . . . . . . . . . . . . . . . . . . . . . . . . . . . . . . . . . . . . . . . . . 4, 45neurite . . . . . . . . . . . . . . . . . . . . . . . . . . . . . . . . . . . . . . . . . . . . . . . . . . . . . . . . . . . . . . . . . . . . . . . . 2, 29, 31neuro-facilitator . . . . . . . . . . . . . . . . . . . . . . . . . . . . . . . . . . . . . . . . . . . . . . . . . . . . . . . . . . . . . . . . . . . . . 20neuro-inhibitor . . . . . . . . . . . . . . . . . . . . . . . . . . . . . . . . . . . . . . . . . . . . . . . . . . . . . . . . . . . . . . . . . . . . . . 20node E . . . . . . . . . . . . . . . . . . . . . . . . . . . . . . . . . . . . . . . . . . . . . . . . . . . . . . . . . . . . . . . . . . . . . . . . . . . . . 22node E’ . . . . . . . . . . . . . . . . . . . . . . . . . . . . . . . . . . . . . . . . . . . . . . . . . . . . . . . . . . . . . . . . . . . . . . . . . . . . . 22Node of Ranvier . . . . . . . . . . . . . . . . . . . . . . . . . . . . . . . . . . . . . . . . . . . . . . . . . . . . . . . . . . 36, 41, 42, 47, 49noise . . . . . . . . . . . . . . . . . . . . . . . . . . . . . . . . . . . . . . . . . . . . . . 1, 4, 5, 7-9, 14, 15, 18, 20, 23-25, 28, 37, 41OHC . . . . . . . . . . . . . . . . . . . . . . . . . . . . . . . . . . . . . . . . . . . . . . . . . 7-9, 13, 19, 20, 30, 36, 37, 40, 42, 45-50P/D equation . . . . . . . . . . . . . . . . . . . . . . . . . . . . . . . . . . . . . . . . . . . . . . . . . . . . . . . . . . . . . . . . . . . . . . . . 21parametric . . . . . . . . . . . . . . . . . . . . . . . . . . . . . . . . . . . . . . . . . . . . . . . . . . . . . . . . . . . . . . . . . . . . . . . . . . 41parietal lobe . . . . . . . . . . . . . . . . . . . . . . . . . . . . . . . . . . . . . . . . . . . . . . . . . . . . . . . . . . . . . . . . . . . . . . . . . . 8percept . . . . . . . . . . . . . . . . . . . . . . . . . . . . . . . . . . . . . . . . . . . . . . . . . . . . . . . . . . . . . . . . . . . . . . . . . 4, 8, 46perigeniculate . . . . . . . . . . . . . . . . . . . . . . . . . . . . . . . . . . . . . . . . . . . . . . . . . . . . . . . . . . . . . . . . . . . . 33, 38perigeniculate nucleus . . . . . . . . . . . . . . . . . . . . . . . . . . . . . . . . . . . . . . . . . . . . . . . . . . . . . . . . . . . . . . . . 38
Disorders in hearing 10- 55perilymph . . . . . . . . . . . . . . . . . . . . . . . . . . . . . . . . . . . . . . . . . . . . . . . . . . . . . . . . . . . . . . . . . . . . 13, 20, 21piezoelectric . . . . . . . . . . . . . . . . . . . . . . . . . . . . . . . . . . . . . . . . . . . . . . . . . . . . . . . . . . . . . . . . . . . . 6, 21, 25place-frequency . . . . . . . . . . . . . . . . . . . . . . . . . . . . . . . . . . . . . . . . . . . . . . . . . . . . . . . . . . . . . . . . . . . . . . 40poditic . . . . . . . . . . . . . . . . . . . . . . . . . . . . . . . . . . . . . . . . . . . . . . . . . . . . . . . . . . . . . . . . . . . . . . . 42, 47, 49pulse-to-pulse . . . . . . . . . . . . . . . . . . . . . . . . . . . . . . . . . . . . . . . . . . . . . . . . . . . . . . . . . . . . . . . . . . . . . . . 41pulvinar . . . . . . . . . . . . . . . . . . . . . . . . . . . . . . . . . . . . . . . . . . . . . . . . . . . . . . . . . . . . . . . . . . . . . . . . . . . . 33recruitment . . . . . . . . . . . . . . . . . . . . . . . . . . . . . . . . . . . . . . . . . . . . . 1, 8, 11, 12, 14-25, 27, 29, 30, 32, 34refractory period . . . . . . . . . . . . . . . . . . . . . . . . . . . . . . . . . . . . . . . . . . . . . . . . . . . . . . . . . . . . . . . . . . . . . 37Reissner’s . . . . . . . . . . . . . . . . . . . . . . . . . . . . . . . . . . . . . . . . . . . . . . . . . . . . . . . . . . . . . . . . . . . . . . . . . . . . 2saliency map . . . . . . . . . . . . . . . . . . . . . . . . . . . . . . . . . . . . . . . . . . . . . . . . . . . . . . . . . . . . . . . . . . . . . . . . . 8segregation . . . . . . . . . . . . . . . . . . . . . . . . . . . . . . . . . . . . . . . . . . . . . . . . . . . . . . . . . . . . . . . . . . . . . . . . . 25SPL . . . . . . . . . . . . . . . . . . . . . . . . . . . . . . . . . . . . . . . . . . . . . . . . . . . . 11, 13, 15, 16, 18, 21, 24-26, 29, 30Stage 0 . . . . . . . . . . . . . . . . . . . . . . . . . . . . . . . . . . . . . . . . . . . . . . . . . . . . . . . . . . . . . . . . . . . . . . . . . . . 1, 34stage 1 . . . . . . . . . . . . . . . . . . . . . . . . . . . . . . . . . . . . . . . . . . . . . . . . . . . . . . . . . . . . . . . . . . . . . . . . 6, 39, 40stage 2 . . . . . . . . . . . . . . . . . . . . . . . . . . . . . . . . . . . . . . . . . . . . . . . . . . . . . . . . . . . . . . . . . . . . . 1, 34, 39, 40stage 3 . . . . . . . . . . . . . . . . . . . . . . . . . . . . . . . . . . . . . . . . . . . . . . . . . . . . . . . . . . . 23, 25, 40-42, 44, 45, 47stage 4 . . . . . . . . . . . . . . . . . . . . . . . . . . . . . . . . . . . . . . . . . . . . . . . . . . . . . . . . . . . . . . . . . . . . . . . . 6, 25, 34stage 5 . . . . . . . . . . . . . . . . . . . . . . . . . . . . . . . . . . . . . . . . . . . . . . . . . . . . . . . . . . . . . . . . . . . . . . . . . . . . . . 6stellate . . . . . . . . . . . . . . . . . . . . . . . . . . . . . . . . . . . . . . . . . . . . . . . . . . . . . . . . . . . . . . . . . . . . . . . . . . 23, 41stellate neuron . . . . . . . . . . . . . . . . . . . . . . . . . . . . . . . . . . . . . . . . . . . . . . . . . . . . . . . . . . . . . . . . . . . . . . 23synapse . . . . . . . . . . . . . . . . . . . . . . . . . . . . . . . . . . . . . . . . . . . . . . . . . . . . . . . . . . . . . . . . . . . . . 2, 6, 28-32syndrome . . . . . . . . . . . . . . . . . . . . . . . . . . . . . . . . . . . . . . . . . . . . . . . . . . . . . . . . . . . . . . . . . . . . . . . . . 2, 13tectorial membrane . . . . . . . . . . . . . . . . . . . . . . . . . . . . . . . . . . . . . . . . . . . . . . . . . . . . . . . . . . . . . . . 2, 7, 49temporal lobe . . . . . . . . . . . . . . . . . . . . . . . . . . . . . . . . . . . . . . . . . . . . . . . . . . . . . . . . . . . . . . . . . . . . . . . . 33tonotopic . . . . . . . . . . . . . . . . . . . . . . . . . . . . . . . . . . . . . . . . . . . . . . . . . . . . . . . . . . . . . . . . . . . . . . . . . . . 39transduction . . . . . . . . . . . . . . . . . . . . . . . . . . . . . . . . . . . . . . . . . . . . . . . . . . . . . . . . . . . . . . . . . . . . . 14, 40type 2 . . . . . . . . . . . . . . . . . . . . . . . . . . . . . . . . . . . . . . . . . . . . . . . . . . . . . . . . . . . . . . . . . . . . . . . . . . . . . . 20xxx . . . . . . . . . . . . . . . . . . . . . . . . . . . . . . . . . . . . . . 2, 8, 9, 12, 20, 24, 25, 29, 30, 33, 35, 37-39, 42, 44, 46


![8. Hearing Transcript, June 11 and 12, 1990 9. Exhibit 15A ...preamb.9].… · 8. Hearing Transcript 401 , June 11 and 12, 1990 9. Exhibit 15A, APreliminary Regulatory Impact and](https://static.fdocument.org/doc/165x107/5fc502b35e0d1238601731a5/8-hearing-transcript-june-11-and-12-1990-9-exhibit-15a-preamb9-8-hearing.jpg)


![arXiv:1609.07454v1 [math.CV] 23 Sep 2016crab.rutgers.edu › ~sfu › publications › Fu-Laurent-Shaw.pdf · arXiv:1609.07454v1 [math.CV] 23 Sep 2016 HEARING PSEUDOCONVEXITY IN LIPSCHITZ](https://static.fdocument.org/doc/165x107/5f2337819325381f903ed89e/arxiv160907454v1-mathcv-23-sep-a-sfu-a-publications-a-fu-laurent-shawpdf.jpg)