Effects of domestic and industrial effluent discharges into the … · ... 2019 1987 1738 1643 1526...
7
Global NEST Journal, Vol 19, No X, pp ΧΧ-ΧΧ Copyright© 2017 Global NEST Printed in Greece. All rights reserved Hemamalini J., Mudgal B.V. and Sophia J.D. (2017), Effects of domestic and industrial effluent discharges into the lake and their impact on the drinking water in Pandravedu village, Tamil Nadu, India, Global NEST Journal, 19(X), XX-XX. Effects of domestic and industrial effluent discharges into the lake and THEIR impact on the drinking water in Pandravedu village, Tamil Nadu, India Hemamalini J. 1,* , Mudgal B.V. 2 and Sophia J.D. 3 1 Research Scholar, Centre for Water Resources, Anna University, Chennai 600025. 2 Professor, Centre for Water Resources, Anna University, Chennai 600025. 3 Principal Scientist, M S Swaminathan Research Foundation, Chennai 600113. Received: 15/01/2016, Accepted: 07/03/2017, Available online: 25/09/2017 * to whom all correspondence should be addressed: e-mail: [email protected] Abstract Increasing demand for water from agriculture, industrial and domestic sectors, resulted in stress on the water resources both from quantity and quality perspectives. Due to urbanization many of the dyeing units have shifted from urban to nearby rural areas. Here safe disposal of untreated effluent from the dyeing units is a challenge and is often let into nearby water bodies. Pandravedu Lake, located in Thiruvallur district of Tamil Nadu, India is one such case were the present study is carried out. Water samples were collected from twelve locations during pre- monsoon, monsoon and post-monsoon seasons, in pre- cleaned polyethylene cans and analyzed for physico- chemical parameters like pH, total dissolved solids, electrical conductivity, total alkalinity, total hardness, calcium, magnesium, sodium, potassium, iron, nitrate, chloride, fluoride and sulphate following the standard analytical procedures recommended by American Public Health Association (2005).The analytical results indicated that 40% to 70% of samples exceeded the drinking water quality standards prescribed by Bureau of Indian standards (BIS, 2012). Water quality index computed indicate that both the bore wells that supply drinking water to the village falls in very poor category (101 – 150) across three seasons. Correlation analysis indicated that seasonal changes in correlation among the parameters are linked to the fluctuations of wastewater discharge and its characteristics. Keywords: Lake Water, water quality index, correlation, dye-industry effluent, domestic sewage. 1. Introduction Surface water bodies like lakes, ponds etc. contribute to rural livelihoods and maintaining ecosystem services in many ways like drinking water supply, irrigation, livestock, ground water recharge, flood control and habitat for many floral and faunal diversity. The quality of such water bodies greatly influences the ground water quality. Most of the surface water resources are in different degrees of degradation due to encroachments, siltation and eutrophication resulting from domestic and industrial effluent discharge (Ravikumar et al., 2013). Particularly many lakes that supplied drinking water a few years back are in non-potable condition with impaired flood absorption capacity, diminished fish production and threatened biodiversity (Zhang et al., 2009). Despite wetlands including lake systems provide multiple services, its maintenance and management has received inadequate attention in national water sector agenda. One of the major reasons as specified by Bassi et al., (2014) is limited financial and technical support from the government that led to poor maintenance of few lakes while many lakes are completely neglected. Yet another important factor is the poor understanding about the link between water and ecological health and ecosystem services and human well-being (Gleick, 2000). As an outcome, many urban and rural lake catchments are encroached, ground water is over exploited and surface and ground water are polluted due to household and industrial discharges. Changing water quality has implication on livelihoods and well-being of lake dependent communities. Periodic monitoring and assessment of water quality is an essential management strategy to control surface water pollution (Yao et al., 2010) adopting water quality index as a tool (Mishra and Patel, 2001). In this context, it is proposed to assess the water quality of Pandravedu Lake which is located in Pallipet block of Tamil Nadu state in India. One of the upstream villages of Pandravedu is Pothatturpettai, known for its dyeing units, has neither effluent treatment nor sewage treatment plants. The untreated waste water is let into the Pandravedu Lake through a lined channel. The seepage of waste water from the lake has deteriorated both surface and ground water of the Pandravedu village and the entire lake ecosystem. Hence, the present study is undertaken to assess the impact of discharging domestic waste water and effluents from dyeing industries into the lake. The specific
Transcript of Effects of domestic and industrial effluent discharges into the … · ... 2019 1987 1738 1643 1526...
Global NEST Journal, Vol 19, No X, pp ΧΧ-ΧΧ Copyright© 2017 Global NEST
Printed in Greece. All rights reserved
Hemamalini J., Mudgal B.V. and Sophia J.D. (2017), Effects of domestic and industrial effluent discharges into the lake and their impact on the drinking water in Pandravedu village, Tamil Nadu, India, Global NEST Journal, 19(X), XX-XX.
Effects of domestic and industrial effluent discharges into the lake and THEIR impact on the drinking water in Pandravedu village, Tamil Nadu, India
Hemamalini J.1,*, Mudgal B.V.2 and Sophia J.D.3 1Research Scholar, Centre for Water Resources, Anna University, Chennai 600025. 2 Professor, Centre for Water Resources, Anna University, Chennai 600025. 3 Principal Scientist, M S Swaminathan Research Foundation, Chennai 600113.
Received: 15/01/2016, Accepted: 07/03/2017, Available online: 25/09/2017 *to whom all correspondence should be addressed:
e-mail: [email protected]
Abstract
Increasing demand for water from agriculture, industrial and domestic sectors, resulted in stress on the water resources both from quantity and quality perspectives. Due to urbanization many of the dyeing units have shifted from urban to nearby rural areas. Here safe disposal of untreated effluent from the dyeing units is a challenge and is often let into nearby water bodies. Pandravedu Lake, located in Thiruvallur district of Tamil Nadu, India is one such case were the present study is carried out. Water samples were collected from twelve locations during pre-monsoon, monsoon and post-monsoon seasons, in pre-cleaned polyethylene cans and analyzed for physico-chemical parameters like pH, total dissolved solids, electrical conductivity, total alkalinity, total hardness, calcium, magnesium, sodium, potassium, iron, nitrate, chloride, fluoride and sulphate following the standard analytical procedures recommended by American Public Health Association (2005).The analytical results indicated that 40% to 70% of samples exceeded the drinking water quality standards prescribed by Bureau of Indian standards (BIS, 2012). Water quality index computed indicate that both the bore wells that supply drinking water to the village falls in very poor category (101 – 150) across three seasons. Correlation analysis indicated that seasonal changes in correlation among the parameters are linked to the fluctuations of wastewater discharge and its characteristics.
Keywords: Lake Water, water quality index, correlation, dye-industry effluent, domestic sewage.
1. Introduction
Surface water bodies like lakes, ponds etc. contribute to rural livelihoods and maintaining ecosystem services in many ways like drinking water supply, irrigation, livestock, ground water recharge, flood control and habitat for many floral and faunal diversity. The quality of such water bodies greatly influences the ground water quality. Most of the
surface water resources are in different degrees of degradation due to encroachments, siltation and eutrophication resulting from domestic and industrial effluent discharge (Ravikumar et al., 2013). Particularly many lakes that supplied drinking water a few years back are in non-potable condition with impaired flood absorption capacity, diminished fish production and threatened biodiversity (Zhang et al., 2009).
Despite wetlands including lake systems provide multiple services, its maintenance and management has received inadequate attention in national water sector agenda. One of the major reasons as specified by Bassi et al., (2014) is limited financial and technical support from the government that led to poor maintenance of few lakes while many lakes are completely neglected. Yet another important factor is the poor understanding about the link between water and ecological health and ecosystem services and human well-being (Gleick, 2000). As an outcome, many urban and rural lake catchments are encroached, ground water is over exploited and surface and ground water are polluted due to household and industrial discharges. Changing water quality has implication on livelihoods and well-being of lake dependent communities. Periodic monitoring and assessment of water quality is an essential management strategy to control surface water pollution (Yao et al., 2010) adopting water quality index as a tool (Mishra and Patel, 2001). In this context, it is proposed to assess the water quality of Pandravedu Lake which is located in Pallipet block of Tamil Nadu state in India. One of the upstream villages of Pandravedu is Pothatturpettai, known for its dyeing units, has neither effluent treatment nor sewage treatment plants. The untreated waste water is let into the Pandravedu Lake through a lined channel. The seepage of waste water from the lake has deteriorated both surface and ground water of the Pandravedu village and the entire lake ecosystem. Hence, the present study is undertaken to assess the impact of discharging domestic waste water and effluents from dyeing industries into the lake. The specific
2 HEMAMALINI et al.
objectives are to compute and compare seasonal variations of (a) drinking water quality index, and (ii) correlate the physio-chemical parameters.
2. Materials and Methods
2.1. Study area description
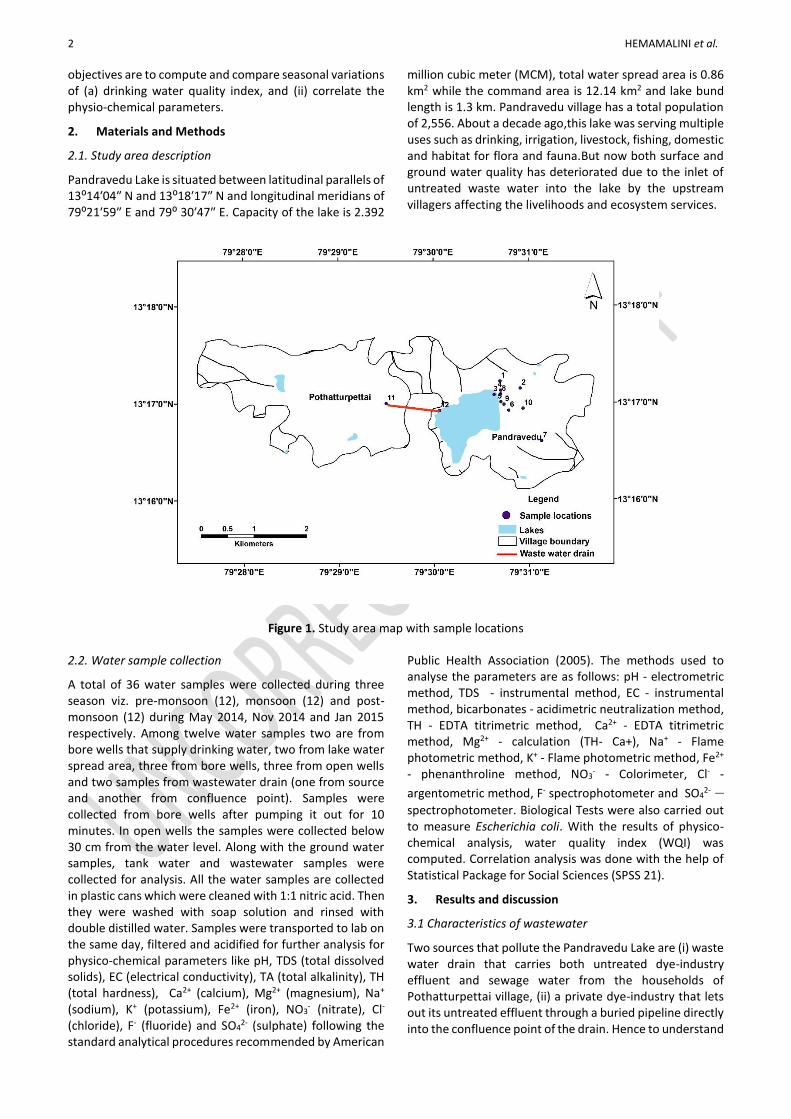
Pandravedu Lake is situated between latitudinal parallels of 13⁰14′04″ N and 13⁰18′17″ N and longitudinal meridians of 79⁰21′59″ E and 79⁰ 30′47″ E. Capacity of the lake is 2.392
million cubic meter (MCM), total water spread area is 0.86 km2 while the command area is 12.14 km2 and lake bund length is 1.3 km. Pandravedu village has a total population of 2,556. About a decade ago,this lake was serving multiple uses such as drinking, irrigation, livestock, fishing, domestic and habitat for flora and fauna.But now both surface and ground water quality has deteriorated due to the inlet of untreated waste water into the lake by the upstream villagers affecting the livelihoods and ecosystem services.
Figure 1. Study area map with sample locations
2.2. Water sample collection
A total of 36 water samples were collected during three season viz. pre-monsoon (12), monsoon (12) and post-monsoon (12) during May 2014, Nov 2014 and Jan 2015 respectively. Among twelve water samples two are from bore wells that supply drinking water, two from lake water spread area, three from bore wells, three from open wells and two samples from wastewater drain (one from source and another from confluence point). Samples were collected from bore wells after pumping it out for 10 minutes. In open wells the samples were collected below 30 cm from the water level. Along with the ground water samples, tank water and wastewater samples were collected for analysis. All the water samples are collected in plastic cans which were cleaned with 1:1 nitric acid. Then they were washed with soap solution and rinsed with double distilled water. Samples were transported to lab on the same day, filtered and acidified for further analysis for physico-chemical parameters like pH, TDS (total dissolved solids), EC (electrical conductivity), TA (total alkalinity), TH (total hardness), Ca2+ (calcium), Mg2+ (magnesium), Na+ (sodium), K+ (potassium), Fe2+ (iron), NO3
- (nitrate), Cl- (chloride), F- (fluoride) and SO4
2- (sulphate) following the standard analytical procedures recommended by American
Public Health Association (2005). The methods used to analyse the parameters are as follows: pH - electrometric method, TDS - instrumental method, EC - instrumental method, bicarbonates - acidimetric neutralization method, TH - EDTA titrimetric method, Ca2+ - EDTA titrimetric method, Mg2+ - calculation (TH- Ca+), Na+ - Flame photometric method, K+ - Flame photometric method, Fe2+ - phenanthroline method, NO3
- - Colorimeter, Cl- -
argentometric method, F- spectrophotometer and SO42- –
spectrophotometer. Biological Tests were also carried out to measure Escherichia coli. With the results of physico-chemical analysis, water quality index (WQI) was computed. Correlation analysis was done with the help of Statistical Package for Social Sciences (SPSS 21).
3. Results and discussion
3.1 Characteristics of wastewater
Two sources that pollute the Pandravedu Lake are (i) waste water drain that carries both untreated dye-industry effluent and sewage water from the households of Pothatturpettai village, (ii) a private dye-industry that lets out its untreated effluent through a buried pipeline directly into the confluence point of the drain. Hence to understand
EFFECTS OF DOMESTIC AND INDUSTRIAL EFFLUENT DISCHARGES INTO THE LAKE AND THEIR IMPACT ON THE DRINKING WATER 3
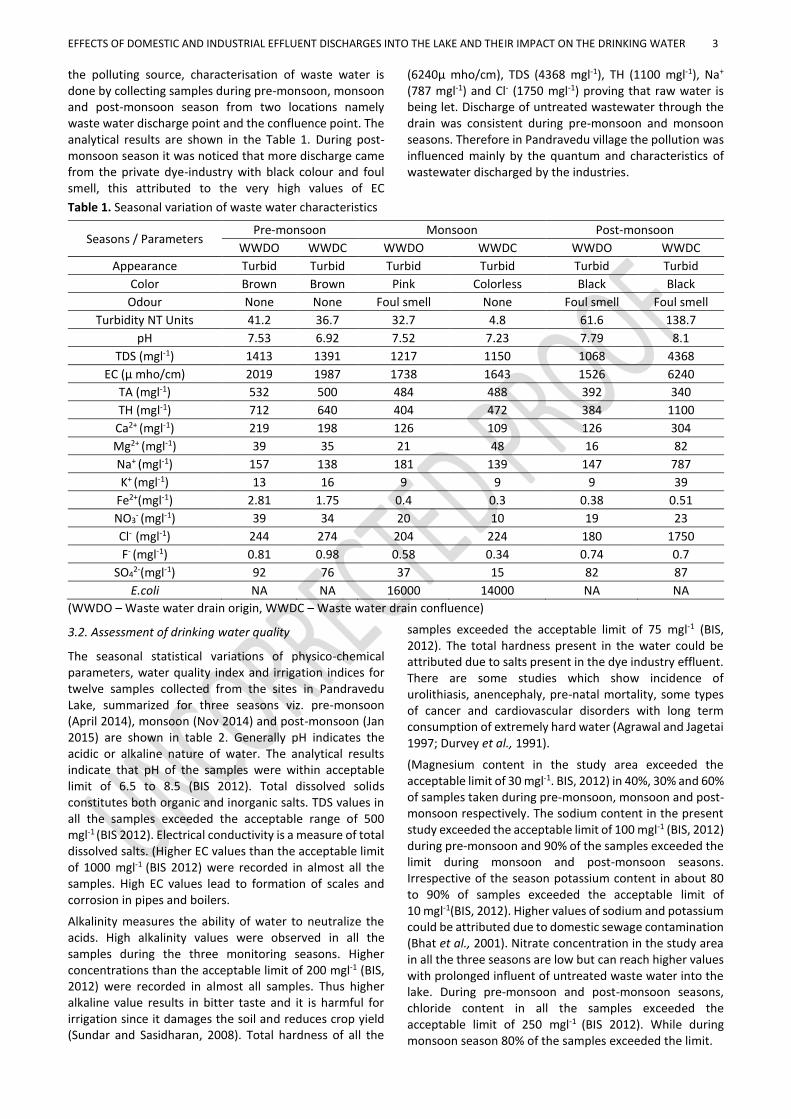
the polluting source, characterisation of waste water is done by collecting samples during pre-monsoon, monsoon and post-monsoon season from two locations namely waste water discharge point and the confluence point. The analytical results are shown in the Table 1. During post-monsoon season it was noticed that more discharge came from the private dye-industry with black colour and foul smell, this attributed to the very high values of EC
(6240μ mho/cm), TDS (4368 mgl-1), TH (1100 mgl-1), Na+
(787 mgl-1) and Cl- (1750 mgl-1) proving that raw water is being let. Discharge of untreated wastewater through the drain was consistent during pre-monsoon and monsoon seasons. Therefore in Pandravedu village the pollution was influenced mainly by the quantum and characteristics of wastewater discharged by the industries.
Table 1. Seasonal variation of waste water characteristics
Seasons / Parameters Pre-monsoon Monsoon Post-monsoon
WWDO WWDC WWDO WWDC WWDO WWDC
Appearance Turbid Turbid Turbid Turbid Turbid Turbid
Color Brown Brown Pink Colorless Black Black
Odour None None Foul smell None Foul smell Foul smell
Turbidity NT Units 41.2 36.7 32.7 4.8 61.6 138.7
pH 7.53 6.92 7.52 7.23 7.79 8.1
TDS (mgl-1) 1413 1391 1217 1150 1068 4368
EC (μ mho/cm) 2019 1987 1738 1643 1526 6240
TA (mgl-1) 532 500 484 488 392 340
TH (mgl-1) 712 640 404 472 384 1100
Ca2+ (mgl-1) 219 198 126 109 126 304
Mg2+ (mgl-1) 39 35 21 48 16 82
Na+ (mgl-1) 157 138 181 139 147 787
K+ (mgl-1) 13 16 9 9 9 39
Fe2+(mgl-1) 2.81 1.75 0.4 0.3 0.38 0.51
NO3- (mgl-1) 39 34 20 10 19 23
Cl- (mgl-1) 244 274 204 224 180 1750
F- (mgl-1) 0.81 0.98 0.58 0.34 0.74 0.7
SO42-(mgl-1) 92 76 37 15 82 87
E.coli NA NA 16000 14000 NA NA
(WWDO – Waste water drain origin, WWDC – Waste water drain confluence)
3.2. Assessment of drinking water quality
The seasonal statistical variations of physico-chemical parameters, water quality index and irrigation indices for twelve samples collected from the sites in Pandravedu Lake, summarized for three seasons viz. pre-monsoon (April 2014), monsoon (Nov 2014) and post-monsoon (Jan 2015) are shown in table 2. Generally pH indicates the acidic or alkaline nature of water. The analytical results indicate that pH of the samples were within acceptable limit of 6.5 to 8.5 (BIS 2012). Total dissolved solids constitutes both organic and inorganic salts. TDS values in all the samples exceeded the acceptable range of 500 mgl-1 (BIS 2012). Electrical conductivity is a measure of total dissolved salts. (Higher EC values than the acceptable limit of 1000 mgl-1 (BIS 2012) were recorded in almost all the samples. High EC values lead to formation of scales and corrosion in pipes and boilers.
Alkalinity measures the ability of water to neutralize the acids. High alkalinity values were observed in all the samples during the three monitoring seasons. Higher concentrations than the acceptable limit of 200 mgl-1 (BIS, 2012) were recorded in almost all samples. Thus higher alkaline value results in bitter taste and it is harmful for irrigation since it damages the soil and reduces crop yield (Sundar and Sasidharan, 2008). Total hardness of all the
samples exceeded the acceptable limit of 75 mgl-1 (BIS, 2012). The total hardness present in the water could be attributed due to salts present in the dye industry effluent. There are some studies which show incidence of urolithiasis, anencephaly, pre-natal mortality, some types of cancer and cardiovascular disorders with long term consumption of extremely hard water (Agrawal and Jagetai 1997; Durvey et al., 1991).
(Magnesium content in the study area exceeded the acceptable limit of 30 mgl-1. BIS, 2012) in 40%, 30% and 60% of samples taken during pre-monsoon, monsoon and post-monsoon respectively. The sodium content in the present study exceeded the acceptable limit of 100 mgl-1 (BIS, 2012) during pre-monsoon and 90% of the samples exceeded the limit during monsoon and post-monsoon seasons. Irrespective of the season potassium content in about 80 to 90% of samples exceeded the acceptable limit of 10 mgl-1(BIS, 2012). Higher values of sodium and potassium could be attributed due to domestic sewage contamination (Bhat et al., 2001). Nitrate concentration in the study area in all the three seasons are low but can reach higher values with prolonged influent of untreated waste water into the lake. During pre-monsoon and post-monsoon seasons, chloride content in all the samples exceeded the acceptable limit of 250 mgl-1 (BIS 2012). While during monsoon season 80% of the samples exceeded the limit.
4 HEMAMALINI et al.
Hemamalini J., Mudgal B.V. and Sophia J.D. (2017), Effects of domestic and industrial effluent discharges into the lake and their impact on the drinking water in Pandravedu village, Tamil Nadu, India, Global NEST Journal, 19(X), XX-XX.
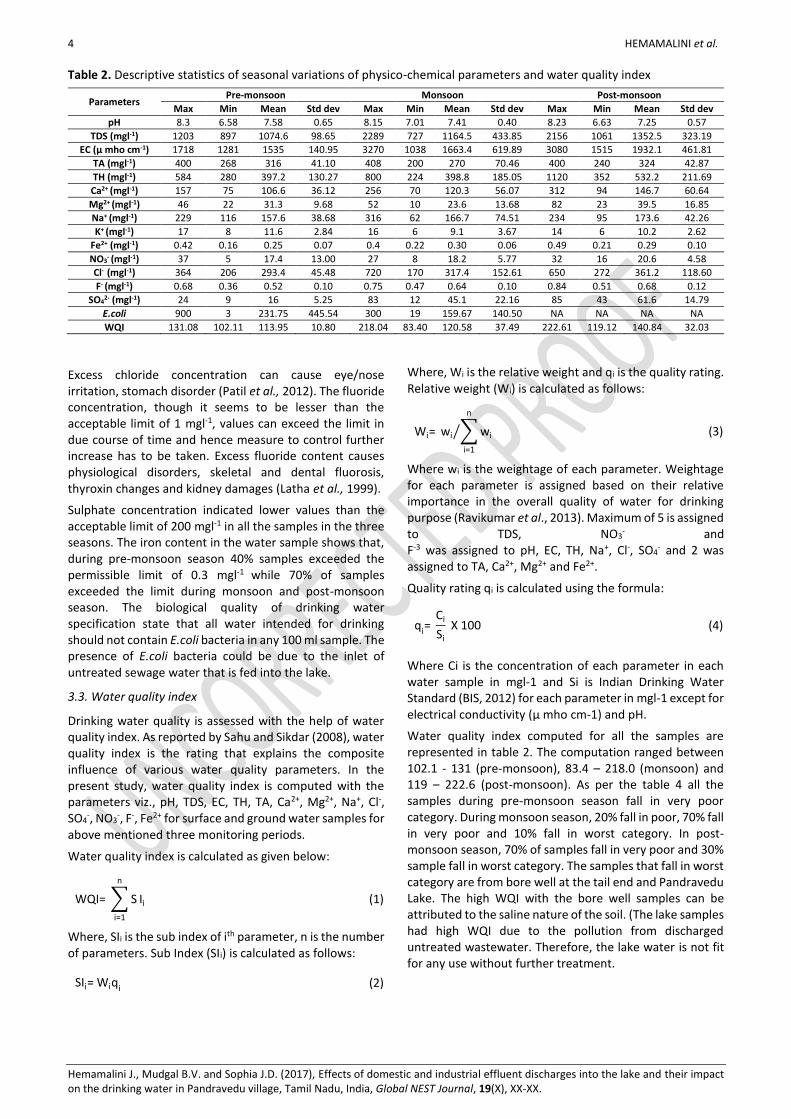
Table 2. Descriptive statistics of seasonal variations of physico-chemical parameters and water quality index
Parameters Pre-monsoon Monsoon Post-monsoon
Max Min Mean Std dev Max Min Mean Std dev Max Min Mean Std dev
pH 8.3 6.58 7.58 0.65 8.15 7.01 7.41 0.40 8.23 6.63 7.25 0.57
TDS (mgl-1) 1203 897 1074.6 98.65 2289 727 1164.5 433.85 2156 1061 1352.5 323.19
EC (µ mho cm-1) 1718 1281 1535 140.95 3270 1038 1663.4 619.89 3080 1515 1932.1 461.81
TA (mgl-1) 400 268 316 41.10 408 200 270 70.46 400 240 324 42.87
TH (mgl-1) 584 280 397.2 130.27 800 224 398.8 185.05 1120 352 532.2 211.69
Ca2+ (mgl-1) 157 75 106.6 36.12 256 70 120.3 56.07 312 94 146.7 60.64
Mg2+ (mgl-1) 46 22 31.3 9.68 52 10 23.6 13.68 82 23 39.5 16.85
Na+ (mgl-1) 229 116 157.6 38.68 316 62 166.7 74.51 234 95 173.6 42.26
K+ (mgl-1) 17 8 11.6 2.84 16 6 9.1 3.67 14 6 10.2 2.62
Fe2+ (mgl-1) 0.42 0.16 0.25 0.07 0.4 0.22 0.30 0.06 0.49 0.21 0.29 0.10
NO3- (mgl-1) 37 5 17.4 13.00 27 8 18.2 5.77 32 16 20.6 4.58
Cl- (mgl-1) 364 206 293.4 45.48 720 170 317.4 152.61 650 272 361.2 118.60
F- (mgl-1) 0.68 0.36 0.52 0.10 0.75 0.47 0.64 0.10 0.84 0.51 0.68 0.12
SO42- (mgl-1) 24 9 16 5.25 83 12 45.1 22.16 85 43 61.6 14.79
E.coli 900 3 231.75 445.54 300 19 159.67 140.50 NA NA NA NA
WQI 131.08 102.11 113.95 10.80 218.04 83.40 120.58 37.49 222.61 119.12 140.84 32.03
Excess chloride concentration can cause eye/nose irritation, stomach disorder (Patil et al., 2012). The fluoride concentration, though it seems to be lesser than the acceptable limit of 1 mgl-1, values can exceed the limit in due course of time and hence measure to control further increase has to be taken. Excess fluoride content causes physiological disorders, skeletal and dental fluorosis, thyroxin changes and kidney damages (Latha et al., 1999).
Sulphate concentration indicated lower values than the acceptable limit of 200 mgl-1 in all the samples in the three seasons. The iron content in the water sample shows that, during pre-monsoon season 40% samples exceeded the permissible limit of 0.3 mgl-1 while 70% of samples exceeded the limit during monsoon and post-monsoon season. The biological quality of drinking water specification state that all water intended for drinking should not contain E.coli bacteria in any 100 ml sample. The presence of E.coli bacteria could be due to the inlet of untreated sewage water that is fed into the lake.
3.3. Water quality index
Drinking water quality is assessed with the help of water quality index. As reported by Sahu and Sikdar (2008), water quality index is the rating that explains the composite influence of various water quality parameters. In the present study, water quality index is computed with the parameters viz., pH, TDS, EC, TH, TA, Ca2+, Mg2+, Na+, Cl-, SO4
-, NO3-, F-, Fe2+ for surface and ground water samples for
above mentioned three monitoring periods.
Water quality index is calculated as given below:
WQI= ∑ S
n
i=1
Ii (1)
Where, SIi is the sub index of ith parameter, n is the number of parameters. Sub Index (SIi) is calculated as follows:
SIi= Wiqi (2)
Where, Wi is the relative weight and qi is the quality rating. Relative weight (Wi) is calculated as follows:
Wi= wi ∑ wi
n
i=1
⁄ (3)
Where wi is the weightage of each parameter. Weightage for each parameter is assigned based on their relative importance in the overall quality of water for drinking purpose (Ravikumar et al., 2013). Maximum of 5 is assigned to TDS, NO3
- and F-3 was assigned to pH, EC, TH, Na+, Cl-, SO4
- and 2 was assigned to TA, Ca2+, Mg2+ and Fe2+.
Quality rating qi is calculated using the formula:
qi= Ci
Si
X 100 (4)
Where Ci is the concentration of each parameter in each water sample in mgl-1 and Si is Indian Drinking Water Standard (BIS, 2012) for each parameter in mgl-1 except for electrical conductivity (μ mho cm-1) and pH.
Water quality index computed for all the samples are represented in table 2. The computation ranged between 102.1 - 131 (pre-monsoon), 83.4 – 218.0 (monsoon) and 119 – 222.6 (post-monsoon). As per the table 4 all the samples during pre-monsoon season fall in very poor category. During monsoon season, 20% fall in poor, 70% fall in very poor and 10% fall in worst category. In post-monsoon season, 70% of samples fall in very poor and 30% sample fall in worst category. The samples that fall in worst category are from bore well at the tail end and Pandravedu Lake. The high WQI with the bore well samples can be attributed to the saline nature of the soil. (The lake samples had high WQI due to the pollution from discharged untreated wastewater. Therefore, the lake water is not fit for any use without further treatment.
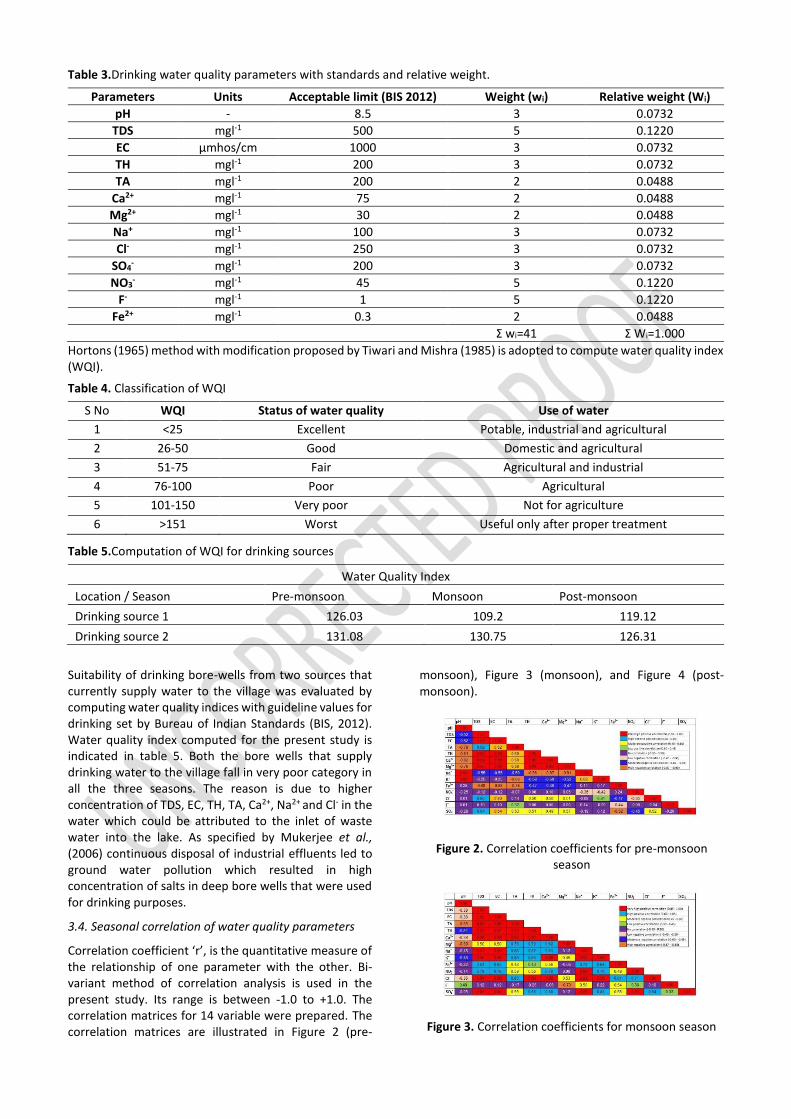
Table 3.Drinking water quality parameters with standards and relative weight.
Parameters Units Acceptable limit (BIS 2012) Weight (wi) Relative weight (Wi)
pH - 8.5 3 0.0732
TDS mgl-1 500 5 0.1220
EC µmhos/cm 1000 3 0.0732
TH mgl-1 200 3 0.0732
TA mgl-1 200 2 0.0488
Ca2+ mgl-1 75 2 0.0488
Mg2+ mgl-1 30 2 0.0488
Na+ mgl-1 100 3 0.0732
Cl- mgl-1 250 3 0.0732
SO4- mgl-1 200 3 0.0732
NO3- mgl-1 45 5 0.1220
F- mgl-1 1 5 0.1220
Fe2+ mgl-1 0.3 2 0.0488
Ʃ wi=41 Ʃ Wi=1.000
Hortons (1965) method with modification proposed by Tiwari and Mishra (1985) is adopted to compute water quality index (WQI).
Table 4. Classification of WQI
S No WQI Status of water quality Use of water
1 <25 Excellent Potable, industrial and agricultural
2 26-50 Good Domestic and agricultural
3 51-75 Fair Agricultural and industrial
4 76-100 Poor Agricultural
5 101-150 Very poor Not for agriculture
6 >151 Worst Useful only after proper treatment
Table 5.Computation of WQI for drinking sources
Water Quality Index
Location / Season Pre-monsoon Monsoon Post-monsoon
Drinking source 1 126.03 109.2 119.12
Drinking source 2 131.08 130.75 126.31
Suitability of drinking bore-wells from two sources that currently supply water to the village was evaluated by computing water quality indices with guideline values for drinking set by Bureau of Indian Standards (BIS, 2012). Water quality index computed for the present study is indicated in table 5. Both the bore wells that supply drinking water to the village fall in very poor category in all the three seasons. The reason is due to higher concentration of TDS, EC, TH, TA, Ca2+, Na2+ and Cl- in the water which could be attributed to the inlet of waste water into the lake. As specified by Mukerjee et al., (2006) continuous disposal of industrial effluents led to ground water pollution which resulted in high concentration of salts in deep bore wells that were used for drinking purposes.
3.4. Seasonal correlation of water quality parameters
Correlation coefficient ‘r’, is the quantitative measure of the relationship of one parameter with the other. Bi-variant method of correlation analysis is used in the present study. Its range is between -1.0 to +1.0. The correlation matrices for 14 variable were prepared. The correlation matrices are illustrated in Figure 2 (pre-
monsoon), Figure 3 (monsoon), and Figure 4 (post-monsoon).
Figure 2. Correlation coefficients for pre-monsoon season
Figure 3. Correlation coefficients for monsoon season
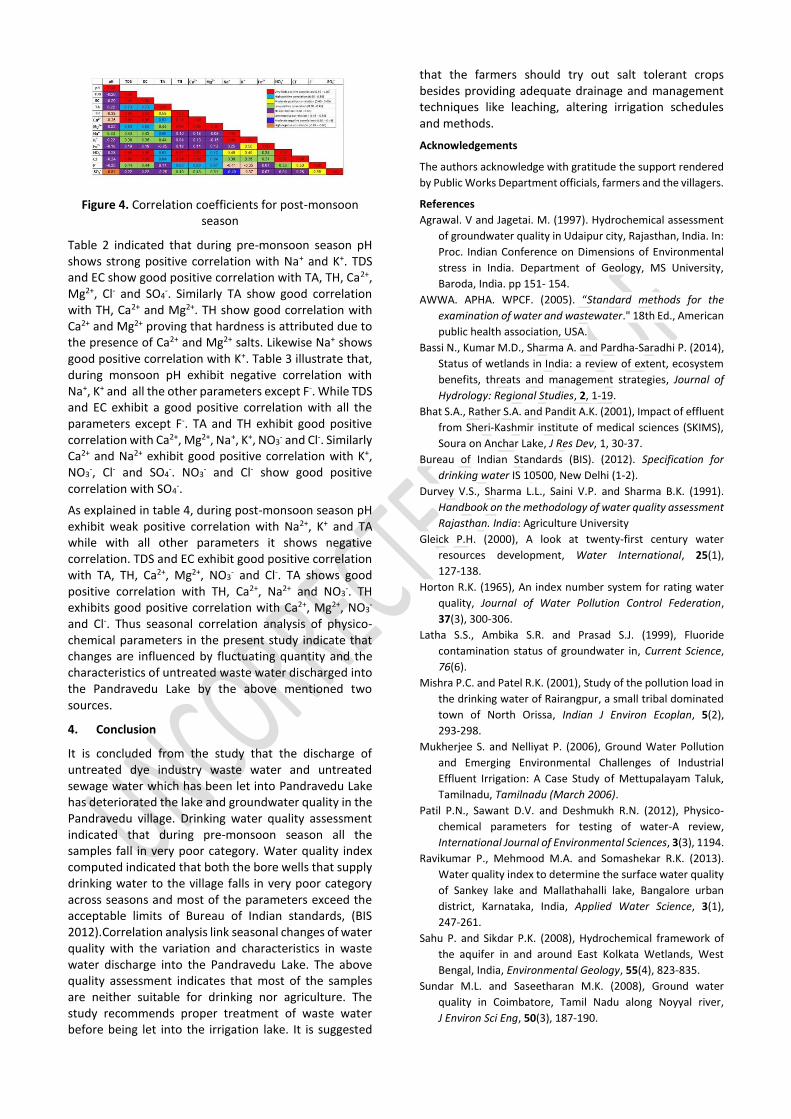
Figure 4. Correlation coefficients for post-monsoon season
Table 2 indicated that during pre-monsoon season pH shows strong positive correlation with Na+ and K+. TDS and EC show good positive correlation with TA, TH, Ca2+, Mg2+, Cl- and SO4
-. Similarly TA show good correlation with TH, Ca2+ and Mg2+. TH show good correlation with Ca2+ and Mg2+ proving that hardness is attributed due to the presence of Ca2+ and Mg2+ salts. Likewise Na+ shows good positive correlation with K+. Table 3 illustrate that, during monsoon pH exhibit negative correlation with Na+, K+ and all the other parameters except F-. While TDS and EC exhibit a good positive correlation with all the parameters except F-. TA and TH exhibit good positive correlation with Ca2+, Mg2+, Na+, K+, NO3
- and Cl-. Similarly Ca2+ and Na2+ exhibit good positive correlation with K+, NO3
-, Cl- and SO4-. NO3
- and Cl- show good positive correlation with SO4
-.
As explained in table 4, during post-monsoon season pH exhibit weak positive correlation with Na2+, K+ and TA while with all other parameters it shows negative correlation. TDS and EC exhibit good positive correlation with TA, TH, Ca2+, Mg2+, NO3
- and Cl-. TA shows good positive correlation with TH, Ca2+, Na2+ and NO3
-. TH exhibits good positive correlation with Ca2+, Mg2+, NO3
-
and Cl-. Thus seasonal correlation analysis of physico-chemical parameters in the present study indicate that changes are influenced by fluctuating quantity and the characteristics of untreated waste water discharged into the Pandravedu Lake by the above mentioned two sources.
4. Conclusion
It is concluded from the study that the discharge of untreated dye industry waste water and untreated sewage water which has been let into Pandravedu Lake has deteriorated the lake and groundwater quality in the Pandravedu village. Drinking water quality assessment indicated that during pre-monsoon season all the samples fall in very poor category. Water quality index computed indicated that both the bore wells that supply drinking water to the village falls in very poor category across seasons and most of the parameters exceed the acceptable limits of Bureau of Indian standards, (BIS 2012).Correlation analysis link seasonal changes of water quality with the variation and characteristics in waste water discharge into the Pandravedu Lake. The above quality assessment indicates that most of the samples are neither suitable for drinking nor agriculture. The study recommends proper treatment of waste water before being let into the irrigation lake. It is suggested
that the farmers should try out salt tolerant crops besides providing adequate drainage and management techniques like leaching, altering irrigation schedules and methods.
Acknowledgements
The authors acknowledge with gratitude the support rendered
by Public Works Department officials, farmers and the villagers.
References
Agrawal. V and Jagetai. M. (1997). Hydrochemical assessment
of groundwater quality in Udaipur city, Rajasthan, India. In:
Proc. Indian Conference on Dimensions of Environmental
stress in India. Department of Geology, MS University,
Baroda, India. pp 151- 154.
AWWA. APHA. WPCF. (2005). “Standard methods for the
examination of water and wastewater." 18th Ed., American
public health association, USA.
Bassi N., Kumar M.D., Sharma A. and Pardha-Saradhi P. (2014),
Status of wetlands in India: a review of extent, ecosystem
benefits, threats and management strategies, Journal of
Hydrology: Regional Studies, 2, 1-19.
Bhat S.A., Rather S.A. and Pandit A.K. (2001), Impact of effluent
from Sheri-Kashmir institute of medical sciences (SKIMS),
Soura on Anchar Lake, J Res Dev, 1, 30-37.
Bureau of Indian Standards (BIS). (2012). Specification for
drinking water IS 10500, New Delhi (1-2).
Durvey V.S., Sharma L.L., Saini V.P. and Sharma B.K. (1991).
Handbook on the methodology of water quality assessment
Rajasthan. India: Agriculture University
Gleick P.H. (2000), A look at twenty-first century water
resources development, Water International, 25(1),
127-138.
Horton R.K. (1965), An index number system for rating water
quality, Journal of Water Pollution Control Federation,
37(3), 300-306.
Latha S.S., Ambika S.R. and Prasad S.J. (1999), Fluoride
contamination status of groundwater in, Current Science,
76(6).
Mishra P.C. and Patel R.K. (2001), Study of the pollution load in
the drinking water of Rairangpur, a small tribal dominated
town of North Orissa, Indian J Environ Ecoplan, 5(2),
293-298.
Mukherjee S. and Nelliyat P. (2006), Ground Water Pollution
and Emerging Environmental Challenges of Industrial
Effluent Irrigation: A Case Study of Mettupalayam Taluk,
Tamilnadu, Tamilnadu (March 2006).
Patil P.N., Sawant D.V. and Deshmukh R.N. (2012), Physico-
chemical parameters for testing of water-A review,
International Journal of Environmental Sciences, 3(3), 1194.
Ravikumar P., Mehmood M.A. and Somashekar R.K. (2013).
Water quality index to determine the surface water quality
of Sankey lake and Mallathahalli lake, Bangalore urban
district, Karnataka, India, Applied Water Science, 3(1),
247-261.
Sahu P. and Sikdar P.K. (2008), Hydrochemical framework of
the aquifer in and around East Kolkata Wetlands, West
Bengal, India, Environmental Geology, 55(4), 823-835.
Sundar M.L. and Saseetharan M.K. (2008), Ground water
quality in Coimbatore, Tamil Nadu along Noyyal river,
J Environ Sci Eng, 50(3), 187-190.
Tiwari T.N. and Mishra M. (1985), A preliminary assignment of
water quality index of major Indian rivers, Indian journal of
environmental protection, 5(4), 276-279.
Yao S., Xue B. and Kong D. (2010), Chronology and nutrients
change in recent sediment of Taihu Lake, lower Changjiang
River Basin, East China, Chinese Geographical Science,
20(3), 202-208.
Zhang Q., Li Z., Zeng G., Li J., Fang Y., Yuan Q. and Ye F. (2009),
Assessment of surface water quality using multivariate
statistical techniques in red soil hilly region: a case study of
Xiangjiang watershed, China, Environmental monitoring
and assessment, 152(1-4), 123-131.