Effect of Cyclodextrin Nanocavity Confinement on the Photophysics of a β-Carboline Analogue: A...
8
Effect of Cyclodextrin Nanocavity Confinement on the Photophysics of a -Carboline Analogue: A Spectroscopic Study Paramita Das, Alok Chakrabarty, Basudeb Haldar, Arabinda Mallick, and Nitin Chattopadhyay* Department of Chemistry, JadaVpur UniVersity, Calcutta 700 032, India ReceiVed: March 17, 2007; In Final Form: April 20, 2007 Interaction of a -carboline based biologically active molecule, 3-acetyl-4-oxo-6,7-dihydro-12H indolo-[2,3- a] quinolizine (AODIQ), with R-, -, and γ-cyclodextrins (CDs) in aqueous solution has been studied using steady state and time-resolved fluorescence and steady-state fluorescence anisotropy techniques. Polarity dependent intramolecular charge transfer (ICT) process is responsible for the remarkable sensitivity of this biological fluorophore to the CD environments. Upon encapsulation, the CT fluorescence exhibits hypsochromic shift along with enhancements in the fluorescence yield, fluorescence anisotropy (r), and fluorescence lifetime. The reduction in the nonradiative deactivation rate of the fluorophore within the CD nanocavities leads to an increase in both fluorescence yield and lifetime. Among the three CDs, γ-CD shows the most spectacular confinement effect. The results establish the formation of 1:1 AODIQ:CD inclusion complexes in R- and -CDs. In aqueous γ-CD solutions, however, depending on the concentration of the γ-CD, formation of both 1:1 and 1:2 complexes have been revealed. Hydrodynamic radii of the 1:1 and 1:2 probe-γ-CD supramolecular complexes have also been determined. 1. Introduction The last two decades have witnessed the importance of the organized assemblies on biological and photophysical processes. Reactants accommodated in molecular assemblies like cyclo- dextrins (CDs), micelles, reverse micelles, micro-emulsions, vesicles, and so forth often achieve a greater degree of organization compared to their geometries in the homogeneous solution and can mimic reactions in biosystems and also have potential for energy storage. 1 CDs are interesting microvessels capable of embedding appropriately sized molecules, and the resulting supramolecules can serve as excellent miniature models for enzyme-substrate complexes. The most remarkable property of the CDs is their ability to form inclusion complexes with a variety of organic molecules. CD complexation can give a beneficial modification of guest molecules such as solubility enhancement, physical isolation of incompatible compounds, control of volatility and sublimation, stabilization of labile guests in terms of long-term protection of color, odor and flavor, and so forth. 2 Furthermore, the chemical reactivity of the guest molecule can be modified remarkably through its incorporation into a CD cavity. Owing to their usefulness in the areas of synthetic, analytical, and pharmaceutical chemistry, a large number of studies have been undertaken to understand the nature of the probe-CD inclusion complexes. The CD molecules have an internal cavity accessible to the guest molecules of proper dimension through an opening of 4.5-5.3 Å, 6.0-7.0 Å, and 7.5-8.5 Å for R-CD, -CD, and γ-CD, respectively; the depths of all remaining more or less the same (7.9 Å). 3,4 Thus, depending on the cavity size, CDs are capable of encapsulating guest molecules of different dimensions, with different guest:CD stoichiometries. Fluorometric techniques have been used extensively to understand the nature of the host-guest interactions. 5-7 The reduced polarity inside the CD cavity and the restricted space influence the photophysical and photochemical properties of the probe. 8-10 Many of these studies have revealed the formation of inclusion complexes of 1:1 and 1:2 type. 5-7,9 Such preference in the formation of the well-defined nanoconjugates in micro- heterogeneous environments is of much interest to present day science. Many investigations have employed such properties of CD inclusion complexes to understand the mechanistic details of many photoprocesses like excited-state proton transfer (ESPT), intramolecular charge transfer (ICT), and so forth. In an earlier work, 11 we reported that the fluorometric behavior of 3-acetyl-4-oxo-6,7-dihydro-12H indolo-[2,3-a] quinolizine (AODIQ) with dual emission from, namely, a locally excited (LE) state and a charge transfer (CT) state is very much dependent on the solvent polarity. Taking advantage of this behavior, we have already exploited AODIQ for demonstrating as well as characterizing various biological and biomimetic microenvironments. 12-17 It has also been exploited as an efficient fluorosensor for sensing essential trace metals. 16 AODIQ is essentially a -carboline analogue belonging to the group of bioactive indole family. Complexation of such biologically potent molecules with different biomimetic environments attracts interest of the researchers because of the molecule’s ability to achieve specific chemical efficiency as a result of organization in the reaction media. The basic intention of this series of spectroscopic work with AODIQ is to explore the potential usefulness of its fluorescence properties for the understanding of its interactions with relevant biological targets such as proteins, biomembranes, and so forth. In the present work, we have studied the nature and effect of inclusion of the probe in CDs of varying cavity dimensions (R-, -, and γ-CD) on its * Corresponding author. E-mail: [email protected]. Fax: 91-33-2414 6266. 7401 J. Phys. Chem. B 2007, 111, 7401-7408 10.1021/jp072142m CCC: $37.00 © 2007 American Chemical Society Published on Web 05/26/2007
Transcript of Effect of Cyclodextrin Nanocavity Confinement on the Photophysics of a β-Carboline Analogue: A...

Effect of Cyclodextrin Nanocavity Confinement on the Photophysics of aâ-CarbolineAnalogue: A Spectroscopic Study
Paramita Das, Alok Chakrabarty, Basudeb Haldar, Arabinda Mallick, andNitin Chattopadhyay*Department of Chemistry, JadaVpur UniVersity, Calcutta 700 032, India
ReceiVed: March 17, 2007; In Final Form: April 20, 2007
Interaction of aâ-carboline based biologically active molecule, 3-acetyl-4-oxo-6,7-dihydro-12H indolo-[2,3-a] quinolizine (AODIQ), withR-, â-, andγ-cyclodextrins (CDs) in aqueous solution has been studied usingsteady state and time-resolved fluorescence and steady-state fluorescence anisotropy techniques. Polaritydependent intramolecular charge transfer (ICT) process is responsible for the remarkable sensitivity of thisbiological fluorophore to the CD environments. Upon encapsulation, the CT fluorescence exhibits hypsochromicshift along with enhancements in the fluorescence yield, fluorescence anisotropy (r), and fluorescence lifetime.The reduction in the nonradiative deactivation rate of the fluorophore within the CD nanocavities leads to anincrease in both fluorescence yield and lifetime. Among the three CDs,γ-CD shows the most spectacularconfinement effect. The results establish the formation of 1:1 AODIQ:CD inclusion complexes inR- andâ-CDs. In aqueousγ-CD solutions, however, depending on the concentration of theγ-CD, formation of both1:1 and 1:2 complexes have been revealed. Hydrodynamic radii of the 1:1 and 1:2 probe-γ-CD supramolecularcomplexes have also been determined.
1. Introduction
The last two decades have witnessed the importance of theorganized assemblies on biological and photophysical processes.Reactants accommodated in molecular assemblies like cyclo-dextrins (CDs), micelles, reverse micelles, micro-emulsions,vesicles, and so forth often achieve a greater degree oforganization compared to their geometries in the homogeneoussolution and can mimic reactions in biosystems and also havepotential for energy storage.1
CDs are interesting microvessels capable of embeddingappropriately sized molecules, and the resulting supramoleculescan serve as excellent miniature models for enzyme-substratecomplexes. The most remarkable property of the CDs is theirability to form inclusion complexes with a variety of organicmolecules. CD complexation can give a beneficial modificationof guest molecules such as solubility enhancement, physicalisolation of incompatible compounds, control of volatility andsublimation, stabilization of labile guests in terms of long-termprotection of color, odor and flavor, and so forth.2 Furthermore,the chemical reactivity of the guest molecule can be modifiedremarkably through its incorporation into a CD cavity. Owingto their usefulness in the areas of synthetic, analytical, andpharmaceutical chemistry, a large number of studies have beenundertaken to understand the nature of the probe-CD inclusioncomplexes. The CD molecules have an internal cavity accessibleto the guest molecules of proper dimension through an openingof 4.5-5.3 Å, 6.0-7.0 Å, and 7.5-8.5 Å for R-CD, â-CD, andγ-CD, respectively; the depths of all remaining more or lessthe same (7.9 Å).3,4 Thus, depending on the cavity size, CDsare capable of encapsulating guest molecules of differentdimensions, with different guest:CD stoichiometries.
Fluorometric techniques have been used extensively tounderstand the nature of the host-guest interactions.5-7 Thereduced polarity inside the CD cavity and the restricted spaceinfluence the photophysical and photochemical properties of theprobe.8-10 Many of these studies have revealed the formationof inclusion complexes of 1:1 and 1:2 type.5-7,9 Such preferencein the formation of the well-defined nanoconjugates in micro-heterogeneous environments is of much interest to present dayscience. Many investigations have employed such properties ofCD inclusion complexes to understand the mechanistic detailsof many photoprocesses like excited-state proton transfer(ESPT), intramolecular charge transfer (ICT), and so forth. Inan earlier work,11 we reported that the fluorometric behaviorof 3-acetyl-4-oxo-6,7-dihydro-12H indolo-[2,3-a] quinolizine(AODIQ) with dual emission from, namely, a locally excited(LE) state and a charge transfer (CT) state is very muchdependent on the solvent polarity. Taking advantage of thisbehavior, we have already exploited AODIQ for demonstratingas well as characterizing various biological and biomimeticmicroenvironments.12-17 It has also been exploited as an efficientfluorosensor for sensing essential trace metals.16 AODIQ isessentially aâ-carboline analogue belonging to the group ofbioactive indole family. Complexation of such biologicallypotent molecules with different biomimetic environments attractsinterest of the researchers because of the molecule’s ability toachieve specific chemical efficiency as a result of organizationin the reaction media. The basic intention of this series ofspectroscopic work with AODIQ is to explore the potentialusefulness of its fluorescence properties for the understandingof its interactions with relevant biological targets such asproteins, biomembranes, and so forth. In the present work, wehave studied the nature and effect of inclusion of the probe inCDs of varying cavity dimensions (R-, â-, and γ-CD) on its
* Corresponding author. E-mail: [email protected]. Fax: 91-33-24146266.
7401J. Phys. Chem. B2007,111,7401-7408
10.1021/jp072142m CCC: $37.00 © 2007 American Chemical SocietyPublished on Web 05/26/2007
photophysical properties. An alternative approach for thedetermination of the hydrodynamic radii of the inclusioncomplexes has also been suggested.
2. Experimental Section
AODIQ (Scheme 1) was synthesized using the methodmentioned elsewhere.18 It was purified by column chromatog-raphy, and the purity of the compound was checked by thinlayer chromatography (TLC). The compound was furthervacuum sublimed before use.R-, â-, andγ-cyclodextrins (Fluka)were used as received without further purification. Triplydistilled water was used for making the experimental solutions.The solvent 1,4-dioxane used was of UV spectroscopic grade(Spectrochem India). The concentration of AODIQ was 4.0×10⁻⁶ mol dm-3 throughout the experiment.
Absorption and steady-state fluorescence measurements wereperformed using a Shimadzu MPS 2000 spectrophotometer anda Spex Fluorolog II spectrofluorimeter, respectively. The steady-state fluorescence anisotropy was performed with a Hitachispectrofluorimeter F-4010 model. Excitation and emissionbandwidths were 5 nm. Steady state anisotropy,r, was definedby
whereIVV andIVH are the intensities obtained with the excitationpolarizer oriented vertically and the emission polarizer orientedvertically and horizontally, respectively. TheG factor wasdefined as
I terms refer to parameters similar to those mentioned abovefor the horizontal position of the excitation polarizer. Quantumyields were determined using quinine sulfate in 0.1 N H2SO4
(æf ) 0.54)19 as reference. Fluorescence lifetimes weredetermined from time-resolved intensity decays by the methodof time-correlated single-photon counting using a picoseconddiode laser at 408 nm (IBH, UK, nanoLED-07) as the lightsource. The typical response time of this excitation source was70 ps. The decays were analyzed using IBH DAS-6 decayanalysis software. For all the lifetime measurements, thefluorescence decay curves were analyzed by a fitting programprovided by IBH. Goodness of fits was evaluated byø2 criterionand visual inspection of the residuals of the fitted function tothe data. Mean (average) fluorescence lifetime (τf) for biexpo-nential and triexponential iterative fittings were calculated fromthe decay times and the pre-exponential factors using thefollowing relations:
and
respectively.
Hyperchem 5.01, procured from Hypercube Inc., Canada, hasbeen used to get the optimized geometry and hence thecalculated dimension of the fluorophore (AODIQ). The semiem-pirical AM1-SCI method was adopted for the purpose. About200 configurations were considered.
3. Results
3.1. Steady State Absorption and Emission.In aqueousmedia, the absorption spectrum of AODIQ consists of a broadand unstructured lowest energy band at around 420 nm. Additionof R-, â-, andγ-CDs to the aqueous solution of AODIQ hardlychanges the absorption spectrum.
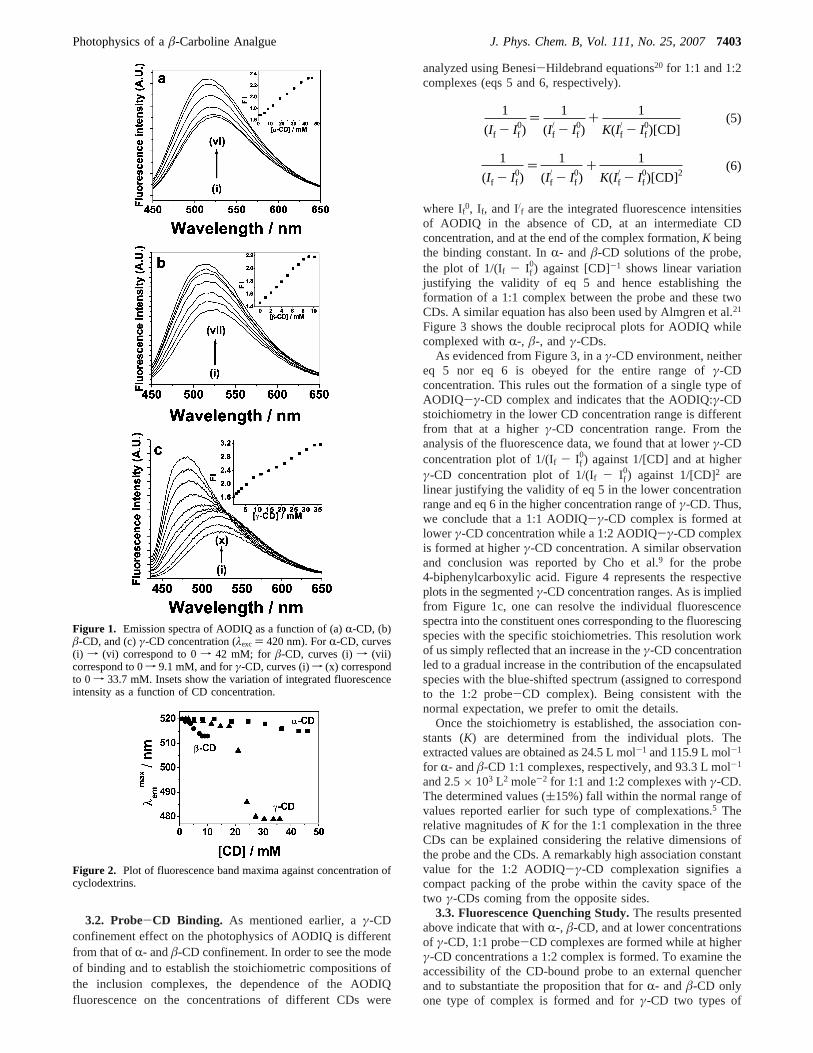
The room-temperature emission spectrum of the aqueoussolution of AODIQ shows a single broad and unstructured bandassigned to the CT emission with a maximum at around520 nm.11 Gradual addition ofR- andâ-CD is associated witha small blue shift of the band maximum along with a smallenhancement in the fluorescence intensity. The emissionspectrum of AODIQ in an aqueousγ-CD environment, however,exhibits a large blue shift along with an appreciable enhancementin the fluorescence yield. Figure 1 depicts the emission spectraof AODIQ in the three aqueous CD environments. Figure 1reveals that the variation in the emission behavior of AODIQin R-, â-, and the first part of theγ-CD set is qualitativelysimilar, while in the presence of higher concentrations ofγ-CD,something different is happening. It is also interesting to notethat the width (full width at half-maximum, FWHM) of theemission band of AODIQ (105 nm in water) remains more orless unaffected with the addition ofR-CD, â-CD, and lesseramount ofγ-CD. It is, however, remarkably reduced in thepresence of higher concentrations ofγ-CD (e.g., 85 nm in33.7 mM). The variation in the emission behavior of AODIQin aqueous solution with the addition of CDs indicates substan-tial interaction between the probe and the CDs pointing to theformation of probe-CD inclusion complexes. Considering thedimensions of the fluorophore and the CD cavities, the observa-tions in R-, â-, and the lower concentrations ofγ-CD lead tothe proposition of 1:1 inclusion complexes. From the doublebreak in the fluorescence pattern in theγ-CD solutions ascontrast to a single break in eitherR- or â-CD solutions (seeinsets of Figure 1) and a marked reduction in the fwhm, a secondtype of probe-CD complexation is proposed at the higher rangeof concentration ofγ-CD. The blue shift in the fluorescencespectrum of AODIQ in CD environments suggests that thepolarities in these environments are less than the polarity ofthe bulk aqueous phase since similar blue shift is observed inless polar pure solvents.11
At a particular concentration of CD, the probe exists in twoforms (free and bound), and the emission maximum is, thoughpresumably, an average of the band maxima for the probe inwater and in the completely bound state. The emission maximaof the fluorophore bound to different CDs were obtained fromthe plateaus in the plot of the emission maximum versusconcentration of the CDs (Figure 2). A critical look at Figure 2envisages single plateau forR-CD andâ-CD cases while twoplateaus are observed for the case ofγ-CD. The intermediateplateau in the case ofγ-CD is assigned to correspond to the1:1 while the final one corresponds to the 1:2 probe-CDcomplex. The emission maxima for the free fluorophore in waterand the fluorophore bound with different CDs are presented inTable 1. The forthcoming sections, while dealing with differentaspects of the probe-CD binding interactions, will confirm thisproposition of formation of both 1:1 and 1:2 inclusion complexeswith γ-CD in contrast with the formation of only a 1:1 complexwith R- andâ-CD.
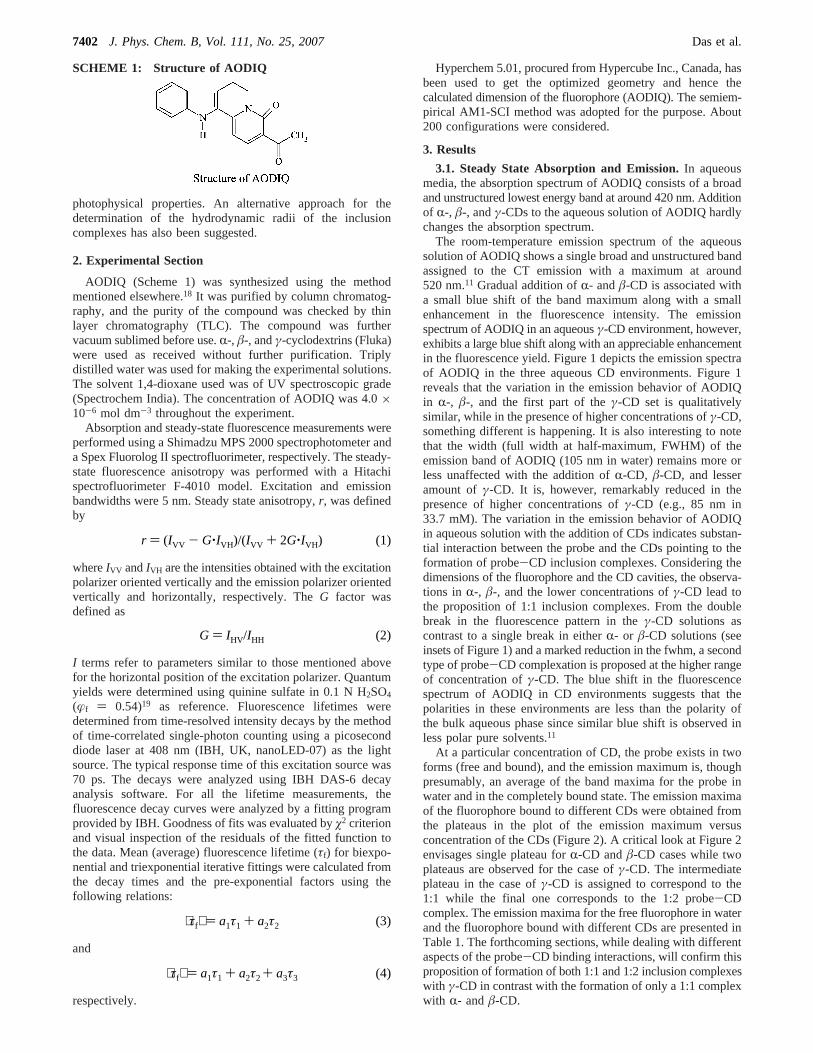
SCHEME 1: Structure of AODIQ
r ) (IVV - G‚IVH)/(IVV + 2G‚IVH) (1)
G ) IHV/IHH (2)
⟨τf⟩ ) a1τ1 + a2τ2 (3)
⟨τf⟩ ) a1τ1 + a2τ2 + a3τ3 (4)
7402 J. Phys. Chem. B, Vol. 111, No. 25, 2007 Das et al.
3.2. Probe-CD Binding. As mentioned earlier, aγ-CDconfinement effect on the photophysics of AODIQ is differentfrom that ofR- andâ-CD confinement. In order to see the modeof binding and to establish the stoichiometric compositions ofthe inclusion complexes, the dependence of the AODIQfluorescence on the concentrations of different CDs were
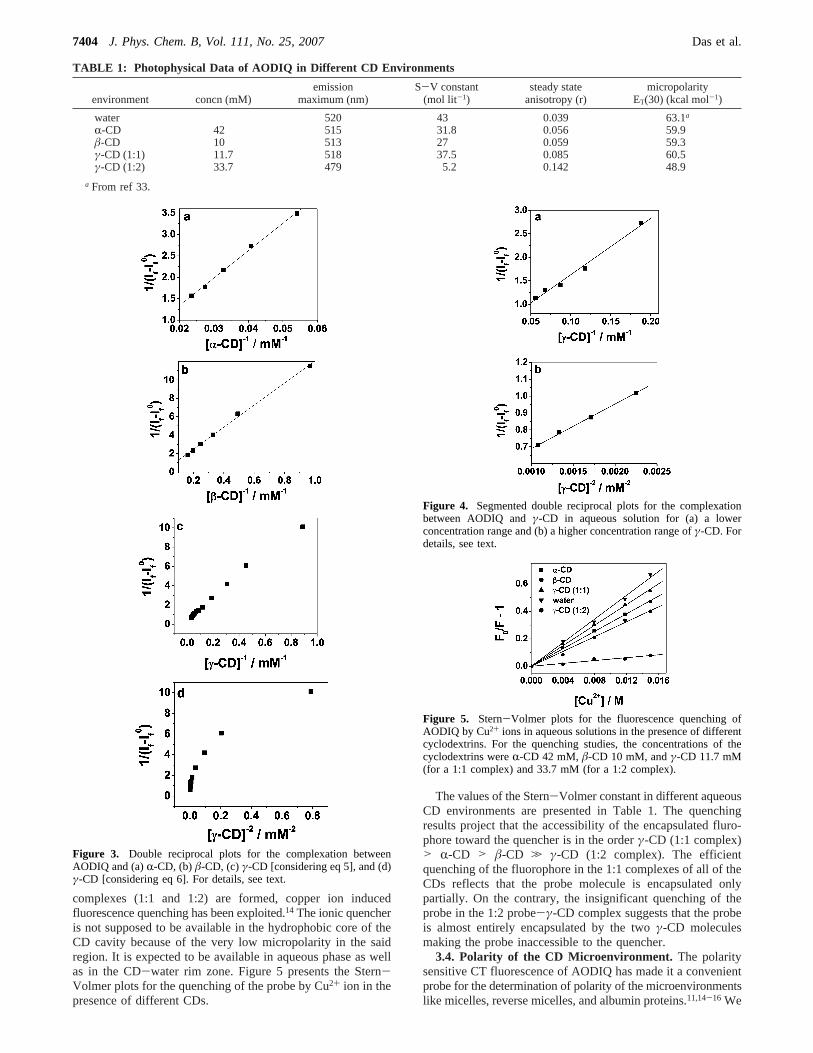
analyzed using Benesi-Hildebrand equations20 for 1:1 and 1:2complexes (eqs 5 and 6, respectively).
where If0, If, and I/f are the integrated fluorescence intensitiesof AODIQ in the absence of CD, at an intermediate CDconcentration, and at the end of the complex formation,K beingthe binding constant. InR- and â-CD solutions of the probe,the plot of 1/(If - If
0) against [CD]-1 shows linear variationjustifying the validity of eq 5 and hence establishing theformation of a 1:1 complex between the probe and these twoCDs. A similar equation has also been used by Almgren et al.21
Figure 3 shows the double reciprocal plots for AODIQ whilecomplexed withR-, â-, andγ-CDs.
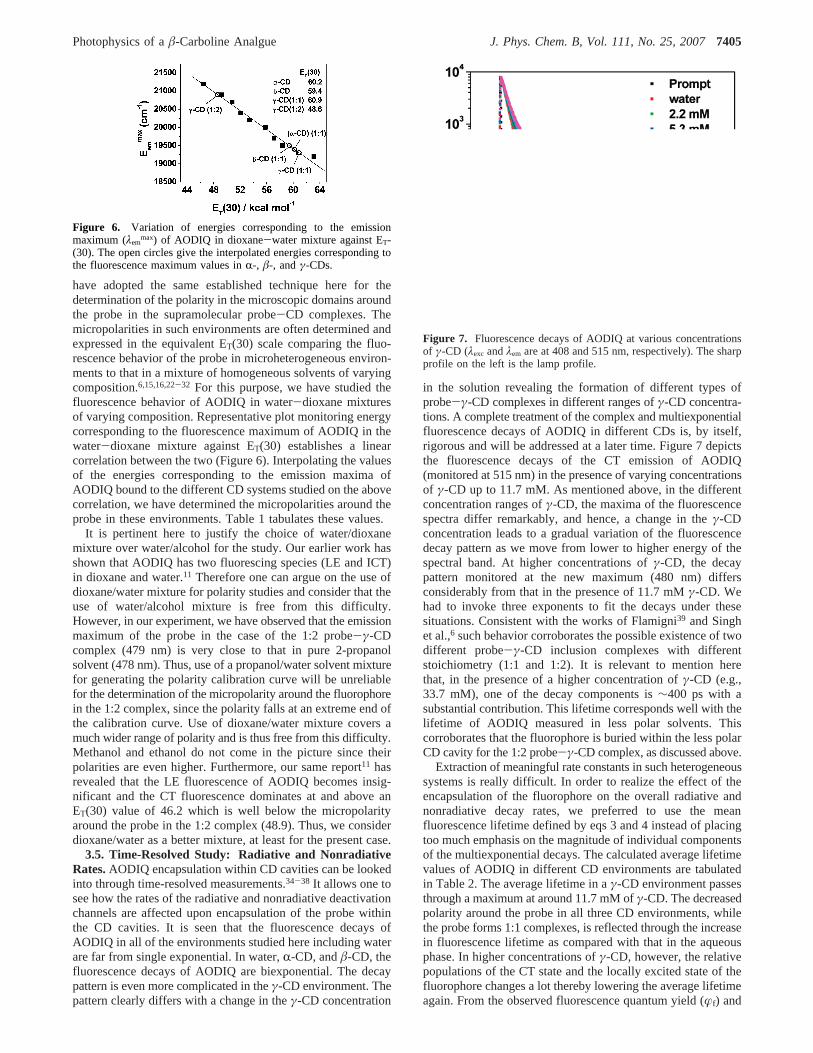
As evidenced from Figure 3, in aγ-CD environment, neithereq 5 nor eq 6 is obeyed for the entire range ofγ-CDconcentration. This rules out the formation of a single type ofAODIQ-γ-CD complex and indicates that the AODIQ:γ-CDstoichiometry in the lower CD concentration range is differentfrom that at a higherγ-CD concentration range. From theanalysis of the fluorescence data, we found that at lowerγ-CDconcentration plot of 1/(If - If
0) against 1/[CD] and at higherγ-CD concentration plot of 1/(If - If
0) against 1/[CD]2 arelinear justifying the validity of eq 5 in the lower concentrationrange and eq 6 in the higher concentration range ofγ-CD. Thus,we conclude that a 1:1 AODIQ-γ-CD complex is formed atlowerγ-CD concentration while a 1:2 AODIQ-γ-CD complexis formed at higherγ-CD concentration. A similar observationand conclusion was reported by Cho et al.9 for the probe4-biphenylcarboxylic acid. Figure 4 represents the respectiveplots in the segmentedγ-CD concentration ranges. As is impliedfrom Figure 1c, one can resolve the individual fluorescencespectra into the constituent ones corresponding to the fluorescingspecies with the specific stoichiometries. This resolution workof us simply reflected that an increase in theγ-CD concentrationled to a gradual increase in the contribution of the encapsulatedspecies with the blue-shifted spectrum (assigned to correspondto the 1:2 probe-CD complex). Being consistent with thenormal expectation, we prefer to omit the details.
Once the stoichiometry is established, the association con-stants (K) are determined from the individual plots. Theextracted values are obtained as 24.5 L mol-1 and 115.9 L mol-1
for R- andâ-CD 1:1 complexes, respectively, and 93.3 L mol-1
and 2.5× 10³ L2 mole-2 for 1:1 and 1:2 complexes withγ-CD.The determined values ((15%) fall within the normal range ofvalues reported earlier for such type of complexations.5 Therelative magnitudes ofK for the 1:1 complexation in the threeCDs can be explained considering the relative dimensions ofthe probe and the CDs. A remarkably high association constantvalue for the 1:2 AODIQ-γ-CD complexation signifies acompact packing of the probe within the cavity space of thetwo γ-CDs coming from the opposite sides.
3.3. Fluorescence Quenching Study.The results presentedabove indicate that withR-, â-CD, and at lower concentrationsof γ-CD, 1:1 probe-CD complexes are formed while at higherγ-CD concentrations a 1:2 complex is formed. To examine theaccessibility of the CD-bound probe to an external quencherand to substantiate the proposition that forR- andâ-CD onlyone type of complex is formed and forγ-CD two types of
Figure 1. Emission spectra of AODIQ as a function of (a)R-CD, (b)â-CD, and (c)γ-CD concentration (λexc ) 420 nm). ForR-CD, curves(i) f (vi) correspond to 0f 42 mM; for â-CD, curves (i)f (vii)correspond to 0f 9.1 mM, and forγ-CD, curves (i)f (x) correspondto 0 f 33.7 mM. Insets show the variation of integrated fluorescenceintensity as a function of CD concentration.
Figure 2. Plot of fluorescence band maxima against concentration ofcyclodextrins.
1
(If - If0)
) 1
(If/ - If
0)+ 1
K(If/ - If
0)[CD](5)
1
(If - If0)
) 1
(If/ - If
0)+ 1
K(If/ - If
0)[CD]2(6)
Photophysics of aâ-Carboline Analgue J. Phys. Chem. B, Vol. 111, No. 25, 20077403
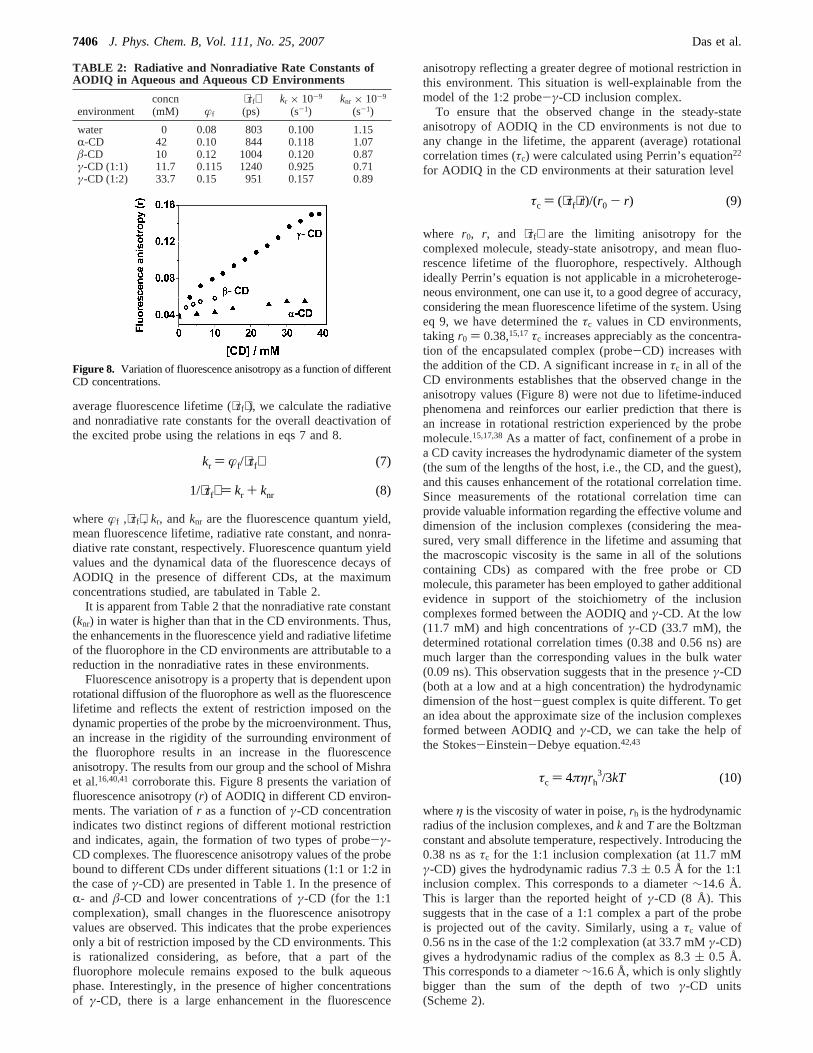
complexes (1:1 and 1:2) are formed, copper ion inducedfluorescence quenching has been exploited.14 The ionic quencheris not supposed to be available in the hydrophobic core of theCD cavity because of the very low micropolarity in the saidregion. It is expected to be available in aqueous phase as wellas in the CD-water rim zone. Figure 5 presents the Stern-Volmer plots for the quenching of the probe by Cu2+ ion in thepresence of different CDs.
The values of the Stern-Volmer constant in different aqueousCD environments are presented in Table 1. The quenchingresults project that the accessibility of the encapsulated fluro-phore toward the quencher is in the orderγ-CD (1:1 complex)> R-CD > â-CD . γ-CD (1:2 complex). The efficientquenching of the fluorophore in the 1:1 complexes of all of theCDs reflects that the probe molecule is encapsulated onlypartially. On the contrary, the insignificant quenching of theprobe in the 1:2 probe-γ-CD complex suggests that the probeis almost entirely encapsulated by the twoγ-CD moleculesmaking the probe inaccessible to the quencher.
3.4. Polarity of the CD Microenvironment. The polaritysensitive CT fluorescence of AODIQ has made it a convenientprobe for the determination of polarity of the microenvironmentslike micelles, reverse micelles, and albumin proteins.11,14-16 We
TABLE 1: Photophysical Data of AODIQ in Different CD Environments
environment concn (mM)emission
maximum (nm)S-V constant
(mol lit-1)steady state
anisotropy (r)micropolarity
ET(30) (kcal mol-1)
water 520 43 0.039 63.1a
R-CD 42 515 31.8 0.056 59.9â-CD 10 513 27 0.059 59.3γ-CD (1:1) 11.7 518 37.5 0.085 60.5γ-CD (1:2) 33.7 479 5.2 0.142 48.9
a From ref 33.
Figure 3. Double reciprocal plots for the complexation betweenAODIQ and (a)R-CD, (b)â-CD, (c)γ-CD [considering eq 5], and (d)γ-CD [considering eq 6]. For details, see text.
Figure 4. Segmented double reciprocal plots for the complexationbetween AODIQ andγ-CD in aqueous solution for (a) a lowerconcentration range and (b) a higher concentration range ofγ-CD. Fordetails, see text.
Figure 5. Stern-Volmer plots for the fluorescence quenching ofAODIQ by Cu2+ ions in aqueous solutions in the presence of differentcyclodextrins. For the quenching studies, the concentrations of thecyclodextrins wereR-CD 42 mM,â-CD 10 mM, andγ-CD 11.7 mM(for a 1:1 complex) and 33.7 mM (for a 1:2 complex).
7404 J. Phys. Chem. B, Vol. 111, No. 25, 2007 Das et al.
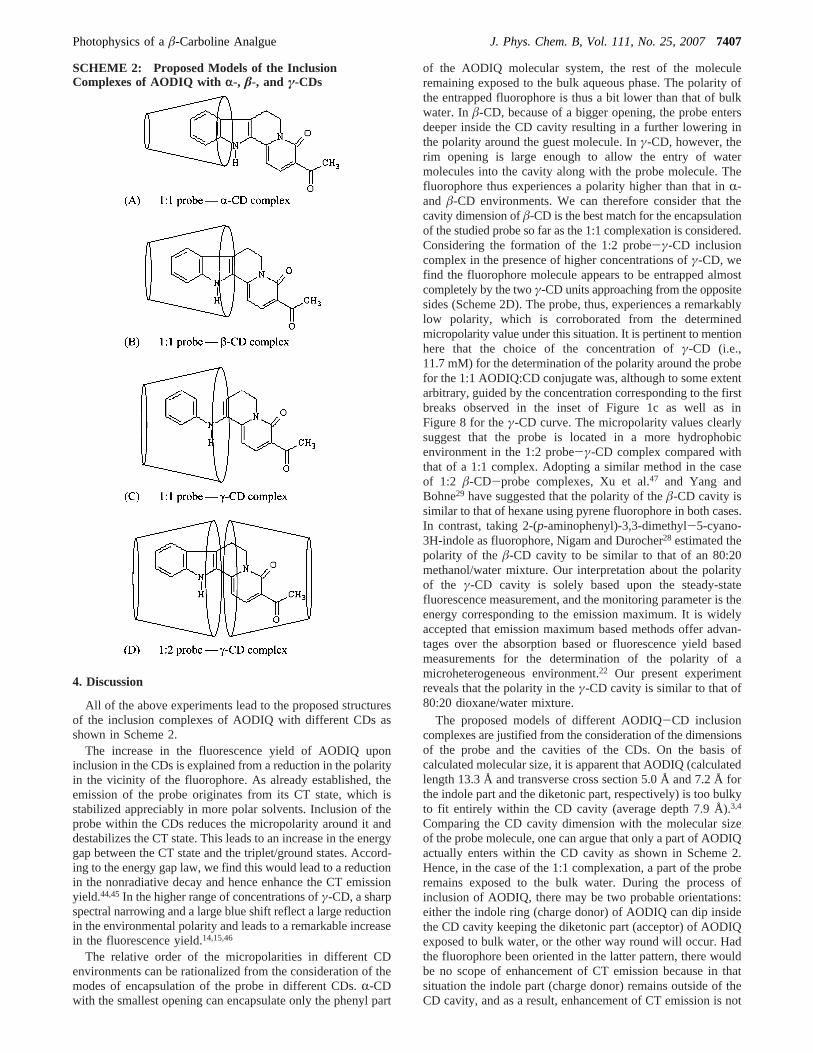
have adopted the same established technique here for thedetermination of the polarity in the microscopic domains aroundthe probe in the supramolecular probe-CD complexes. Themicropolarities in such environments are often determined andexpressed in the equivalent ET(30) scale comparing the fluo-rescence behavior of the probe in microheterogeneous environ-ments to that in a mixture of homogeneous solvents of varyingcomposition.6,15,16,22-32 For this purpose, we have studied thefluorescence behavior of AODIQ in water-dioxane mixturesof varying composition. Representative plot monitoring energycorresponding to the fluorescence maximum of AODIQ in thewater-dioxane mixture against ET(30) establishes a linearcorrelation between the two (Figure 6). Interpolating the valuesof the energies corresponding to the emission maxima ofAODIQ bound to the different CD systems studied on the abovecorrelation, we have determined the micropolarities around theprobe in these environments. Table 1 tabulates these values.
It is pertinent here to justify the choice of water/dioxanemixture over water/alcohol for the study. Our earlier work hasshown that AODIQ has two fluorescing species (LE and ICT)in dioxane and water.11 Therefore one can argue on the use ofdioxane/water mixture for polarity studies and consider that theuse of water/alcohol mixture is free from this difficulty.However, in our experiment, we have observed that the emissionmaximum of the probe in the case of the 1:2 probe-γ-CDcomplex (479 nm) is very close to that in pure 2-propanolsolvent (478 nm). Thus, use of a propanol/water solvent mixturefor generating the polarity calibration curve will be unreliablefor the determination of the micropolarity around the fluorophorein the 1:2 complex, since the polarity falls at an extreme end ofthe calibration curve. Use of dioxane/water mixture covers amuch wider range of polarity and is thus free from this difficulty.Methanol and ethanol do not come in the picture since theirpolarities are even higher. Furthermore, our same report11 hasrevealed that the LE fluorescence of AODIQ becomes insig-nificant and the CT fluorescence dominates at and above anET(30) value of 46.2 which is well below the micropolarityaround the probe in the 1:2 complex (48.9). Thus, we considerdioxane/water as a better mixture, at least for the present case.
3.5. Time-Resolved Study: Radiative and NonradiativeRates.AODIQ encapsulation within CD cavities can be lookedinto through time-resolved measurements.34-38 It allows one tosee how the rates of the radiative and nonradiative deactivationchannels are affected upon encapsulation of the probe withinthe CD cavities. It is seen that the fluorescence decays ofAODIQ in all of the environments studied here including waterare far from single exponential. In water,R-CD, andâ-CD, thefluorescence decays of AODIQ are biexponential. The decaypattern is even more complicated in theγ-CD environment. Thepattern clearly differs with a change in theγ-CD concentration
in the solution revealing the formation of different types ofprobe-γ-CD complexes in different ranges ofγ-CD concentra-tions. A complete treatment of the complex and multiexponentialfluorescence decays of AODIQ in different CDs is, by itself,rigorous and will be addressed at a later time. Figure 7 depictsthe fluorescence decays of the CT emission of AODIQ(monitored at 515 nm) in the presence of varying concentrationsof γ-CD up to 11.7 mM. As mentioned above, in the differentconcentration ranges ofγ-CD, the maxima of the fluorescencespectra differ remarkably, and hence, a change in theγ-CDconcentration leads to a gradual variation of the fluorescencedecay pattern as we move from lower to higher energy of thespectral band. At higher concentrations ofγ-CD, the decaypattern monitored at the new maximum (480 nm) differsconsiderably from that in the presence of 11.7 mMγ-CD. Wehad to invoke three exponents to fit the decays under thesesituations. Consistent with the works of Flamigni39 and Singhet al.,6 such behavior corroborates the possible existence of twodifferent probe-γ-CD inclusion complexes with differentstoichiometry (1:1 and 1:2). It is relevant to mention herethat, in the presence of a higher concentration ofγ-CD (e.g.,33.7 mM), one of the decay components is∼400 ps with asubstantial contribution. This lifetime corresponds well with thelifetime of AODIQ measured in less polar solvents. Thiscorroborates that the fluorophore is buried within the less polarCD cavity for the 1:2 probe-γ-CD complex, as discussed above.
Extraction of meaningful rate constants in such heterogeneoussystems is really difficult. In order to realize the effect of theencapsulation of the fluorophore on the overall radiative andnonradiative decay rates, we preferred to use the meanfluorescence lifetime defined by eqs 3 and 4 instead of placingtoo much emphasis on the magnitude of individual componentsof the multiexponential decays. The calculated average lifetimevalues of AODIQ in different CD environments are tabulatedin Table 2. The average lifetime in aγ-CD environment passesthrough a maximum at around 11.7 mM ofγ-CD. The decreasedpolarity around the probe in all three CD environments, whilethe probe forms 1:1 complexes, is reflected through the increasein fluorescence lifetime as compared with that in the aqueousphase. In higher concentrations ofγ-CD, however, the relativepopulations of the CT state and the locally excited state of thefluorophore changes a lot thereby lowering the average lifetimeagain. From the observed fluorescence quantum yield (æf) and
Figure 6. Variation of energies corresponding to the emissionmaximum (λem
max) of AODIQ in dioxane-water mixture against ET-(30). The open circles give the interpolated energies corresponding tothe fluorescence maximum values inR-, â-, andγ-CDs.
Figure 7. Fluorescence decays of AODIQ at various concentrationsof γ-CD (λexc andλem are at 408 and 515 nm, respectively). The sharpprofile on the left is the lamp profile.
Photophysics of aâ-Carboline Analgue J. Phys. Chem. B, Vol. 111, No. 25, 20077405
average fluorescence lifetime (⟨τf⟩), we calculate the radiativeand nonradiative rate constants for the overall deactivation ofthe excited probe using the relations in eqs 7 and 8.
whereæf ,⟨τf⟩, kr, andknr are the fluorescence quantum yield,mean fluorescence lifetime, radiative rate constant, and nonra-diative rate constant, respectively. Fluorescence quantum yieldvalues and the dynamical data of the fluorescence decays ofAODIQ in the presence of different CDs, at the maximumconcentrations studied, are tabulated in Table 2.
It is apparent from Table 2 that the nonradiative rate constant(knr) in water is higher than that in the CD environments. Thus,the enhancements in the fluorescence yield and radiative lifetimeof the fluorophore in the CD environments are attributable to areduction in the nonradiative rates in these environments.
Fluorescence anisotropy is a property that is dependent uponrotational diffusion of the fluorophore as well as the fluorescencelifetime and reflects the extent of restriction imposed on thedynamic properties of the probe by the microenvironment. Thus,an increase in the rigidity of the surrounding environment ofthe fluorophore results in an increase in the fluorescenceanisotropy. The results from our group and the school of Mishraet al.16,40,41corroborate this. Figure 8 presents the variation offluorescence anisotropy (r) of AODIQ in different CD environ-ments. The variation ofr as a function ofγ-CD concentrationindicates two distinct regions of different motional restrictionand indicates, again, the formation of two types of probe-γ-CD complexes. The fluorescence anisotropy values of the probebound to different CDs under different situations (1:1 or 1:2 inthe case ofγ-CD) are presented in Table 1. In the presence ofR- and â-CD and lower concentrations ofγ-CD (for the 1:1complexation), small changes in the fluorescence anisotropyvalues are observed. This indicates that the probe experiencesonly a bit of restriction imposed by the CD environments. Thisis rationalized considering, as before, that a part of thefluorophore molecule remains exposed to the bulk aqueousphase. Interestingly, in the presence of higher concentrationsof γ-CD, there is a large enhancement in the fluorescence
anisotropy reflecting a greater degree of motional restriction inthis environment. This situation is well-explainable from themodel of the 1:2 probe-γ-CD inclusion complex.
To ensure that the observed change in the steady-stateanisotropy of AODIQ in the CD environments is not due toany change in the lifetime, the apparent (average) rotationalcorrelation times (τc) were calculated using Perrin’s equation22
for AODIQ in the CD environments at their saturation level
where r0, r, and ⟨τf⟩ are the limiting anisotropy for thecomplexed molecule, steady-state anisotropy, and mean fluo-rescence lifetime of the fluorophore, respectively. Althoughideally Perrin’s equation is not applicable in a microheteroge-neous environment, one can use it, to a good degree of accuracy,considering the mean fluorescence lifetime of the system. Usingeq 9, we have determined theτc values in CD environments,taking r0 ) 0.38,15,17τc increases appreciably as the concentra-tion of the encapsulated complex (probe-CD) increases withthe addition of the CD. A significant increase inτc in all of theCD environments establishes that the observed change in theanisotropy values (Figure 8) were not due to lifetime-inducedphenomena and reinforces our earlier prediction that there isan increase in rotational restriction experienced by the probemolecule.15,17,38As a matter of fact, confinement of a probe ina CD cavity increases the hydrodynamic diameter of the system(the sum of the lengths of the host, i.e., the CD, and the guest),and this causes enhancement of the rotational correlation time.Since measurements of the rotational correlation time canprovide valuable information regarding the effective volume anddimension of the inclusion complexes (considering the mea-sured, very small difference in the lifetime and assuming thatthe macroscopic viscosity is the same in all of the solutionscontaining CDs) as compared with the free probe or CDmolecule, this parameter has been employed to gather additionalevidence in support of the stoichiometry of the inclusioncomplexes formed between the AODIQ andγ-CD. At the low(11.7 mM) and high concentrations ofγ-CD (33.7 mM), thedetermined rotational correlation times (0.38 and 0.56 ns) aremuch larger than the corresponding values in the bulk water(0.09 ns). This observation suggests that in the presenceγ-CD(both at a low and at a high concentration) the hydrodynamicdimension of the host-guest complex is quite different. To getan idea about the approximate size of the inclusion complexesformed between AODIQ andγ-CD, we can take the help ofthe Stokes-Einstein-Debye equation.42,43
whereη is the viscosity of water in poise,rh is the hydrodynamicradius of the inclusion complexes, andk andT are the Boltzmanconstant and absolute temperature, respectively. Introducing the0.38 ns asτc for the 1:1 inclusion complexation (at 11.7 mMγ-CD) gives the hydrodynamic radius 7.3( 0.5 Å for the 1:1inclusion complex. This corresponds to a diameter∼14.6 Å.This is larger than the reported height ofγ-CD (8 Å). Thissuggests that in the case of a 1:1 complex a part of the probeis projected out of the cavity. Similarly, using aτc value of0.56 ns in the case of the 1:2 complexation (at 33.7 mMγ-CD)gives a hydrodynamic radius of the complex as 8.3( 0.5 Å.This corresponds to a diameter∼16.6 Å, which is only slightlybigger than the sum of the depth of twoγ-CD units(Scheme 2).
TABLE 2: Radiative and Nonradiative Rate Constants ofAODIQ in Aqueous and Aqueous CD Environments
environmentconcn(mM) æf
⟨τf⟩(ps)
kr × 10-9
(s-1)knr × 10-9
(s-1)
water 0 0.08 803 0.100 1.15R-CD 42 0.10 844 0.118 1.07â-CD 10 0.12 1004 0.120 0.87γ-CD (1:1) 11.7 0.115 1240 0.925 0.71γ-CD (1:2) 33.7 0.15 951 0.157 0.89
Figure 8. Variation of fluorescence anisotropy as a function of differentCD concentrations.
kr ) æf/⟨τf⟩ (7)
1/⟨τf⟩ ) kr + knr (8)
τc ) (⟨τf⟩r)/(r0 - r) (9)
τc ) 4πηrh3/3kT (10)
7406 J. Phys. Chem. B, Vol. 111, No. 25, 2007 Das et al.
4. Discussion
All of the above experiments lead to the proposed structuresof the inclusion complexes of AODIQ with different CDs asshown in Scheme 2.
The increase in the fluorescence yield of AODIQ uponinclusion in the CDs is explained from a reduction in the polarityin the vicinity of the fluorophore. As already established, theemission of the probe originates from its CT state, which isstabilized appreciably in more polar solvents. Inclusion of theprobe within the CDs reduces the micropolarity around it anddestabilizes the CT state. This leads to an increase in the energygap between the CT state and the triplet/ground states. Accord-ing to the energy gap law, we find this would lead to a reductionin the nonradiative decay and hence enhance the CT emissionyield.44,45In the higher range of concentrations ofγ-CD, a sharpspectral narrowing and a large blue shift reflect a large reductionin the environmental polarity and leads to a remarkable increasein the fluorescence yield.14,15,46
The relative order of the micropolarities in different CDenvironments can be rationalized from the consideration of themodes of encapsulation of the probe in different CDs.R-CDwith the smallest opening can encapsulate only the phenyl part
of the AODIQ molecular system, the rest of the moleculeremaining exposed to the bulk aqueous phase. The polarity ofthe entrapped fluorophore is thus a bit lower than that of bulkwater. Inâ-CD, because of a bigger opening, the probe entersdeeper inside the CD cavity resulting in a further lowering inthe polarity around the guest molecule. Inγ-CD, however, therim opening is large enough to allow the entry of watermolecules into the cavity along with the probe molecule. Thefluorophore thus experiences a polarity higher than that inR-and â-CD environments. We can therefore consider that thecavity dimension ofâ-CD is the best match for the encapsulationof the studied probe so far as the 1:1 complexation is considered.Considering the formation of the 1:2 probe-γ-CD inclusioncomplex in the presence of higher concentrations ofγ-CD, wefind the fluorophore molecule appears to be entrapped almostcompletely by the twoγ-CD units approaching from the oppositesides (Scheme 2D). The probe, thus, experiences a remarkablylow polarity, which is corroborated from the determinedmicropolarity value under this situation. It is pertinent to mentionhere that the choice of the concentration ofγ-CD (i.e.,11.7 mM) for the determination of the polarity around the probefor the 1:1 AODIQ:CD conjugate was, although to some extentarbitrary, guided by the concentration corresponding to the firstbreaks observed in the inset of Figure 1c as well as inFigure 8 for theγ-CD curve. The micropolarity values clearlysuggest that the probe is located in a more hydrophobicenvironment in the 1:2 probe-γ-CD complex compared withthat of a 1:1 complex. Adopting a similar method in the caseof 1:2 â-CD-probe complexes, Xu et al.47 and Yang andBohne29 have suggested that the polarity of theâ-CD cavity issimilar to that of hexane using pyrene fluorophore in both cases.In contrast, taking 2-(p-aminophenyl)-3,3-dimethyl-5-cyano-3H-indole as fluorophore, Nigam and Durocher28 estimated thepolarity of theâ-CD cavity to be similar to that of an 80:20methanol/water mixture. Our interpretation about the polarityof the γ-CD cavity is solely based upon the steady-statefluorescence measurement, and the monitoring parameter is theenergy corresponding to the emission maximum. It is widelyaccepted that emission maximum based methods offer advan-tages over the absorption based or fluorescence yield basedmeasurements for the determination of the polarity of amicroheterogeneous environment.22 Our present experimentreveals that the polarity in theγ-CD cavity is similar to that of80:20 dioxane/water mixture.
The proposed models of different AODIQ-CD inclusioncomplexes are justified from the consideration of the dimensionsof the probe and the cavities of the CDs. On the basis ofcalculated molecular size, it is apparent that AODIQ (calculatedlength 13.3 Å and transverse cross section 5.0 Å and 7.2 Å forthe indole part and the diketonic part, respectively) is too bulkyto fit entirely within the CD cavity (average depth 7.9 Å).3,4
Comparing the CD cavity dimension with the molecular sizeof the probe molecule, one can argue that only a part of AODIQactually enters within the CD cavity as shown in Scheme 2.Hence, in the case of the 1:1 complexation, a part of the proberemains exposed to the bulk water. During the process ofinclusion of AODIQ, there may be two probable orientations:either the indole ring (charge donor) of AODIQ can dip insidethe CD cavity keeping the diketonic part (acceptor) of AODIQexposed to bulk water, or the other way round will occur. Hadthe fluorophore been oriented in the latter pattern, there wouldbe no scope of enhancement of CT emission because in thatsituation the indole part (charge donor) remains outside of theCD cavity, and as a result, enhancement of CT emission is not
SCHEME 2: Proposed Models of the InclusionComplexes of AODIQ with r-, â-, and γ-CDs
Photophysics of aâ-Carboline Analgue J. Phys. Chem. B, Vol. 111, No. 25, 20077407
feasible because of the polar character of the microenvironmentaround the chromophore. Since, the CT emission yield ofAODIQ increases with the formation of a 1:1 complex, theindole part is believed to remain inside the CD cavity keepingthe diketonic part of AODIQ exposed to bulk water. This lineof argument together with the transverse dimensions of theindole and the diketonic parts of AODIQ relative to the cavitydimensions of the CDs (particularlyR- andâ-CD) proposes thepossible geometry of the AODIQ-CD conjugate as shown inScheme 2(A)-2(C). Thus, in the case of the 1:1 complexation,a part of the probe remains exposed to the bulk aqueous phase.This open part is also amenable to complex formation withanother γ-CD leading to the formation of a 1:2 inclusioncomplex in the presence of higher concentrations ofγ-CD asdepicted in Scheme 2D.
5. Conclusion
The present work reports the study on the mode of encapsula-tion of a polarity sensitive fluorophore inR-, â-, and γ-CDcavities. The results reveal that the photophysical behavior ofAODIQ is modified significantly upon encapsulation of theprobe in the CD cavities. The variation of the fluorescenceproperties with the addition of the CDs reveal that while only1:1 probe-CD inclusion complexes are formed withR- andâ-CD, with γ-CD, both 1:1 and 1:2 complexes are formeddepending on the concentration ofγ-CD. The polarity of themicroenvironment around the complexed probe has also beendetermined. The increase in the overall fluorescence yield andlifetime of the probe within the CDs has been ascribed to thelowering in the nonradiative decay rates in these environments.Significant increase in the average rotational correlation timein the CD environments compared with that in a pure aqueousphase indicates that the rotational dynamics of AODIQ issubstantially slowed down upon binding with the CDs. Thehydrodynamic radii of the 1:1 and 1:2 probe-γ-CD inclusioncomplexes have been determined to be 7.3( 0.5 Å and 8.3(0.5 Å, respectively.
Acknowledgment. Financial support from DST and CSIR,government of India, is gratefully acknowledged. P.D. thanksCSIR for the research fellowship. The cooperation received fromDr. N. Sarkar, Dr. A. Chakraborty, and D. Seth of I.I.T.Kharagpur and Professor S. Basak and Dr. H. Chakraborty ofSINP for instrumental help is acknowledged. The authorsappreciate the critical and positive comments from one of thereviewers.
References and Notes
(1) Hashimoto, S.; Thomas, J. K.J. Am. Chem. Soc.1985, 107, 4655.(2) Caliceti, P.; Salmaso, S.; Semenzato, A.; Carofiglio, T.; Fornasier,
R.; Fermeglia, M.; Ferrone, M.; Pricl, S.Bioconjugate Chem.2003, 14,899.
(3) Li, S.; Purdy, W. C.Chem. ReV. 1992, 92, 1457.(4) D’Souza, V. T.; Bender, M. L.Acc. Chem. Res. 1987, 20, 146.(5) Mallick, A.; Haldar, B.; Chattopadhyay, N.J. Photochem. Photo-
biol. B 2005, 78, 215.
(6) Singh, M. K.; Pal, H.; Koti, A. S. R.; Sapre, A. V.J. Phys. Chem.A 2004, 108, 1465.
(7) Hamai, S.J. Phys. Chem. B1997, 101, 1707.(8) Cox, G. S.; Turro, N. J.J. Am. Chem. Soc.1984, 106, 422.(9) Cho, D. W.; Kim, Y. H.; Kang, S. G.; Yoon, M.J. Phys. Chem.
1994, 98, 558.(10) Douhal, A.Chem. ReV. 2004, 104, 1955.(11) Mallick, A.; Maiti, S.; Haldar, B.; Purkayastha, P.; Chattopadhyay,
N. Chem. Phys. Lett.2003, 371, 688.(12) Mallick, A.; Chattopadhyay, N.Biophys. Chem.2004, 109, 261.(13) Haldar, B.; Chakrabarty, A.; Mallick, A.; Mandal, M. C.; Das, P.;
Chattopadhyay, N.Langmuir2006, 22, 3514.(14) Mallick, A.; Haldar, B.; Maiti, S.; Chattopadhyay, N.J. Colloid
Interface Sci. 2004, 278, 215.(15) Mallick, A.; Haldar. B.; Chattopadhyay, N.J. Phys. Chem. B2005,
108, 14683.(16) Mallick, A.; Mandal, M. C.; Haldar, B.; Chakrabarty, A.; Das, P.;
Chattopadhyay, N.J. Am. Chem. Soc.2006, 128, 3126;2006, 128, 10629.(17) Mallick, A.; Haldar, B.; Maiti, S.; Bera, S. C.; Chattopadhyay, N.
J. Phys. Chem. B2005, 109, 14675.(18) Giri, V. S.; Maiti, B. C.; Pakrashi, S. C.Heterocycles1984, 22,
233.(19) Demas, J. N.; Crosby, G. A.J. Phys. Chem. 1971, 75, 991.(20) Benesi, M. L.; Hildebrand, J. H.J. Am. Chem. Soc. 1949, 71, 2703.(21) Almgren, M.; Grieser, F.; Thomas, J. K.J. Am. Chem. Soc. 1979,
101, 279.(22) Lakowicz, J. R.Principles of Fluorescence Spectroscopy; Ple-
num: New York, 1999.(23) Haldar, B.; Mallick, A.; Chattopadhyay, N.J. Photochem. Photobiol.
B 2005, 80, 217.(24) Bismuto, E.; Jameson, D.; Gratton, M., E.J. Am. Chem. Soc. 1987,
109, 5414.(25) Kossower, E. M.; Kantey, H.J. Am Chem. Soc. 1983, 105, 6236.(26) Macgregor, R. B.; Weber, G.Nature1986, 319, 70.(27) Connors, K. A.Chem. ReV. 1997, 97, 1325.(28) Nigam, S.; Durocher, G.J. Phys. Chem.1999, 100, 7135.(29) Yang, H.; Bohne, C.J. Phys. Chem. 1996, 100, 14533.(30) Ghosh, S. K.; Bhattacharya, S. C.Chem. Phys. Lipid2004, 131,
151.(31) Shannigrahi, M.; Bagchi, S.Spectrochim. Acta, Part A2005, 61,
2131.(32) Sytnik, A.; Kasha, M.Proc. Natl. Acad. Sci. U.S.A.1994, 91, 8627.(33) Reichardt, C.Chem. ReV. 1994, 94, 2319.(34) Chakrabarty, A.; Mallick, A.; Haldar, B.; Das, P.; Chattopadhyay,
N. Biomacromolecules2007, 8, 920.(35) Balabai, N.; Linton, B.; Napper, A.; Priyadarshi, S.; Sukharevsky,
A. P.; Waldek, D. H.J. Phys. Chem. B1998, 102, 9617.(36) Oshima, J.; Shiobara, S.; Naoumi, H.; Kaneko, S.; Yoshihara, T.;
Mishra, A. K.; Tobita, S.J. Phys. Chem. A2006, 110, 4629.(37) Chakrabarty, A.; Mallick, A.; Haldar, B.; Purkayastha, P.; Das, P.;
Chattopadhyay, N.Langmuir2007, 23, 4842.(38) Das, P.; Mallick, A.; Chakrabarty, A.; Haldar, B.; Chattopadhyay,
N. J. Chem. Phys.2006, 125, 044516.(39) Flamigni, L.J. Phys. Chem.1993, 97, 9566.(40) Deepa, S.; Mishra, A. K.J. Pharm. Biomed. Anal.2005, 38, 556.(41) Deepa, S.; Subramanian, S. K.; Mishra, A. K.Chemosphere2005,
61, 1580.(42) Fleming, G. R.Chemical Application of Ultrafast Spectroscopy;
Oxford University Press: London, 1986.(43) Sen, P.; Roy, D.; Mondal, S. K.; Sahu, K.; Ghosh, S.; Bhattacharyya,
K. J. Phys. Chem. A2005, 109, 9716.(44) Bhattacharyya, K.; Chowdhury, M.Chem. ReV. 1993, 93, 507.(45) Kundu, S.; Bera, S. C.; Chattopadhyay, N.Indian J. Chem., Sect.
A: Inorg., Bio-inorg., Phys., Theor. Anal. Chem.1998, 37, 102.(46) Mukherjee, S.; Chattopadhyay, A.J. Fluoresc. 1995, 5, 237.(47) Xu, W.; Demas, J. N.; Degraff, B. A.; Whaley, M.J. Phys. Chem.
1993, 97, 6546.
7408 J. Phys. Chem. B, Vol. 111, No. 25, 2007 Das et al.