Designing an X-ray experiment - CCP4
36
Designing an X-ray experiment Gwyndaf Evans Diamond Light Source Harwell Science and Innovation Campus Didcot OX11 0DE [email protected]
Transcript of Designing an X-ray experiment - CCP4
Designing an X-ray experiment
Gwyndaf EvansDiamond Light Source
Harwell Science and Innovation CampusDidcot OX11 0DE
Contents
•
choose you weapon–
beamline variety
•
good data•
how the beamline and sample interact to affect data quality
•
tools that are available at beamlines to assist in making your measurements
•
small beam vs. large beam•
brief word about MAD and SAD strategies
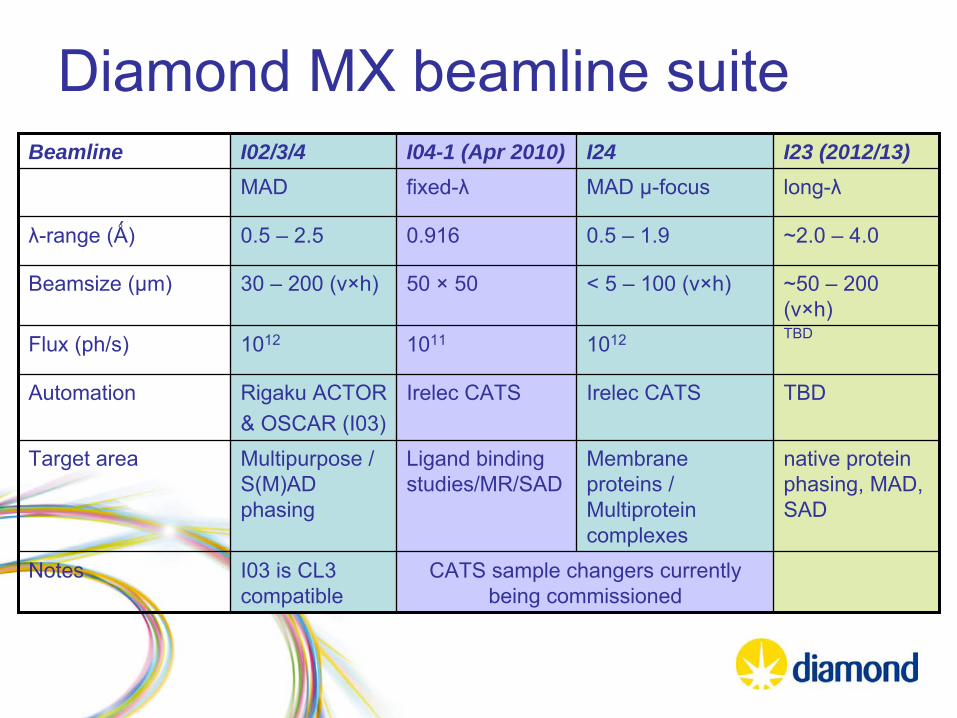
Diamond MX beamline suiteBeamline I02/3/4 I04-1 (Apr 2010) I24 I23 (2012/13)
MAD fixed-λ MAD μ-focus long-λ
λ-range (Ǻ) 0.5 –
2.5 0.916 0.5 –
1.9 ~2.0 –
4.0
Beamsize
(μm) 30 –
200 (v×h) 50 ×
50 < 5 –
100 (v×h) ~50 –
200 (v×h)
Flux (ph/s) 1012 1011 1012 TBD
Automation Rigaku ACTOR& OSCAR (I03)
Irelec CATS Irelec CATS TBD
Target area Multipurpose / S(M)AD phasing
Ligand binding studies/MR/SAD
Membrane proteins / Multiprotein
complexes
native protein phasing, MAD, SAD
Notes I03 is CL3 compatible
CATS sample changers currently being commissioned
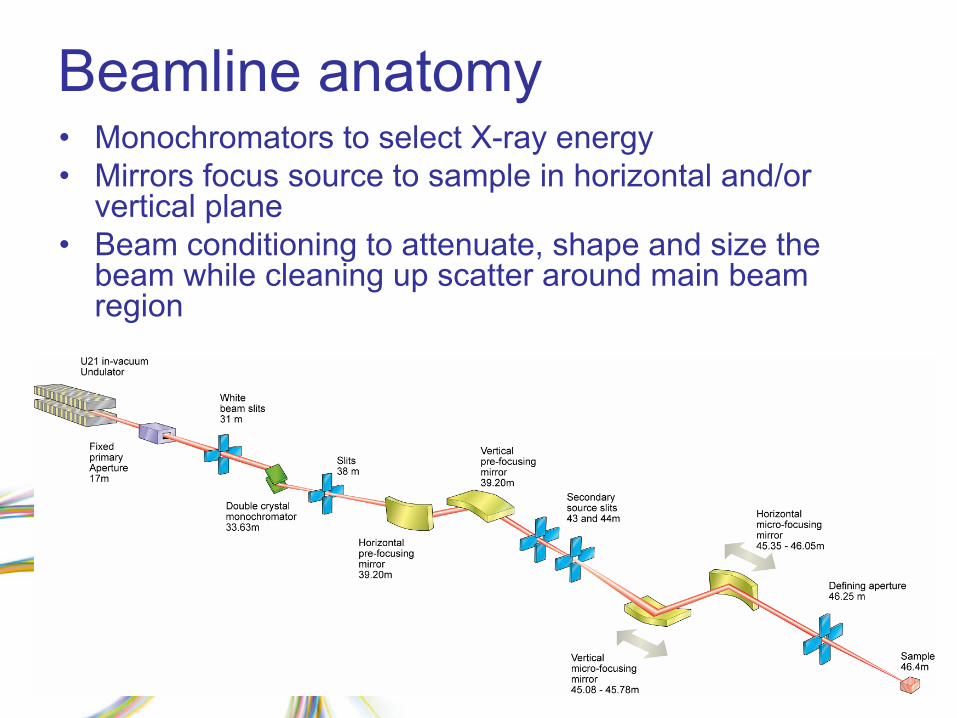
Beamline anatomy•
Monochromators to select X-ray energy
•
Mirrors focus source to sample in horizontal and/or vertical plane
•
Beam conditioning to attenuate, shape and size the beam while cleaning up scatter around main beam region
Define the experiment
•
Single crystal diffraction experiment–
characterize samples
–
structure solution–
extend resolution
–
identify a bound ligand–
test new apparatus or new methods
•
Objectives are–
answer the questions you are asking
–
to measure the best data to enable you to answer these question
What is good data?
•
the best signal to noise possible–
no single number can be suggested because this is very case dependent–
usually dictated by phasing signal requirements and resolution needs
•
extends down to low resolution (> 30Ǻ)–
always good practice and useful for effective solvent flattening
and molecular replacement
•
as complete as possible–
you might compromise on this in some cases e.g. ligand detection
•
free of radiation damage–
you want the structure to be the same at the start and end of data collection if possible
•
answers your scientific question–
data for structure solution might be of very different quality than that required to identify a bound substrate
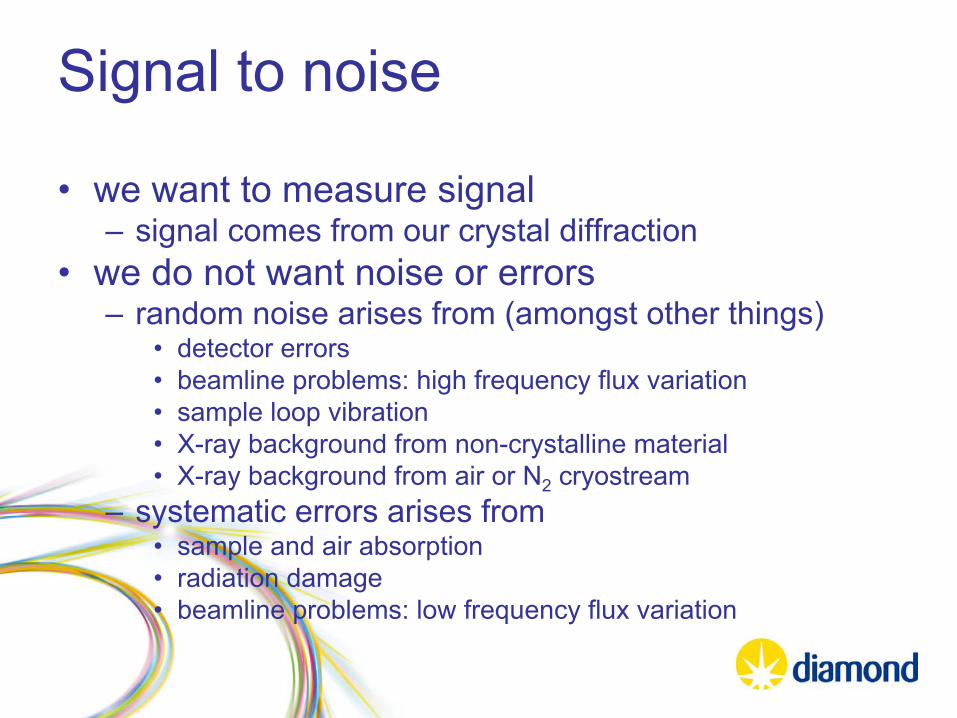
Signal to noise
•
we want to measure signal–
signal comes from our crystal diffraction
•
we do not want noise or errors–
random noise arises from (amongst other things)
•
detector errors•
beamline problems: high frequency flux variation
•
sample loop vibration•
X-ray background from non-crystalline material
•
X-ray background from air or N2
cryostream–
systematic errors arises from
•
sample and air absorption•
radiation damage
•
beamline problems: low frequency flux variation
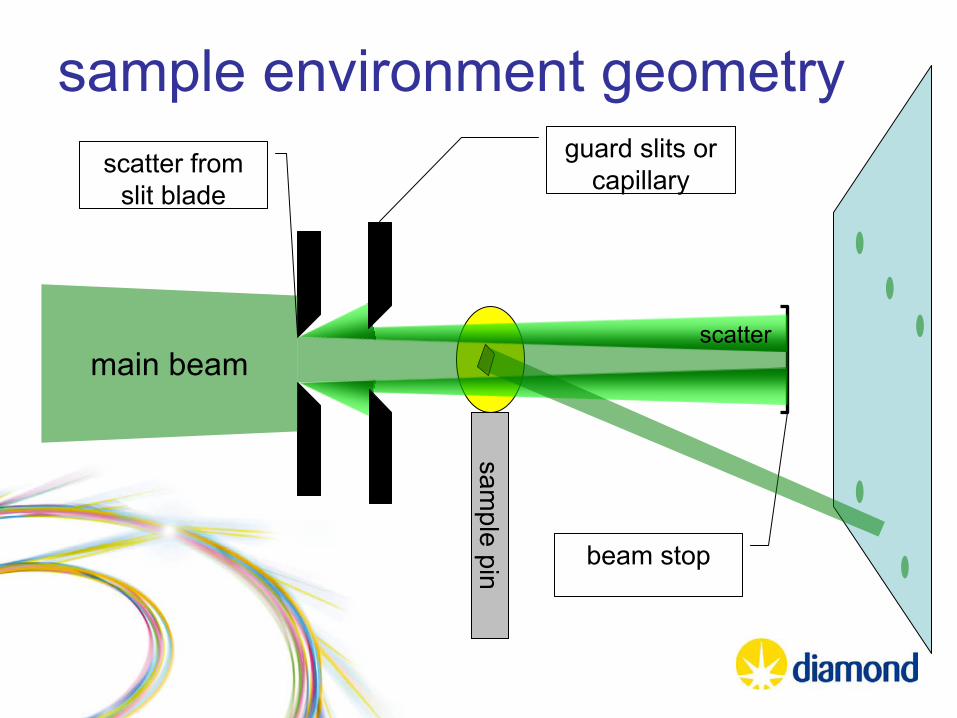
sample environment geometry
sample pin
main beam
scatter from slit blade
beam stop
scatter
guard slits or capillary
X-ray background reduction
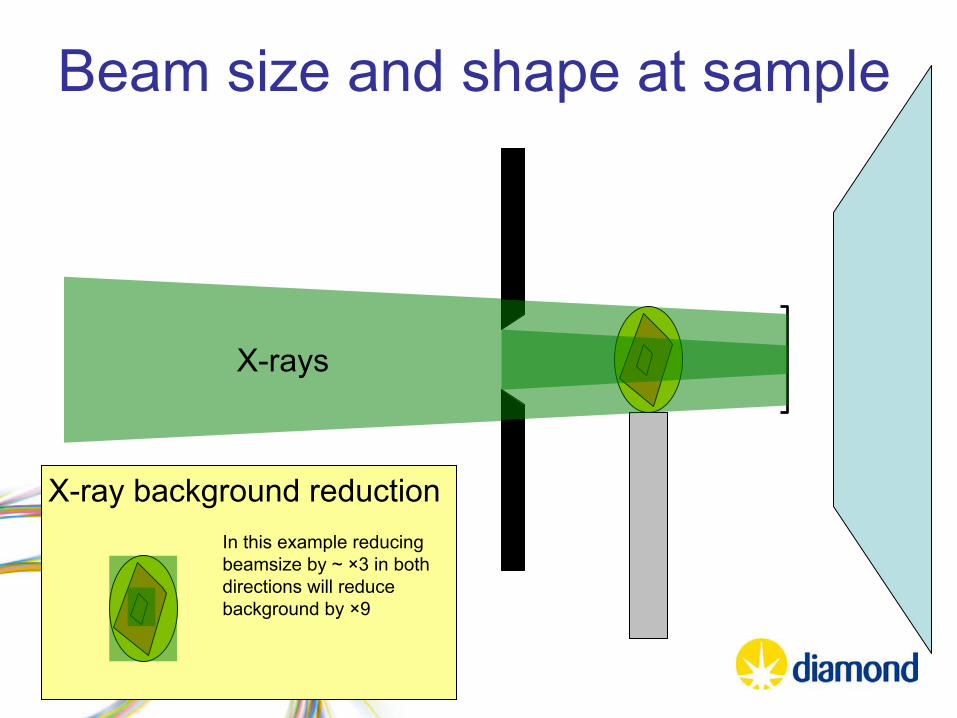
Beam size and shape at sample
X-rays
In this example reducing beamsize
by ~ ×3 in both directions will reduce background by ×9
X-ray background
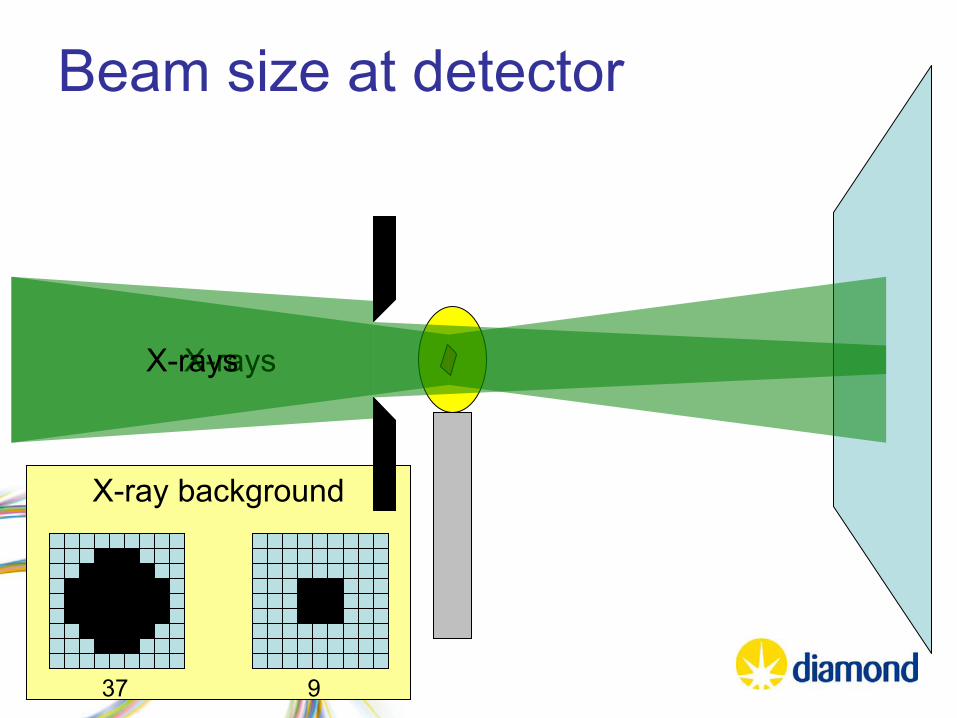
Beam size at detector
X-raysX-rays
37 9
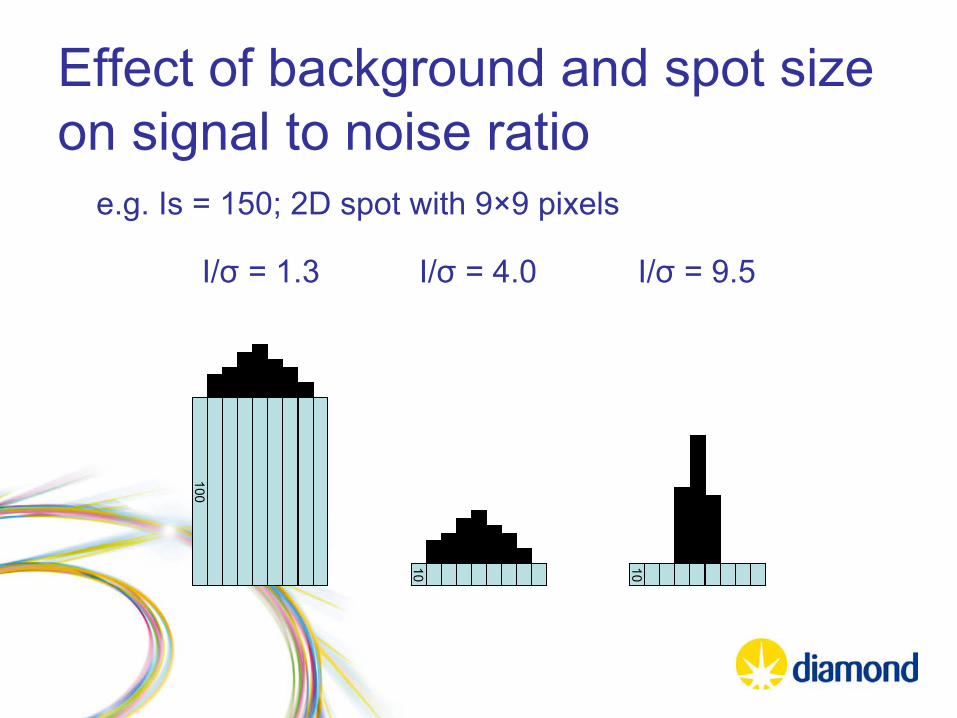
Effect of background and spot size on signal to noise ratio
100
10 10
e.g. Is = 150; 2D spot with 9×9 pixels
I/σ
= 1.3 I/σ
= 4.0 I/σ
= 9.5
What does this mean in practice
•
On standard MAD beamlines–
I02, 3 and 4
–
Slits settings should be adjusted–
low divergence means that beam size is essentially constant between sample and detector
•
On microfocus beamlines–
I24
–
relatively high divergence means defocusing X-rays can play a role in signal to noise
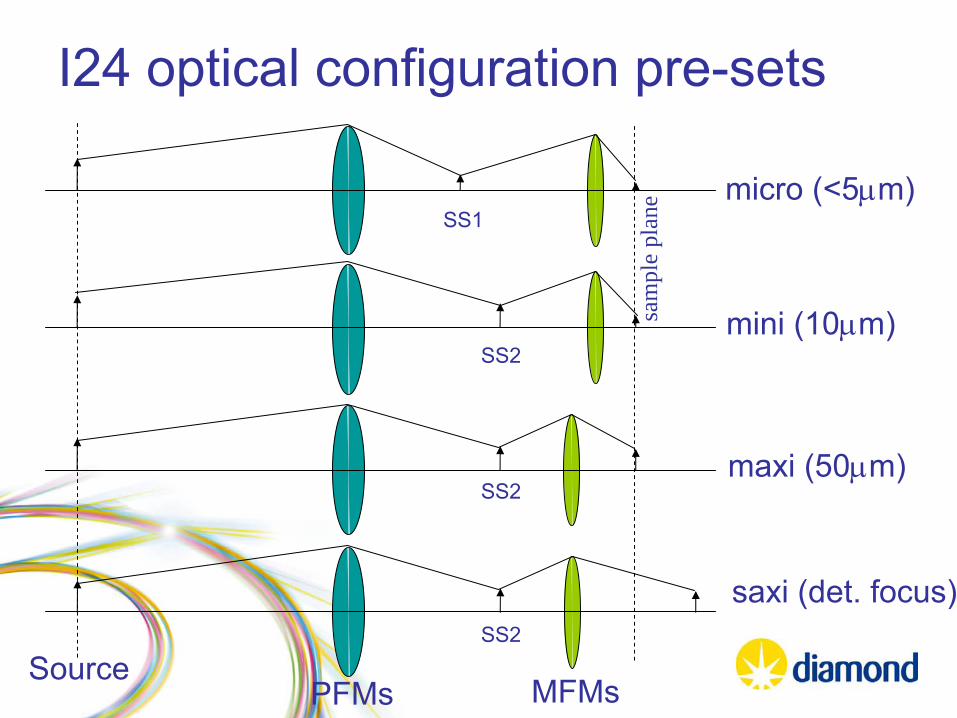
I24 optical configuration pre-sets
micro (<5μm)
mini (10μm)
maxi (50μm)
SourcePFMs
SS1
MFMs
saxi
(det. focus)
SS2
SS2
SS2sa
mpl
e pl
ane
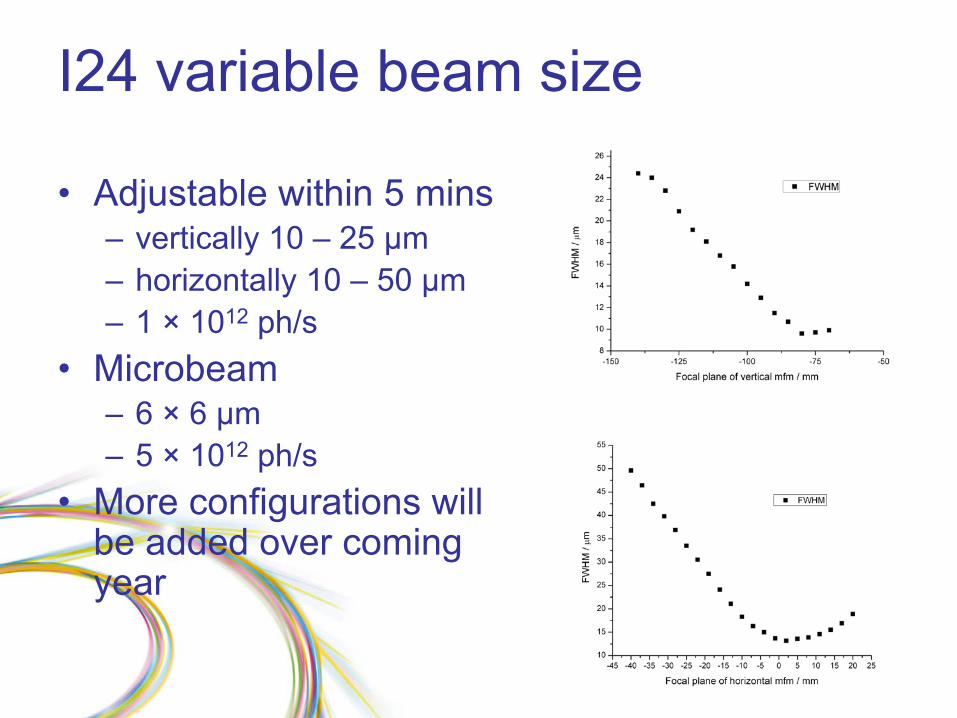
I24 variable beam size
•
Adjustable within 5 mins–
vertically 10 –
25 µm
–
horizontally 10 –
50 µm–
1 ×
1012
ph/s
•
Microbeam –
6 ×
6 µm
–
5 ×
1012
ph/s
•
More configurations will be added over coming year
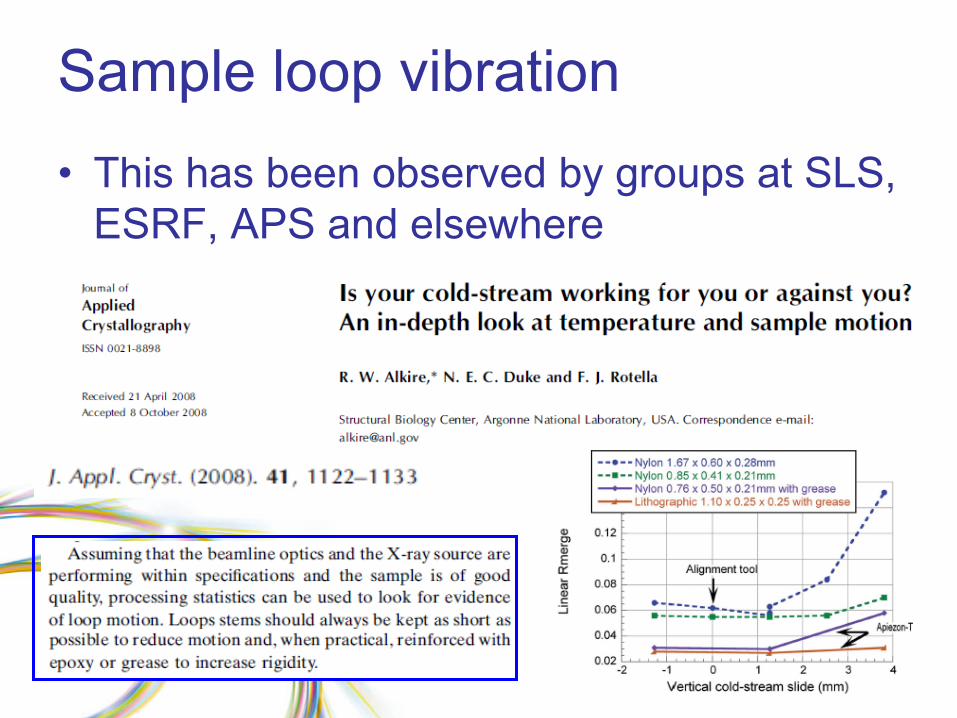
Sample loop vibration•
This has been observed by groups at SLS, ESRF, APS and elsewhere
Optimising signal to noise
•
Sample preparation–
use a short and stiff loop or other mount
–
minimize the amount of solvent/cryoprotectant
around your crystal•
careful choice of loop can help
•
All beamlines have defining slits before the sample–
use the slits to size the beam to your crystal and avoid generating background from your sample mount and solvent
–
if you can change the beamstop distance then consider putting it
as close to the sample as tolerable (think about your low resolution data though)
•
If the option exists then consider X-ray focusing at the detector–
e.g. Diamond I24
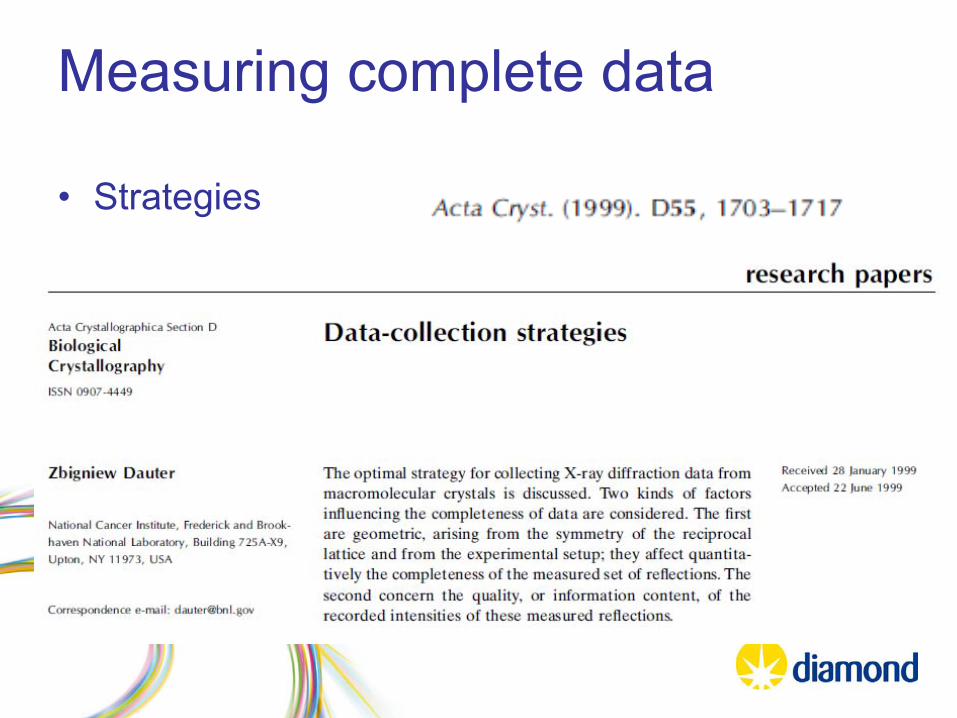
Measuring complete data
•
Strategies–
no strategy –
assume space group is P1 and
measure as much data as possible•
you still need to be confident that you will record complete data before radiation damage kicks in
•
S-SAD phasing will require high multiplicity anyway
–
use a strategy program•
relies on indexing your diffraction and making a sensible guess of the point group
•
iMosflm
can do this for you•
and it is very easy
Radiation damage
•
A real problem for small crystals and very little we can do about it–
accept that we will suffer
–
measure data from many crystals and merge•
Using RADDOSE or a sacrificial crystal can provide with estimates of lifetime
•
For larger blocky homogenous crystals use a larger beam
•
For needles or plates can use trajectory data collections or helical scans
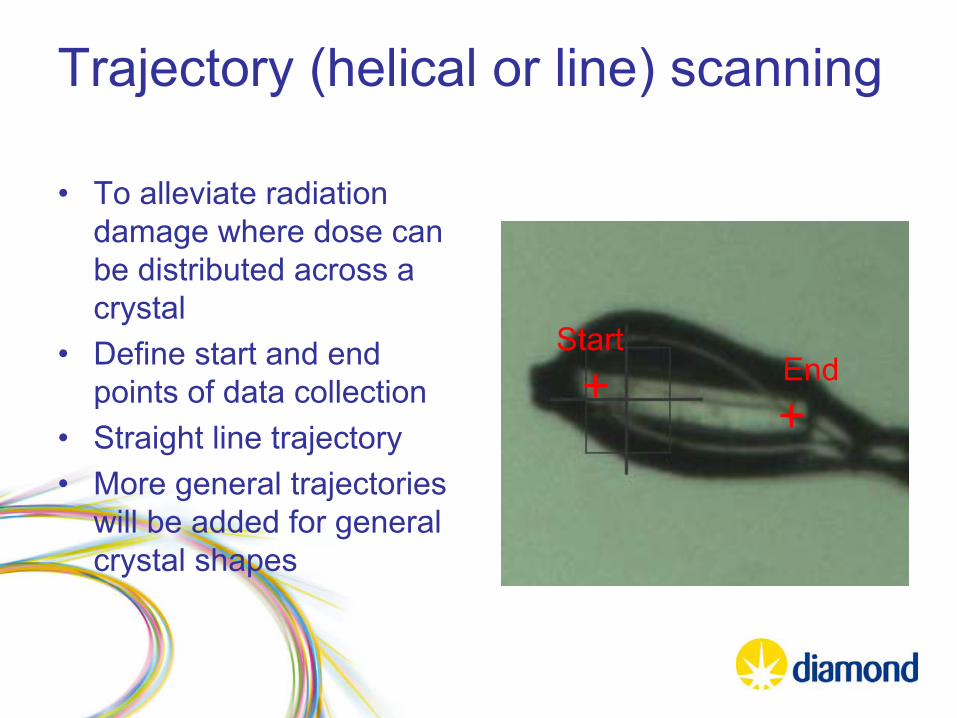
Trajectory (helical or line) scanning
•
To alleviate radiation damage where dose can be distributed across a crystal
•
Define start and end points of data collection
•
Straight line trajectory•
More general trajectories will be added for general crystal shapes
StartEnd
Start Position
End Position
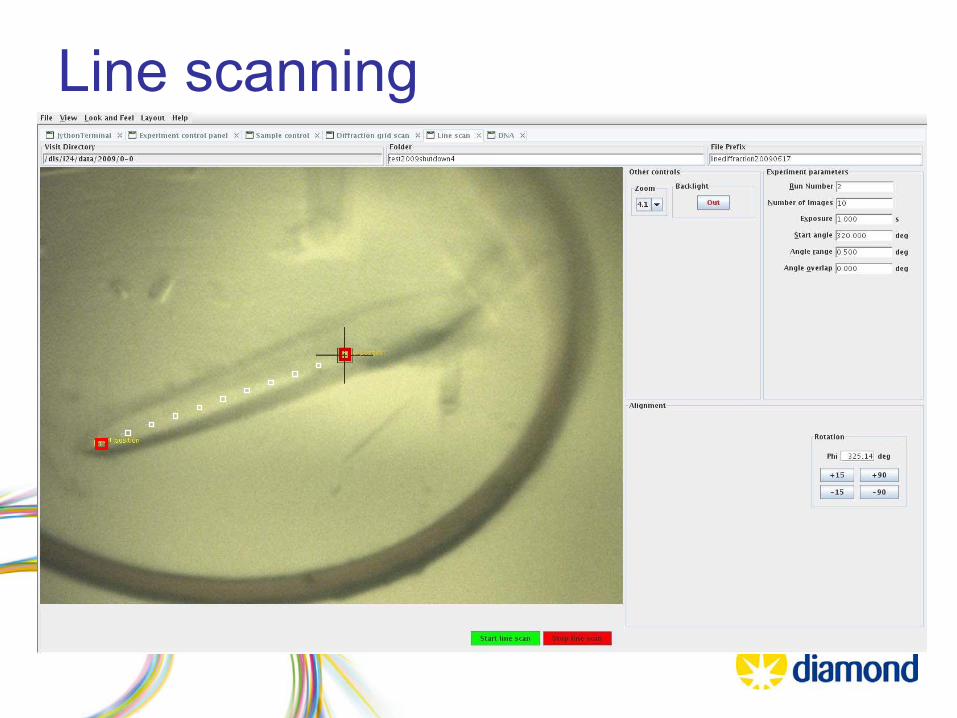
Line scanning
Should I illuminate the whole crystal?•
This depends on–
crystal size relative to maximum beam size available
•
on I02, 3 and 4 this is ~100µm ×
100µm•
on I24 currently ~30µm ×
50µm (v ×
h)
–
diffraction quality of the crystal throughout its volume i.e. diffraction homogeneity
•
In general it is best to have a constant diffracting volume as this will improve scale factors
•
some evidence that for a large homogeneous crystal use of a large beam results in better data quality–
Sanishvilli
et al. Acta Cryst. D64, 425-435 (2008).
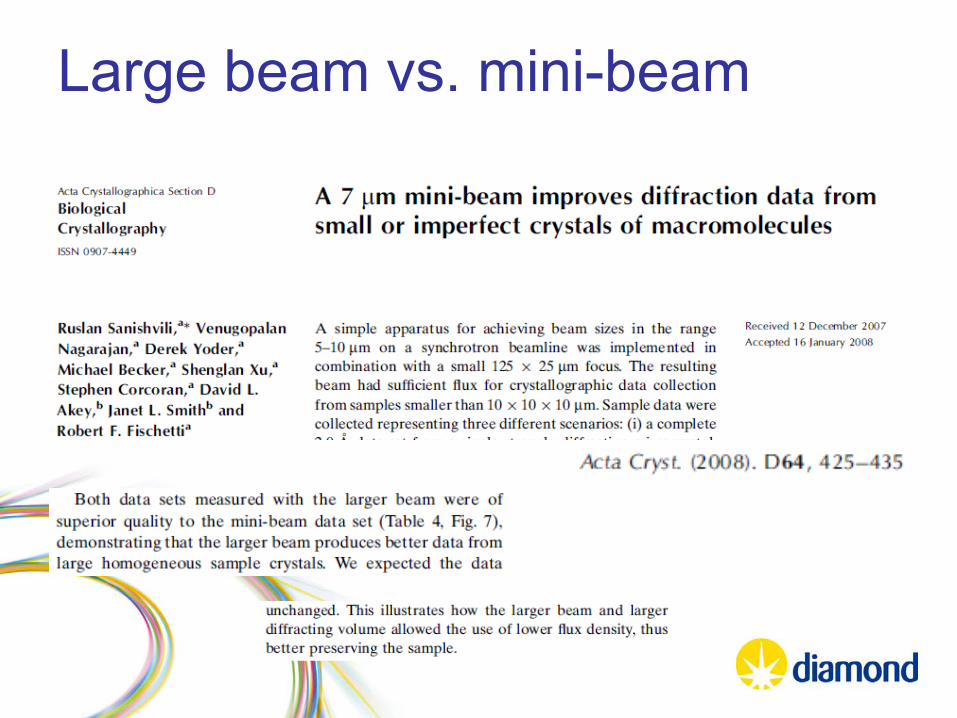
Large beam vs. mini-beam
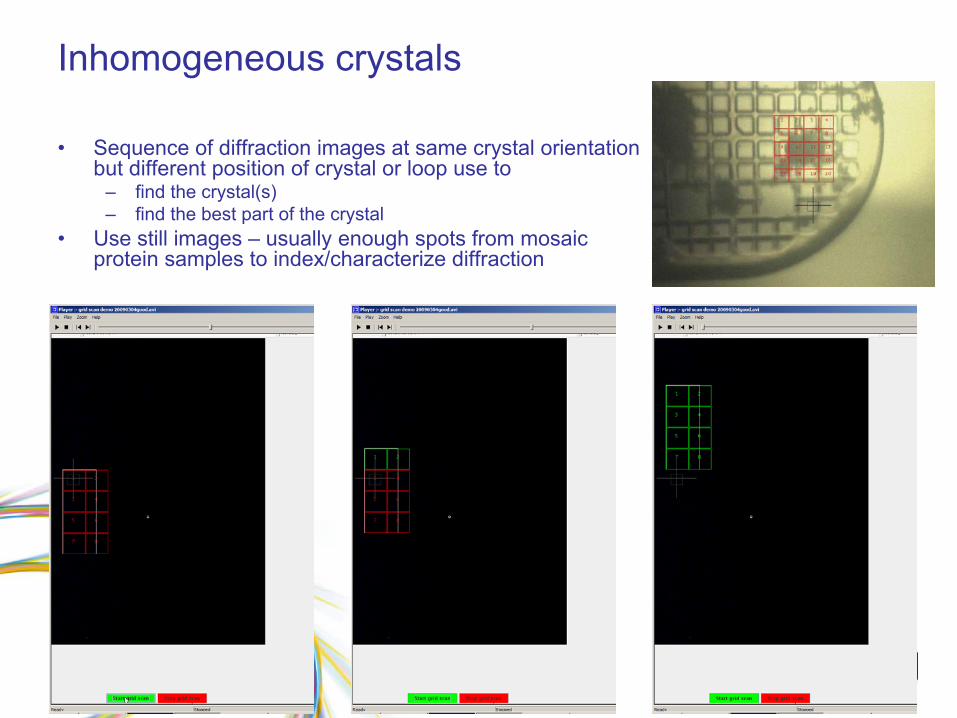
Inhomogeneous crystals
•
Sequence of diffraction images at same crystal orientation but different position of crystal or loop use to
–
find the crystal(s)–
find the best part of the crystal•
Use still images –
usually enough spots from mosaic protein samples to index/characterize diffraction
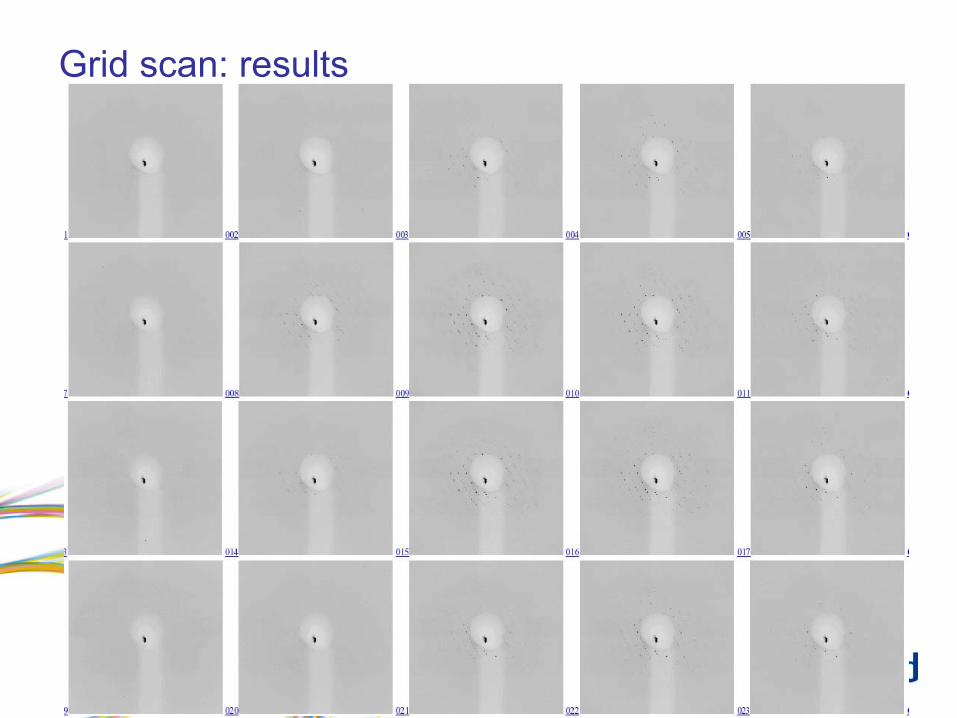
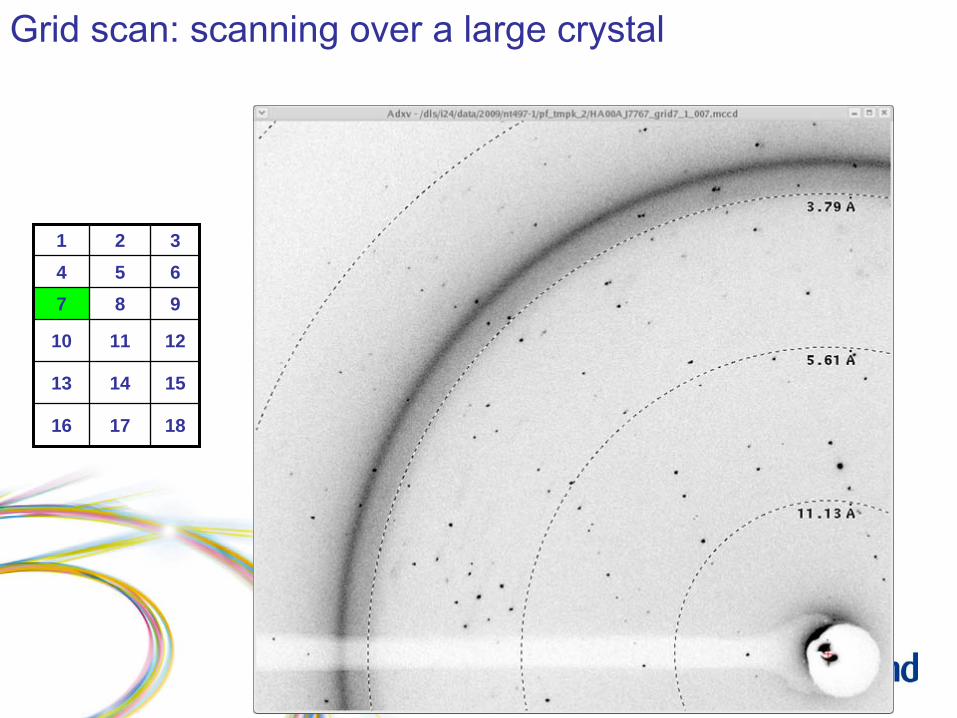
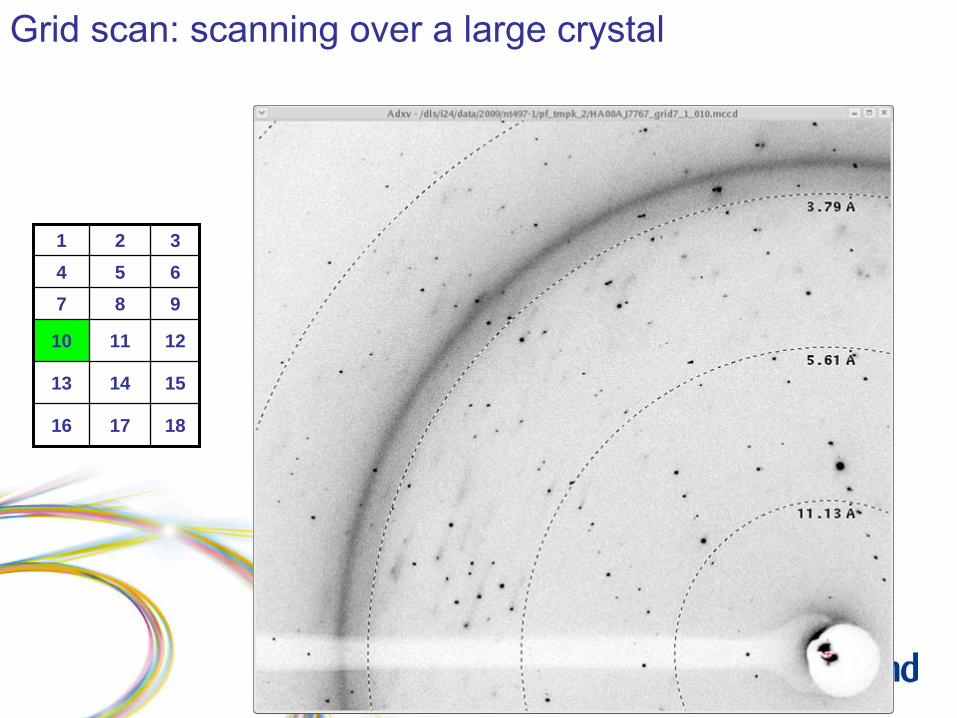
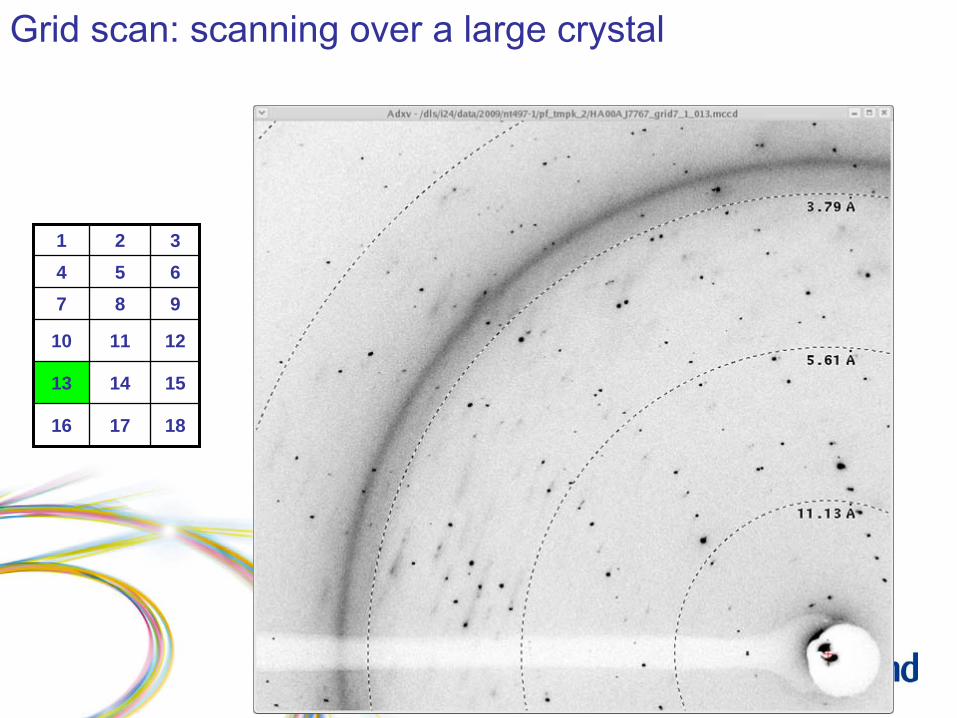
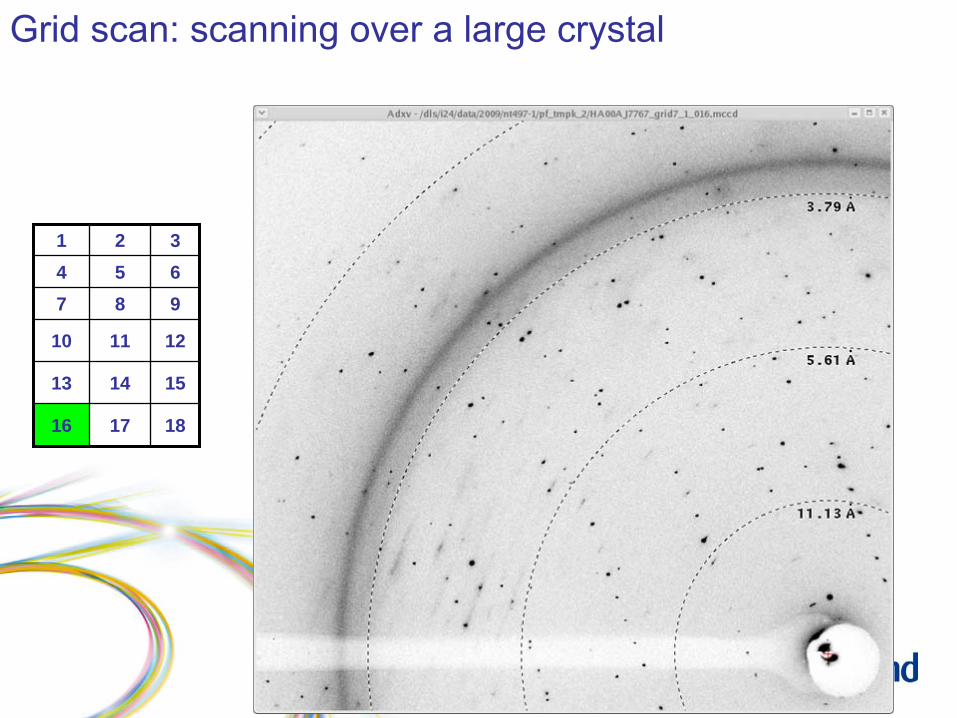
Grid scan: results
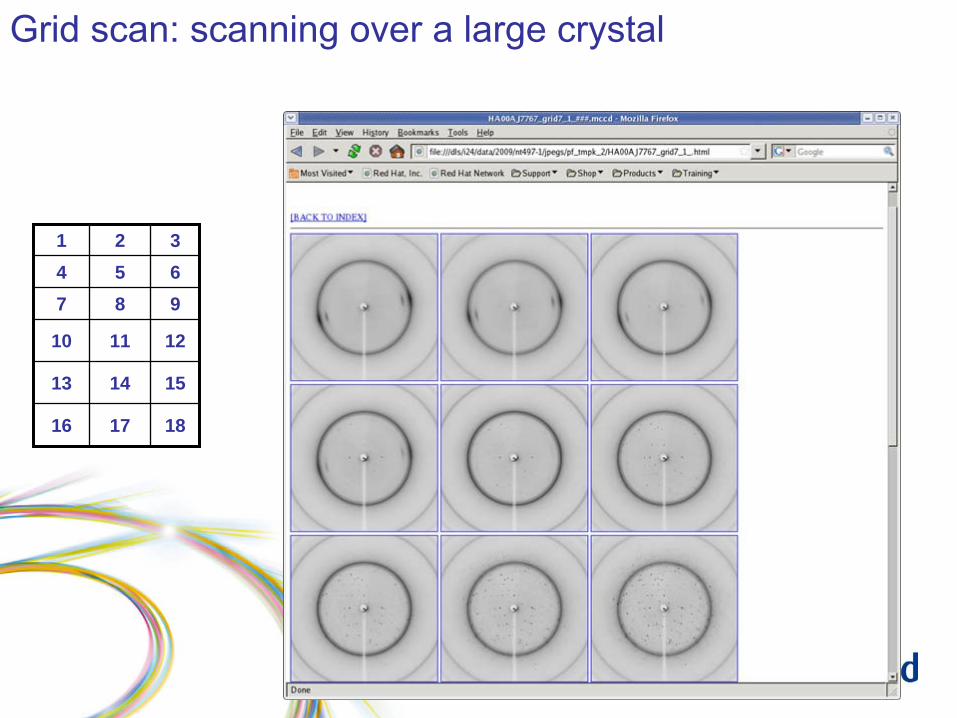
Grid scan: scanning over a large crystal
1 2 34 5 67 8 9
10 11 12
13 14 15
16 17 18
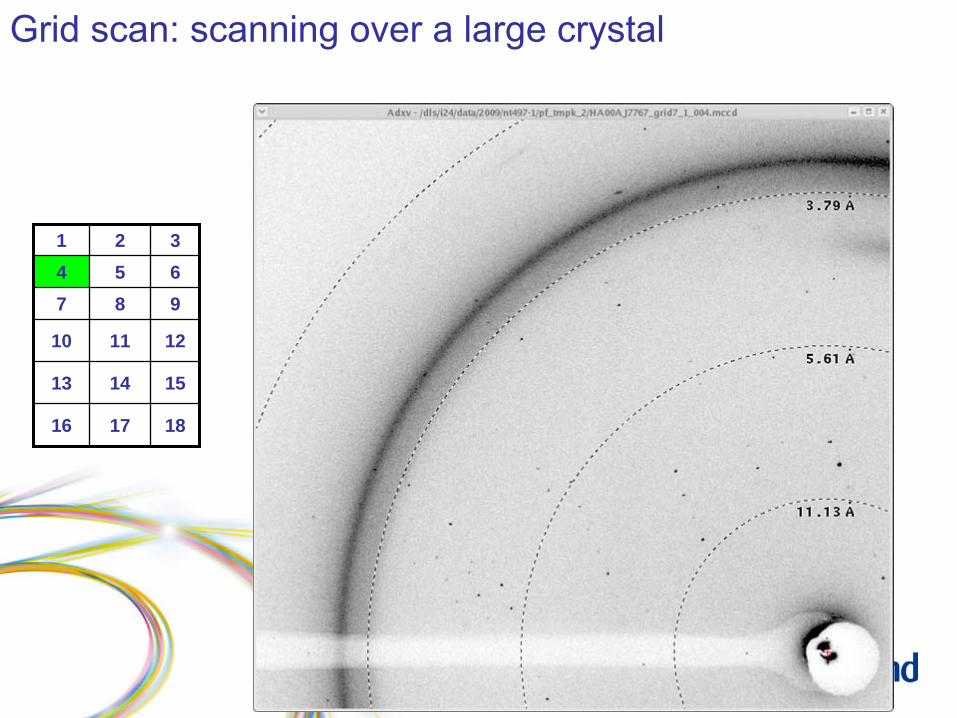
Grid scan: scanning over a large crystal
1 2 34 5 67 8 9
10 11 12
13 14 15
16 17 18
Grid scan: scanning over a large crystal
1 2 34 5 67 8 9
10 11 12
13 14 15
16 17 18
Grid scan: scanning over a large crystal
1 2 34 5 67 8 9
10 11 12
13 14 15
16 17 18
Grid scan: scanning over a large crystal
1 2 34 5 67 8 9
10 11 12
13 14 15
16 17 18
Grid scan: scanning over a large crystal
1 2 34 5 67 8 9
10 11 12
13 14 15
16 17 18
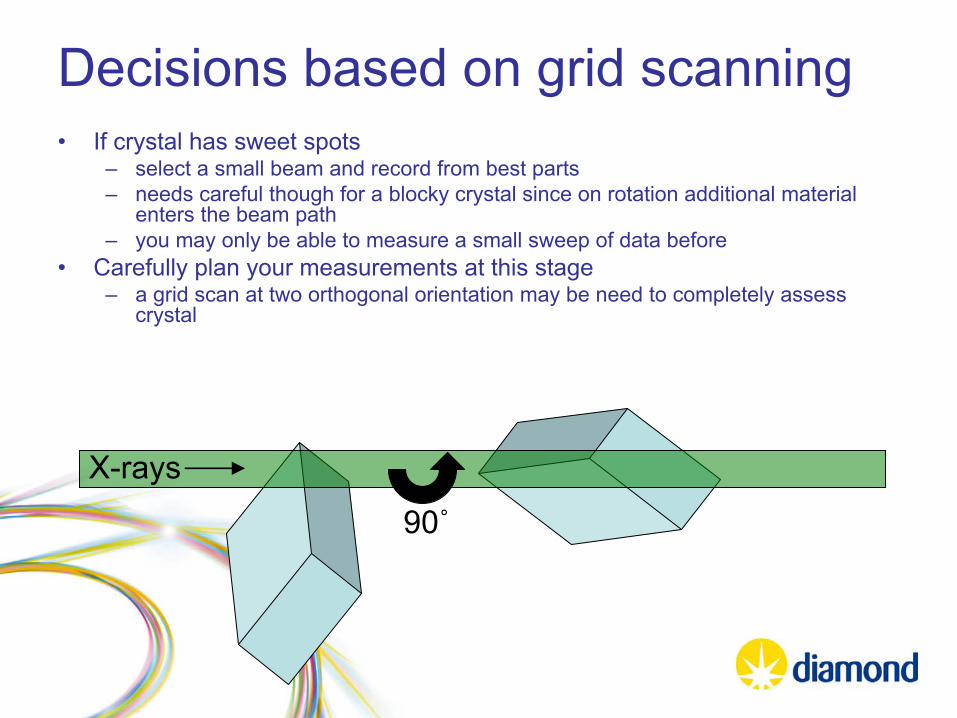
Decisions based on grid scanning•
If crystal has sweet spots
–
select a small beam and record from best parts–
needs careful though for a blocky crystal since on rotation additional material enters the beam path
–
you may only be able to measure a small sweep of data before •
Carefully plan your measurements at this stage
–
a grid scan at two orthogonal orientation may be need to completely assess crystal
90˚
X-rays
So what should you do?
•
A strategy might be–
take two test exposures using large beam and test diffraction quality
–
if not good then perform grid scan using smaller beam to isolate good regions
•
record data set from smaller regions using small beam–
if good then record data set
•
In practice if you test your crystal using I02, 3 or 4 and find the quality is poor then–
either cut beam size with slits and perform grid scan
•
significantly lower flux but may be high enough–
save crystal for I24 microfocus beamline visit
•
higher flux in smaller beam
MAD and SAD
•
Great care needs to be taken to avoid radiation damage–
heavy atoms are sensitive (highly absorbing) and your signal is related to their occupancies and B-factors
•
Remember therefore that good phases need only be recorded to lower resolution ~2.5 –
3.5 Ǻ
–
use modest exposure levels and ensure your crystal survives the distance
•
Take extra care in determining your strategy•
They can then be extended against a purpose measured higher resolution (possibly native) data set
Aligned crystal or inverse beam•
Aligned crystal
–
Use of Kappa geometry can allow your crystal to be aligned so that Bijvoet
mates are measured simultaneously
–
This can improve Bijvoet
difference measurements by removing some sources of systematic error
•
radiation damage•
absorption (sometimes)–
You may need to realign to measure blind region–
Can make scaling less precise•
Inverse beam
–
Record Friedel
pairs close together in time–
Again reduces sources of systematic error•
radiation damage•
absorption (sometimes)–
Does not required Kappa geometry and therefore a random orientation may be ok.
•
These methods may be more approproate
where radiation damage is extreme and unavoidable
•
Alternatives might be merging MAD/SAD data from multiple crystals–
last resort since isomorphism becomes critical–
essential if you have microcrystals
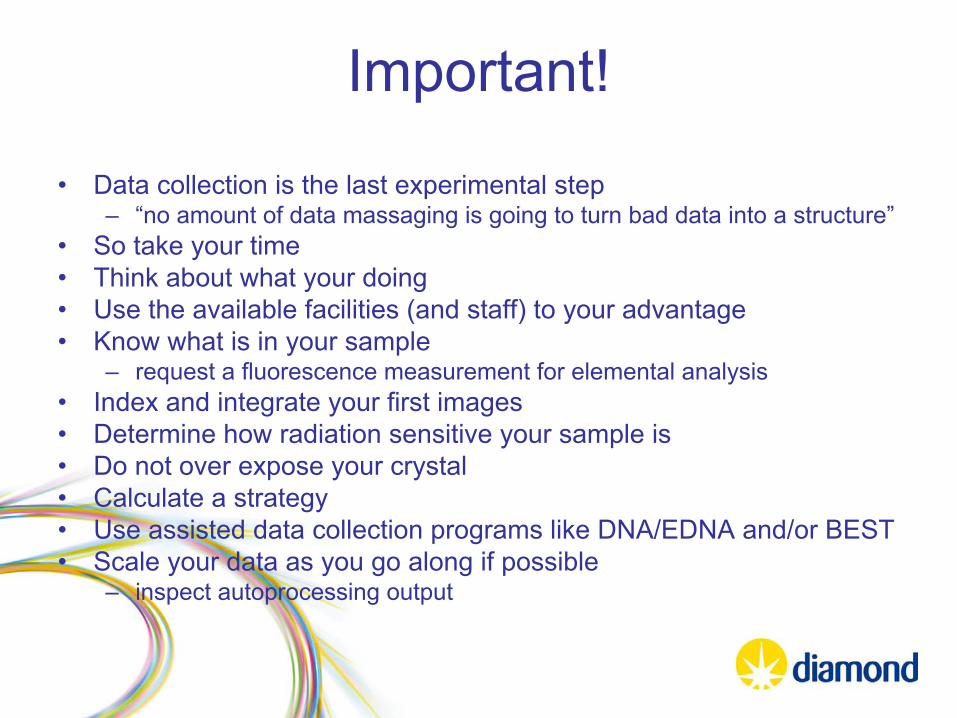
Important!
•
Data collection is the last experimental step–
“no amount of data massaging is going to turn bad data into a structure”
•
So take your time•
Think about what your doing
•
Use the available facilities (and staff) to your advantage•
Know what is in your sample–
request a fluorescence measurement for elemental analysis
•
Index and integrate your first images•
Determine how radiation sensitive your sample is
•
Do not over expose your crystal•
Calculate a strategy
•
Use assisted data collection programs like DNA/EDNA and/or BEST•
Scale your data as you go along if possible–
inspect autoprocessing
output
Finally
•
Thanks to–
Randy Alkire (SBC)
–
Nukri Sanishvilli
(GM/CA-CAT)–
Zbyszek Dauter
(ANL)
–
Keith Wilson (U. of York)–
Ana Silva (U. of York)