Density, excess properties, electrical conductivity and viscosity of 1-butyl-3-methylimidazolium...
11
Density, excess properties, electrical conductivity and viscosity of 1-butyl-3-methylimidazolium bis(trifluoromethylsulfonyl)imide + c-butyrolactone binary mixtures Milan Vraneš, Snez ˇana Papovic ´ , Aleksandar Tot, Nebojša Zec, Slobodan Gadz ˇuric ´ ⇑ Faculty of Science, Department of Chemistry, Biochemistry and Environmental Protection, University of Novi Sad, Trg Dositeja Obradovic ´a 3, 21000 Novi Sad, Serbia article info Article history: Received 19 September 2013 Received in revised form 18 March 2014 Accepted 23 March 2014 Available online xxxx Keywords: Imidazolium based ionic liquids c-Butyrolactone Volumetric properties Electrical conductivity Viscosity abstract Density, electrical conductivity and viscosity of binary liquid mixtures of 1-butyl-3-methylimidazolium bis(trifluoromethylsulfonyl)imide, [bmim][NTf 2 ], with c-butyrolactone (GBL) were measured at temper- atures from (293.15 to 323.15) K and at atmospheric pressure over the whole composition range. Excess molar volumes have been calculated from the experimental densities and were fitted with Redlich–Kister polynomial equation. Other volumetric properties, such as isobaric thermal expansion coefficients, partial molar volumes, apparent molar volumes and partial molar volumes at infinite dilution have been also calculated, in order to obtain information about interactions between GBL and selected ionic liquid. Ó 2014 Elsevier Ltd. All rights reserved. 1. Introduction Ionic liquids (ILs) are molten salts consisting of a large, asymmet- ric organic cations and organic or inorganic anions with a melting point below 100 °C [1,2]. Numerous combinations of different an- ions with structurally modified cations can affect their physical and chemical properties. Increasing attention has been paid to room-temperature ionic liquids (RTILs) and their application as green solvents, since many of them are non-volatile, biodegradable and recyclable materials [3]. RTILs became one of the most rapidly growing areas in green chemistry because of their remarkable and tunable physical and chemical properties, such as high thermal [4] and electrochemical stability [5], negligible vapor pressure [6], large liquidus range [7], flame retardant [8] and good ability to dissolve organic and inorganic compounds [9]. Thus, these physicochemical properties are making them interesting solvents for electrolytes in lithium-ion battery production [10–12]. Exchange of common or- ganic solvents by RTILs can enhance the safety of lithium-ion batter- ies [13]. However, pure ionic liquids are highly viscous which impedes their application [14]. The high viscosity of RTILs can be overcome by mixing with some molecular solvents [15–17]. Good solvent candidates for improving volumetric and transport properties of ILs are cyclic carbonates or lactones which are usually applied as solvents in the lithium batteries and electrochemical devices due to some of their fundamental characteristics such as a large electrochemical window, a high solvating power for lithium salts and a high relative permittivity [18]. An aprotic sol- vent which can be used as a component in the lithium-ion batteries is c-butyrolactone, since the polarity of GBL provides excellent sol- vation of lithium ions and thus the increasing conductivity. GBL has a strong dipolar moment, a sufficiently high dielectric constant, a relatively low viscosity, a low fusion point (45 °C) and a high boiling point (204 °C) [19]. The mixture of GBL with selected ILs can improve both the performance and thermal stability of the elec- trolytes [20,21]. Due to these reasons, further physicochemical characterization of GBL binary mixtures with different ILs is required. In this study, volumetric, thermal and transport properties of different binary mixtures of 1-butyl-3-methylimidazolium bis (trifluoromethylsulfonyl)imide ionic liquid, [bmim][NTf 2 ], with c-butyrolactone have been presented as a function of temperature and composition. 2. Experimental section 2.1. Materials Ionic liquid [bmim][NTf 2 ] and GBL were purchased from Merck. Mass fraction purity of both chemicals was P0.99. The water http://dx.doi.org/10.1016/j.jct.2014.03.025 0021-9614/Ó 2014 Elsevier Ltd. All rights reserved. ⇑ Corresponding author. Tel.: +381 21 485 2744; fax: +381 21 454 065. E-mail address: [email protected] (S. Gadz ˇuric ´). J. Chem. Thermodynamics xxx (2014) xxx–xxx Contents lists available at ScienceDirect J. Chem. Thermodynamics journal homepage: www.elsevier.com/locate/jct Please cite this article in press as: M. Vraneš et al., J. Chem. Thermodyn. (2014), http://dx.doi.org/10.1016/j.jct.2014.03.025
Transcript of Density, excess properties, electrical conductivity and viscosity of 1-butyl-3-methylimidazolium...
J. Chem. Thermodynamics xxx (2014) xxx–xxx
Contents lists available at ScienceDirect
J. Chem. Thermodynamics
journal homepage: www.elsevier .com/locate / jc t
Density, excess properties, electrical conductivity and viscosityof 1-butyl-3-methylimidazolium bis(trifluoromethylsulfonyl)imide+ c-butyrolactone binary mixtures
http://dx.doi.org/10.1016/j.jct.2014.03.0250021-9614/� 2014 Elsevier Ltd. All rights reserved.
⇑ Corresponding author. Tel.: +381 21 485 2744; fax: +381 21 454 065.E-mail address: [email protected] (S. Gadzuric).
Please cite this article in press as: M. Vraneš et al., J. Chem. Thermodyn. (2014), http://dx.doi.org/10.1016/j.jct.2014.03.025
Milan Vraneš, Snezana Papovic, Aleksandar Tot, Nebojša Zec, Slobodan Gadzuric ⇑Faculty of Science, Department of Chemistry, Biochemistry and Environmental Protection, University of Novi Sad, Trg Dositeja Obradovica 3, 21000 Novi Sad, Serbia
a r t i c l e i n f o
Article history:Received 19 September 2013Received in revised form 18 March 2014Accepted 23 March 2014Available online xxxx
Keywords:Imidazolium based ionic liquidsc-ButyrolactoneVolumetric propertiesElectrical conductivityViscosity
a b s t r a c t
Density, electrical conductivity and viscosity of binary liquid mixtures of 1-butyl-3-methylimidazoliumbis(trifluoromethylsulfonyl)imide, [bmim][NTf2], with c-butyrolactone (GBL) were measured at temper-atures from (293.15 to 323.15) K and at atmospheric pressure over the whole composition range. Excessmolar volumes have been calculated from the experimental densities and were fitted with Redlich–Kisterpolynomial equation. Other volumetric properties, such as isobaric thermal expansion coefficients, partialmolar volumes, apparent molar volumes and partial molar volumes at infinite dilution have been alsocalculated, in order to obtain information about interactions between GBL and selected ionic liquid.
� 2014 Elsevier Ltd. All rights reserved.
1. Introduction
Ionic liquids (ILs) are molten salts consisting of a large, asymmet-ric organic cations and organic or inorganic anions with a meltingpoint below 100 �C [1,2]. Numerous combinations of different an-ions with structurally modified cations can affect their physicaland chemical properties. Increasing attention has been paid toroom-temperature ionic liquids (RTILs) and their application asgreen solvents, since many of them are non-volatile, biodegradableand recyclable materials [3]. RTILs became one of the most rapidlygrowing areas in green chemistry because of their remarkable andtunable physical and chemical properties, such as high thermal [4]and electrochemical stability [5], negligible vapor pressure [6], largeliquidus range [7], flame retardant [8] and good ability to dissolveorganic and inorganic compounds [9]. Thus, these physicochemicalproperties are making them interesting solvents for electrolytes inlithium-ion battery production [10–12]. Exchange of common or-ganic solvents by RTILs can enhance the safety of lithium-ion batter-ies [13]. However, pure ionic liquids are highly viscous whichimpedes their application [14]. The high viscosity of RTILs can beovercome by mixing with some molecular solvents [15–17].
Good solvent candidates for improving volumetric and transportproperties of ILs are cyclic carbonates or lactones which are usually
applied as solvents in the lithium batteries and electrochemicaldevices due to some of their fundamental characteristics suchas a large electrochemical window, a high solvating power forlithium salts and a high relative permittivity [18]. An aprotic sol-vent which can be used as a component in the lithium-ion batteriesis c-butyrolactone, since the polarity of GBL provides excellent sol-vation of lithium ions and thus the increasing conductivity. GBL hasa strong dipolar moment, a sufficiently high dielectric constant, arelatively low viscosity, a low fusion point (�45 �C) and a highboiling point (204 �C) [19]. The mixture of GBL with selected ILscan improve both the performance and thermal stability of the elec-trolytes [20,21]. Due to these reasons, further physicochemicalcharacterization of GBL binary mixtures with different ILs isrequired.
In this study, volumetric, thermal and transport properties ofdifferent binary mixtures of 1-butyl-3-methylimidazolium bis(trifluoromethylsulfonyl)imide ionic liquid, [bmim][NTf2], withc-butyrolactone have been presented as a function of temperatureand composition.
2. Experimental section
2.1. Materials
Ionic liquid [bmim][NTf2] and GBL were purchased from Merck.Mass fraction purity of both chemicals was P0.99. The water
2 M. Vraneš et al. / J. Chem. Thermodynamics xxx (2014) xxx–xxx
content was less than 1 � 10�4 mass fraction, as determined by KarlFisher titration using a 831 Karl Fischer coulometer. GBL was usedwithout purification. All the chemicals were kept above 0.4 nmmolecular sieves for 1 week to remove any trace of water. Chemicalswere stored in a desiccator above P2O5. In order to remove remain-ing amounts of water and other volatile impurities, we kept the ionicliquid under vacuum for 24 h with constant stirring. The summaryof the provenance and purity of the samples is given in table 1.
Binary mixtures covering the whole composition range of[bmim][NTf2] and GBL were prepared by measuring appropriateamount of the components on a Denver analytical balance. Thestandard uncertainty of mass fraction is less than ±5 � 10�5.
2.2. Apparatus and procedure
2.2.1. Density measurementsThe vibrating tube densimeter, Rudolph Research Analytical
DDM 2911 with the accuracy and precision of ±0.00001 g � cm�3
was used for density measurements. Density measurements witha vibrating tube are based on the dependence of oscillation periodof a unilaterally fixed U-tube on its mass. Prior the injection of thesamples into U-tube they were kept for one hour in an ultrasonicbath. The total volume of the samples used for density measure-ments was approximately 1 cm3. Special attention has beenpaid to the injection of the samples with no air bubbles whichwould give wrong results. The instrument was thermostated(Peltier-type) within ±0.01 K and viscosity was automatically cor-rected. Before each series of measurements calibration of theinstrument was performed at the atmospheric pressure. Thecalibration was made using ambient air and bi-distilled ultra purewater in the temperature range (293.15 to 323.15) K. Densimeteralready has incorporated moisture adsorbent. Each experimentaldensity value is the average of at least three measurements at tem-peratures from (293.15 to 323.15) K. Repeated experimental mea-surements showed reproducibility within 0.001%, and an averagevalue is presented in this paper. The standard uncertainty of deter-mining the density is less than 2.0 � 10�5 g � cm�3.
2.2.2. Electrical conductivity measurementsMixtures for the conductivity measurements were prepared by
mixing the appropriate amounts of [bmim][NTf2] and GBL. Thesemeasurements were carried out in a Pyrex cell with platinum elec-trodes in the temperature range (293.15 to 323.15) K on a conduc-tivity meter Jenco 3107, using DC signal. The conductometric cellwith a total volume of 14 cm3 was initially dried in the atmosphereof nitrogen and thermostated for twenty minutes with the externalflow with an accuracy of ±0.01 K. At least 10 measurements wereperformed at 5 s intervals, in order to eliminate the self-heatingand ionization in the electrodes [22]. The experimental cell wascalibrated with standard 0.1000 mol � dm�3 KCl solution by thesame experimental procedure. The resulting cell constantamounted to 1.0353 cm�1, and it was checked from time to timeto control any possible evolution. The relative standard uncertaintyfor electrical conductivity was less than 1.5%. All obtained experi-mental values represent the mean of three measurements.
2.2.3. Viscosity measurementsViscosity was measured using a Brookfield Viscosimeter DV
II + Pro thermostated with an accuracy of ±0.01 K and filled with
TABLE 1Provenance and purity of the samples.
Chemical name Provenance Mass fraction purity
[bmim][NTf2] Merck P0.99c-Butyrolactone Merck P0.99
Please cite this article in press as: M. Vraneš et al., J. Chem. Thermodyn. (2014
about 8 cm3 of tested binary mixtures or pure components. Theprincipal of operation of the DV-II + Pro is to drive a spindle (whichis immersed in the test fluid) through a calibrated spring. The vis-cous drag of the fluid against the spindle is measured by the springdeflection. Spring deflection is measured with a rotary transducer.The measurement range is determined by the rotational speed ofthe spindle, the size and shape of the spindle, the container thespindle is rotating in, and the full scale torque of the calibratedspring. The spindle type (SC4-18), which is attached to the rotatingcylinder, was immersed and rate per minute (RPM) was set in or-der to obtain a suitable torque (20% to 80%). A viscometer cell pro-tected from moisture with the compartment made by themanufacturer was calibrated using the liquids of different viscosi-ties purchased from the manufacturer. Viscosity was measured inthe temperature range from (293.15 to 323.15) K with the rotationspeed of 60 RPM for pure ionic liquid to 180 RPM for pure GBL. Pre-sented experimental values are the mean of three measurementsand the measurement relative standard uncertainty was found tobe about 1%.
3. Results and discussion
3.1. Densities
Densities of pure components and ([bmim][NTf2] + GBL)mixtures were measured as a function of temperature in the rangefrom (293.15 to 323.15) K and the results are shown in tables 2 and3 and also in figure S1 in the supporting information. From theseresults it can be concluded that the density decreases with theincreasing temperature and increases with the ionic liquid molefraction in the binary mixture. Obtained data were fitted as afunction of temperature using a linear fit. These parameters aregiven in table S1 in the supporting information.
Values of the excess molar volume, VE, were calculated from theexperimental density of the mixture, d, densities of the purecomponents, di, the corresponding mole fractions, xi, and molarmasses, Mi, using the following equation:
VE ¼ x1M11d� 1
d1
� �þ x2M2
1d� 1
d2
� �; ð1Þ
where x1, M1 and d1 relate to [bmim][NTf2] whereas x2, M2 andd2 relate to GBL.
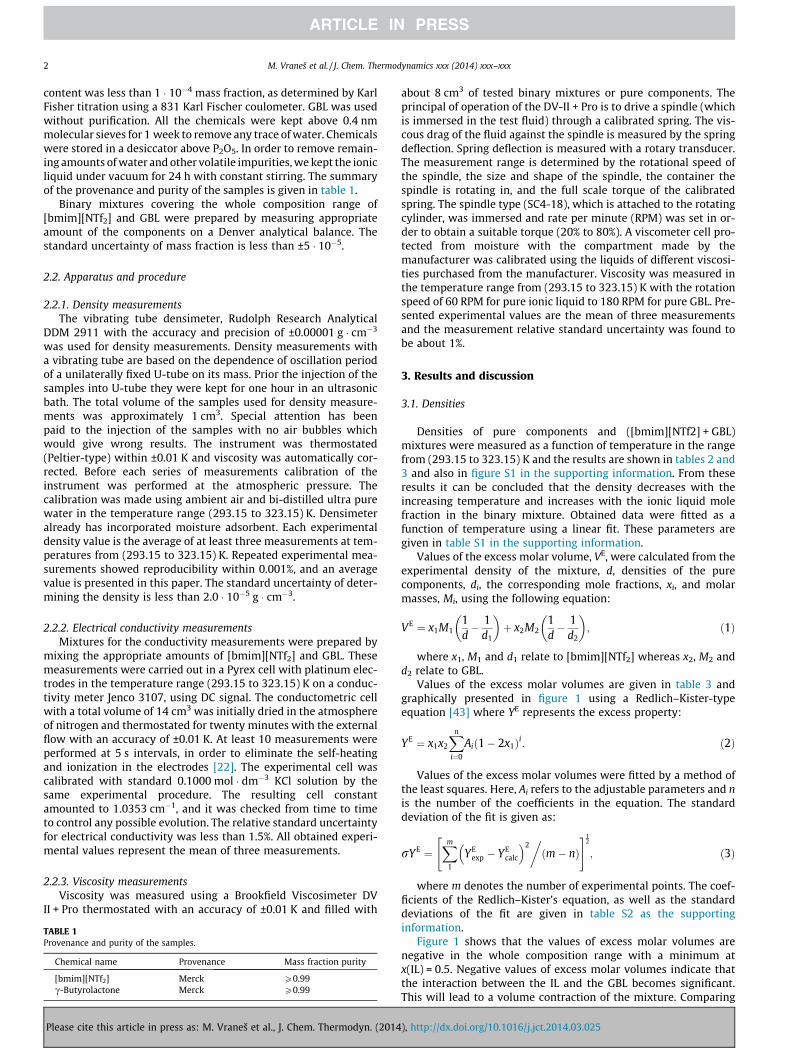
Values of the excess molar volumes are given in table 3 andgraphically presented in figure 1 using a Redlich–Kister-typeequation [43] where YE represents the excess property:
YE ¼ x1x2
Xn
i¼0
Aið1� 2x1Þi: ð2Þ
Values of the excess molar volumes were fitted by a method ofthe least squares. Here, Ai refers to the adjustable parameters and nis the number of the coefficients in the equation. The standarddeviation of the fit is given as:
rYE ¼Xm
1
YEexp � YE
calc
� �2�ðm� nÞ
" #12
; ð3Þ
where m denotes the number of experimental points. The coef-ficients of the Redlich–Kister’s equation, as well as the standarddeviations of the fit are given in table S2 as the supportinginformation.
Figure 1 shows that the values of excess molar volumes arenegative in the whole composition range with a minimum atx(IL) = 0.5. Negative values of excess molar volumes indicate thatthe interaction between the IL and the GBL becomes significant.This will lead to a volume contraction of the mixture. Comparing
), http://dx.doi.org/10.1016/j.jct.2014.03.025
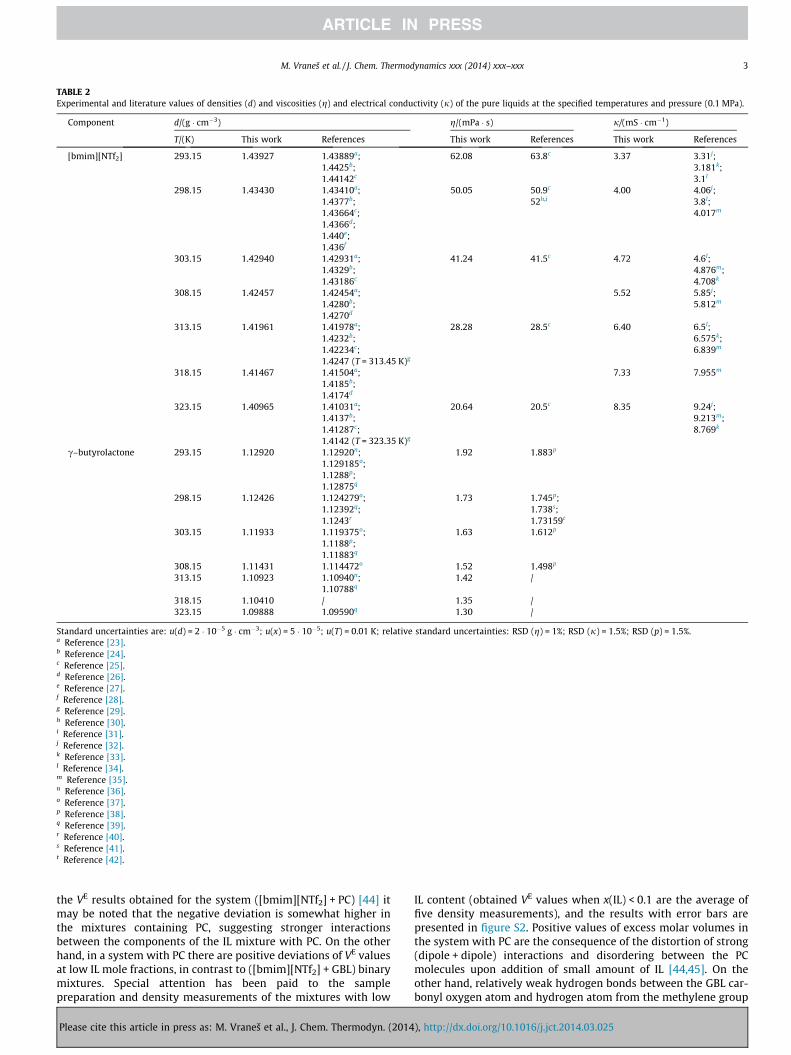
TABLE 2Experimental and literature values of densities (d) and viscosities (g) and electrical conductivity (j) of the pure liquids at the specified temperatures and pressure (0.1 MPa).
Component d/(g � cm�3) g/(mPa � s) j/(mS � cm�1)
T/(K) This work References This work References This work References
[bmim][NTf2] 293.15 1.43927 1.43889a;1.4425b;1.44142c
62.08 63.8c 3.37 3.31j;3.181k;3.1l
298.15 1.43430 1.43410a;1.4377b;1.43664c;1.4366d;1.440e;1.436f
50.05 50.9c
52h,i4.00 4.06j;
3.8l;4.017m
303.15 1.42940 1.42931a;1.4329b;1.43186c
41.24 41.5c 4.72 4.6l;4.876m;4.708k
308.15 1.42457 1.42454a;1.4280b;1.4270d
5.52 5.85j;5.812m
313.15 1.41961 1.41978a;1.4232b;1.42234c;1.4247 (T = 313.45 K)g
28.28 28.5c 6.40 6.5l;6.575k;6.839m
318.15 1.41467 1.41504a;1.4185b;1.4174d
7.33 7.955m
323.15 1.40965 1.41031a;1.4137b;1.41287c;1.4142 (T = 323.35 K)g
20.64 20.5c 8.35 9.24j;9.213m;8.769k
c–butyrolactone 293.15 1.12920 1.12920n;1.129185o;1.1288p;1.12875q
1.92 1.883p
298.15 1.12426 1.124279o;1.12392q;1.1243r
1.73 1.745p;1.738s;1.73159t
303.15 1.11933 1.119375o;1.1188p;1.11883q
1.63 1.612p
308.15 1.11431 1.114472o 1.52 1.498p
313.15 1.10923 1.10940n;1.10788q
1.42 /
318.15 1.10410 / 1.35 /323.15 1.09888 1.09590q 1.30 /
Standard uncertainties are: u(d) = 2 � 10�5 g � cm�3; u(x) = 5 � 10�5; u(T) = 0.01 K; relative standard uncertainties: RSD (g) = 1%; RSD (j) = 1.5%; RSD (p) = 1.5%.a Reference [23].b Reference [24].c Reference [25].d Reference [26].e Reference [27].f Reference [28].g Reference [29].h Reference [30].i Reference [31].j Reference [32].k Reference [33].l Reference [34].m Reference [35].n Reference [36].o Reference [37].p Reference [38].q Reference [39].r Reference [40].s Reference [41].t Reference [42].
M. Vraneš et al. / J. Chem. Thermodynamics xxx (2014) xxx–xxx 3
the VE results obtained for the system ([bmim][NTf2] + PC) [44] itmay be noted that the negative deviation is somewhat higher inthe mixtures containing PC, suggesting stronger interactionsbetween the components of the IL mixture with PC. On the otherhand, in a system with PC there are positive deviations of VE valuesat low IL mole fractions, in contrast to ([bmim][NTf2] + GBL) binarymixtures. Special attention has been paid to the samplepreparation and density measurements of the mixtures with low
Please cite this article in press as: M. Vraneš et al., J. Chem. Thermodyn. (2014
IL content (obtained VE values when x(IL) < 0.1 are the average offive density measurements), and the results with error bars arepresented in figure S2. Positive values of excess molar volumes inthe system with PC are the consequence of the distortion of strong(dipole + dipole) interactions and disordering between the PCmolecules upon addition of small amount of IL [44,45]. On theother hand, relatively weak hydrogen bonds between the GBL car-bonyl oxygen atom and hydrogen atom from the methylene group
), http://dx.doi.org/10.1016/j.jct.2014.03.025
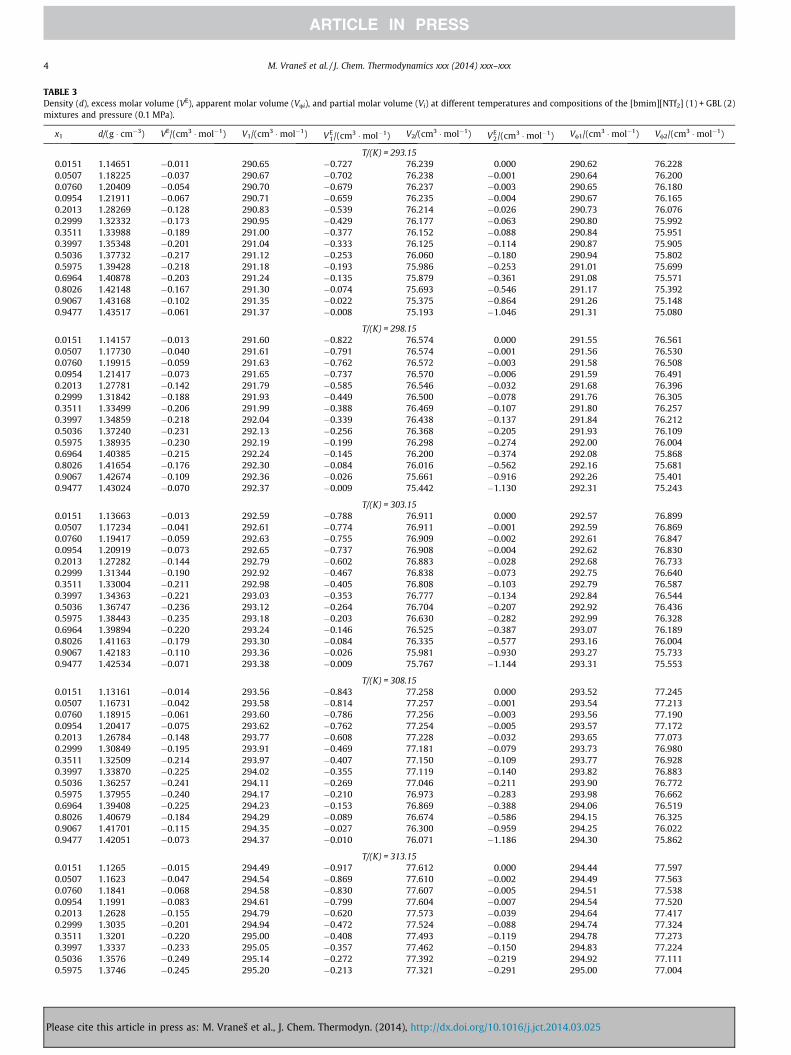
TABLE 3Density (d), excess molar volume (VE), apparent molar volume (Vai), and partial molar volume (Vi) at different temperatures and compositions of the [bmim][NTf2] (1) + GBL (2)mixtures and pressure (0.1 MPa).
x1 d/(g � cm�3) VE/(cm3 �mol�1) V1/(cm3 �mol�1) VE1/(cm3 �mol�1) V2/(cm3 �mol�1) VE
2/(cm3 �mol�1) Va1/(cm3 �mol�1) Va2/(cm3 �mol�1)
T/(K) = 293.150.0151 1.14651 �0.011 290.65 �0.727 76.239 0.000 290.62 76.2280.0507 1.18225 �0.037 290.67 �0.702 76.238 �0.001 290.64 76.2000.0760 1.20409 �0.054 290.70 �0.679 76.237 �0.003 290.65 76.1800.0954 1.21911 �0.067 290.71 �0.659 76.235 �0.004 290.67 76.1650.2013 1.28269 �0.128 290.83 �0.539 76.214 �0.026 290.73 76.0760.2999 1.32332 �0.173 290.95 �0.429 76.177 �0.063 290.80 75.9920.3511 1.33988 �0.189 291.00 �0.377 76.152 �0.088 290.84 75.9510.3997 1.35348 �0.201 291.04 �0.333 76.125 �0.114 290.87 75.9050.5036 1.37732 �0.217 291.12 �0.253 76.060 �0.180 290.94 75.8020.5975 1.39428 �0.218 291.18 �0.193 75.986 �0.253 291.01 75.6990.6964 1.40878 �0.203 291.24 �0.135 75.879 �0.361 291.08 75.5710.8026 1.42148 �0.167 291.30 �0.074 75.693 �0.546 291.17 75.3920.9067 1.43168 �0.102 291.35 �0.022 75.375 �0.864 291.26 75.1480.9477 1.43517 �0.061 291.37 �0.008 75.193 �1.046 291.31 75.080
T/(K) = 298.150.0151 1.14157 �0.013 291.60 �0.822 76.574 0.000 291.55 76.5610.0507 1.17730 �0.040 291.61 �0.791 76.574 �0.001 291.56 76.5300.0760 1.19915 �0.059 291.63 �0.762 76.572 �0.003 291.58 76.5080.0954 1.21417 �0.073 291.65 �0.737 76.570 �0.006 291.59 76.4910.2013 1.27781 �0.142 291.79 �0.585 76.546 �0.032 291.68 76.3960.2999 1.31842 �0.188 291.93 �0.449 76.500 �0.078 291.76 76.3050.3511 1.33499 �0.206 291.99 �0.388 76.469 �0.107 291.80 76.2570.3997 1.34859 �0.218 292.04 �0.339 76.438 �0.137 291.84 76.2120.5036 1.37240 �0.231 292.13 �0.256 76.368 �0.205 291.93 76.1090.5975 1.38935 �0.230 292.19 �0.199 76.298 �0.274 292.00 76.0040.6964 1.40385 �0.215 292.24 �0.145 76.200 �0.374 292.08 75.8680.8026 1.41654 �0.176 292.30 �0.084 76.016 �0.562 292.16 75.6810.9067 1.42674 �0.109 292.36 �0.026 75.661 �0.916 292.26 75.4010.9477 1.43024 �0.070 292.37 �0.009 75.442 �1.130 292.31 75.243
T/(K) = 303.150.0151 1.13663 �0.013 292.59 �0.788 76.911 0.000 292.57 76.8990.0507 1.17234 �0.041 292.61 �0.774 76.911 �0.001 292.59 76.8690.0760 1.19417 �0.059 292.63 �0.755 76.909 �0.002 292.61 76.8470.0954 1.20919 �0.073 292.65 �0.737 76.908 �0.004 292.62 76.8300.2013 1.27282 �0.144 292.79 �0.602 76.883 �0.028 292.68 76.7330.2999 1.31344 �0.190 292.92 �0.467 76.838 �0.073 292.75 76.6400.3511 1.33004 �0.211 292.98 �0.405 76.808 �0.103 292.79 76.5870.3997 1.34363 �0.221 293.03 �0.353 76.777 �0.134 292.84 76.5440.5036 1.36747 �0.236 293.12 �0.264 76.704 �0.207 292.92 76.4360.5975 1.38443 �0.235 293.18 �0.203 76.630 �0.282 292.99 76.3280.6964 1.39894 �0.220 293.24 �0.146 76.525 �0.387 293.07 76.1890.8026 1.41163 �0.179 293.30 �0.084 76.335 �0.577 293.16 76.0040.9067 1.42183 �0.110 293.36 �0.026 75.981 �0.930 293.27 75.7330.9477 1.42534 �0.071 293.38 �0.009 75.767 �1.144 293.31 75.553
T/(K) = 308.150.0151 1.13161 �0.014 293.56 �0.843 77.258 0.000 293.52 77.2450.0507 1.16731 �0.042 293.58 �0.814 77.257 �0.001 293.54 77.2130.0760 1.18915 �0.061 293.60 �0.786 77.256 �0.003 293.56 77.1900.0954 1.20417 �0.075 293.62 �0.762 77.254 �0.005 293.57 77.1720.2013 1.26784 �0.148 293.77 �0.608 77.228 �0.032 293.65 77.0730.2999 1.30849 �0.195 293.91 �0.469 77.181 �0.079 293.73 76.9800.3511 1.32509 �0.214 293.97 �0.407 77.150 �0.109 293.77 76.9280.3997 1.33870 �0.225 294.02 �0.355 77.119 �0.140 293.82 76.8830.5036 1.36257 �0.241 294.11 �0.269 77.046 �0.211 293.90 76.7720.5975 1.37955 �0.240 294.17 �0.210 76.973 �0.283 293.98 76.6620.6964 1.39408 �0.225 294.23 �0.153 76.869 �0.388 294.06 76.5190.8026 1.40679 �0.184 294.29 �0.089 76.674 �0.586 294.15 76.3250.9067 1.41701 �0.115 294.35 �0.027 76.300 �0.959 294.25 76.0220.9477 1.42051 �0.073 294.37 �0.010 76.071 �1.186 294.30 75.862
T/(K) = 313.150.0151 1.1265 �0.015 294.49 �0.917 77.612 0.000 294.44 77.5970.0507 1.1623 �0.047 294.54 �0.869 77.610 �0.002 294.49 77.5630.0760 1.1841 �0.068 294.58 �0.830 77.607 �0.005 294.51 77.5380.0954 1.1991 �0.083 294.61 �0.799 77.604 �0.007 294.54 77.5200.2013 1.2628 �0.155 294.79 �0.620 77.573 �0.039 294.64 77.4170.2999 1.3035 �0.201 294.94 �0.472 77.524 �0.088 294.74 77.3240.3511 1.3201 �0.220 295.00 �0.408 77.493 �0.119 294.78 77.2730.3997 1.3337 �0.233 295.05 �0.357 77.462 �0.150 294.83 77.2240.5036 1.3576 �0.249 295.14 �0.272 77.392 �0.219 294.92 77.1110.5975 1.3746 �0.245 295.20 �0.213 77.321 �0.291 295.00 77.004
4 M. Vraneš et al. / J. Chem. Thermodynamics xxx (2014) xxx–xxx
Please cite this article in press as: M. Vraneš et al., J. Chem. Thermodyn. (2014), http://dx.doi.org/10.1016/j.jct.2014.03.025
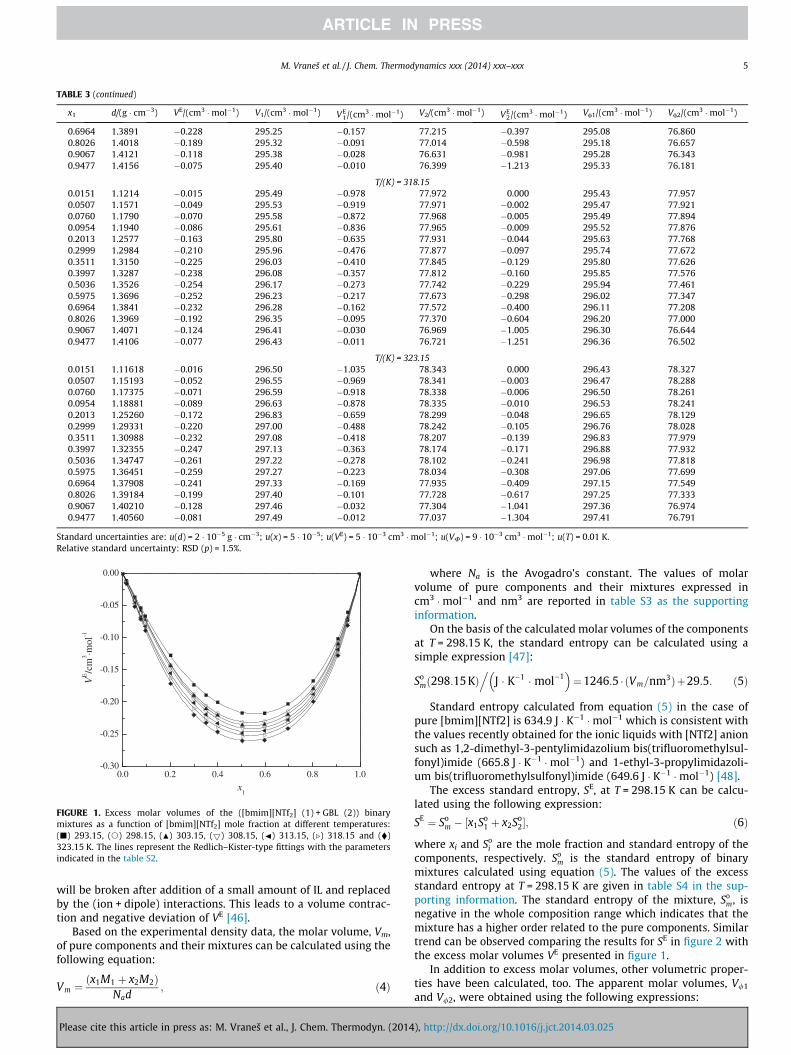
TABLE 3 (continued)
x1 d/(g � cm�3) VE/(cm3 �mol�1) V1/(cm3 �mol�1) VE1/(cm3 �mol�1) V2/(cm3 �mol�1) VE
2/(cm3 �mol�1) Va1/(cm3 �mol�1) Va2/(cm3 �mol�1)
0.6964 1.3891 �0.228 295.25 �0.157 77.215 �0.397 295.08 76.8600.8026 1.4018 �0.189 295.32 �0.091 77.014 �0.598 295.18 76.6570.9067 1.4121 �0.118 295.38 �0.028 76.631 �0.981 295.28 76.3430.9477 1.4156 �0.075 295.40 �0.010 76.399 �1.213 295.33 76.181
T/(K) = 318.150.0151 1.1214 �0.015 295.49 �0.978 77.972 0.000 295.43 77.9570.0507 1.1571 �0.049 295.53 �0.919 77.971 �0.002 295.47 77.9210.0760 1.1790 �0.070 295.58 �0.872 77.968 �0.005 295.49 77.8940.0954 1.1940 �0.086 295.61 �0.836 77.965 �0.009 295.52 77.8760.2013 1.2577 �0.163 295.80 �0.635 77.931 �0.044 295.63 77.7680.2999 1.2984 �0.210 295.96 �0.476 77.877 �0.097 295.74 77.6720.3511 1.3150 �0.225 296.03 �0.410 77.845 �0.129 295.80 77.6260.3997 1.3287 �0.238 296.08 �0.357 77.812 �0.160 295.85 77.5760.5036 1.3526 �0.254 296.17 �0.273 77.742 �0.229 295.94 77.4610.5975 1.3696 �0.252 296.23 �0.217 77.673 �0.298 296.02 77.3470.6964 1.3841 �0.232 296.28 �0.162 77.572 �0.400 296.11 77.2080.8026 1.3969 �0.192 296.35 �0.095 77.370 �0.604 296.20 77.0000.9067 1.4071 �0.124 296.41 �0.030 76.969 �1.005 296.30 76.6440.9477 1.4106 �0.077 296.43 �0.011 76.721 �1.251 296.36 76.502
T/(K) = 323.150.0151 1.11618 �0.016 296.50 �1.035 78.343 0.000 296.43 78.3270.0507 1.15193 �0.052 296.55 �0.969 78.341 �0.003 296.47 78.2880.0760 1.17375 �0.071 296.59 �0.918 78.338 �0.006 296.50 78.2610.0954 1.18881 �0.089 296.63 �0.878 78.335 �0.010 296.53 78.2410.2013 1.25260 �0.172 296.83 �0.659 78.299 �0.048 296.65 78.1290.2999 1.29331 �0.220 297.00 �0.488 78.242 �0.105 296.76 78.0280.3511 1.30988 �0.232 297.08 �0.418 78.207 �0.139 296.83 77.9790.3997 1.32355 �0.247 297.13 �0.363 78.174 �0.171 296.88 77.9320.5036 1.34747 �0.261 297.22 �0.278 78.102 �0.241 296.98 77.8180.5975 1.36451 �0.259 297.27 �0.223 78.034 �0.308 297.06 77.6990.6964 1.37908 �0.241 297.33 �0.169 77.935 �0.409 297.15 77.5490.8026 1.39184 �0.199 297.40 �0.101 77.728 �0.617 297.25 77.3330.9067 1.40210 �0.128 297.46 �0.032 77.304 �1.041 297.36 76.9740.9477 1.40560 �0.081 297.49 �0.012 77.037 �1.304 297.41 76.791
Standard uncertainties are: u(d) = 2 � 10�5 g � cm�3; u(x) = 5 � 10�5; u(VE) = 5 � 10�3 cm3 �mol�1; u(VU) = 9 � 10�3 cm3 �mol�1; u(T) = 0.01 K.Relative standard uncertainty: RSD (p) = 1.5%.
0.0 0.2 0.4 0.6 0.8 1.0-0.30
-0.25
-0.20
-0.15
-0.10
-0.05
0.00
VE/c
m3 ⋅m
ol-1
x1
FIGURE 1. Excess molar volumes of the ([bmim][NTf2] (1) + GBL (2)) binarymixtures as a function of [bmim][NTf2] mole fraction at different temperatures:(j) 293.15, (s) 298.15, (N) 303.15, (5) 308.15, (J) 313.15, (.) 318.15 and (�)323.15 K. The lines represent the Redlich–Kister-type fittings with the parametersindicated in the table S2.
M. Vraneš et al. / J. Chem. Thermodynamics xxx (2014) xxx–xxx 5
will be broken after addition of a small amount of IL and replacedby the (ion + dipole) interactions. This leads to a volume contrac-tion and negative deviation of VE [46].
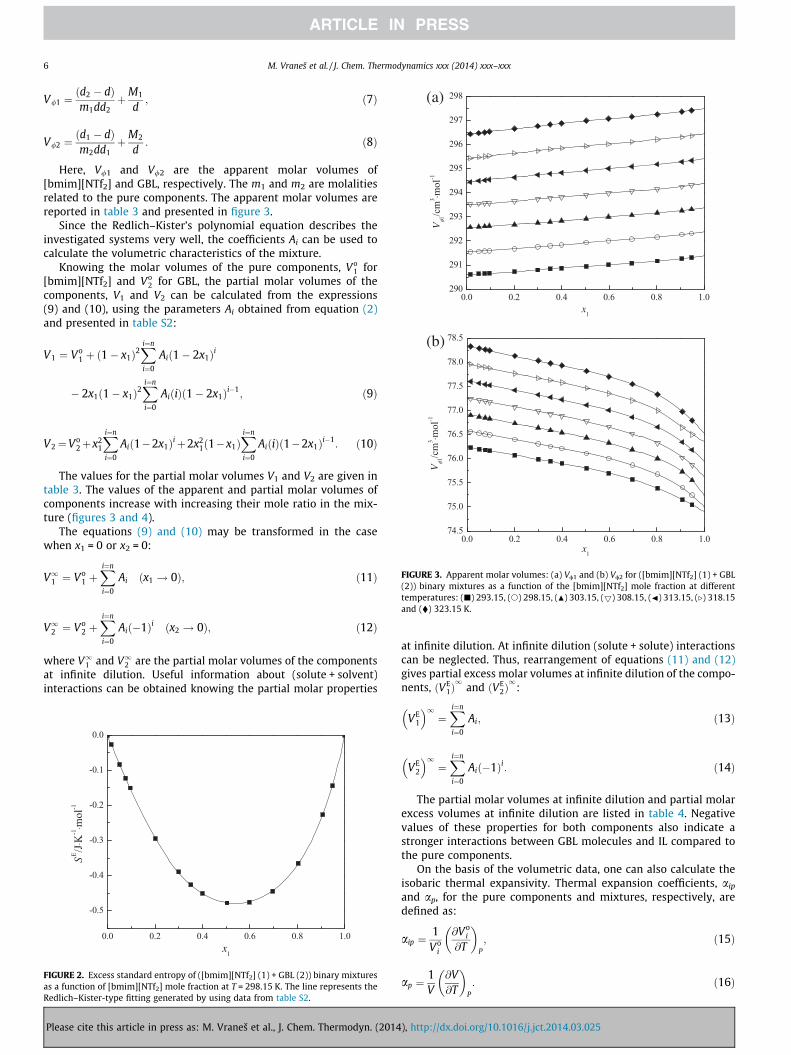
Based on the experimental density data, the molar volume, Vm,of pure components and their mixtures can be calculated using thefollowing equation:
Vm ¼x1M1 þ x2M2ð Þ
Nad; ð4Þ
Please cite this article in press as: M. Vraneš et al., J. Chem. Thermodyn. (2014
where Na is the Avogadro’s constant. The values of molarvolume of pure components and their mixtures expressed incm3 �mol�1 and nm3 are reported in table S3 as the supportinginformation.
On the basis of the calculated molar volumes of the componentsat T = 298.15 K, the standard entropy can be calculated using asimple expression [47]:
Somð298:15 KÞ
.J � K�1 � mol�1� �
¼1246:5 � ðVm=nm3Þþ29:5: ð5Þ
Standard entropy calculated from equation (5) in the case ofpure [bmim][NTf2] is 634.9 J � K�1 �mol�1 which is consistent withthe values recently obtained for the ionic liquids with [NTf2] anionsuch as 1,2-dimethyl-3-pentylimidazolium bis(trifluoromethylsul-fonyl)imide (665.8 J � K�1 �mol�1) and 1-ethyl-3-propylimidazoli-um bis(trifluoromethylsulfonyl)imide (649.6 J � K�1 �mol�1) [48].
The excess standard entropy, SE, at T = 298.15 K can be calcu-lated using the following expression:
SE ¼ Som � ½x1So
1 þ x2So2�; ð6Þ
where xi and Soi are the mole fraction and standard entropy of the
components, respectively. Som is the standard entropy of binary
mixtures calculated using equation (5). The values of the excessstandard entropy at T = 298.15 K are given in table S4 in the sup-porting information. The standard entropy of the mixture, So
m, isnegative in the whole composition range which indicates that themixture has a higher order related to the pure components. Similartrend can be observed comparing the results for SE in figure 2 withthe excess molar volumes VE presented in figure 1.
In addition to excess molar volumes, other volumetric proper-ties have been calculated, too. The apparent molar volumes, V/1
and V/2, were obtained using the following expressions:
), http://dx.doi.org/10.1016/j.jct.2014.03.025
(b)
0.0 0.2 0.4 0.6 0.8 1.0290
291
292
293
294
295
296
297
298
Vφ 1
/cm
3 ⋅mol
-1
x1
0.0 0.2 0.4 0.6 0.8 1.074.5
75.0
75.5
76.0
76.5
77.0
77.5
78.0
78.5
Vφ 1
/cm
3 ⋅ mol
-1
x1
(a)
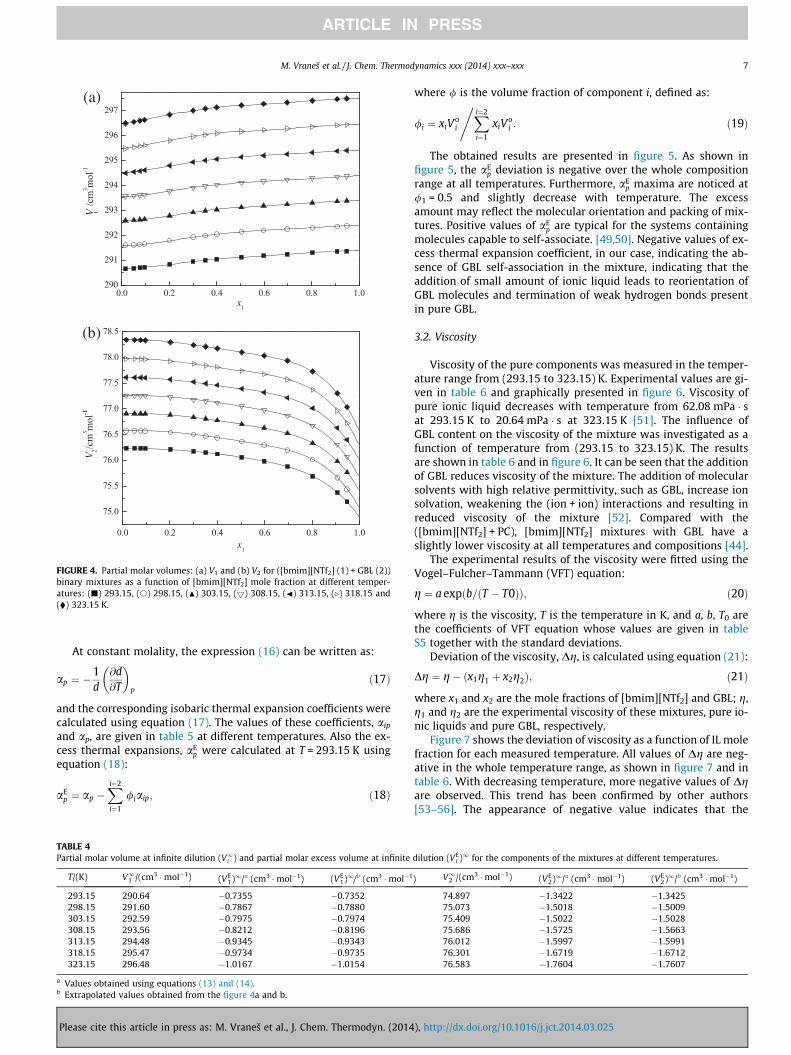
FIGURE 3. Apparent molar volumes: (a) Va1 and (b) Va2 for ([bmim][NTf2] (1) + GBL(2)) binary mixtures as a function of the [bmim][NTf2] mole fraction at differenttemperatures: (j) 293.15, (s) 298.15, (N) 303.15, (5) 308.15, (J) 313.15, (.) 318.15and (�) 323.15 K.
6 M. Vraneš et al. / J. Chem. Thermodynamics xxx (2014) xxx–xxx
V/1 ¼ðd2 � dÞm1dd2
þM1
d; ð7Þ
V/2 ¼ðd1 � dÞm2dd1
þM2
d: ð8Þ
Here, V/1 and V/2 are the apparent molar volumes of[bmim][NTf2] and GBL, respectively. The m1 and m2 are molalitiesrelated to the pure components. The apparent molar volumes arereported in table 3 and presented in figure 3.
Since the Redlich–Kister’s polynomial equation describes theinvestigated systems very well, the coefficients Ai can be used tocalculate the volumetric characteristics of the mixture.
Knowing the molar volumes of the pure components, Vo1 for
[bmim][NTf2] and Vo2 for GBL, the partial molar volumes of the
components, V1 and V2 can be calculated from the expressions(9) and (10), using the parameters Ai obtained from equation (2)and presented in table S2:
V1 ¼ Vo1 þ ð1� x1Þ2
Xi¼n
i¼0
Aið1� 2x1Þi
� 2x1ð1� x1Þ2Xi¼n
i¼0
AiðiÞð1� 2x1Þi�1; ð9Þ
V2¼Vo2þx2
1
Xi¼n
i¼0
Aið1�2x1Þiþ2x21ð1�x1Þ
Xi¼n
i¼0
AiðiÞð1�2x1Þi�1: ð10Þ
The values for the partial molar volumes V1 and V2 are given intable 3. The values of the apparent and partial molar volumes ofcomponents increase with increasing their mole ratio in the mix-ture (figures 3 and 4).
The equations (9) and (10) may be transformed in the casewhen x1 = 0 or x2 = 0:
V11 ¼ Vo1 þ
Xi¼n
i¼0
Ai ðx1 ! 0Þ; ð11Þ
V12 ¼ Vo2 þ
Xi¼n
i¼0
Aið�1Þi ðx2 ! 0Þ; ð12Þ
where V11 and V12 are the partial molar volumes of the componentsat infinite dilution. Useful information about (solute + solvent)interactions can be obtained knowing the partial molar properties
0.0 0.2 0.4 0.6 0.8 1.0
-0.5
-0.4
-0.3
-0.2
-0.1
0.0
SE /J
⋅K-1
⋅mol
-1
x1
FIGURE 2. Excess standard entropy of ([bmim][NTf2] (1) + GBL (2)) binary mixturesas a function of [bmim][NTf2] mole fraction at T = 298.15 K. The line represents theRedlich–Kister-type fitting generated by using data from table S2.
Please cite this article in press as: M. Vraneš et al., J. Chem. Thermodyn. (2014
at infinite dilution. At infinite dilution (solute + solute) interactionscan be neglected. Thus, rearrangement of equations (11) and (12)gives partial excess molar volumes at infinite dilution of the compo-nents, ðVE
1Þ1
and ðVE2Þ1
:
VE1
� �1¼Xi¼n
i¼0
Ai; ð13Þ
VE2
� �1¼Xi¼n
i¼0
Aið�1Þi: ð14Þ
The partial molar volumes at infinite dilution and partial molarexcess volumes at infinite dilution are listed in table 4. Negativevalues of these properties for both components also indicate astronger interactions between GBL molecules and IL compared tothe pure components.
On the basis of the volumetric data, one can also calculate theisobaric thermal expansivity. Thermal expansion coefficients, aip
and ap, for the pure components and mixtures, respectively, aredefined as:
aip ¼1
Voi
@Voi
@T
� �P
; ð15Þ
ap ¼1V
@V@T
� �P
: ð16Þ
), http://dx.doi.org/10.1016/j.jct.2014.03.025
0.0 0.2 0.4 0.6 0.8 1.0290
291
292
293
294
295
296
297
V 1/c
m3 m
ol-1
x1
0.0 0.2 0.4 0.6 0.8 1.0
75.0
75.5
76.0
76.5
77.0
77.5
78.0
78.5
V2/c
m3 m
ol-1
x1
(a)
(b)
FIGURE 4. Partial molar volumes: (a) V1 and (b) V2 for ([bmim][NTf2] (1) + GBL (2))binary mixtures as a function of [bmim][NTf2] mole fraction at different temper-atures: (j) 293.15, (s) 298.15, (N) 303.15, (5) 308.15, (J) 313.15, (.) 318.15 and(�) 323.15 K.
M. Vraneš et al. / J. Chem. Thermodynamics xxx (2014) xxx–xxx 7
At constant molality, the expression (16) can be written as:
ap ¼ �1d
@d@T
� �P
ð17Þ
and the corresponding isobaric thermal expansion coefficients werecalculated using equation (17). The values of these coefficients, aip
and ap, are given in table 5 at different temperatures. Also the ex-cess thermal expansions, aE
p were calculated at T = 293.15 K usingequation (18):
aEp ¼ ap �
Xi¼2
i¼1
/iaip; ð18Þ
TABLE 4Partial molar volume at infinite dilution (V1i ) and partial molar excess volume at infinite
T/(K) V11 /(cm3 �mol�1) (VE1)1/a (cm3 �mol�1) (VE
1)1/b (cm3 �mol�1
293.15 290.64 �0.7355 �0.7352298.15 291.60 �0.7867 �0.7880303.15 292.59 �0.7975 �0.7974308.15 293.56 �0.8212 �0.8196313.15 294.48 �0.9345 �0.9343318.15 295.47 �0.9734 �0.9735323.15 296.48 �1.0167 �1.0154
a Values obtained using equations (13) and (14).b Extrapolated values obtained from the figure 4a and b.
Please cite this article in press as: M. Vraneš et al., J. Chem. Thermodyn. (2014
where / is the volume fraction of component i, defined as:
/i ¼ xiVoi
Xi¼2
i¼1
,xiV
oi : ð19Þ
The obtained results are presented in figure 5. As shown infigure 5, the aE
p deviation is negative over the whole compositionrange at all temperatures. Furthermore, aE
p maxima are noticed at/1 = 0.5 and slightly decrease with temperature. The excessamount may reflect the molecular orientation and packing of mix-tures. Positive values of aE
p are typical for the systems containingmolecules capable to self-associate. [49,50]. Negative values of ex-cess thermal expansion coefficient, in our case, indicating the ab-sence of GBL self-association in the mixture, indicating that theaddition of small amount of ionic liquid leads to reorientation ofGBL molecules and termination of weak hydrogen bonds presentin pure GBL.
3.2. Viscosity
Viscosity of the pure components was measured in the temper-ature range from (293.15 to 323.15) K. Experimental values are gi-ven in table 6 and graphically presented in figure 6. Viscosity ofpure ionic liquid decreases with temperature from 62.08 mPa � sat 293.15 K to 20.64 mPa � s at 323.15 K [51]. The influence ofGBL content on the viscosity of the mixture was investigated as afunction of temperature from (293.15 to 323.15) K. The resultsare shown in table 6 and in figure 6. It can be seen that the additionof GBL reduces viscosity of the mixture. The addition of molecularsolvents with high relative permittivity, such as GBL, increase ionsolvation, weakening the (ion + ion) interactions and resulting inreduced viscosity of the mixture [52]. Compared with the([bmim][NTf2] + PC), [bmim][NTf2] mixtures with GBL have aslightly lower viscosity at all temperatures and compositions [44].
The experimental results of the viscosity were fitted using theVogel–Fulcher–Tammann (VFT) equation:
g ¼ a expðb=ðT � T0ÞÞ; ð20Þ
where g is the viscosity, T is the temperature in K, and a, b, T0 arethe coefficients of VFT equation whose values are given in tableS5 together with the standard deviations.
Deviation of the viscosity, Dg, is calculated using equation (21):
Dg ¼ g� ðx1g1 þ x2g2Þ; ð21Þ
where x1 and x2 are the mole fractions of [bmim][NTf2] and GBL; g,g1 and g2 are the experimental viscosity of these mixtures, pure io-nic liquids and pure GBL, respectively.
Figure 7 shows the deviation of viscosity as a function of IL molefraction for each measured temperature. All values of Dg are neg-ative in the whole temperature range, as shown in figure 7 and intable 6. With decreasing temperature, more negative values of Dgare observed. This trend has been confirmed by other authors[53–56]. The appearance of negative value indicates that the
dilution (VEi )1 for the components of the mixtures at different temperatures.
) V12 /(cm3 �mol�1) (VE2)1/a (cm3 �mol�1) (VE
2)1/b (cm3 �mol�1)
74.897 �1.3422 �1.342575.073 �1.5018 �1.500975.409 �1.5022 �1.502875.686 �1.5725 �1.566376.012 �1.5997 �1.599176.301 �1.6719 �1.671276.583 �1.7604 �1.7607
), http://dx.doi.org/10.1016/j.jct.2014.03.025
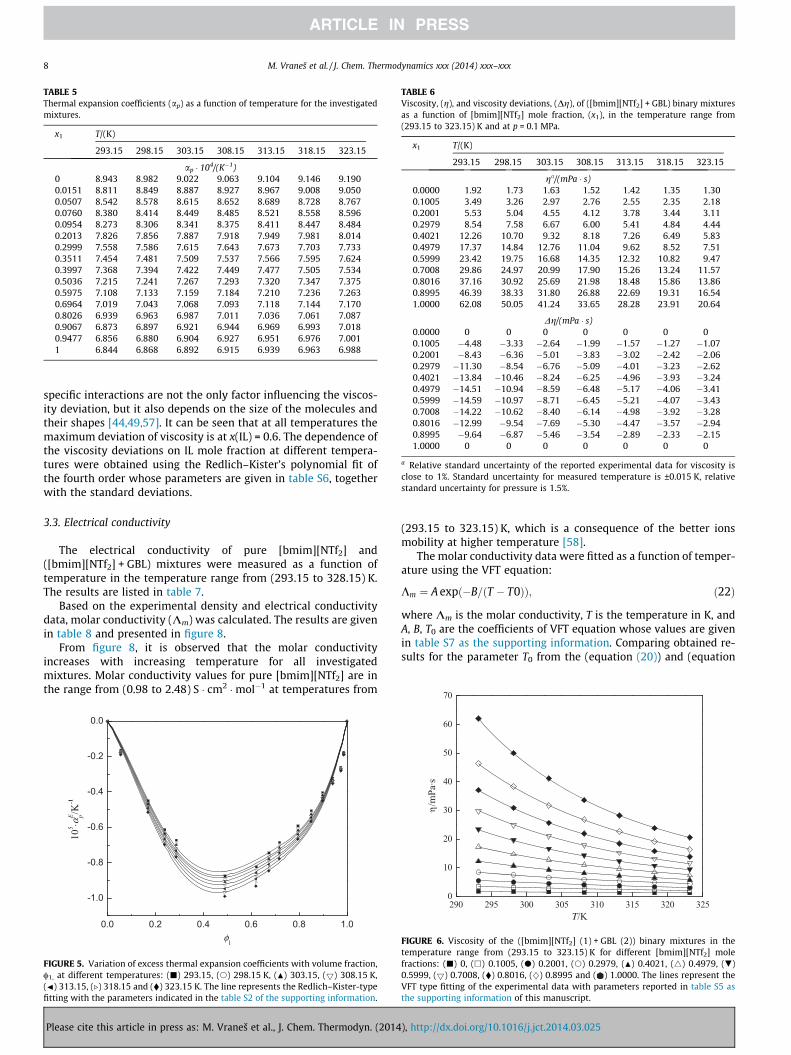
TABLE 5Thermal expansion coefficients (ap) as a function of temperature for the investigatedmixtures.
x1 T/(K)
293.15 298.15 303.15 308.15 313.15 318.15 323.15
ap � 104/(K�1)0 8.943 8.982 9.022 9.063 9.104 9.146 9.1900.0151 8.811 8.849 8.887 8.927 8.967 9.008 9.0500.0507 8.542 8.578 8.615 8.652 8.689 8.728 8.7670.0760 8.380 8.414 8.449 8.485 8.521 8.558 8.5960.0954 8.273 8.306 8.341 8.375 8.411 8.447 8.4840.2013 7.826 7.856 7.887 7.918 7.949 7.981 8.0140.2999 7.558 7.586 7.615 7.643 7.673 7.703 7.7330.3511 7.454 7.481 7.509 7.537 7.566 7.595 7.6240.3997 7.368 7.394 7.422 7.449 7.477 7.505 7.5340.5036 7.215 7.241 7.267 7.293 7.320 7.347 7.3750.5975 7.108 7.133 7.159 7.184 7.210 7.236 7.2630.6964 7.019 7.043 7.068 7.093 7.118 7.144 7.1700.8026 6.939 6.963 6.987 7.011 7.036 7.061 7.0870.9067 6.873 6.897 6.921 6.944 6.969 6.993 7.0180.9477 6.856 6.880 6.904 6.927 6.951 6.976 7.0011 6.844 6.868 6.892 6.915 6.939 6.963 6.988
TABLE 6Viscosity, (g), and viscosity deviations, (Dg), of ([bmim][NTf2] + GBL) binary mixturesas a function of [bmim][NTf2] mole fraction, (x1), in the temperature range from(293.15 to 323.15) K and at p = 0.1 MPa.
x1 T/(K)
293.15 298.15 303.15 308.15 313.15 318.15 323.15
ga/(mPa � s)0.0000 1.92 1.73 1.63 1.52 1.42 1.35 1.300.1005 3.49 3.26 2.97 2.76 2.55 2.35 2.180.2001 5.53 5.04 4.55 4.12 3.78 3.44 3.110.2979 8.54 7.58 6.67 6.00 5.41 4.84 4.440.4021 12.26 10.70 9.32 8.18 7.26 6.49 5.830.4979 17.37 14.84 12.76 11.04 9.62 8.52 7.510.5999 23.42 19.75 16.68 14.35 12.32 10.82 9.470.7008 29.86 24.97 20.99 17.90 15.26 13.24 11.570.8016 37.16 30.92 25.69 21.98 18.48 15.86 13.860.8995 46.39 38.33 31.80 26.88 22.69 19.31 16.541.0000 62.08 50.05 41.24 33.65 28.28 23.91 20.64
Dg/(mPa � s)0.0000 0 0 0 0 0 0 00.1005 �4.48 �3.33 �2.64 �1.99 �1.57 �1.27 �1.070.2001 �8.43 �6.36 �5.01 �3.83 �3.02 �2.42 �2.060.2979 �11.30 �8.54 �6.76 �5.09 �4.01 �3.23 �2.620.4021 �13.84 �10.46 �8.24 �6.25 �4.96 �3.93 �3.240.4979 �14.51 �10.94 �8.59 �6.48 �5.17 �4.06 �3.410.5999 �14.59 �10.97 �8.71 �6.45 �5.21 �4.07 �3.430.7008 �14.22 �10.62 �8.40 �6.14 �4.98 �3.92 �3.280.8016 �12.99 �9.54 �7.69 �5.30 �4.47 �3.57 �2.940.8995 �9.64 �6.87 �5.46 �3.54 �2.89 �2.33 �2.151.0000 0 0 0 0 0 0 0
a Relative standard uncertainty of the reported experimental data for viscosity isclose to 1%. Standard uncertainty for measured temperature is ±0.015 K, relativestandard uncertainty for pressure is 1.5%.
70
8 M. Vraneš et al. / J. Chem. Thermodynamics xxx (2014) xxx–xxx
specific interactions are not the only factor influencing the viscos-ity deviation, but it also depends on the size of the molecules andtheir shapes [44,49,57]. It can be seen that at all temperatures themaximum deviation of viscosity is at x(IL) = 0.6. The dependence ofthe viscosity deviations on IL mole fraction at different tempera-tures were obtained using the Redlich–Kister’s polynomial fit ofthe fourth order whose parameters are given in table S6, togetherwith the standard deviations.
3.3. Electrical conductivity
The electrical conductivity of pure [bmim][NTf2] and([bmim][NTf2] + GBL) mixtures were measured as a function oftemperature in the temperature range from (293.15 to 328.15) K.The results are listed in table 7.
Based on the experimental density and electrical conductivitydata, molar conductivity (Km) was calculated. The results are givenin table 8 and presented in figure 8.
From figure 8, it is observed that the molar conductivityincreases with increasing temperature for all investigatedmixtures. Molar conductivity values for pure [bmim][NTf2] are inthe range from (0.98 to 2.48) S � cm2 �mol�1 at temperatures from
0.0 0.2 0.4 0.6 0.8 1.0
-1.0
-0.8
-0.6
-0.4
-0.2
0.0
105 ⋅α
E p/K
- 1
φ1
FIGURE 5. Variation of excess thermal expansion coefficients with volume fraction,a1, at different temperatures: (j) 293.15, (s) 298.15 K, (N) 303.15, (5) 308.15 K,(J) 313.15, (.) 318.15 and (�) 323.15 K. The line represents the Redlich–Kister-typefitting with the parameters indicated in the table S2 of the supporting information.
Please cite this article in press as: M. Vraneš et al., J. Chem. Thermodyn. (2014
(293.15 to 323.15) K, which is a consequence of the better ionsmobility at higher temperature [58].
The molar conductivity data were fitted as a function of temper-ature using the VFT equation:
Km ¼ A expð�B=ðT � T0ÞÞ; ð22Þ
where Km is the molar conductivity, T is the temperature in K, andA, B, T0 are the coefficients of VFT equation whose values are givenin table S7 as the supporting information. Comparing obtained re-sults for the parameter T0 from the (equation (20)) and (equation
290 295 300 305 310 315 320 3250
10
20
30
40
50
60
η/m
Pa·s
T/K
FIGURE 6. Viscosity of the ([bmim][NTf2] (1) + GBL (2)) binary mixtures in thetemperature range from (293.15 to 323.15) K for different [bmim][NTf2] molefractions: (j) 0, (h) 0.1005, (d) 0.2001, (s) 0.2979, (N) 0.4021, (4) 0.4979, (.)0.5999, (5) 0.7008, (�) 0.8016, (}) 0.8995 and ( ) 1.0000. The lines represent theVFT type fitting of the experimental data with parameters reported in table S5 asthe supporting information of this manuscript.
), http://dx.doi.org/10.1016/j.jct.2014.03.025
0.0 0.2 0.4 0.6 0.8 1.0-16
-14
-12
-10
-8
-6
-4
-2
0Δη
/ m
Pa⋅s
x1
FIGURE 7. Viscosity deviations from the ideality of the ([bmim][NTf2] (1) + GBL (2))binary mixtures as a function of [bmim][NTf2] mole fraction at: T = (j) 293.15, (h)298.15, (d) 303.15, (s) 308.15, (N) 313.15, (4) 318.15, (.) 323.15, (5) 328.15 and(�) 333.15 K. The lines represent the Redlich–Kister type fittings with theparameters indicated in table S6 as the supporting information of this paper.
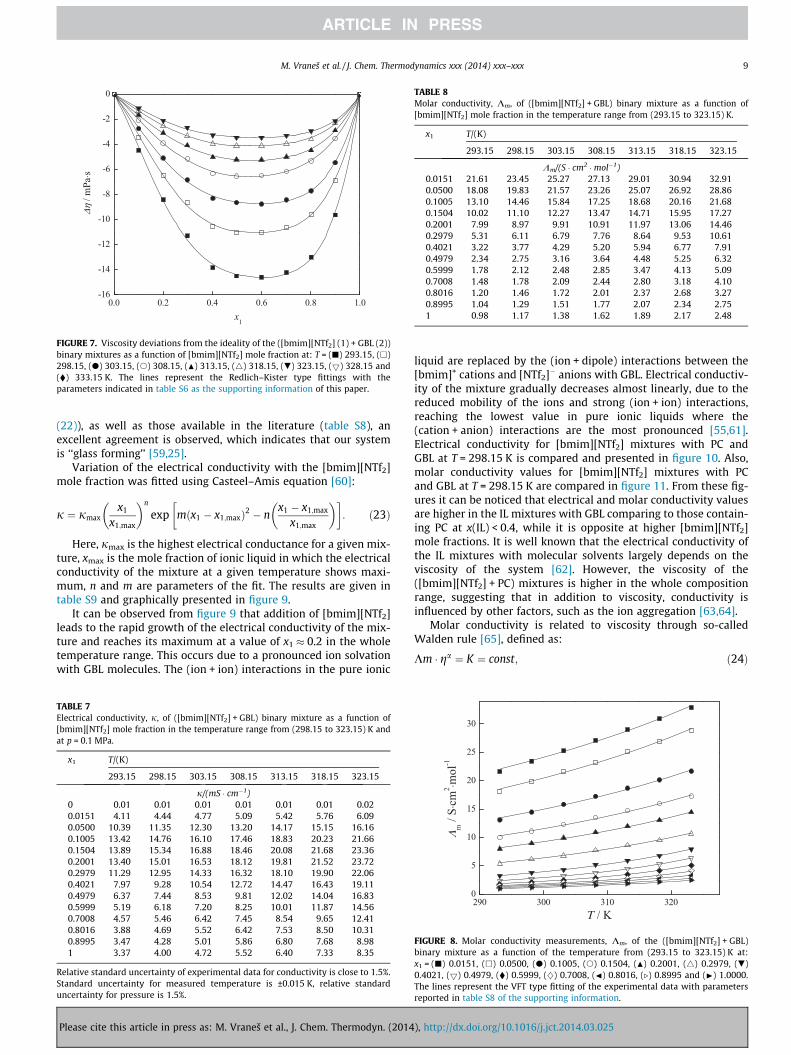
TABLE 8Molar conductivity, Km, of ([bmim][NTf2] + GBL) binary mixture as a function of[bmim][NTf2] mole fraction in the temperature range from (293.15 to 323.15) K.
x1 T/(K)
293.15 298.15 303.15 308.15 313.15 318.15 323.15
Km/(S � cm2 �mol�1)0.0151 21.61 23.45 25.27 27.13 29.01 30.94 32.910.0500 18.08 19.83 21.57 23.26 25.07 26.92 28.860.1005 13.10 14.46 15.84 17.25 18.68 20.16 21.680.1504 10.02 11.10 12.27 13.47 14.71 15.95 17.270.2001 7.99 8.97 9.91 10.91 11.97 13.06 14.460.2979 5.31 6.11 6.79 7.76 8.64 9.53 10.610.4021 3.22 3.77 4.29 5.20 5.94 6.77 7.910.4979 2.34 2.75 3.16 3.64 4.48 5.25 6.320.5999 1.78 2.12 2.48 2.85 3.47 4.13 5.090.7008 1.48 1.78 2.09 2.44 2.80 3.18 4.100.8016 1.20 1.46 1.72 2.01 2.37 2.68 3.270.8995 1.04 1.29 1.51 1.77 2.07 2.34 2.751 0.98 1.17 1.38 1.62 1.89 2.17 2.48
M. Vraneš et al. / J. Chem. Thermodynamics xxx (2014) xxx–xxx 9
(22)), as well as those available in the literature (table S8), anexcellent agreement is observed, which indicates that our systemis ‘‘glass forming’’ [59,25].
Variation of the electrical conductivity with the [bmim][NTf2]mole fraction was fitted using Casteel–Amis equation [60]:
j ¼ jmaxx1
x1;max
� �n
exp m x1 � x1;maxð Þ2 � nx1 � x1;max
x1;max
� �� �: ð23Þ
Here, jmax is the highest electrical conductance for a given mix-ture, xmax is the mole fraction of ionic liquid in which the electricalconductivity of the mixture at a given temperature shows maxi-mum, n and m are parameters of the fit. The results are given intable S9 and graphically presented in figure 9.
It can be observed from figure 9 that addition of [bmim][NTf2]leads to the rapid growth of the electrical conductivity of the mix-ture and reaches its maximum at a value of x1 � 0.2 in the wholetemperature range. This occurs due to a pronounced ion solvationwith GBL molecules. The (ion + ion) interactions in the pure ionic
TABLE 7Electrical conductivity, j, of ([bmim][NTf2] + GBL) binary mixture as a function of[bmim][NTf2] mole fraction in the temperature range from (298.15 to 323.15) K andat p = 0.1 MPa.
x1 T/(K)
293.15 298.15 303.15 308.15 313.15 318.15 323.15
j/(mS � cm�1)0 0.01 0.01 0.01 0.01 0.01 0.01 0.020.0151 4.11 4.44 4.77 5.09 5.42 5.76 6.090.0500 10.39 11.35 12.30 13.20 14.17 15.15 16.160.1005 13.42 14.76 16.10 17.46 18.83 20.23 21.660.1504 13.89 15.34 16.88 18.46 20.08 21.68 23.360.2001 13.40 15.01 16.53 18.12 19.81 21.52 23.720.2979 11.29 12.95 14.33 16.32 18.10 19.90 22.060.4021 7.97 9.28 10.54 12.72 14.47 16.43 19.110.4979 6.37 7.44 8.53 9.81 12.02 14.04 16.830.5999 5.19 6.18 7.20 8.25 10.01 11.87 14.560.7008 4.57 5.46 6.42 7.45 8.54 9.65 12.410.8016 3.88 4.69 5.52 6.42 7.53 8.50 10.310.8995 3.47 4.28 5.01 5.86 6.80 7.68 8.981 3.37 4.00 4.72 5.52 6.40 7.33 8.35
Relative standard uncertainty of experimental data for conductivity is close to 1.5%.Standard uncertainty for measured temperature is ±0.015 K, relative standarduncertainty for pressure is 1.5%.
Please cite this article in press as: M. Vraneš et al., J. Chem. Thermodyn. (2014
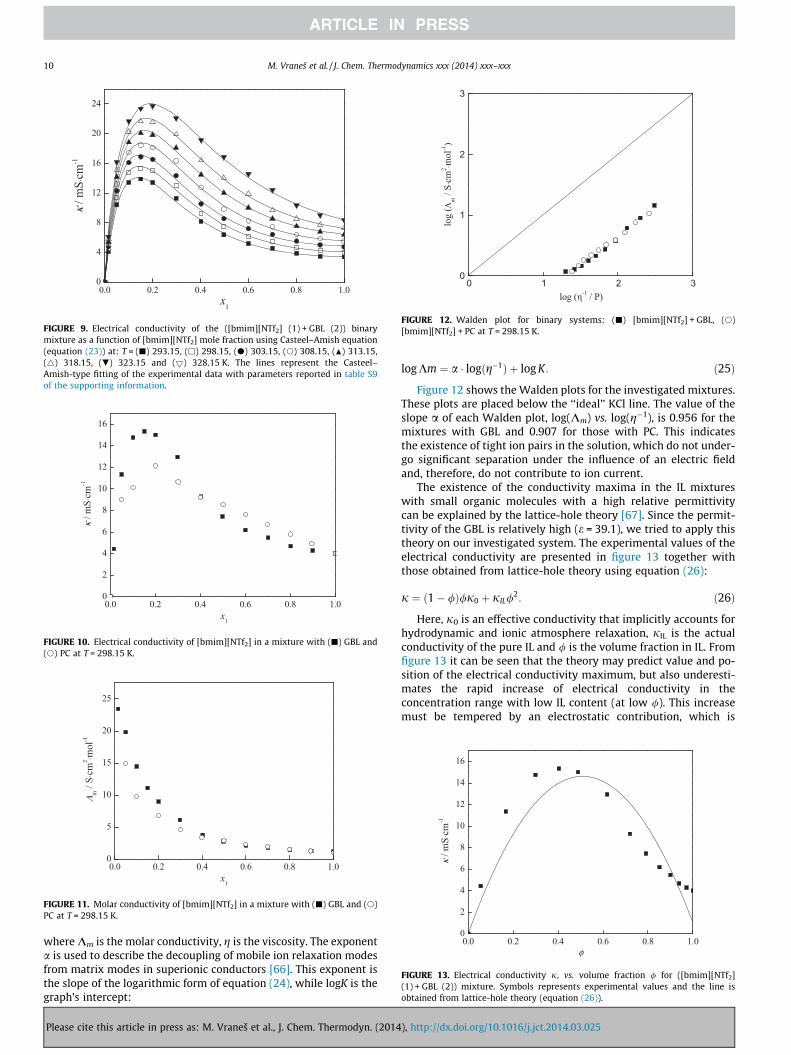
liquid are replaced by the (ion + dipole) interactions between the[bmim]+ cations and [NTf2]� anions with GBL. Electrical conductiv-ity of the mixture gradually decreases almost linearly, due to thereduced mobility of the ions and strong (ion + ion) interactions,reaching the lowest value in pure ionic liquids where the(cation + anion) interactions are the most pronounced [55,61].Electrical conductivity for [bmim][NTf2] mixtures with PC andGBL at T = 298.15 K is compared and presented in figure 10. Also,molar conductivity values for [bmim][NTf2] mixtures with PCand GBL at T = 298.15 K are compared in figure 11. From these fig-ures it can be noticed that electrical and molar conductivity valuesare higher in the IL mixtures with GBL comparing to those contain-ing PC at x(IL) < 0.4, while it is opposite at higher [bmim][NTf2]mole fractions. It is well known that the electrical conductivity ofthe IL mixtures with molecular solvents largely depends on theviscosity of the system [62]. However, the viscosity of the([bmim][NTf2] + PC) mixtures is higher in the whole compositionrange, suggesting that in addition to viscosity, conductivity isinfluenced by other factors, such as the ion aggregation [63,64].
Molar conductivity is related to viscosity through so-calledWalden rule [65], defined as:
Km � ga ¼ K ¼ const; ð24Þ
290 300 310 3200
5
10
15
20
25
30
Λ m /
S⋅cm
2 ⋅mol
-1
T / K
FIGURE 8. Molar conductivity measurements, Km, of the ([bmim][NTf2] + GBL)binary mixture as a function of the temperature from (293.15 to 323.15) K at:x1 = (j) 0.0151, (h) 0.0500, (d) 0.1005, (s) 0.1504, (N) 0.2001, (4) 0.2979, (.)0.4021, (5) 0.4979, (�) 0.5999, (}) 0.7008, (J) 0.8016, (.) 0.8995 and (I) 1.0000.The lines represent the VFT type fitting of the experimental data with parametersreported in table S8 of the supporting information.
), http://dx.doi.org/10.1016/j.jct.2014.03.025
0.0 0.2 0.4 0.6 0.8 1.00
4
8
12
16
20
24
κ / m
S⋅cm
-1
x1
FIGURE 9. Electrical conductivity of the ([bmim][NTf2] (1) + GBL (2)) binarymixture as a function of [bmim][NTf2] mole fraction using Casteel–Amish equation(equation (23)) at: T = (j) 293.15, (h) 298.15, (d) 303.15, (s) 308.15, (N) 313.15,(4) 318.15, (.) 323.15 and (5) 328.15 K. The lines represent the Casteel–Amish-type fitting of the experimental data with parameters reported in table S9of the supporting information.
0.0 0.2 0.4 0.6 0.8 1.00
2
4
6
8
10
12
14
16
κ / m
S⋅cm
-1
x1
FIGURE 10. Electrical conductivity of [bmim][NTf2] in a mixture with (j) GBL and(s) PC at T = 298.15 K.
0.0 0.2 0.4 0.6 0.8 1.00
5
10
15
20
25
Λ m /
S⋅cm
2 ⋅ mol
-1
x1
FIGURE 11. Molar conductivity of [bmim][NTf2] in a mixture with (j) GBL and (s)PC at T = 298.15 K.
0 1 2 30
1
2
3
log
(Λm /
S⋅cm
2 ⋅mol
-1)
log (η-1 / P)
FIGURE 12. Walden plot for binary systems: (j) [bmim][NTf2] + GBL, (s)[bmim][NTf2] + PC at T = 298.15 K.
0.0 0.2 0.4 0.6 0.8 1.00
2
4
6
8
10
12
14
16
κ / m
S⋅cm
-1
φ
FIGURE 13. Electrical conductivity j, vs. volume fraction / for ([bmim][NTf2](1) + GBL (2)) mixture. Symbols represents experimental values and the line isobtained from lattice-hole theory (equation (26)).
10 M. Vraneš et al. / J. Chem. Thermodynamics xxx (2014) xxx–xxx
where Km is the molar conductivity, g is the viscosity. The exponenta is used to describe the decoupling of mobile ion relaxation modesfrom matrix modes in superionic conductors [66]. This exponent isthe slope of the logarithmic form of equation (24), while logK is thegraph’s intercept:
Please cite this article in press as: M. Vraneš et al., J. Chem. Thermodyn. (2014
log Km ¼ a � logðg�1Þ þ log K: ð25Þ
Figure 12 shows the Walden plots for the investigated mixtures.These plots are placed below the ‘‘ideal’’ KCl line. The value of theslope a of each Walden plot, log(Km) vs. log(g�1), is 0.956 for themixtures with GBL and 0.907 for those with PC. This indicatesthe existence of tight ion pairs in the solution, which do not under-go significant separation under the influence of an electric fieldand, therefore, do not contribute to ion current.
The existence of the conductivity maxima in the IL mixtureswith small organic molecules with a high relative permittivitycan be explained by the lattice-hole theory [67]. Since the permit-tivity of the GBL is relatively high (e = 39.1), we tried to apply thistheory on our investigated system. The experimental values of theelectrical conductivity are presented in figure 13 together withthose obtained from lattice-hole theory using equation (26):
j ¼ ð1� /Þ/j0 þ jIL/2: ð26Þ
Here, j0 is an effective conductivity that implicitly accounts forhydrodynamic and ionic atmosphere relaxation, jIL is the actualconductivity of the pure IL and / is the volume fraction in IL. Fromfigure 13 it can be seen that the theory may predict value and po-sition of the electrical conductivity maximum, but also underesti-mates the rapid increase of electrical conductivity in theconcentration range with low IL content (at low /). This increasemust be tempered by an electrostatic contribution, which is
), http://dx.doi.org/10.1016/j.jct.2014.03.025
M. Vraneš et al. / J. Chem. Thermodynamics xxx (2014) xxx–xxx 11
missing in the model. Comparing the results presented in figure 13with those obtained from lattice-hole theory for the mixtures con-taining the same IL and PC as the molecular solvent [44], the signif-icant deviation from the experimental values can be observed inthe case of GBL. The higher deviations at higher IL volume fractionsare direct consequence of lower GBL relative permittivity com-pared to PC (e = 64), which is in accordance with the basic princi-ples of the theory [67].
4. Conclusions
Volumetric properties of binary liquid mixtures of 1-butyl-3-methylimidazolium bis(trifluoromethylsulfonyl)imide with c-but-irolactone are presented in this paper at various temperatures atatmospheric pressure in the whole composition range. Based onthe experimental density values, the excess molar volumes,apparent and partial molar volumes and excess molar volumes atinfinite dilution were calculated. Also, the coefficient of thermalexpansion and the excess of thermal expansion coefficient were cal-culated. Transport properties of the mixture were examined as afunction of temperature. It was shown that the addition of GBLreduces viscosity of the mixture. The electrical conductivity of([bmim][NTf2] + GBL) was measured as a function of temperaturein the whole composition range.
Acknowledgments
This work was financially supported by the Ministry ofEducation, Science and Technological Development of Serbia underproject contract ON172012 and The Provincial Secretariat forScience and Technological Development of APV.
Appendix A. Supplementary data
Supplementary data associated with this article can be found, inthe online version, at http://dx.doi.org/10.1016/j.jct.2014.03.025.
References
[1] M. Koel, Ionic Liquids in Chemical Analysis, Taylor & Francis Group, CRC, NewYork, 2009.
[2] J.M. Crosthwaite, M.J. Muldoon, S.N.V.K. Aki, E.J. Maginn, J.F. Brennecke, J. Phys.Chem. B 110 (2006) 9354–9361.
[3] P. Wasserscheid, R. Hal, A. Boesmann, Green Chem. 234 (2002) 400–404.[4] R. Ge, C. Hardacre, P. Nancarrow, D.W. Rooney, J. Chem. Eng. Data 52 (2007)
1819–1823.[5] K.P. Doyle, C.M. Lang, K. Kim, P.A. Kohl, J. Electrochem. Soc. 153 (2006)
1353–1357.[6] M.J. Earle, J. Esperança, M.A. Gilea, J.N.C. Lopes, L.P.N. Rebelo, J.W. Magee, K.R.
Seddon, J.A. Widegren, Nature 439 (2006) 831–834.[7] M.J. Earle, K.R. Seddon, Pure Appl. Chem. 72 (2000) 1391–1398.[8] H. Nakagawa, Y. Fujino, S. Kozono, Y. Katayama, T. Nukuda, H. Sakaebe, H.
Matsumoto, K. Tatsumi, J. Power Sources 174 (2007) 1021–1026.[9] S. Chun, S.V. Dzyuba, R.A. Bartsch, Anal. Chem. 73 (2001) 3737–3741.
[10] R. Palm, H. Kurig, K. Tõnurist, A. Jänes, E. Lust, Electrochem. Commun. 22(2012) 203–206.
[11] S.K. Chaurasia, R.K. Singh, S. Chandra, Solid State Ionics 183 (2011) 32–39.[12] P. Yang, Y. Zhao, C. Su, K. Yang, B. Yan, M. An, Electrochim. Acta 88 (2013)
203–207.[13] Y. An, P. Zuo, X. Cheng, L. Liao, G. Yin, Int. J. Electrochem. Sci. 6 (2011)
2398–2410.[14] J.K. Kim, A. Matic, J.H. Ahn, R. Jacobsson, J. Power Sources 195 (2010)
7639–7643.[15] M.N. Roy, I. Banik, D. Ekka, J. Chem. Thermodyn. 57 (2013) 230–237.[16] M. Anouti, A. Vigeant, J. Jacquemin, C. Brigouleix, D. Lemordant, J. Chem.
Thermodyn. 42 (2010) 834–845.[17] A. Zhu, J. Wang, R. Liu, J. Chem. Thermodyn. 43 (2011) 796–799.[18] Y. Aihara, T. Bando, H. Nakagawa, H. Yoshida, K. Hayamizu, E. Akiba, W.S. Price,
J. Electrochem. Soc. 151 (2004) 119–122.
Please cite this article in press as: M. Vraneš et al., J. Chem. Thermodyn. (2014
[19] S. Kinoshita, M. Kotato, Y. Sakata, M. Ue, Y. Watanabe, H. Morimoto, S.Tobishima, J. Power Sources 183 (2008) 755–760.
[20] A. Chagnes, M. Diaw, B. Carré, P. Willmann, D. Lemordant, J. Power Sources 145(2005) 82–88.
[21] A. Chagnes, H. Allouchi, B. Carré, D. Lemordant, Solid State Ionics 176 (2005)1419–1427.
[22] J. Hamelin, T.K. Bose, J. Thoen, Phys. Rev. A 42 (1990) 4735–4742.[23] J. Troncoso, C.A. Cerdeirin, Y.A. Sanmamed, L. Romani, L. Paulo, N. Rebelo, J.
Chem. Eng. Data 51 (2006) 1856–1859.[24] M. Krummen, P. Wasserscheid, J. Gmehling, J. Chem. Eng. Data 47 (2002)
1411–1417.[25] K.R. Harris, M. Kanakubo, L.A. Wolf, J. Chem. Eng. Data 52 (2007) 1080–1085.[26] A. Wandschneider, K. Lehmann, A. Heintz, J. Chem. Eng. Data 53 (2008) 596–
599.[27] S. García, M. Larriba, J. García, J. Torrecilla, F. Rodríguez, J. Chem. Eng. Data 56
(2011) 113–118.[28] S.V. Dzyuba, R.A. Bartsch, Chem. Phys. Chem. 3 (2002) 161–166.[29] C.P. Fredlake, J.M. Crosthwaite, D.G. Hert, S. Aki, J.F. Brennecke, J. Chem. Eng.
Data 49 (2004) 954–964.[30] L.G. Bettini, M. Galluzzi, A. Podestà, P. Milani, P. Piseri, Carbon 59 (2013)
212–220.[31] R.K. Goyal, N.S. Jayakumar, M.A. Hashim, J. Hazard. Mater. 195 (2011)
383–390.[32] J.A. Widegren, E.M. Saurer, K.N. Marsh, J.W. Magee, J. Chem. Thermodyn. 37
(2005) 569–575.[33] H. Tokuda, K. Hayamizu, K. Ishii, M.A.B.H. Susan, M. Watanabe, J. Phys. Chem. B
109 (2005) 6103–6110.[34] H. Tokuda, S. Tsuzuki, M.A.B.H. Susan, K. Hayamizu, M. Watanabe, J. Phys.
Chem. B 110 (2006) 19593–19600.[35] M. Vraneš, S. Dozic, V. Ðeric, S. Gadzuric, J. Chem. Eng. Data 57 (2012)
1072–1077.[36] B.S. Bjola, M.A. Siddiqi, P. Svejda, J. Chem. Eng. Data 46 (2001) 1167–1171.[37] J. Krakowiak, J. Wawer, A. Farmas, J. Chem. Thermodyn. 54 (2012) 412–420.[38] G. Moumouzias, G. Ritzoulis, J. Chem. Eng. Data 44 (1999) 1273–1278.[39] S.K. Yang, S.J. Peng, J.H. Huang, L.Q. Fan, F.X. Yang, J. Chem. Thermodyn. 39
(2007) 773–780.[40] D. Brouillette, G. Perron, J.E. Desnoyers, J. Solution Chem. 27 (1998) 151–182.[41] D.H.S. Ramkumar, A.P. Kudchadker, J. Chem. Eng. Data 34 (1989) 463–465.[42] L. Werblan, J. Lesinski, J. Pol. J. Chem. 54 (1980) 507.[43] O. Redlich, A.T. Kister, Ind. Eng. Chem. 40 (1948) 345–348.[44] M. Vraneš, N. Zec, A. Tot, S. Papovic, S. Dozic, S. Gadzuric, J. Chem. Thermodyn.
68 (2014) 98–108.[45] R. Zarrougui, M. Dhahbi, D. Lemordant, J. Solution Chem. 39 (2010) 921–942.[46] M. Masia, R. Rey, J. Phys. Chem. B 108 (2004) 17992–18002.[47] L. Glasser, Thermochim. Acta 421 (2004) 87–93.[48] T.Y. Wu, B.K. Chen, C.W. Kuo, L. Hao, Y.C. Peng, I.W. Sun, J. Taiwan Inst. Chem. E
43 (2012) 860–867.[49] J. Pires, L. Timperman, J. Jacquemin, A. Balducci, M. Anouti, J. Chem.
Thermodyn. 59 (2013) 10–19.[50] K. Tamura, M. Nakamura, S. Murakami, J. Sol. Chem. 26 (1997) 1199–1207.[51] J. Jacquemin, P. Nancarrow, D.W. Rooney, M.F. Costa Gomes, P. Husson, V.
Majer, A. Pádua, C. Hardacre, J. Chem. Eng. Data 53 (2008) 2133–2143.[52] M. García-Mardones, I. Gascon, M.C. Lopes, F.M. Royo, C. Lafuente, J. Chem. Eng.
Data 57 (2012) 3549–3556.[53] J.G. Li, Y.F. Hu, S.F. Sun, Y.S. Liu, Z.C. Liu, J. Chem. Thermodyn. 42 (2010)
904–908.[54] T.Y. Wu, B.K. Chen, L. Hao, K.F. Lin, I.W. Sun, J. Taiwan Inst. Chem. E 42 (2011)
914–921.[55] I.B. Malham, M. Turmine, J. Chem. Thermodyn. 40 (2008) 718–723.[56] A.E. Andreatta, A. Arce, E. Rodil, A. Soto, J. Chem. Thermodyn. 41 (2009)
1317–1323.[57] S.L. Oswal, H.S. Desai, Fluid Phase Equilib. 204 (2003) 281–294.[58] P.Y. Lin, A.N. Soriano, R.B. Leron, M.H. Li, J. Chem. Thermodyn. 42 (2010)
994–998.[59] J. Salgado, T. Regueira, L. Lugo, J. Vijande, J. Fernández, J. García, J. Chem.
Thermodyn. 70 (2014) 101–110.[60] J.F. Casteel, E.S. Amis, J. Chem. Eng. Data 17 (1972) 55–59.[61] A. Modaressi, H. Sifaoui, M. Mielcarz, U. Domanska, M. Rogalski, Colloids Surf.
A: Physicochem. Eng. Aspects 302 (2007) 181–185.[62] A. Jarosik, S.R. Krajewski, A. Lewandowski, P. Radzimski, J. Mol. Liq. 123 (2006)
43–50.[63] M. García-Mardones, H.M. Osorio, C. Lafuente, I. Gascón, J. Chem. Eng. Data 58
(2013) 1613–1620.[64] E. Rilo, J. Vila, M. Garcıa, L.M. Varela, O. Cabeza, J. Chem. Eng. Data 55 (2010)
5156–5163.[65] E. Couadou, J. Jacquemin, H. Galiano, C. Hardacre, M. Anouti, J. Phys. Chem. B
117 (2013) 1389–1402.[66] W. Xu, E.I. Cooper, C.A. Angell, J. Phys. Chem. B 107 (2003) 6170–6178.[67] C.E. Woodward, K.R. Harris, Phys. Chem. Chem. Phys. 12 (2010) 1172–1176.
JCT 13-557
), http://dx.doi.org/10.1016/j.jct.2014.03.025