Comparative Study of Using Different Yeast Genera as ...
227
Comparative Study of Using Different Yeast Genera as Vehicles for Protein Delivery to Antigen-Presenting Cells Dissertation zur Erlangung des Grades des Doktors der Naturwissenschaften der Naturwissenschaftlich-Technischen Fakultät III Chemie, Pharmazie, Bio- und Werkstoffwissenschaften der Universität des Saarlandes von Silvia Boschi Bazan Saarbrücken 2011
Transcript of Comparative Study of Using Different Yeast Genera as ...
Comparative Study of Using Different Yeast Genera as
Vehicles for Protein Delivery to Antigen-Presenting Cells
Dissertation
zur Erlangung des Grades
des Doktors der Naturwissenschaften
der Naturwissenschaftlich-Technischen Fakultät III
Chemie, Pharmazie, Bio- und Werkstoffwissenschaften
der Universität des Saarlandes
von Silvia Boschi Bazan
Saarbrücken 2011

Tag des Kolloquiums:
Dekan:
Berichterstatter:
Vorsitz:
Akad. Mitarbeiter:
Abbreviations
Abbreviations
ampR ampicillin resistance gene (β-lactamase) aox alcohol oxidase APC antigen-presenting cell APS ammonium persulfate ars autonomous replication sequence ATP adenosine triphosphate BMG buffered minimal glycerol BMM buffered minimal methanol bp base pairs BSA bovine serum albumin CD(#) cluster of differentiation (number) CFSE 5-(and-6)-carboxyfluorescein diacetate, succinimidyl ester CO2 carbon dioxide Cy7 cyanine dye 7 Da Dalton DC dendritic cell DOC deoxycholate DMSO dimethyl sulfoxide DNA desoxyribonucleic acid DNase desoxyribonuclease dNTP deoxynucleoside triphosphate d/o dropout DTT dithiothreitol EDTA ethylene diamine tetraacetic acid eGFP enhanced green fluorescent protein EMM Edinburgh minimal medium ER endoplasmic reticulum FACS fluorescence activated cell sorting FCS foetal calf serum Fig. figure FITC fluorescein isothiocyanate GM-CSF granulocyte-macrophage colony stimulating factor h hour(s) HBSS Hank's buffered salt solution HCMV human cytomegalovirus his histidine IFN interferon Ig immunoglobulin IL interleukin IPTG isopropyl-β-D-thiogalactopyranosid
Abbreviations
kanR kanamycin resistance gene (aminoglycoside 3’-phosphotransferase) kb kilobase kDa kilodalton KRE killer resistant LB Luria Bertani leu leucine LPS lipopolysaccharide M molar Mg2+ magnesium Mb mega base pairs MCS multiple cloning site MHC major histocompatibility complex mRNA messenger RNA nmt no message in thiamine OD optical density ORF open reading frame ori origin of replication PAMP pathogen-associated molecular patterns PBMC peripheral blood mononuclear cells PBS phosphate-buffered saline PBSE phosphate-buffered saline, EDTA PBSES phosphate-buffered saline, EDTA, sorbitol PCR polymerase chain reaction PE R-phycoerythrin PEG polyethyleneglycol PerCP peridinin chlorophyl protein PGK phosphoglycerate kinase PMA phorbol myristate acetate PMSF phenylmethanesulfonyl fluoride PRR pattern recognition receptor PVDF polyvinylidene difluoride RLU relative luminescence units RNA ribonucleic acid ROS reactive oxygen species rpm rotations per minute RPMI Roswell Park Memorial Institute s second(s) s.c. subcutaneously SC synthetic complete SD standard deviation SDS sodium dodecylsulfate SDS-PAGE sodium dodecylsulfate polyacrylamide gel electrophoresis
Abbreviations
SOC Super Optimal Broth with Glucose SOE splicing by overlapping extention Taq Termus aquaticus TBE tris, boric acid, EDTA TBS tris-buffered saline TCA 2,2,2-trichloroacetic acid TCR T cell receptor TE tris, EDTA TEM transmission electron microscopy TEMED N,N,N',N'-tetramethylethylenediamine TNF tumor necrosis factor Tris tris-(hydrohymethyl)-aminomethane ura uracil U unit(s) UV ultraviolet VLP virus-like particles v/v volume per volume w/o without w/v weight per volume X-gal 5-bromo-4-chloro-3-indolyl-β-D-galactopyranoside YCB yeast carbon base YEp yeast episomal plasmid YNB yeast nitrogen base YPD yeast extract pepton dextrose YPGal yeast extract peptone galactose
Abstract
ABSTRACT
The use of yeasts as vehicle for protein antigens has been demonstrated to be a highly effective vaccination approach. In part, this can be attributed to the intrinsic adjuvant properties of yeast cell wall components. Moreover, the correct processing of recombinantly expressed proteins and the safety status of many yeast genera has encouraged the onset of preclinical and clinical trials using yeast vectors. However, the vast majority of such studies focused the attention on yeasts of the genus Saccharomyces as candidate T cell vaccine. In this work, different yeast genera were evaluated as potential antigen carrier in view of the development of novel yeast-based vaccines. For this purpose, yeasts were initially assessed for their ability to induce maturation and activation of human dendritic cells. Next, the internalization profile of selected yeasts by mammalian phagocytes was analyzed, as well as the involvement of pattern recognition receptors in the uptake process. Subsequently, yeasts engineered to express foreign proteins were assessed for their antigen delivery capacity. In vitro antigen presentation and ex vivo whole blood assays showed that recombinant yeast genera differently activate antigen-specific T cells. Furthermore, antigen localization played a decisive role in T cell activation. The data presented here strongly support the potential of recombinant yeast in the development of novel vaccine strategies in order to induce antigen-specific T cell responses. Der Einsatz von Hefen als Vehikel für Proteinantigene stellt eine vielversprechende Vakzinierungsstrategie dar, was u.a. auf adjuvante Eigenschaften der Hefe-Zellwandkomponenten zurückzuführen ist. Weiterhin haben der Nachweis der korrekten Prozessierung rekombinanter Proteine und der unbedenkliche Status vieler Hefegattungen ihren Einsatz in präklinischen und klinischen Studien gefördert. Bislang hat sich die Mehrzahl dieser Studien auf Hefen der Gattung Saccharomyces als Vakzinkandidaten für zellvermittelte Immunantworten konzentriert. Im Rahmen dieser Arbeit wurden verschiedene Hefegattungen als potentielle Antigenvehikel zur Etablierung neuartiger Hefe-basierter Vakzinen untersucht. Zunächst wurden Ausreifung und Aktivierung von Dendritischen Zellen durch diverse Hefegattungen analysiert. Danach wurden sowohl die Aufnahme bestimmter Hefegattungen durch Säuger-Phagozyten als auch die Beteiligung spezifischer Rezeptoren in diesem Prozess untersucht. Anschließend wurde die Fähigkeit rekombinanter Hefen zum Antigen „Delivery“ evaluiert. Durch in vitro Antigenpräsentation und ex vivo Vollblut-Assays konnte gezeigt werden, dass verschiedene Hefegattungen Antigen-spezifische T-Zellen unterschiedlich aktivieren. Des Weiteren spielt die Antigenlokalisierung eine wichtige Rolle bei der T-Zellaktivierung. Die vorliegenden Ergebnisse unterstreichen das Potenzial rekombinanter Hefen bei der Entwicklung neuartiger Impfstrategien zur Induktion Antigen-spezifischer T-Zell-Immunantworten.
Contents
CONTENTS
I. Introduction................................................................................................................12
1. The immune system – a short overview......................................................................12
1.1. Antigen recognition and presentation to T lymphocytes.………………...……..…13
2. Recombinant yeasts in biotechnological approaches............................................…..21
2.1. Yeasts and the immune system…………………………………………….………24
3. General concepts of vaccines………………….………………………………….....29
3.1. Vaccines for cellular immune responses…………………………………….…….31
3.2. Yeast as vehicle for generating antigen-specific immune responses……….…..…32
4. Experimental systems………………………………………………………..………36
4.1. Ovalbumin as model antigen………………………………………………...…….36
4.2. Pp65, a matrix protein from human cytomegalovirus, as model antigen……….....37
4.3. Virus-like particles (VLP) as antigen carrier...……………………………….……39
5. Aim of the study……………………………………………………………………..40
II. Materials....................................................................................................................42
1. Organisms……………………………………………………………………...…….42
1.1. Escherichia coli strains………………………………………………………….....42
1.2. Yeast strains………………………………………………………………………..42
1.3. Cell lines………………………………………………………………………...…43
1.4. Mice……………………………………………………………………………..…43
2. Culture Media and Supplements…………………………………………………..…44
2.1. Bacterial culture media…………………………………………………………….44
2.2. Yeast culture media……………………………………………………………..…45
2.2.1. S. cerevisiae media………………………………………………………………46
2.2.2. P. pastoris media………………………………………………………………...46
2.2.3. Sz. pombe media…………………………………………………………………47
2.2.4. K. lactis media………………………………………………………………...…49
2.3. Mammalian cells culture media……………………………………………............50
2.3.1. IC-21 murine macrophages……………………………………………………...50
2.3.2. Human monocytes, dendritic cells………………………………………………50
2.3.3. Human lymphocytes…………………………………………………..…………50
2.3.4. Freezing medium…………………………………………………………...……50
Contents
3. Buffers and Solutions……………………………………………………………..…51
3.1. Common buffers………………………………………………………………...…51
3.2. Buffers for agarose gel electrophoresis……………………………………………53
3.3. Buffers for isolation of plasmid DNA……………………………………………..53
3.4. Solutions for transformation of Sz. pombe………………………………………...53
3.5. Solutions for transformation of P. pastoris………………………………………..54
3.6. Solutions for transformation of S. cerevisiae……………………………………...54
3.7. Solutions for transformation of K. lactis……………………………………….….55
3.8. Buffers for VLP preparation……………………………………………………….55
3.9. Buffers and solutions for SDS-PAGE……………………………………………..56
3.10. Buffers and solutions for western blotting……………………………………….56
3.11. Buffers and solutions for cell culture…………………………………………….57
4. Primers……………………………………………………………………………….58
5. Antibodies……………………………………………………………………………59
5.1. Primary antibodies…………………………………………………………………59
5.2. Secondary antibodies………………………………………………………………60
6. Proteins and peptides………………………………………………………………...60
7. Enzymes……………………………………………………………………………...61
8. Molecular weight markers…………………………………………………………...61
9. Reagents for cell culture………………………………………………………..……61
10. Kits………………………………………………………………………………….61
11. Other chemicals and materials……………………………………………………...62
12. Plasmids…………………………………………………………………………….62
12.1. Plasmid maps……………………………………………………………………..64
III. Methods....................................................................................................................67
1. Molecular Biology Methods…………………………………………………………67
1.1. DNA amplification by polymerase chain reaction………………………………...67
1.2. Agarose gel electrophoresis..……………………………………………………....68
1.3. Elution of DNA fragments from agarose gels……………………………………..69
1.4. Restriction enzyme digestion of plasmid DNA………………………………..…..70
1.5. Cloning of PCR products using AccepTor Vector Kit…………………………….70
1.6. DNA ligation………………….…………………………………………………...71
1.7. Determination of DNA concentration and purity………………………………….72
Contents
1.8. DNA sequencing…………………………………………………………………...73
1.9. Plasmid DNA extraction…………………………………………………………...73
1.9.1. Alkaline lysis….……………………………………………………………..…..73
1.9.2. Plasmid DNA isolation with Miniprep-kit…………………………………...….74
1.10. Isolation of genomic DNA from yeast………………………………………...…75
2. Culture conditions……………………………………………………………………75
2.1. E. coli……………………………………………………………………………....75
2.2. Yeasts………………………………………………………………………………76
2.3. Mammalian cells…….……………………………………………………………..76
2.3.1. IC-21 mouse peritoneal macrophages…………………………………………...76
2.4. Freezing and thawing cells……………………………………………………...…77
2.4.1. Bacteria and yeasts………………………………………………………………77
2.4.2. Freezing mammalian cells………………………………………………….……77
2.4.3. Thawing mammalian cells……………………………………………………….77
3. Cell number determination……………………………………………………….….77
3.1. Optical density……………………………………………………………………..77
3.2. Determination of yeast cell number………………………………………..………78
3.3. Determination of mammalian cell number………………………………………...78
4. Transformation methods……………….………………………………………….…78
4.1. E. coli transformation……………………………………………………..……….78
4.2. Transformation of S. cerevisiae……………………………………………………80
4.3. K. lactis transformation (New England Biolabs)……..……………………………80
4.4. Sz. pombe transformation by the rapid lithium acetate method……………………81
4.5. P. pastoris transformation…………………………………………………………82
5. Protein Methods…………………………………………………………………..…82
5.1. Protein extraction from yeast cells or from cell-free culture medium………….….82
5.2. Protein isolation from yeast cell walls………………………………………….….83
5.3. Protein precipitation…………………………………………………...…………..83
5.4. Polyacrylamide gel electrophoresis...………………………………………......….84
5.5. Western blotting…………………………………………………………………...86
5.6. VLP preparation and transmission electron microscopy (TEM)………………..…87
6. Cell- and immunobiology methods………………………………………………….88
6.1. Immunolabelling of yeasts………………………………………….……………...88
6.2. Staining cell surface antigens in mammalian cells……………………………...…88
Contents
6.3. Intracellular cytokine staining in mammalian cells………………………………..88
6.4. Flow cytometry…………………………………………………………………….89
6.5. Isolation of peripheral blood mononuclear cells (PBMC)……...………………….90
6.6. Monocytes isolation and differentiation into dendritic cells……………………....91
6.7. Maturation of dendritic cells by different stimuli and analysis of cytokine secretion……………………………………………...92
6.8. Incubation of immature dendritic cells with yeast vectors……………………..….92
6.9. Stimulation of antigen-specific memory T lymphocytes by autologous dendritic cells………………………………………….….93
6.10. Measurement of ROS production in whole blood……………………….……….93
6.11. In vitro yeast phagocytosis assays………………………………………………..94
6.11.1. Determination of percent phagocytic cells and phagocytic index……………...94
6.11.2. Effect of blocking antibodies on yeast phagocytosis…………………………...95
6.12. Whole blood assay…………………………………………………………..……95
6.13. In vitro antigen presentation assay……………………………………………….96
6.14. Immunization of OT-I mice…………………………………………………..…..97
6.15. Analysis of cellular immune responses in lymph nodes and spleen cells from immunized OT-I transgenic mice…………………………….....97
IV. Results......................................................................................................................99
1. Effects of different yeast genera on maturation and activation of human immature DCs..........................................................................99
1.1. Maturation of human DCs by diverse yeast genera..................................................99
1.2. Cytokine detection in DC culture supernatants......................................................104
2. Fungal cell wall staining............................................................................................111
3. Uptake of different yeast genera by mammalian phagocytic cells............................116
3.1. Uptake of whole yeast cells by IC-21 murine macrophages..................................116
3.1.1. Role of Dectin-1 on yeast uptake by IC-21 murine macrophages………...……119
3.2. Uptake of whole yeast cells by human dendritic cells............................................120
3.2.1. Involvement of Dectin-1 and mannose receptor in yeast uptake……….………122
4. Recombinant expression of model antigens in different yeast genera………..……123
4.1. Heterologous expression of Ova-derivatives in yeast……………………………124
4.1.1. Construction of yeast expression vectors for heterologous expression of Ova variants……………………………………….…124
4.1.2. Analysis of recombinant expression of Ovacyt by different yeast genera………126
4.1.3. Analysis of Ova secretion by different yeast genera…………………………...129
Contents
4.1.3.1. Ova secretion in a phagolysosome-like milieu…………….…………………131
4.1.4. Recombinant expression of Ovacyt on yeast cell walls as Sed1p-fusions………132
4.2. The HCMV pp65 tegument protein as model antigen………………………...…135
4.2.1. Construction of yeast expression vectors for recombinant expression of pp65..135
4.2.2. Intracellular pp65 expression by different yeast genera………………………..137
4.2.3. Pp65 secretion by different yeast genera…………………………………….....139
4.3. Cloning and expression of Gag-fusions in S. cerevisiae……………………..…..140
4.3.1. Cloning and expression of Gag/Ovacyt in S. cerevisiae….……………………..141
4.3.2. Cloning and expression of Gag/pp65 in S. cerevisiae….………………………144
5. Activation of antigen-specific T cells after delivery of recombinant yeasts……….146
5.1. Influence of antigen location on activation of Ova-specific CD8 T cells………..146
5.2. Activation of pp65-specific memory T lymphocytes from HCMV-positive donors in an autologous system……………………………….148
5.3. Activation of pp65-specific T lymphocytes in whole blood assay………….……150
6. Effect of heat treatment on β-glucan exposure on yeast cell walls...........................154
6.1. Production of reactive oxygen species in whole blood after incubation with yeasts…………………………………..…………157
7. Stimulation of CD8+ transgenic cells from OT-I mice after vaccination………..…160
V. Discussion................................................................................................................163
1. Yeasts induce DC maturation and cytokine secretion…………………………..….164
2. Staining of yeast cell wall components………………………………………….…169
3. Interaction patterns between yeasts and mammalian phagocytic cells……………..172
4. Expression and delivery of different Ova variants by yeasts………………………174
5. Expression of pp65 by different yeast strains and activation of pp65-specific memory T lymphocytes in HCMV-seropositive donors…………….…178
6. Effect of heat treatment of yeast on β-glucan exposure and ROS production in wholeblood…………………………………….…..183
7. Immunization of OT-I transgenic mice with whole recombinant yeasts…………...185
8. Perspectives…………………………………………………………………….…..187
VI. Summary................................................................................................................189
VII. References.............................................................................................................190
VIII. Acknowledgements.............................................................................................226
Introduction
12
I. INTRODUCTION
1. The immune system – a short overview
The immune system consists of a set of molecules, cells, tissues, and organs that work
together to provide protection against foreign organisms. The initial phases of the host
defense against infection depend on the mechanisms of innate immunity. It comprises
epithelial barriers, phagocytic cells (dendritic cells (DCs), macrophages), soluble
factors, such as complement proteins, granulocytes (basophils, eosinophils and
neutrophils), mast cells, natural killer cells, and cytokines that coordinate the functions
of the cells of the innate immunity. The innate immunity is always present in all
individuals, reacts rapidly and equally to repeated infections (without developing an
immunologic memory with repeated exposure to a given pathogen), and is able to
distinguish between a group of related pathogens. Adaptive immunity is a response to
antigen mediated by CD4+ and CD8+ T lymphocytes and B lymphocytes. Adaptive
immune responses develop more slowly and are characterized by specificity for distinct
molecules and development of immunological memory, which is the capability of
responding more vigorously to repeated exposure to the same antigen (Janeway et al.,
2001; Abbas et al., 2007).
Adaptive immunity can be divided into humoral and cell-mediated immune
responses, which have different mediators and functions. In the humoral immunity,
antibodies produced by B lymphocytes recognize microbial antigens and contribute to
immunity in three main mechanisms: (i) neutralization, i.e. preventing pathogens from
entering cells; (ii) opsonization, in which antibodies coat the pathogen surface
promoting particle phagocytosis via recognition of a portion of the antibody (Fc) by a
Fc receptor in the phagocytic cell; and (iii) complement activation, which results in
binding of complement proteins to the microbe, promoting either enhanced
opsonization, recruitment of phagocytes to the site of infection, or microbe lysis via
pore formation. Cell-mediated immunity involves the action of T lymphocytes, which
induce destruction of pathogens residing in phagocytic cells or killing of infected cells.
T lymphocytes comprise functionally different subpopulations such as helper T cells,
cytotoxic T lymphocytes (CTLs) and regulatory T cells. Helper T cells, upon antigenic
stimulation, produce cytokines that promote the proliferation and differentiation of T
cells and activate, among other cell types, macrophages and B lymphocytes. CTLs kill
Introduction
13
cells displaying foreign antigens, such as cells infected with virus or intracellular
pathogens. Regulatory T cells are mainly involved in inhibiting immune responses
(Janeway et al., 2001; Abbas et al., 2007).
Protective immunity against a specific pathogen can be elicited upon exposure to
the microbe, in a process called active immunization, or by transferring serum or
lymphocytes from an immunized host without any contact of the recipient with the
antigen, a process named passive immunization (Abbas et al., 2007).
1.1. Antigen recognition and presentation to T lymphocytes
Antigen-presenting cells
Antigen-presenting cells (APCs) are specialized elements which take up and display
antigens to T cells. DCs, macrophages and B cells are called professional APCs, since
they express MHC molecules and co-stimulators. However, DCs are considered the
most effective APCs as they are the only cell type which can stimulate naïve T cells
and, consequently, initiate T cell responses (Abbas et al., 2007).
DCs comprise a heterogeneous cell population derived from bone marrow
precursors and are widely distributed, in an immature state, into lymphoid and
nonlymphoid tissues. In peripheral tissues, immature DCs sense and capture microbes
and other antigens. After engagement of antigens with receptors, as well as detection of
pro-inflammatory cytokines, DCs migrate to lymph nodes and undergo maturation.
Maturation is characterized by reduced ability in internalizing antigens but increased
antigen presentation capacity. Furthermore, MHC class II molecules are redistributed
from intracellular compartments to the cell surface, and the expression of costimulatory
molecules (such as CD80, CD86), MHC class I, and T cell adhesion molecules (e.g.
CD58) is upregulated. DCs also adjust their profile of chemokine receptors that enable
homing to lymphoid organs. Besides, the cells show “dendritic” projections, which
enable a large contact surface to the surroundings and may enhance the odds for T cell
interaction. In lymphoid organs, mature DCs stimulate naïve T cells priming immune
responses. DCs are able to elicit distinct types of T cell responses, depending on their
lineage, maturation status and activation signals (Huang et al., 2001; Liu et al., 2001;
Mellman and Steinman, 2001; Guermonprez et al., 2002; Reis e Sousa, 2006).
Immature DCs and macrophages can internalize antigens by distinct
mechanisms. Antigen capture via receptor-mediated endocytosis enables efficient
Introduction
14
antigen delivery to the processing compartment. Antigens that do not associate with cell
surface receptors can be internalized by fluid phase pinocytosis and presented by APCs,
although with lower efficiency. Fluid phase uptake can happen through different means:
(i) micropinocytosis, in which clathrin-coated pits invaginate to form small vesicles (<
0.1 μm). Soluble proteins that enter the vesicles associate with receptors in the coated
pit, being further trafficked to lysosomes and degraded; and (ii) macropinocytosis, in
which small particles enter larger vesicles (0.5-3 μm) formed at sites of membrane
ruffling mediated by the actin cytoskeleton. Micropinocytosis is a constitutive process
which occurs in nearly all cells, whereas macropinocytosis is restricted to distinct cell
types (APCs), for example macrophages and immature DCs (Sallusto et al., 1995,
Steinman and Swanson, 1995, Lam et al., 2007).
In phagocytosis, particles larger than 1.0 µm are internalized in a receptor
triggered, actin-based mechanism which involves membrane extension or addition in
order to create an intracellular acidified compartment (Morrissette et al., 1999). After
internalization, phagosomes undergo maturation by a sequence of fission and fusion
events with components of the endocytic pathway, resulting in mature phagolysosomes
(Aderem and Underhill, 1999).
A number of surface receptors has been reported to recognize pathogen-
associated molecular patterns (PAMPs) present on microorganisms. These so-called
pattern-recognition receptors (PRRs) recognize, among others, bacterial
liposaccharides, unmethylated CpG motifs of bacterial DNA, viral double-stranded
RNA, β-glucans, chitin, mannans, and fungal nucleic acids. PAMPs are highly
conserved structures, since they are indispensable for the survival of the
microorganisms. Recognition by PRRs results in microbial ingestion and killing through
respiratory burst, among other mechanisms. PRRs activate signaling pathways,
stimulating several cellular responses, such as cytokine and chemokine production, and
therefore connect innate and adaptive immunity (Figdor et al., 2002; Tsoni and Brown,
2008; Brown, 2011; Romani, 2011). A broad variety of PRRs help in the identification
of potential pathogens, for example Toll-like receptors (TLRs), C-type lectin receptors
(CLRs), integrins, or scavenger receptors (Brown, 2011). The observation that
glycosylated protein antigens are more efficiently internalized than nonglycosylated
ones indicates that CLRs are abundantly expressed in DCs (Yokota et al., 2001; Figdor
et al., 2002). Macropinocytosis and mannose receptor-mediated endocytosis lead to
antigen delivery to MHC class II-containing compartments, but particles engulfed via
Introduction
15
mannose receptors are considerably more effective at increasing T cell proliferation
(Tan et al., 1997; Lam et al., 2005).
Antigen processing and presentation
Antigen peptides recognized by T cells are displayed by specialized glycoproteins that
are encoded by genes of the major histocompatibility complex (MHC), which fall into
two classes, I and II. MHC classes I and II molecules exhibit different structures,
functions and distribution patterns among cells. Each MHC molecule can associate with
a broad variety of peptide antigens, enabling the formation of diverse peptide-MHC
complexes. Therefore, the immune system can specifically react to a large diversity of
challenges (Madden, 1995; Klein and Sato, 2000; Janeway et al., 2001; Abbas et al.,
2007).
Basically, MHC molecules consist of a peptide-binding groove, an IgG-like
region, a transmembrane domain, and a cytoplasmic region (Abbas et al., 2007). MHC
class I molecules consist of two polypeptide chains, a heavy chain (α chain) which
spans the membrane, and the non-covalently attached β2-microglobulin (β2m; Bjorkman
et al., 1987). These molecules are expressed by almost all nucleated cells, but the
expression level varies according to the tissue. In contrast, MHC class II molecules are
generally found on a subgroup of immune cells, such as DCs, macrophages, B
lymphocytes, thymic epithelial cells (Klein and Sato, 2000). MHC class II molecules
are composed of two transmembrane polypeptide chains, α and β, which are
noncovalenty associated (Janeway et al., 2001).
In order to enable proper T cell recognition, MHC molecules must be capable of
retaining the bound peptide for a sufficient time period. Even though such interaction
normally requires high specificity, peptide-MHC binding is both stable and
promiscuous (Madden, 1995).
Generally, MHC class I molecules present peptides derived from degraded
proteins synthesized by the cell or entering the cytosol, such as tumor antigens or
proteins encoded by intracellular pathogens. Since MHC class I is expressed by the
majority of cells, these can be inspected by circulating CD8+ cytotoxic T cells for
potential infection or improper protein expression. Cellular proteins are degraded in the
cytosol, essentially by the proteasome, and the resulting peptides are translocated by
TAP (transporter associated with antigen processing) into the lumen of the endoplasmic
reticulum (ER), where an aminopeptidase trims the peptides down to a length of 8-10
Introduction
16
amino acids for association with class I molecules. After this association, the MHC
class I molecule completes its folding and the peptide-MHC I complex leaves the ER,
being transported via Golgi apparatus to the cell surface, where it can interact with
CD8+ T cells (Germain and Margulies, 1993; Ackerman and Cresswell, 2004; Cresswell
et al., 2005).
Exogenous proteins acquired by endocytosis or from internalized plasma
membrane proteins are degraded within acidified vesicular compartments, giving rise to
peptides that can associate with MHC class II molecules. MHC II molecules are
expressed mainly by B cells, DCs, and monocytes/macrophages. MHC II molecules
assemble as αβ heterodimers in the ER and associate with an invariant chain (Ii),
preventing the binding of ER peptides. An Ii peptide called CLIP (class II-associated
invariant-chain peptide) occupies the peptide-binding groove. Further, in MHC class II-
containing compartments, Ii undergoes degradation and CLIP is removed afterwards so
that a high-affinity peptide can bind (reviewed by Rocha and Neefjes, 2008). Peptide-
MHC-II complexes travel to the cell surface and interact with specific CD4+ T cells.
Peptides generated from degradation of internalized exogenous antigens normally do
not bind to MHC class I molecules, preventing that CTL lyse normal cells which may
have engulfed antigens from tumor or virus-infected cells (Harding and Geuze, 1992;
Germain and Margulies, 1993; Rodriguez et al., 1999; Ackerman and Cresswell, 2004).
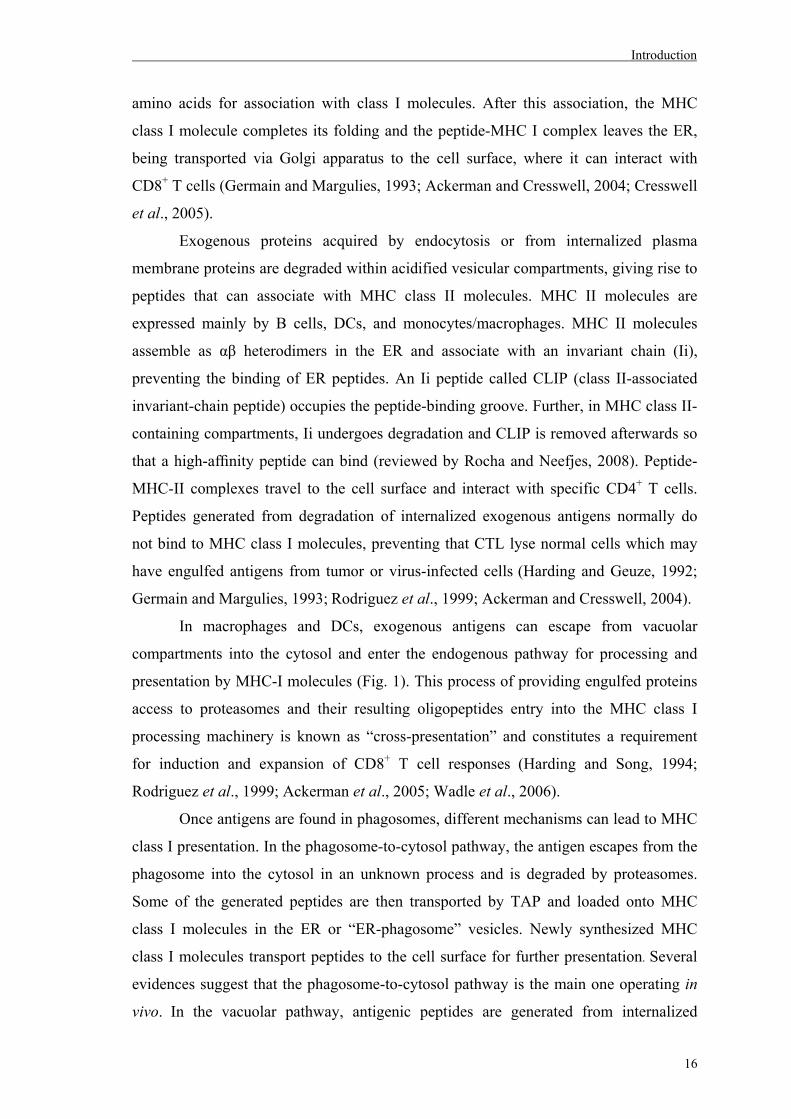
In macrophages and DCs, exogenous antigens can escape from vacuolar
compartments into the cytosol and enter the endogenous pathway for processing and
presentation by MHC-I molecules (Fig. 1). This process of providing engulfed proteins
access to proteasomes and their resulting oligopeptides entry into the MHC class I
processing machinery is known as “cross-presentation” and constitutes a requirement
for induction and expansion of CD8+ T cell responses (Harding and Song, 1994;
Rodriguez et al., 1999; Ackerman et al., 2005; Wadle et al., 2006).
Once antigens are found in phagosomes, different mechanisms can lead to MHC
class I presentation. In the phagosome-to-cytosol pathway, the antigen escapes from the
phagosome into the cytosol in an unknown process and is degraded by proteasomes.
Some of the generated peptides are then transported by TAP and loaded onto MHC
class I molecules in the ER or “ER-phagosome” vesicles. Newly synthesized MHC
class I molecules transport peptides to the cell surface for further presentation. Several
evidences suggest that the phagosome-to-cytosol pathway is the main one operating in
vivo. In the vacuolar pathway, antigenic peptides are generated from internalized
Introduction
17
antigens hydrolysed by proteases in the phagosome and then associate with recycling
MHC class I molecules. A third mechanism has been proposed, the “endosome to ER
pathway”, which would explain the cross-presentation of soluble proteins. It has been
reported that some exogenous soluble proteins can be internalized by DCs and
transported into the ER. Since proteins in the ER can gain access to the cytosol for
degradation by the ER-associated degradation pathway (ERAD), this mechanism would
elucidate the phenomenon of cross-presentation of soluble proteins (reviewed by Rock
2003; Rock and Shen, 2005).
The process of exogenous antigen capture by APCs, processing into the MHC
class I presentation pathway, and subsequently priming of CTL is termed ‘cross-
priming’ (Heath and Carbone, 2001). Cross-priming is considered to be inefficient, but
it has been postulated that dendritic cells cross-prime CD8+ T cells with more efficiency
than other APCs. Furthermore, particulate antigens elicit, in general, more efficient
cross-priming than their soluble counterparts. Cross-presentation is desirable in vaccine
approaches based on proteins that aim at the generation of CD8+ T cell responses.
Therefore, numerous attempts to enhance the effectiveness of this process have been
made in the field of vaccine development (Maecker et al., 2001).
Fig. 1. Antigen-processing pathways. Simplified mechanisms for presentation of peptides associated with MHC I or MHC II molecules are shown. From Heath and Carbone, 2001.
Introduction
18
T lymphocytes
Naïve T cells are inexperienced cells that have not encountered an antigen. In lymphoid
tissues, T cells interact with APCs in a process mediated by adhesion molecules such as
CD54 and CD58 on the APC and LFA-1 and CD2 on the T cell. This enables T cells to
sample MHC molecules for the presence of a certain peptide. After binding of the T cell
receptor (TCR) and the co-receptor (CD4 or CD8) to a peptide-MHC complex and co-
stimulation, the T cell becomes activated and can proliferate and differentiate. Most of
the T cells that undergo proliferation differentiate into effector T cells, others can
differentiate into memory cells. Among the effector T cell population, the majority of
the cells undergo apoptosis after antigens have been cleared, while others become long-
lived memory T cells (Abbas et al., 2007; Janeway et al., 2001).
Naïve CD4 T cells can differentiate into distinct cytokine-producing subsets
with different immuneregulatory functions. Effector CD4+ T helper (TH) cells have been
divided into some lineages, including TH1, TH2, and TH17 cells. Development of a
specific TH subset is determined by various stimuli, such as the characteristic of the
peptide-MHC ligand, the costimulatory molecules involved and cytokines. In addition
to ligation of the TCR and costimulatory receptors (as described before), IFN-γ and IL-
12 are the main inducers of TH1-cell differentiation and IL-4 triggers TH2-cell
differentiation. TH17 differentiation is stimulated by TGF-β, IL-6, IL-1, and possibly
other pro-inflammatory cytokines (Janeway et al., 2001; Dong, 2006; Abbas et al.,
2007). Other TH subsets have been described in the past few years, such as TH9, TH22,
and TFH (follicular helper T cells), but this theme is beyond the scope of the present
work.
Infections by intracellular bacteria and some parasites as well as by viruses
induce reactions of the innate immune system that are involved in the production of IL-
12, IL-18 and type I interferons. IL-12 is the main cytokine involved in TH1-cell
differentiation. TH1 cells produce characteristic cytokines, especially IL-2 and IFN-γ,
driving the development of strong cell-mediated immunity, most notably in combating
intracellular pathogens. IFN-γ activates macrophages, elicits intracellular killing of
microorganisms by phagocytes and stimulates B cells to produce opsonising and
complement-fixing IgG antibodies. Additionally, IFN-γ induces further TH1
differentiation and inhibits TH2-cell proliferation (Janeway et al., 2001; Farrar et al.,
2002; Dong, 2006; Abbas et al., 2007).
Introduction
19
TH2 differentiation is driven by chronic T cell stimulation, which can be
triggered by allergens or helminths, for example. TH2 cells produce a set of cytokines,
such as IL-4, IL-5, and IL-13, mediating allergic responses and humoral immunity. IL-4
stimulates B cells to produce neutralizing antibodies; IL-4 and IL-13 induce the
production of IgE antibodies against helminths and also activate macrophages to
express mannose receptors (alternative macrophage activation); IL-5 activates
eosinophils in the neighbourhood of helminths. Mast cells are activated by IgE-
opsonized helminths, leading to degranulation. IL-4 and IL-10 inhibit TH1-cell
differentiation (Farrar et al., 2002; Dong, 2006; Abbas et al., 2007).
TH17 cells produce IL-17, a regulator of inflammatory responses, and may be
involved in the induction of neutrophil-rich inflammation. TH17-cell differentiation is
induced by TGF-β in combination with IL-1 and IL-6, and inhibited by IL-4 and IFN-γ.
IL-23 is associated with maintenance and survival of the TH17 cell subset (Dong, 2006;
Abbas et al., 2007).
Naïve CD8+ T cells differentiate into CTLs, wich play a crucial role in
combating infections caused by viruses and intracellular pathogens. CTLs kill target
cells which display the same peptide-MHC class I complex that has driven the
proliferation and differentiation of the naïve CD8+ T cells. CTL-mediated killing of
target cells can occur by two main mechanisms and requires direct contact between the
effector and target cells. In one mechanism, cytotoxic proteins such as perforin (a
membrane-disrupting molecule) and granzymes (serine-proteases) are released by
exocytosis, inducing apoptosis of the target cell via activation of cell-death pathways.
Another mechanism involves interaction of surface molecules on the CTLs and the
target cells. The target-cell death receptor Fas binds to Fas ligand (FasL) on CTL,
leading to caspase-dependent apoptosis of target cells. CTLs can also secrete cytokines
such as IFN-γ, TNF-α, and TNF-β. IFN-γ, among other functions, restrains viral
replication, promotes increased MHC class I expression in infected cells, recruits
macrophages to the site of infection and can act synergistically with TNF-α or TNF-β,
for instance, in macrophage activation (Janeway et al., 2001; Trapani and Smyth, 2002;
Abbas et al., 2007).
Memory T cells
After clearance of an infection by means of T-cell mediated immunity, part of the
population of T cells specific for a given antigen remains for years or for the whole life
Introduction
20
and ensures protection upon reinfection. These memory T cells respond quickly and in
an amplified manner if they reencounter the same antigen. However, memory T cells
might also be maintained in the presence of antigen, for example in some infections
such as those caused by cytomegalovirus. In this case, the immune responses result in
control of pathogen growth but not complete eradication (Rocha and Tanchot, 2004;
Abbas et al., 2007; Gerlach et al., 2011).
Memory T cells can be generated at distinct stages of T cell differentiation. Both
maintenance and survival of memory CD4+ and CD8+ T cells depends on certain
cytokines, such as IL-7 which promotes low-level proliferation of memory T cells. IL-
15 is also necessary for maintenance of memory CD8+ T cells (Abbas et al., 2007).
Depending on their effector functions and homing characteristics, CD4+ and
CD8+ memory T cells can be divided into central memory and effector memory T cells.
Central memory T cells, which express CCR7 and CD62L, home to lymph nodes and
proliferate quickly, expanding the effector lymphocyte population after reencountering
an antigen. Effector memory T cells home to peripheral tissues and secrete effector
cytokines such as IFN-γ upon antigen re-exposure, combating invading microbes at the
site of infection. Development of vaccine approaches aiming at the induction of both
sets of memory cells is highly desirable, particularly against persistent or chronic
pathogens (Esser, 2003; Abbas et al., 2007).
T cell activation
Activation of naïve T cells by APCs requires distinct independent signals which further
dictate the T cell fate. In the lymph node, the first signal for T cell activation implies
interaction of the TCR with a specific MHC-peptide complex on the APC. It is antigen-
specific and makes the T cell enter the cell cycle; the TCR is then internalized and
degraded. The second signal is provided by the interaction of costimulatory molecules
on the surface of professional APCs with their ligands on T cells. A number of
molecules on APCs have been described to provide the costimulatory signals for T-cell
activation. For example, CD80/CD86 (B7.1/B7.2), the main costimulatory molecules,
bind CD28 on T cells; CD54 (intercellular adhesion molecule-1, ICAM-1) on APCs
binds to LFA-1; CD58 (leukocyte function-associated antigen-3, LFA-3) associates
with CD2 on T cells. Interaction between CD40 on APCs and CD40L on T cells is also
important during co-stimulation as it further activates the APC to express CD80/86.
Signal 2 promotes the synthesis of IL-2 by the T cell which drives clonal expansion of
Introduction
21
antigen-specific T cells. TCR binding in the absence of co-stimulation leads to either
apoptosis or anergy. A third step involved in T cell activation is provided by signals
delivered by the APCs to T cells, such as cytokines (either pro- or anti-inflammatory),
driving T cell differentiation into effector cells. According to the activation status of the
APC, a particular cytokine profile dictates which type of T cell response is to be primed.
This concept for T cell activation has played an important role in the elucidation of the
mechanisms involved in discrimination between self and nonself antigens (Hodge et al.,
2000; Alegre et al., 2001; Coyle and Gutierrez-Ramos, 2001; Janeway et al., 2001; Reis
e Sousa, 2006; Mays and Wilson, 2011).
In situations that usually generate weak innate immune reactions, such as latent
viral infections, tumors, and organ transplants, TH cells may be required for inducing
complete activation of naïve CD8+ T lymphocytes and differentiation into CTLs.
Importantly, this process is only effective if both TH and CD8+ T cells recognize antigen
on the same APC. Activation of CD8+ T cells by TH cells can occur by distinct
mechanisms. In one pathway, TH cells secrete specific cytokines upon antigen
recognition that further promote CD8+ T cell differentiation, such as IL-2. Another
mechanism implicates activation of APCs by antigen-stimulated CD4+ TH cells via
CD40-CD40L. Activated APCs subsequently express cytokines and costimulatory
molecules, resulting in stimulation of CTL development. CD40 signaling seems to be
unique in the ability to induce the generation of memory CTLs (Clarke, 2000; Abbas et
al., 2007).
2. Recombinant yeasts in biotechnological approaches
In the past decades, the choice of a single yeast species as host for the expression of
recombinant proteins relied heavily on the baker’s yeast S. cerevisiae. This dependence
is nowadays circumvented by a set of nonconventional yeasts which have become
available as expression systems for a wide range of recombinant proteins (Gellissen and
Hollenberg, 1997; Müller et al., 1998). The spectrum of yeasts as organisms for the
expression of heterologous gene products includes, among others, the fission yeast
Schizosaccharomyces pombe (Giga-Hama et al., 1994; Tohda et al., 1994), the
methylotrophic yeast Pichia pastoris (Tschopp et al., 1987; Sreekrishna et al., 1989),
and the budding yeast Kluyveromyces lactis (Das and Hollenberg, 1982).
Introduction
22
The use of recombinant yeasts as vaccine strategy has become a very attractive
means for the induction of robust immune responses. Yeast is a versatile eukaryotic
microorganism as it can be easily engineered, grows rapidly to high cell densities in
inexpensive culture media and properly performs post-translational processing of the
expressed proteins (Valenzuela et al., 1982; Smith et al., 1985). This latter ability is
especially advantageous in immunotherapy because the expressed antigens can be
recognized by the host as native antigens, thus contributing to the generation of more
efficient immune responses (Bucarey et al., 2009).
Saccharomyces cerevisiae
S. cerevisiae has been used for thousands of years for fermenting food and beverages
and is considered a GRAS (generally recognized as safe) organism (Gellisen and
Hollenberg, 1997; Sicard and Legras, 2011). This yeast has been extensively studied in
the past decades, and the vast knowledge about its genetics, biochemistry, physiology,
and fermentation properties makes this yeast species the best characterized until today
(Gellisen and Hollenberg, 1997; Porro et al., 2005). Its genome has been completely
sequenced, revealing almost 6,000 ORFs distributed in 16 chromosomes and 12 Mb
(Goffeau et al., 1996). For all these reasons, S. cerevisiae has become the organism of
choice for the expression of the majority of recombinant proteins.
However, S. cerevisiae has been reported to have some disadvantage as host for
recombinant protein production. Low yields of heterologous proteins, plasmid
instability, retention of the products within the periplasmic space, and
hyperglycosylation have been repeatedly observed (Müller et al., 1998; Porro et al.,
2005). Hyperglycosylation in S. cerevisiae can hinder protein folding. Glycoproteins
with 50–150 mannose residues have been described in S. cerevisiae. Furthermore, this
budding yeast adds outer α-1,3-linked mannose residues to its N-glycans, which is
considered allergenic in humans and thus prevents the pharmaceutical use of some
proteins expressed in S. cerevisiae (Varki et al., 2009).
Kluyveromyces lactis
K. lactis is one of the most important non-Saccharomyces yeasts in biotechnology. This
yeast has been used as a source of lactase. Enzymes produced in K. lactis have GRAS
status, so that they can be used in several food and feed applications (Dominguez et al.,
1998; van Ooyen et al., 2006). K. lactis can grow on media containing lactose as sole
Introduction
23
energy and carbon source and, under this condition, the enzymes involved in the lactose
utilization pathway are strongly induced. A β-galactosidase encoded by the lac4 gene
metabolizes lactose to glucose and galactose. With the establishment of a
transformation technique for K. lactis (Das and Hollenberg, 1982), the strong inducible
LAC4 promoter turned out to be a widely used element in recombinant protein
expression. K. lactis can grow to very high cell densities and a large number of proteins
from diverse sources have been successfully expressed in this organism (Gellissen and
Hollenberg, 1997; Colussi and Taron, 2005; van Ooyen et al., 2006). The K. lactis
genome is 10.6 Mb in size, organized into 6 chromosomes and more than 5,300 coding
sequences (Dujon et al., 2004).
Schizosaccharomyces pombe
The fission yeast Sz. pombe was discovered in 1893 by P. Lindner. The name “pombe”
comes from the Swahili word for beer, since it was first isolated in millet beer from
eastern Africa (Wixon, 2002). This rod-shaped yeast grows by increasing length but
constant diameter and divides by medial fission, generating equal-sized daughter cells.
Although Sz. pombe is evolutionarily distant from common ascomycetes such as S.
cerevisiae, it is nowadays also widely used for genetic manipulations (Wixon, 2002;
Forsburg and Rhind, 2006; Varki et al., 2009). Sz. pombe has a fully-sequenced 13.8
Mb genome, with 3 chromosomes and approximately 4,800 ORFs (Wood et al., 2002).
A number of plasmids containing Sz. pombe-specific elements has been developed for
recombinant protein production (Giga-Hama et al., 1994; Tohda et al., 1994). The cell
wall of Sz. pombe differs from the one of S. cerevisiae in terms of carbohydrate
composition, for example due to the presence of galactomannan and alkali-soluble α-
1,3-glucan (Kopecká et al., 1995; Varki et al., 2009).
Pichia pastoris
P. pastoris is a nonpathogenic microorganism capable of utilizing methanol as sole
carbon source. It was discovered in 1969 in a screen for yeasts able to use methanol. P.
pastoris can grow to extremely high cell densities in minimal media (Varki et al., 2009).
In peroxisomes, methanol is converted to formaldehyde by the alcohol oxidase (AOX)
in a reaction in which oxygen is simultaneously reduced to hydrogen peroxide. The
formaldehyde leaves the peroxisome and is oxidized in a series of reactions to carbon
dioxide and water (Ellis et al., 1985). The major enzymes involved in methanol
Introduction
24
metabolism can comprise up to 30% of the total intracellular protein content in cells
cultivated in methanol-containing media. The genes coding for these enzymes are
regulated by strong inducible promoters, which can be used for expression of
heterologous genes, such as the methanol-inducible AOX promoter. The Pichia genome
contains the two alcohol oxidase genes, aox1 and aox2, which are highly homologous
(Koutz et al., 1989).
After the establishment of transformation methods, high-yield systems were
developed for recombinant protein production. Moreover, Pichia secretes relatively low
levels of endogenous proteins, facilitating purification of secreted recombinant proteins.
The fact that N-glycosylated proteins produced in P. pastoris contain only 5–15
mannose residues and that this yeast does not add outer α-1,3-linked mannose residues
to its N-glycans, makes P. pastoris one of the most efficient yeasts for biotechnological
applications (Varki et al., 2009). The P. pastoris expression system has been
extensively used for production of several recombinant proteins, impressing not only
due to the expression levels that can be attained, but also by virtue of the bioactivity of
the heterologous proteins (Gellissen and Hollenberg, 1997; Macauley-Patrick et al.,
2005). The genomes of some P. pastoris strains have been sequenced (De Schutter et
al., 2009; Mattanovich et al., 2009; Küberl et al., 2011), for instance, the 9.43 Mb-
genome of the GS115 strain, with 5,313 protein-coding genes distributed in 4
chromosomes (De Schutter et al., 2009).
2.1. Yeasts and the immune system
Immune recognition of fungi mostly depends on the interaction of receptors at the
surface of the phagocytic cells with structural components of the fungal cell wall. In
general, yeast cell walls consist of an outer layer of mannosylated proteins and an inner
layer of β-glucans and chitin. However, β-glucans may be permanently exposed at the
surface in specific regions, which is sufficient for Dectin-1 sensing. The cell wall
composition in fungi is species- and morphology-dependent. In addition, the cell wall
represents a highly dynamic structure which is considerably remodeled during the
particular yeast life cycle (Gantner et al., 2005; Brown, 2011).
Recognition of fungal particles relies on diverse PRRs including lectin receptors
such as mannose receptor (MR) and Dectin-1, Toll-like receptors (TLRs), scavenger
receptors, as well as integrins, like the complement receptor type 3 (CR3). The
Introduction
25
distribution of these receptors for sensing of potential pathogens depends on the cell
type (Brown, 2011).
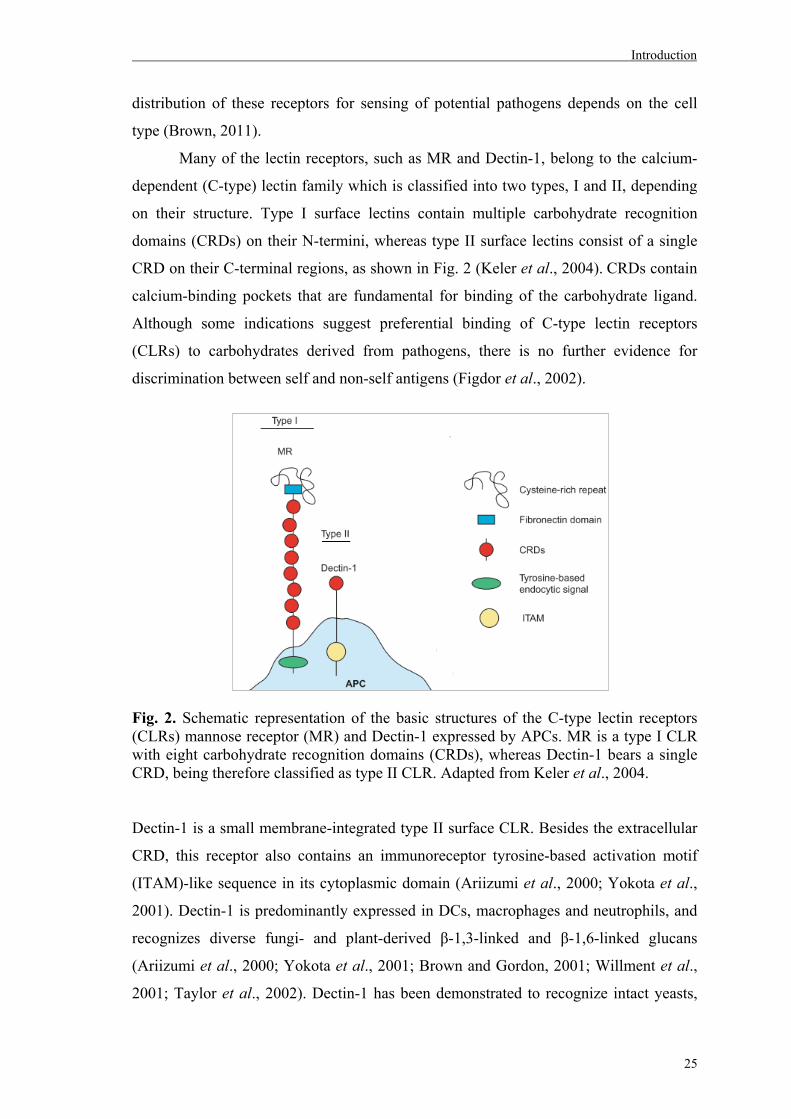
Many of the lectin receptors, such as MR and Dectin-1, belong to the calcium-
dependent (C-type) lectin family which is classified into two types, I and II, depending
on their structure. Type I surface lectins contain multiple carbohydrate recognition
domains (CRDs) on their N-termini, whereas type II surface lectins consist of a single
CRD on their C-terminal regions, as shown in Fig. 2 (Keler et al., 2004). CRDs contain
calcium-binding pockets that are fundamental for binding of the carbohydrate ligand.
Although some indications suggest preferential binding of C-type lectin receptors
(CLRs) to carbohydrates derived from pathogens, there is no further evidence for
discrimination between self and non-self antigens (Figdor et al., 2002).
Fig. 2. Schematic representation of the basic structures of the C-type lectin receptors (CLRs) mannose receptor (MR) and Dectin-1 expressed by APCs. MR is a type I CLR with eight carbohydrate recognition domains (CRDs), whereas Dectin-1 bears a single CRD, being therefore classified as type II CLR. Adapted from Keler et al., 2004. Dectin-1 is a small membrane-integrated type II surface CLR. Besides the extracellular
CRD, this receptor also contains an immunoreceptor tyrosine-based activation motif
(ITAM)-like sequence in its cytoplasmic domain (Ariizumi et al., 2000; Yokota et al.,
2001). Dectin-1 is predominantly expressed in DCs, macrophages and neutrophils, and
recognizes diverse fungi- and plant-derived β-1,3-linked and β-1,6-linked glucans
(Ariizumi et al., 2000; Yokota et al., 2001; Brown and Gordon, 2001; Willment et al.,
2001; Taylor et al., 2002). Dectin-1 has been demonstrated to recognize intact yeasts,
Introduction
26
including Candida albicans, S. cerevisiae, and Pneumocystis carinii (Brown and
Gordon, 2001; Steele et al., 2003; Gantner et al., 2005).
Dectin-1 induces phagocytosis, killing via production of reactive oxygen
species, and the expression of chemokines and cytokines including IL-1β, IL-2, IL-10,
IL-12, and TNF-α (Brown et al., 2003; Gantner et al., 2003; Steele et al., 2003;
Underhill et al., 2005; Brown, 2006). These events result from activation of intracellular
signaling pathways, the Syk (spleen tyrosine kinase)-CARD9 (caspase recruitment
domain-containing protein 9) pathway, and the Raf-1 kinase pathway. Both pathways
act synergistically and are activated through the ITAM-like motif of Dectin-1. Also,
Dectin-1 collaborates with TLRs to modulate cytokine production (Brown, 2011;
Romani, 2011). Dectin-1 recognizes various types of β-1,3-linked and β-1,6-linked
glucans as well as intact yeast cells (Brown and Gordon, 2001).
The mannose receptor (MR, also CD206) is a type I CLR expressed, among
others, on macrophages, DCs, subsets of endothelial cells and myeloid cells. MR
contains eight CRDs, a fibronectin type II repeat domain, a cysteine-rich domain and a
short cytoplasmic tail (Keler et al., 2004; Hollmig et al., 2009; Brown 2011). This
receptor has been shown to specifically bind to mannose, fucose and N-
acetylglucosamine in many fungal species and to mediate subsequent particle
internalization (Avraméas et al., 1996; Ezekowitz et al., 1991; Giaimis et al., 1993;
Mansour et al., 2002). Even though classical signaling motifs are missing in the
cytosolic region of MR, this receptor has been shown to mediate a number of cellular
events, such as NF-κB signaling and cytokine production (e.g. GM-CSF, IL-1β, IL-6
IL-10, IL-12). The majority of the MR molecules is located within the intracellular
endocytic pathway (Hollmig et al., 2009; Brown, 2011). MR has been demonstrated to
recognize several organisms, including C. albicans (Ezekowitz et al., 1990), C.
neoformans (Syme et al., 2002), P. carinii (Ezekowitz et al., 1991), and M. furfur
(Buentke et al., 2000). Furthermore, MR connects innate and adaptive immunity as it
has been demonstrated that selective targeting of an antigen fused to a specific anti-MR
antibody and uptake by the MR on DCs induced MHC-restricted antigen-specific CD4+
and CD8+ T cell responses (Ramakrishna et al., 2004).
TLRs are also capable of recognizing fungal components, such as zymosan (a
derivative of yeast cell walls), O-linked mannans, phospholipomannan and fungal DNA
(Nakamura et al., 2008; Romani, 2011). The TLRs comprise a well-characterized
family of PRRs which contain an extracellular domain for ligand binding and a
Introduction
27
conserved cytoplasmic domain that triggers specific signaling pathways, driving
specific patterns of gene expression and the synthesis of cytokines and chemokines that
activate innate and adaptive immune responses (Brown, 2006; Diebold, 2009; Hollmig
et al., 2009). TLR2, TLR4 and TLR9 are the major TLRs implicated in recognition of
fungal elements (Romani, 2011). The influence of TLRs on phagocytosis of fungal
particles remains unclear but seems to depend on the host cell type, the fungal species
and morphotypes, the route of infection and receptor cooperativity. TLRs have been
shown to facilitate the presentation of fungal-derived antigens by DCs and modulate T
cell responses (Brown, 2006; Romani, 2011).
The complement receptor 3 (CR3, Mac-1) has also been demonstrated to interact
with zymosan and yeasts such as S. cerevisiae (Ross et al., 1985) and C. albicans
(Forsyth et al., 1998). CR3 is a heterodimeric integrin of CD11b (αM) and CD18 (β2)
subunits and recognizes β-glucan, N-acetyl-D-glucosamine, mannose-containing
polysaccharides and glucose via a cation-independent lectin region situated C-terminal
to the I-domain of CD11b (Thornton et al., 1996). CR3 mediates phagocytosis both in a
complement-dependent and -independent manner and is expressed by several cell types,
including DCs, neutrophils, monocytes and macrophages (Ross et al., 1985; Tsoni and
Brown, 2008; van Bruggen et al., 2009). It has been shown that phagocytosis of β-
glucan-bearing particles by human neutrophils is completely CR3 dependent (van
Bruggen et al., 2009).
Several other PRRs have been shown to associate with fungal PAMPs, in a
process which is dependent on the cell type involved and on fungal characteristics such
as species and morphology. The final host immune response to a certain fungus will
depend on distinct factors, like the relative degree of stimulation of each receptor, the
level of receptor cooperativity and cellular localization (Romani, 2011).
It is well established that yeast cell wall components are able to activate the
immune system. For instance, β-1,3-D-glucan and mannan have been demonstrated to
act as natural adjuvants (Suzuki et al., 1989, Toda et al., 1997). Fungal β-glucan has
been shown to possess immunomodulating (acting on both innate and adaptive
immunity) and antitumor activities, which depend on polymer structure, length and
degree of branching. By virtue of their anti-cancer effects, β-glucans have been tested in
pre-clinical and clinical trials (Suzuki et al., 1989; Tsoni and Brown, 2008; Chan et al.,
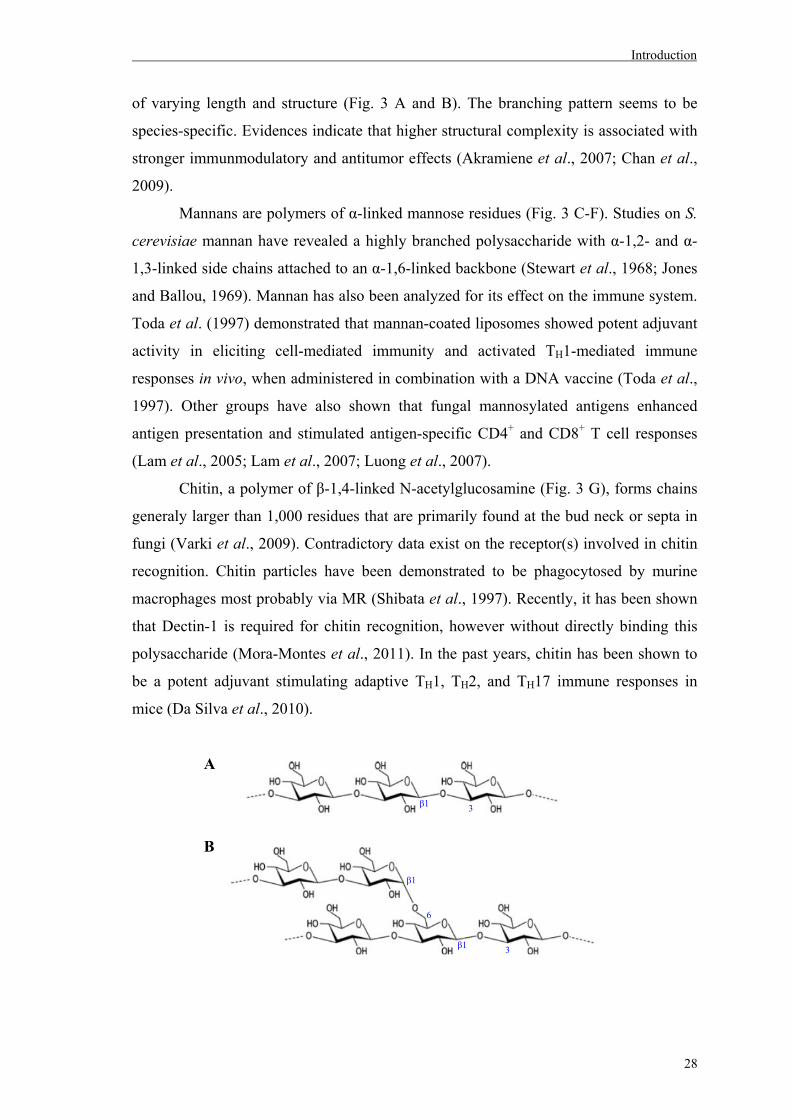
2009; Li et al., 2010). Fungal β-glucans comprise a group of heterogeneous glucose
polymers consisting of a linear 1,3-β-glycosidic chain core with β-1,6-linked branches
Introduction
28
of varying length and structure (Fig. 3 A and B). The branching pattern seems to be
species-specific. Evidences indicate that higher structural complexity is associated with
stronger immunmodulatory and antitumor effects (Akramiene et al., 2007; Chan et al.,
2009).
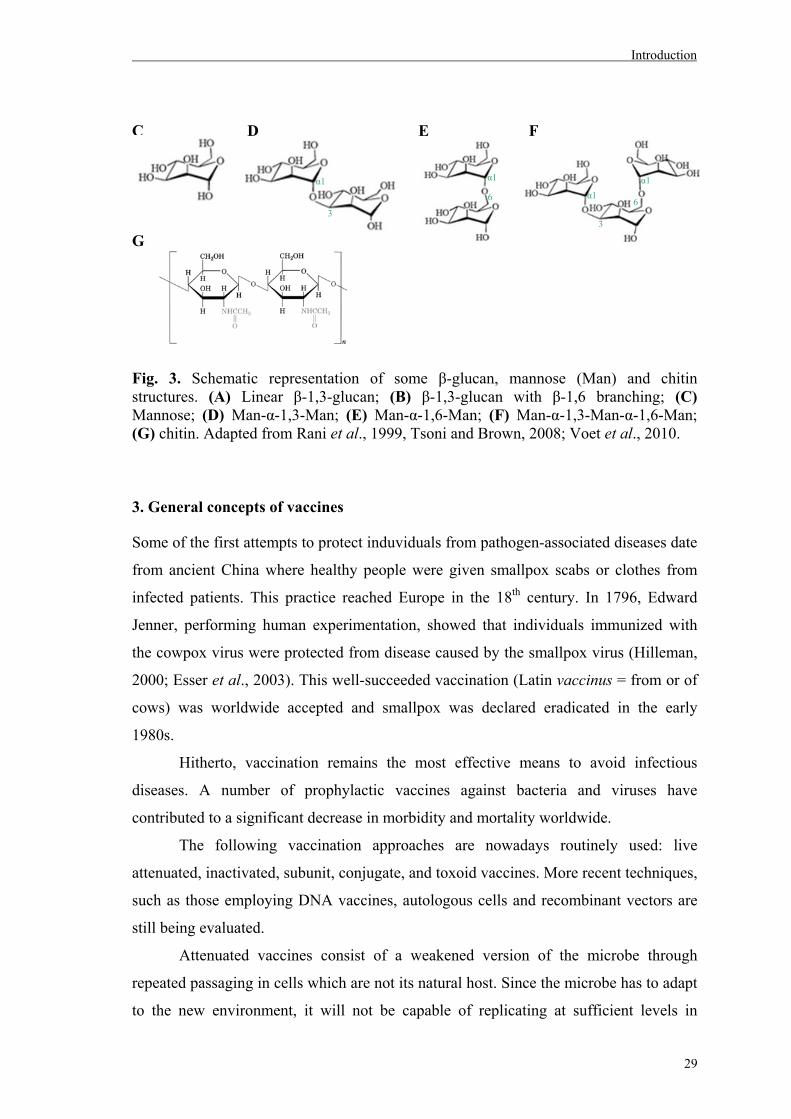
Mannans are polymers of α-linked mannose residues (Fig. 3 C-F). Studies on S.
cerevisiae mannan have revealed a highly branched polysaccharide with α-1,2- and α-
1,3-linked side chains attached to an α-1,6-linked backbone (Stewart et al., 1968; Jones
and Ballou, 1969). Mannan has also been analyzed for its effect on the immune system.
Toda et al. (1997) demonstrated that mannan-coated liposomes showed potent adjuvant
activity in eliciting cell-mediated immunity and activated TH1-mediated immune
responses in vivo, when administered in combination with a DNA vaccine (Toda et al.,
1997). Other groups have also shown that fungal mannosylated antigens enhanced
antigen presentation and stimulated antigen-specific CD4+ and CD8+ T cell responses
(Lam et al., 2005; Lam et al., 2007; Luong et al., 2007).
Chitin, a polymer of β-1,4-linked N-acetylglucosamine (Fig. 3 G), forms chains
generaly larger than 1,000 residues that are primarily found at the bud neck or septa in
fungi (Varki et al., 2009). Contradictory data exist on the receptor(s) involved in chitin
recognition. Chitin particles have been demonstrated to be phagocytosed by murine
macrophages most probably via MR (Shibata et al., 1997). Recently, it has been shown
that Dectin-1 is required for chitin recognition, however without directly binding this
polysaccharide (Mora-Montes et al., 2011). In the past years, chitin has been shown to
be a potent adjuvant stimulating adaptive TH1, TH2, and TH17 immune responses in
mice (Da Silva et al., 2010).
A
B
β1 3
6
β1
3 β1
Introduction
29
C D E F
G
Fig. 3. Schematic representation of some β-glucan, mannose (Man) and chitin structures. (A) Linear β-1,3-glucan; (B) β-1,3-glucan with β-1,6 branching; (C) Mannose; (D) Man-α-1,3-Man; (E) Man-α-1,6-Man; (F) Man-α-1,3-Man-α-1,6-Man; (G) chitin. Adapted from Rani et al., 1999, Tsoni and Brown, 2008; Voet et al., 2010.
3. General concepts of vaccines
Some of the first attempts to protect induviduals from pathogen-associated diseases date
from ancient China where healthy people were given smallpox scabs or clothes from
infected patients. This practice reached Europe in the 18th century. In 1796, Edward
Jenner, performing human experimentation, showed that individuals immunized with
the cowpox virus were protected from disease caused by the smallpox virus (Hilleman,
2000; Esser et al., 2003). This well-succeeded vaccination (Latin vaccinus = from or of
cows) was worldwide accepted and smallpox was declared eradicated in the early
1980s.
Hitherto, vaccination remains the most effective means to avoid infectious
diseases. A number of prophylactic vaccines against bacteria and viruses have
contributed to a significant decrease in morbidity and mortality worldwide.
The following vaccination approaches are nowadays routinely used: live
attenuated, inactivated, subunit, conjugate, and toxoid vaccines. More recent techniques,
such as those employing DNA vaccines, autologous cells and recombinant vectors are
still being evaluated.
Attenuated vaccines consist of a weakened version of the microbe through
repeated passaging in cells which are not its natural host. Since the microbe has to adapt
to the new environment, it will not be capable of replicating at sufficient levels in
α1
3 3
6 6
α1 α1 α1
Introduction
30
humans to cause disease. Classical examples include vaccines against polio, mumps,
measles, rubella and varicella (Cáceres and Sutter, 2001; Hanna et al., 2009).
Inactivated vaccines are obtained by treating a certain pathogen with chemicals,
radiation or heat. The pathogen cannot replicate but remains intact. Vaccines against
hepatitis A and polio are examples of inactivated vaccines (Just and Berger, 1992;
Simizu et al., 2006).
Toxoid vaccines consist of chemically inactivated toxins which are produced by
some bacteria. In this case, the disease is not caused by the microorganism itself but by
the toxin it secretes. Examples are the vaccines against tetanus and diphtheria (Smith,
1969).
Subunit vaccines contain specific antigens from a certain pathogen instead of the
whole microbe. This can be achieved by isolating a protein (or a portion of it) from the
microorganism or by expressing the antigen recombinantly, such as in the case of the
vaccines against hepatitis B virus or human papilomavirus (Poland and Jacobson, 2004;
Barr and Tamms, 2007).
Conjugate vaccines are a type of subunit vaccine, for instance when a
polysaccharide from a bacterial coating is covalently linked to a more immunogenic
proteinaceous antigen in order to elicit stronger immune responses, especially in
immature immune systems. A classical example is the vaccine against Haemophilus
influenzae type B (Ojo et al., 2010).
DNA vaccines resort to plasmids containing pathogen- or tumor-associated
antigens (and additional immunostimulatory factors) under the regulation of an
appropriate eukaryotic promoter. Upon inoculation of the plasmid, the DNA is taken up
by some cells and the specific proteins are synthesized in the cytosol for subsequent
presentation to lymphocytes (Abbas et al., 2007, Eschenburg et al., 2010).
Immunization with autologous cells is used, for example, for combating cancer.
The classical example employs DC-based vaccines, which can be generated by genetic
modification or by loading DCs with tumor-associated antigens or whole dead tumor
cells (Janikashvili et al., 2010).
“Live” vectors are a recent approach for delivering antigens. In general,
attenuated viruses or bacteria are used as antigen carrier inducing humoral and cellular
immune responses. Viral vectors, such as vaccinia virus and bacteria (e.g. Listeria
monocytogenes or Yersinia enterocolitica) can be engineered to deliver recombinant
molecules (Wiedig et al., 2005; Loeffler et al., 2006; Embry et al., 2011). In the 21th
Introduction
31
century, antigen delivery strategies using whole recombinant yeasts have been
demonstrated a promising approach (reviewed by Ardiani et al., 2010).
3.1. Vaccines for cellular immune responses
The major purpose of vaccines is to provide long-term immunological protection.
Traditionally, most vaccine strategies in the 20th century have driven the attention to the
generation of high titers of antibodies, with modest understanding of the role of the
cellular immune responses (Kaech et al., 2002; Esser et al., 2003). Since the vast
majority of vaccines routinely used today elicit humoral immunity, many efforts to
promote cell-mediated immunity through vaccination have been made in the past years.
However, combating tumors and pathogens that cause chronic or persistent
infections implicates eliciting the mechanisms of cellular immunity. For this reason,
development of vaccines that stimulate long-lived cellular immune responses is critical
to fighting against a number of diseases, including those caused by cytomegalovirus,
hepatitis C virus, human immunodeficiency virus (HIV) and Mycobacterium
tuberculosis (Esser et al., 2003).
Long-term protection is based on the quantity and the quality of the memory T
cells that are produced. Ideally, vaccines should elicit the formation of a very large
effector T-cell population, which represents a challenge (Kaech et al., 2002).
Elimination of pathogen-infected or malignant cells by T-cell mediated immune
responses mainly relies on cell-mediated cytotoxicity via CD8+ CTLs. However,
vaccines must also be capable of inducing CD4+ T cell responses because they secrete
several immunomodulatory cytokines to subsequently trigger the generation and
proliferation of the robust CD8+ CTL responses required (Ardiani et al., 2010).
Distinct approaches have been employed in order to increase the activation of
CTLs specifically against affected cells. DCs have been considered an interesting target
due to their unique ability to cross-present antigens. Therefore, strategies aiming at the
delivery of antigens to DCs and inducing their maturation and activation are critical in
stimulating cell-mediated responses against diseased cells. Among the different
approaches for activating cell-mediated immunity are DNA vaccines, viral vectors,
autologous and allogeneic cells, and delivery of molecules by virulence-attenuated
bacterial strains and yeast (reviewed by Franzusoff et al., 2005). DNA vaccines have
low boosting capacity; viral vectors are neutralized by antibodies after repetitive
Introduction
32
applications; besides being very expensive and complex, immunotherapy with tumor
cells is patient-specific, and cell-mediated immunity is poorly activated due to the lack
of danger signals; bacterial vectors can cause unwanted side effects associated with the
host-bacteria interactions (Franzusoff et al., 2005; Pálffy et al., 2006). The benefit of
using yeast as vaccine carrier has been demonstrated in recent pre-clinical and clinical
trials, making this approach very attractive.
3.2. Yeast as vehicle for generating antigen-specific immune responses
The use of recombinant yeast as vaccine strategy has become a very promising means
for the induction of robust immune responses. The ability of yeasts to properly perform
post-translational processing on the expressed proteins is especially advantageous in
immunotherapy because the expressed antigens can be recognized by the host as native
antigens, thus contributing to the generation of high-quality immune responses (Bucarey
et al., 2009). Furthermore, antigen processing by DCs after administration of whole
recombinant yeast carrying recombinant proteins provides a wide spectrum of epitopes
derived from the delivered proteins, which allows the presentation of epitopes relevant
for the MHC repertoire from a certain individual (Bui et al., 2010).
It has been postulated that protein-based vaccines have the major disadvantage
of insufficient immunogenicity and, as a consequence, the majority of them requires co-
administration with adjuvants to elicit protective immune responses (Petrovsky and
Aguilar, 2004). Thus, some efforts have been made in an attempt to develop more
effective vaccine strategies, in particular for inducing potent T cell-mediated immune
responses needed against viral and tumor antigens. Among the different approaches, the
use of recombinant yeast cells as antigen delivery system turned out to be an auspicious
strategy.
The first experiments performed in order to examine the potential use of whole
recombinant S. cerevisiae as a vaccine to elicit antibody responses came with Schreuder
et al. (1996a). In a cell-surface display system, an antigen bearing two major
hydrophilic regions of the hepatitis B surface antigen (HBsAg) was fused to the C-
terminal region of α-agglutinin from S. cerevisiae and exposed on the yeast cell surface.
Heat-killed yeasts were used to immunize mice intraperitoneally and serum immune
responses were analyzed. Very low specific immune responses against the recombinant
Introduction
33
protein were observed, in contrast to strong immune responses elicited against the yeast
carrier itself.
The observations of Schreuder et al. (1996a) demonstrating the stimulation of
the immune system by yeasts alone, combined with other reports showing the
immunnogenic characteristics of fungal β-glucan and mannan, have encouraged the
onset of several approaches using whole yeasts expressing recombinant antigens as
carrier systems for generation of specific immune responses (Suzuki et al., 1989;
Williams et al., 1992; Toda et al., 1997). Additionally, uptake of fungal particles by
phagocytic cells has been demonstrated (Newman et al., 1990; Suzuki et al., 1998;
Newman and Holly, 2001; Breinig et al., 2003), so that many studies have directed their
attention to the use of yeasts carrying proteinaceous antigens in immunotherapy.
In the first study analyzing cell-mediated immunity after vaccination of mice
with live yeasts, Stubbs et al. (2001) showed that S. cerevisiae cells expressing Ova
were capable of stimulating protective CD8+ T cells in vivo. Mice vaccinated with
recombinant yeast and challenged with Ova-expressing lymphoma cells were protected
from tumor formation. They also demonstrated that whole heat-killed yeast led to DC
maturation and IL-12 secretion and to increased presentation of Ova to antigen-specific
CD4+ and CD8+ T lymphocytes. When they tested a clinically relevant antigen, such as
the envelop protein SF2-gp160 from HIV-1, they observed that cells expressing this
protein were killed by cytotoxic T lymphocytes derived from mice vaccinated with
yeast/SF2-gp160, but not with PBS or yeast carrying an empty vector. Proliferative
responses of T lymphocytes specific for HIV-1-gp120 (gp160 devoid of gp41) were
also reported for mice immunized with yeast/SF2-gp160. It was the first demonstration
that whole recombinant yeast could induce potent cell-mediated responses (Stubbs et
al., 2001).
After that study, many other groups have resorted to this strategy, with different
antigens and mouse models. For example, cellular immune responses against the
hepatitis C virus (HCV) were examined in mice using heat-inactivated whole yeasts
expressing NS3/Core fusion protein. In this study, Haller and colleagues (2007)
demonstrated antigen-specific and dose dependent in vitro cytotoxicity. They have also
shown that repeated weekly immunization did not induce neutralization or tolerance,
and that immunized mice were protected from challenge with tumor cells expressing
HCV NS3. Further, mice vaccinated after NS3-positive tumor cell implantation showed
no or reduced tumor growth compared to an untreated group (Haller et al., 2007).
Introduction
34
Many studies using tumor-bearing mice have analyzed the therapeutic effect of
recombinant S. cerevisiae expressing tumor-associated antigens (TAAs), such as
mammalian mutant Ras proteins, the carcinoembryonic antigen (CEA), and a
melanocyte⁄melanoma antigen (MART-1), with promising results. Besides tumor
regression, increased survival time, cytotoxicity and cytokine production, no toxicity or
autoimmunity related to the yeast-based vaccine was observed (Lu et al., 2004;
Wansley et al., 2008; Tanaka et al., 2011). Clinical trials of immunotherapy with yeast
carrying Ras or CEA have been conducted with patients bearing Ras mutation+ or CEA+
tumors (ClinicalTrials.gov Identifiers: NCT00300950, NCT00924092; Ardiani et al.,
2010).
The use of recombinant yeast in prophylactic vaccine approaches has also been
investigated, for example with yeasts carrying MART-1 or BCR-ABLT315I, a mutated
protein in drug-resistant leukemia cells. Protection against tumor challenge, in vitro
cytotoxic activity and production of cytokines, as well as prolonged survival were
observed (Riemann et al., 2007; Bui et al., 2010).
A number of studies using yeasts displaying antigens on the cell surface to
immunize animals have also been conducted, most of them aiming at the development
of humoral immune responses (Zhu et al., 2006; Upadhyaya and Manjunath, 2009; Kim
et al., 2010).
Although S. cerevisiae has been used in the vast majority of studies, other well-
accepted yeast species have rarely been tested. A vaccine using live P. pastoris as
protein delivery system was tested by Saiki and colleagues (2005). The pcd-17, an
antigen associated with the paraneoplastic cerebellar degeneration, an autoimmune
disease, was chosen for recombinant expression in Pichia. Lymph node cells of mice
immunized with yeast/pcd-17 showed proliferative responses and IFN-γ production
after peptide restimulation, in contrast to cells derived from mice receiving the wild
type yeast only. The presence of autoantibodies in serum of vaccinated mice has also
been confirmed. However, these responses have only been observed in one out of four
mouse strains tested and no cytotoxicity assay was performed. In another study, heat-
treated H. polymorpha expressing cytosolic HBsAg was used to vaccinate mice. Yeasts
led to an increase in the number of T cells and DCs in the mouse spleen and elicited DC
maturation. Furthermore, yeasts/HBsAg induced the generation of anti-HBsAg
antibodies in a greater extent than HBsAg alone or administered with an alum adjuvant.
Cytotoxicity and cytokine secretion was also observed. This report confirmed the idea
Introduction
35
that recombinant yeasts stimulate both cellular and humoral immunity and promote
mixed Th1/Th2-type immune responses (Bian et al., 2010).
Recently, an approach for delivering nucleic acids by recombinant yeast to
antigen-presenting cells has been developed. In that work, S. cerevisiae and Sz. pombe
were analyzed as carrier for antigen-encoding DNA and mRNA. Recombinant protein
expression (e.g. eGFP and Ovacyt) in mammalian APCs was confirmed after yeast
internalization, and ex vivo activation of pp65-specific memory T cells was
demonstrated using S. cerevisiae as DNA/RNA delivery system (Walch, 2009; Walch et
al., 2011).
As previously described, activation of naïve T cells by APCs involves a set of
distinct signals. Yeasts lead to augmented expression of MHC class I and II (needed for
the first signal), as well as of the costimulatory and adhesion molecules CD40,
CD80/CD86, CD54, CD58 (necessary for the second signal), and stimulate secretion of
cytokines by DCs (providing the third signal).
In sum, the use of inherently nonpathogenic yeast as antigen delivery system
turned out to be an especially versatile technique. The main points in this issue are: (i)
phagocytic cells, especially DCs, are able to ingest a wide variety of antigens, including
whole yeasts; (ii) after internalization of fungal particles, DCs mature and efficiently
process the antigens in context of MHC class I and II molecules for presentation,
express a set of costimulatory molecules and secrete cytokines, stimulating the
differentiation of T lymphocytes into distinct classes of effector cells, controlling the
quality of the T cell response; (iii) upon using whole yeasts, all three signals necessary
for T cell activation are increased, due to the natural adjuvant characteristics of the yeast
PAMPs. This important feature facilitates the generation of robust adaptive immunity.
Therefore, since antigen-specific, adaptive responses play a critical role in combating
infections and tumors (Mellman et al., 2001; Heath and Carbone, 2001), the use of
whole yeasts is a promising vaccine strategy (Fig. 4). All efforts that have been made in
the vaccination field to target and activate DCs and consequently providing the potential
to generate both CD4+ and CD8+ T cells immune responses are worth.
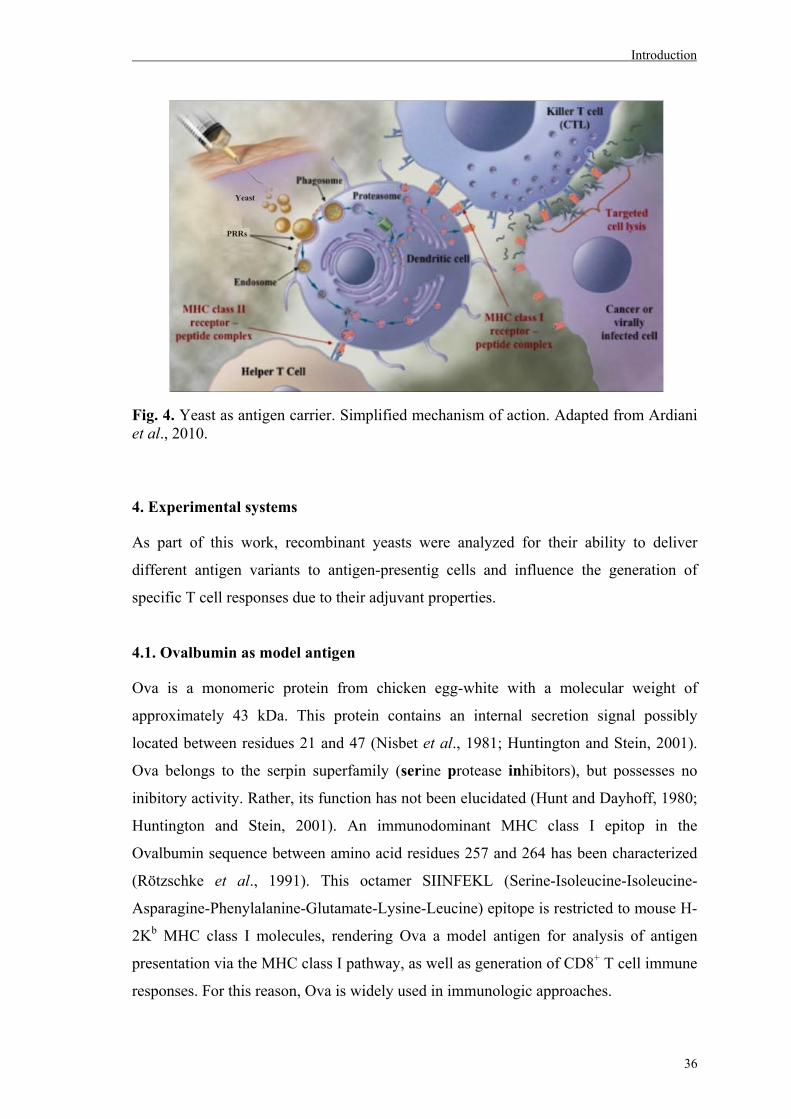
Introduction
36
Fig. 4. Yeast as antigen carrier. Simplified mechanism of action. Adapted from Ardiani et al., 2010.
4. Experimental systems
As part of this work, recombinant yeasts were analyzed for their ability to deliver
different antigen variants to antigen-presentig cells and influence the generation of
specific T cell responses due to their adjuvant properties.
4.1. Ovalbumin as model antigen
Ova is a monomeric protein from chicken egg-white with a molecular weight of
approximately 43 kDa. This protein contains an internal secretion signal possibly
located between residues 21 and 47 (Nisbet et al., 1981; Huntington and Stein, 2001).
Ova belongs to the serpin superfamily (serine protease inhibitors), but possesses no
inibitory activity. Rather, its function has not been elucidated (Hunt and Dayhoff, 1980;
Huntington and Stein, 2001). An immunodominant MHC class I epitop in the
Ovalbumin sequence between amino acid residues 257 and 264 has been characterized
(Rötzschke et al., 1991). This octamer SIINFEKL (Serine-Isoleucine-Isoleucine-
Asparagine-Phenylalanine-Glutamate-Lysine-Leucine) epitope is restricted to mouse H-
2Kb MHC class I molecules, rendering Ova a model antigen for analysis of antigen
presentation via the MHC class I pathway, as well as generation of CD8+ T cell immune
responses. For this reason, Ova is widely used in immunologic approaches.
Yeast
PRRs
Yeast
PRRs
Yeast
PRRs
Introduction
37
In order to target Ova to different subcellular compartments, the following Ova
derivatives were constructed and analyzed: i) full-length Ova which contains an internal
signal peptide that directs the protein into the secretory pathway for secretion of the
protein (Ova), ii) a derivative which lacks this signal, but still contains the SIINFEKL
epitope, and that is expressed intracellularly within the yeast cytosol (Ovacyt), and iii) a
fusion of Ovacyt with the yeast cell wall protein Sed1p which targets the protein to the
cell surface (Ovacyt/Sed1p). To direct this fusion into the yeast secretory pathway, a
genus-specific ER-import signal was added at the N-terminus. In another strategy,
Ovacyt was fused to the Gag protein from the S. cerevisiae L-A virus and intracellularly
expressed as Ovacyt-containing virus-like particles.
The efficiency with which different Ova derivatives in different yeast genera can
trigger antigen-specific CD8+ T cell responses was subsequently tested in vitro by
means of IFN-γ detection.
4.2. Pp65, a matrix protein from human cytomegalovirus, as model antigen
The human cytomegalovirus (HCMV) is a betaherpesvirus with high prevalence in the
population in the whole world. The virus consists of an icosahedral capsid containing a
linear, double-stranded, 235-kb DNA genome encoding approximately 165 genes and
surrounded by a matrix or tegument within a lipid envelope. Primary infection with
HCMV is usually asymptomatic, but latent infection remains for the entire life, with
eventual reactivation and shedding of virus particles from mucosal sites (Mocarski Jr
and Courcelle, 2007; Khanna and Diamond, 2006).
The phosphoprotein 65 (pp65, also known as lower matrix protein or UL83)
from HCMV is the major constituent of viral particles and has been demonstrated to be
a relevant T cell antigen (reviewed by Kalejta, 2008). This structural protein associates
with host and viral kinases, but it is not clear whether pp65 itself possesses kinase
activity (Mocarski Jr and Courcelle, 2007; Kalejta, 2008). It has been shown that pp65
can be found in infected cells all times after viral infection, although pp65 is produced
in the late phase of viral gene expression, i.e. 24 h post infection (Grefte et al., 1992).
The recognition and lysis of HCMV-infected cells by the majority of virus-specific CTL
without the requirement of de novo viral protein synthesis indicates that structural
proteins are introduced into the cytoplasm of infected cells in sufficient amount to enter
the class I pathway after viral penetration (Riddell et al., 1991; Grefte et al., 1992).
Introduction
38
McLaughlin-Taylor and co-workers (1994) have shown that pp65 is a target
antigen for HCMV-specific MHC class I-restricted CTL. In one study, when fourteen
HCMV antigens were compared in their abilities to stimulate helper T cells in vitro,
pp65 was by far the most reacting protein (Beninga et al., 1995). Kern and colleagues
(2002) determined the frequencies of CD4+ and CD8+ T cell responses to pp65 in
healthy HCMV-positive individuals. They found that 63% and 83% of the donors tested
showed a CD4+ or a CD8+ T cell response, respectively, to pp65-derived peptides. In
addition, the frequencies of pp65-specific T cells among responders showed a great
variation. In another study conducted by Wills et al. (1996) it was demonstrated that,
among all CTL which were able to recognize HCMV-infected cells, 70-90% were
specific for pp65. They hypothesized that since this high frequency of pp65-specific
memory CTL was maintained for 18-22 months, this structural protein is probably
continuously expressed. This fact might indicate that either episodic reactivation or
continual replication of the virus at low levels enables restimulation of pp65-specific
CTL precursors and preservation of the pool of memory CTL.
The repeated observation that a number of HCMV-seropositive donors does not
respond to some established pp65 dominant epitopes, combined with the suggestions
that these individuals might respond to unpredicted or subdominant peptides makes the
use of a full-length protein more promising in terms of stimulating CTL expansion
(Solache et al.,1999; Vaz-Santiago, 2001; Kern et al., 2002).
Cell-mediated immunity plays a crucial role in control of latent HCMV
infection. However, in individuals with compromised or immature immune systems,
such as transplant recipients and neonates, HCMV is constantly associated to morbidity
and mortality in a number of disease patterns. Despite many efforts that have been made
in the past decades, no vaccine against HCMV is available to date. Thus, vaccine
development is nowadays a main biomedical research concern, especially in the
following scenarios: congenital primary infection, primary infection in
immunosuppressed individuals and virus reactivation in immunosuppressed adults
(Mocarski Jr and Courcelle, 2007; Schleiss, 2005; Khanna and Diamond, 2006).
Recently, a phase I clinical trial has been performed, in which a vaccine consisting of a
two-component alphavirus replicon vector system expressing both the pp65 fused to a
72-kDa immediate-early protein (IE1) and the major HCMV surface glycoprotein (gB)
was evaluated in HCMV-seronegative individuals. The vaccine elicited cytokine
responses in CD8+ and CD4+ T cells against all three proteins and induced the
Introduction
39
generation of neutralizing antibodies to HCMV, most likely against gB (Bernstein et al.,
2010). However, a vaccine with promising therapeutic potential for HCMV-positive
individuals is still missing.
4.3. Virus-like particles (VLP) as antigen carrier
The S. cerevisiae L-A virus is a double-stranded RNA virus which replicates in the
cytoplasm of yeast cells without a known phenotype. Its viral icosahedral particles are
composed of a 76-kDa major protein (Gag) and a 180-kDa minor Gag-Pol fusion
protein. The 4.6-kb viral genome consists of two overlapping open reading frames (gag
and pol). A -1 ribosomal frameshift is responsible for the formation of the Gag-Pol
fusion protein. The L-A capsid has a diameter of approximately 39 nm, comprising 118
Gag molecules and 2 Gag-Pol molecules (Wickner, 1996). N-terminal Gag acetylation
by the MAK3 gene product is crucial for VLP assembly (Tercero and Wickner, 1992).
Gag alone has been demonstrated to be sufficient for the assembly of VLP, therefore
strategies aiming at the development of biotechnologically or pharmaceutically relevant
chimeric Gag-VLP have been employed (Fujimura et al., 1992; Wickner, 1996;
Powilleit et al., 2007).
VLP have been shown to function as adjuvants, eliciting the generation of innate
and cell-mediated immune responses against both the carrier itself and the delivered
antigen. VLP are considered a promising setting in the field of vaccine production, not
only because of their particulate structure and size range (40-50 nm), which have been
shown to facilitate their capture by DCs, but also because of the repetitive, high-density
display of epitopes, which is generally efficient in stimulating robust immune responses.
Furthermore, VLP are optimal delivery systems in prophylactic and therapeutic
approaches by virtue of their intrinsic ability to break self-tolerance (Fifis et al., 2004;
Grgacic and Anderson, 2006; Schumacher et al., 2007; Crisci et al., 2009).
In the L-A virus, Pol projects into the inner side of the capsid, participating in
replication and transcription of the viral genome (Fujimura et al., 1992). In this work,
the interior of the capsid was modified by substituting Pol for Ovacyt or full-length pp65.
Nonetheless, in contrast to pol, ovacyt and pp65 were cloned in frame with gag, so that
all molecules produced are Gag/Ovacyt or Gag/pp65 fusions, respectively. For
expression of Gag-variants, the virus-free S. cerevisiae strain S86c was chosen as host
Introduction
40
(Powilleit, 2004). S86c derives from the S86 strain, which was heat-treated for
elimination of the viral genome (Schmitt, 1995).
5. Aim of the study
The main objective of this work was to compare different yeast strains as carrier for
recombinant protein antigens as well as to analyze the influence of the subcellular
localization of the heterologous protein on activation of antigen-specific T lymphocytes
for a possible application in vaccination approaches.
First, the effect of distinct yeast genera, species, strains, or cell wall mutants on
maturation and activation of human dendritic cells was investigated by analyzing
upregulation of diverse cell surface markers and cytokines. The major components of
the yeast cell wall, mannan and β-glucan, which are known to possess adjuvant
properties, were examined for establishment of a potential association with the results
observed. Further, the biotechnologically relevant yeasts Saccharomyces cerevisiae,
Kluyveromyces lactis, Schizosaccharomyces pombe and Pichia pastoris were assessed
for the interaction kinetics with human DCs or murine macrophages, and the
involvement of major pattern recognition receptors MR and Dectin-1 in their
internalization was determined. The influence of heat-treatment of yeast on phagocyte
activation, as measured by production of reactive oxygen species in human whole
blood, was also investigated.
Next, the different yeasts were used for the expression of model proteins such as
Ova and the clinically significant antigen pp65 from human cytomegalovirus, and
activation of antigen-specific T lymphocytes was examined in vitro and ex vivo. The
efficiency of yeast-delivered pp65 or pp65 VLP to activate pp65-specific memory CD4+
and CD8+ T lymphocytes was measured in blood from cytomegalovirus-seropositive
donors by means of an ex vivo whole blood assay. In the case of Ova, in vitro antigen
presentation assays using murine bone marrow macrophages and antigen-specific CD8+
T lymphocytes were used to assess the MHC I-restricted antigen presentation after
protein delivery by the distinct yeast genera. Moreover, the influence of the subcellular
localization of Ova on the degree of T cell activation was investigated, in which yeasts
harbouring different antigen variants – intracellular, secreted or cell-wall anchored –
were compared. Finally, a preliminary in vivo experiment using a selected yeast species
Introduction
41
and a single antigenic variant was performed in order to obtain basic information with
respect to the establishment of future immunization protocols in an animal model.
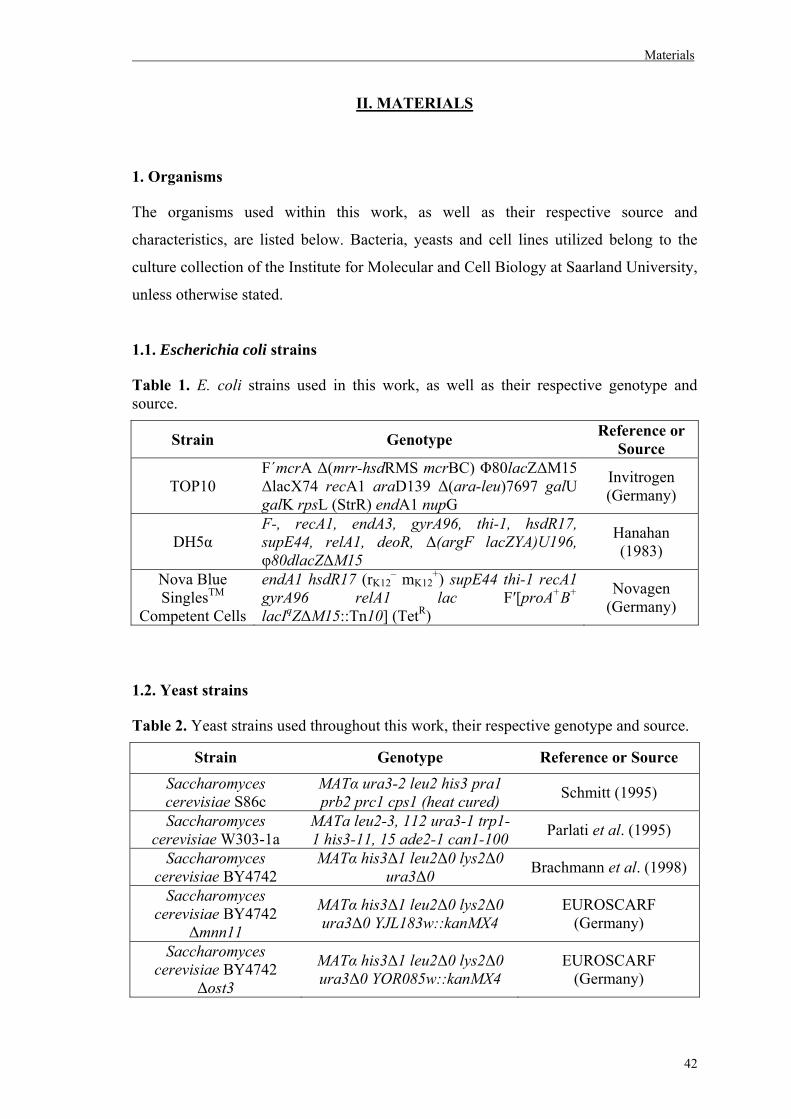
Materials
42
II. MATERIALS
1. Organisms
The organisms used within this work, as well as their respective source and
characteristics, are listed below. Bacteria, yeasts and cell lines utilized belong to the
culture collection of the Institute for Molecular and Cell Biology at Saarland University,
unless otherwise stated.
1.1. Escherichia coli strains
Table 1. E. coli strains used in this work, as well as their respective genotype and source.
Strain Genotype Reference or Source
TOP10 F´mcrA Δ(mrr-hsdRMS mcrBC) Φ80lacZΔM15 ΔlacX74 recA1 araD139 Δ(ara-leu)7697 galU galK rpsL (StrR) endA1 nupG
Invitrogen (Germany)
DH5α F-, recA1, endA3, gyrA96, thi-1, hsdR17, supE44, relA1, deoR, Δ(argF lacZYA)U196, φ80dlacZΔM15
Hanahan (1983)
Nova Blue SinglesTM
Competent Cells
endA1 hsdR17 (rK12– mK12
+) supE44 thi-1 recA1 gyrA96 relA1 lac F′[proA+B+ lacIqZΔM15::Tn10] (TetR)
Novagen (Germany)
1.2. Yeast strains
Table 2. Yeast strains used throughout this work, their respective genotype and source.
Strain Genotype Reference or Source Saccharomyces cerevisiae S86c
MATα ura3-2 leu2 his3 pra1 prb2 prc1 cps1 (heat cured) Schmitt (1995)
Saccharomyces cerevisiae W303-1a
MATa leu2-3, 112 ura3-1 trp1-1 his3-11, 15 ade2-1 can1-100 Parlati et al. (1995)
Saccharomyces cerevisiae BY4742
MATα his3Δ1 leu2Δ0 lys2Δ0 ura3Δ0 Brachmann et al. (1998)
Saccharomyces cerevisiae BY4742
Δmnn11
MATα his3Δ1 leu2Δ0 lys2Δ0 ura3Δ0 YJL183w::kanMX4
EUROSCARF (Germany)
Saccharomyces cerevisiae BY4742
Δost3
MATα his3Δ1 leu2Δ0 lys2Δ0 ura3Δ0 YOR085w::kanMX4
EUROSCARF (Germany)
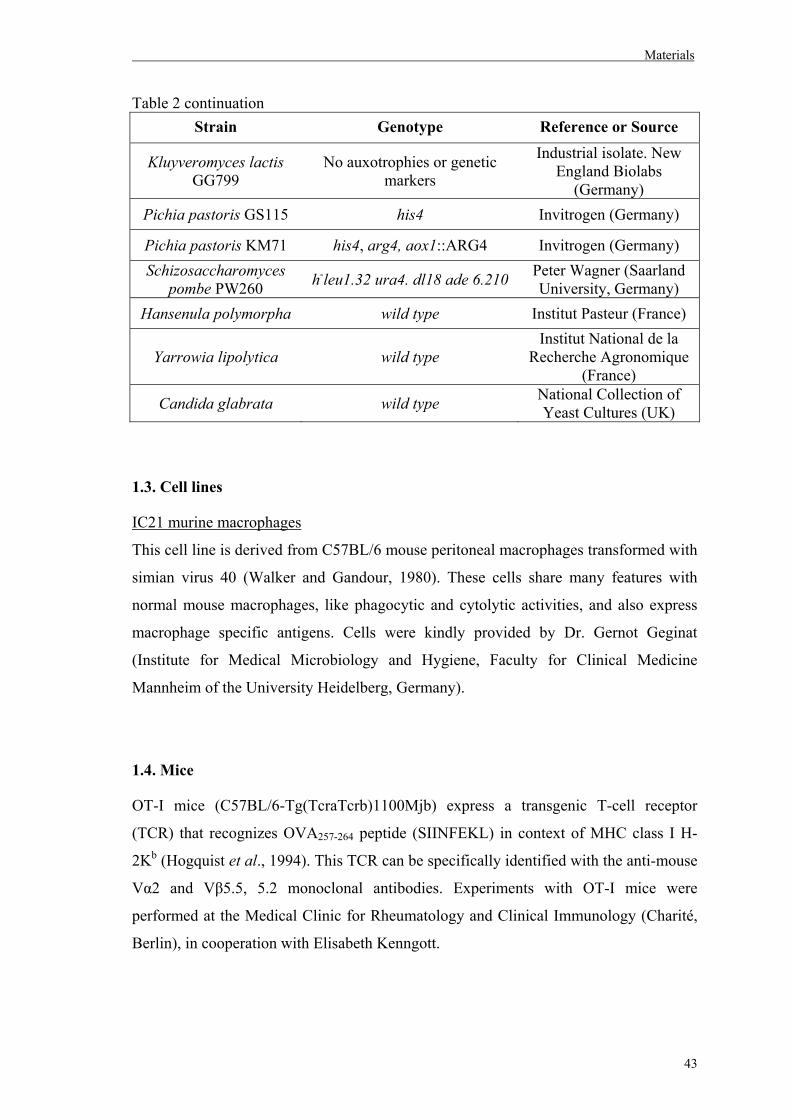
Materials
43
Table 2 continuation Strain Genotype Reference or Source
Kluyveromyces lactis GG799
No auxotrophies or genetic markers
Industrial isolate. New England Biolabs
(Germany) Pichia pastoris GS115 his4 Invitrogen (Germany)
Pichia pastoris KM71 his4, arg4, aox1::ARG4 Invitrogen (Germany) Schizosaccharomyces
pombe PW260 h-leu1.32 ura4. dl18 ade 6.210 Peter Wagner (Saarland University, Germany)
Hansenula polymorpha wild type Institut Pasteur (France)
Yarrowia lipolytica wild type Institut National de la
Recherche Agronomique (France)
Candida glabrata wild type National Collection of Yeast Cultures (UK)
1.3. Cell lines
IC21 murine macrophages
This cell line is derived from C57BL/6 mouse peritoneal macrophages transformed with
simian virus 40 (Walker and Gandour, 1980). These cells share many features with
normal mouse macrophages, like phagocytic and cytolytic activities, and also express
macrophage specific antigens. Cells were kindly provided by Dr. Gernot Geginat
(Institute for Medical Microbiology and Hygiene, Faculty for Clinical Medicine
Mannheim of the University Heidelberg, Germany).
1.4. Mice
OT-I mice (C57BL/6-Tg(TcraTcrb)1100Mjb) express a transgenic T-cell receptor
(TCR) that recognizes OVA257-264 peptide (SIINFEKL) in context of MHC class I H-
2Kb (Hogquist et al., 1994). This TCR can be specifically identified with the anti-mouse
Vα2 and Vβ5.5, 5.2 monoclonal antibodies. Experiments with OT-I mice were
performed at the Medical Clinic for Rheumatology and Clinical Immunology (Charité,
Berlin), in cooperation with Elisabeth Kenngott.
Materials
44
2. Culture Media and Supplements
The chemicals for the following media and supplement stock solutions were solubilized
in distilled water and autoclave-sterilised, unless otherwise noted. Glucose as well as
galactose solutions were autoclaved separetely. Liquid media were generally stored at
room temperature. Solid agar media were stored at 4°C.
2.1. Bacterial culture media
SOC Medium
Yeast extract 0.5% w/v
Peptone 2% w/v
Glucose 20 mM
Potassium chloride 2.5 mM
Magnesium chloride 10 mM
Magnesium sulphate 10 mM
Sodium chloride 10 mM
The medium was stored at 4°C.
Luria Bertani (LB)
Peptone 1% w/v
Yeast extract 0.5% w/v
Sodium chloride 1% w/v
(Agar 1.5% w/v)
Ampicillin
Ampicillin 50 mg/ml
in 50 % ethanol
The solution was filter-sterilized and stored at -20°C.
Kanamycin
Kanamycin 25 mg/ml
The solution was filter-sterilized and stored at -20°C.
IPTG
IPTG 100 mM
Materials
45
The solution was filter-sterilized and stored at -20°C.
X-gal
X-gal 40 mg/ml
in dimethylformamide
The solution was filter-sterilized and stored in the dark at -20°C.
2.2. Yeast culture media
YPD
Yeast extract 1% w/v
Peptone 2% w/v
Glucose 2% w/v
(Agar 1.5% w/v)
10× Yeast nitrogen base (YNB) standard stock solution
YNB without aminoacids 17 g/l and ammonium sulfate
The solution was filter-sterilized before use.
Synthetic Complete Medium (SC Medium)
10× YNB standard stock solution 10% v/v
Ammonium sulphate 0.5% w/v
Glucose 2% w/v
Bases and amino acids mix 0.087% w/v
Bases and amino acids mix
Adenine sulphate 0.2 g
Uracil 0.2 g
L-tryptophan 0.2 g
L-histidin HCl 0.2 g
L-arginin HCl 0.2 g
L-methionin HCl 0.2 g
L-tyrosin HCl 0.3 g
Materials
46
L-lysin 0.3 g
L-isoleucin HCl 0.3 g
L-phenylalanin 0.5 g
L-leucin HCl 1.0 g
L-valin 1.5 g
L-threonin 2.0 g
L-serin 4.0 g
L-aspartic acid 6.0 g
L-glutamic acid 6.0 g
Powders were ground into a homogeneous mixture and stored at 4°C. In the dropout
(d/o) media described below uracil or histidin, respectively, were omitted in the mix.
2.2.1. S. cerevisiae media
Ura d/o Glucose
10× YNB standard stock solution 10% v/v
Ammonium sulphate 0.5% w/v
Bases and amino acids 0.087% w/v mix without uracil
Glucose 2% w/v
(Agar 1.5% w/v)
2.2.2. P. pastoris media
10× YNB stock for P. pastoris
YNB 34 g/l
Ammonium sulphate 100 g/l
The YNB amount in this solution is twice as concentrated as the standard YNB stock
solution. The solution was filter-sterilized before use.
BMG (Buffered Minimal Glycerol)
1 M potassium phosphate buffer 10% v/v
10× YNB stock for P. pastoris 10% v/v
500× Biotin stock 0.2% v/v
Materials
47
Glycerol 1% v/v
BMM (Buffered Minimal Methanol)
Potassium phosphate, pH 6.0 100 mM
10× YNB stock for P. pastoris 10% v/v
500× Biotin stock 0.2% v/v
Methanol 0.5% v/v
1 M Potassium Phosphate Buffer, pH 6.0
Potassium dihydrogenphosphat 118.1 g/l
Di-potassium hydrogenphosphat 23 g/l
500× Biotin stock
Biotin 20% w/v
The solution was filter-sterilized and stored at 4°C
His d/o Glucose
10× YNB standard stock solution 10% v/v
Ammonium sulphate 0.5% w/v
Bases and amino acids mix 0.069% w/v without histidin
Glucose 2% w/v
(Agar 1.5% w/v)
2.2.3. Sz. pombe media
Yeast extract with supplements (YES)
Yeast extract 0.5% w/v
Glucose 3.0% w/v
Agar 2% w/v
10× supplements 10% v/v
Edinburgh minimal medium (EMM) with supplements
Potassium hydrogen phthalate 14.7 mM
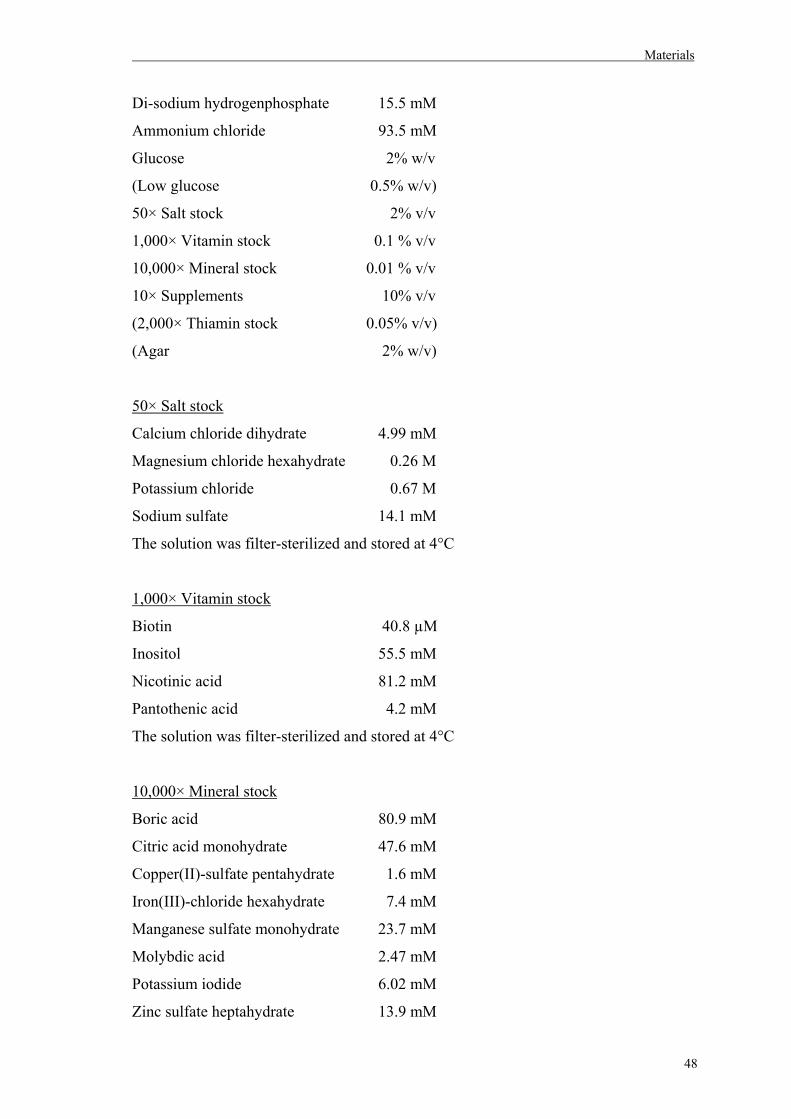
Materials
48
Di-sodium hydrogenphosphate 15.5 mM
Ammonium chloride 93.5 mM
Glucose 2% w/v
(Low glucose 0.5% w/v)
50× Salt stock 2% v/v
1,000× Vitamin stock 0.1 % v/v
10,000× Mineral stock 0.01 % v/v
10× Supplements 10% v/v
(2,000× Thiamin stock 0.05% v/v)
(Agar 2% w/v)
50× Salt stock
Calcium chloride dihydrate 4.99 mM
Magnesium chloride hexahydrate 0.26 M
Potassium chloride 0.67 M
Sodium sulfate 14.1 mM
The solution was filter-sterilized and stored at 4°C
1,000× Vitamin stock
Biotin 40.8 µM
Inositol 55.5 mM
Nicotinic acid 81.2 mM
Pantothenic acid 4.2 mM
The solution was filter-sterilized and stored at 4°C
10,000× Mineral stock
Boric acid 80.9 mM
Citric acid monohydrate 47.6 mM
Copper(II)-sulfate pentahydrate 1.6 mM
Iron(III)-chloride hexahydrate 7.4 mM
Manganese sulfate monohydrate 23.7 mM
Molybdic acid 2.47 mM
Potassium iodide 6.02 mM
Zinc sulfate heptahydrate 13.9 mM
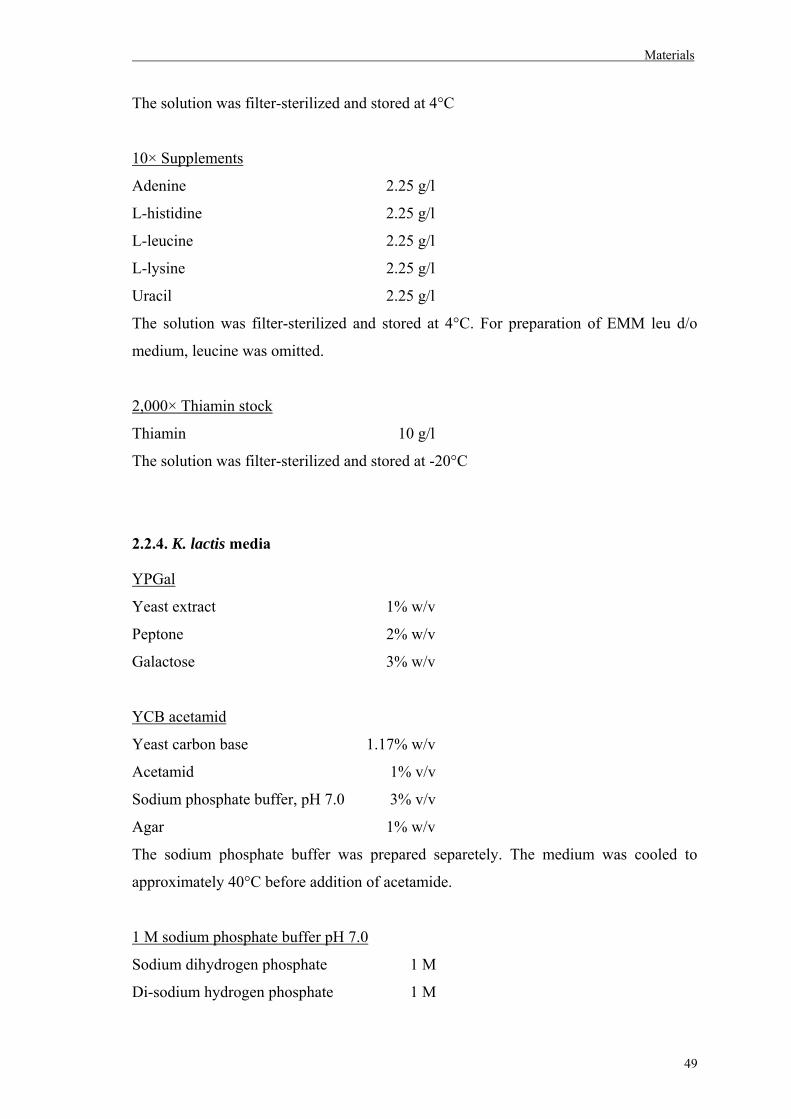
Materials
49
The solution was filter-sterilized and stored at 4°C
10× Supplements
Adenine 2.25 g/l
L-histidine 2.25 g/l
L-leucine 2.25 g/l
L-lysine 2.25 g/l
Uracil 2.25 g/l
The solution was filter-sterilized and stored at 4°C. For preparation of EMM leu d/o
medium, leucine was omitted.
2,000× Thiamin stock
Thiamin 10 g/l
The solution was filter-sterilized and stored at -20°C
2.2.4. K. lactis media
YPGal
Yeast extract 1% w/v
Peptone 2% w/v
Galactose 3% w/v
YCB acetamid
Yeast carbon base 1.17% w/v
Acetamid 1% v/v
Sodium phosphate buffer, pH 7.0 3% v/v
Agar 1% w/v
The sodium phosphate buffer was prepared separetely. The medium was cooled to
approximately 40°C before addition of acetamide.
1 M sodium phosphate buffer pH 7.0
Sodium dihydrogen phosphate 1 M
Di-sodium hydrogen phosphate 1 M
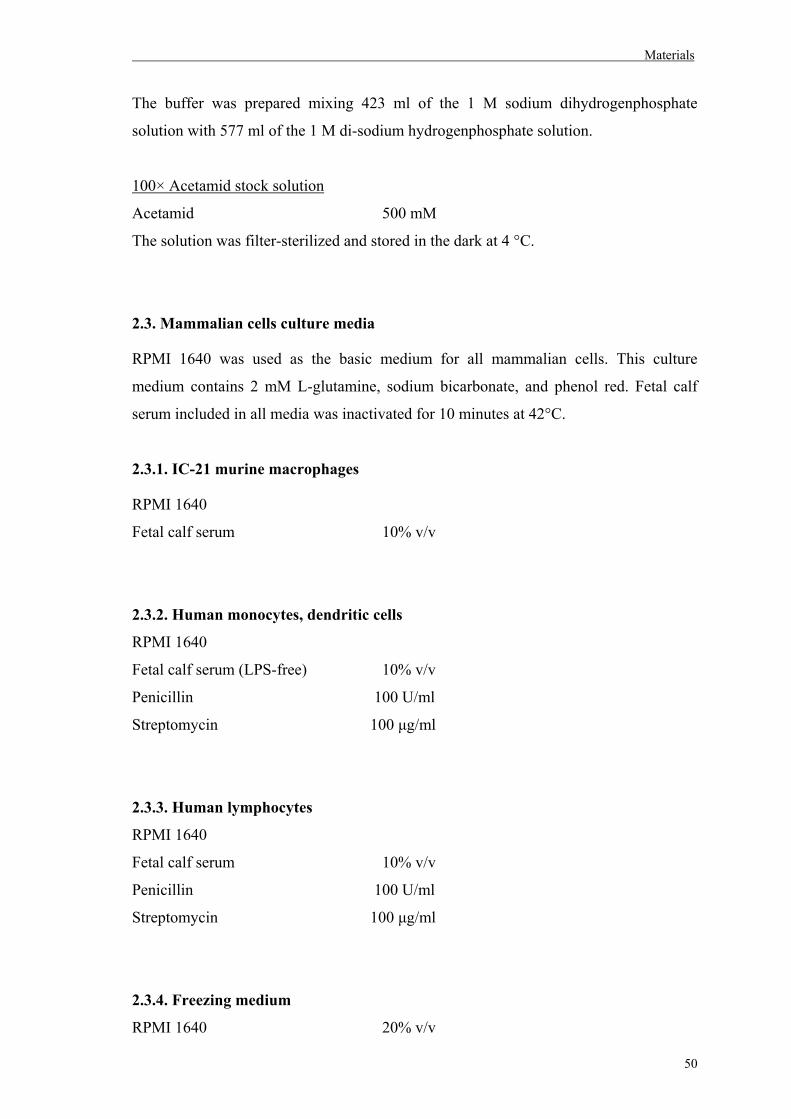
Materials
50
The buffer was prepared mixing 423 ml of the 1 M sodium dihydrogenphosphate
solution with 577 ml of the 1 M di-sodium hydrogenphosphate solution.
100× Acetamid stock solution
Acetamid 500 mM
The solution was filter-sterilized and stored in the dark at 4 °C.
2.3. Mammalian cells culture media
RPMI 1640 was used as the basic medium for all mammalian cells. This culture
medium contains 2 mM L-glutamine, sodium bicarbonate, and phenol red. Fetal calf
serum included in all media was inactivated for 10 minutes at 42°C.
2.3.1. IC-21 murine macrophages
RPMI 1640
Fetal calf serum 10% v/v
2.3.2. Human monocytes, dendritic cells
RPMI 1640
Fetal calf serum (LPS-free) 10% v/v
Penicillin 100 U/ml
Streptomycin 100 μg/ml
2.3.3. Human lymphocytes
RPMI 1640
Fetal calf serum 10% v/v
Penicillin 100 U/ml
Streptomycin 100 μg/ml
2.3.4. Freezing medium
RPMI 1640 20% v/v
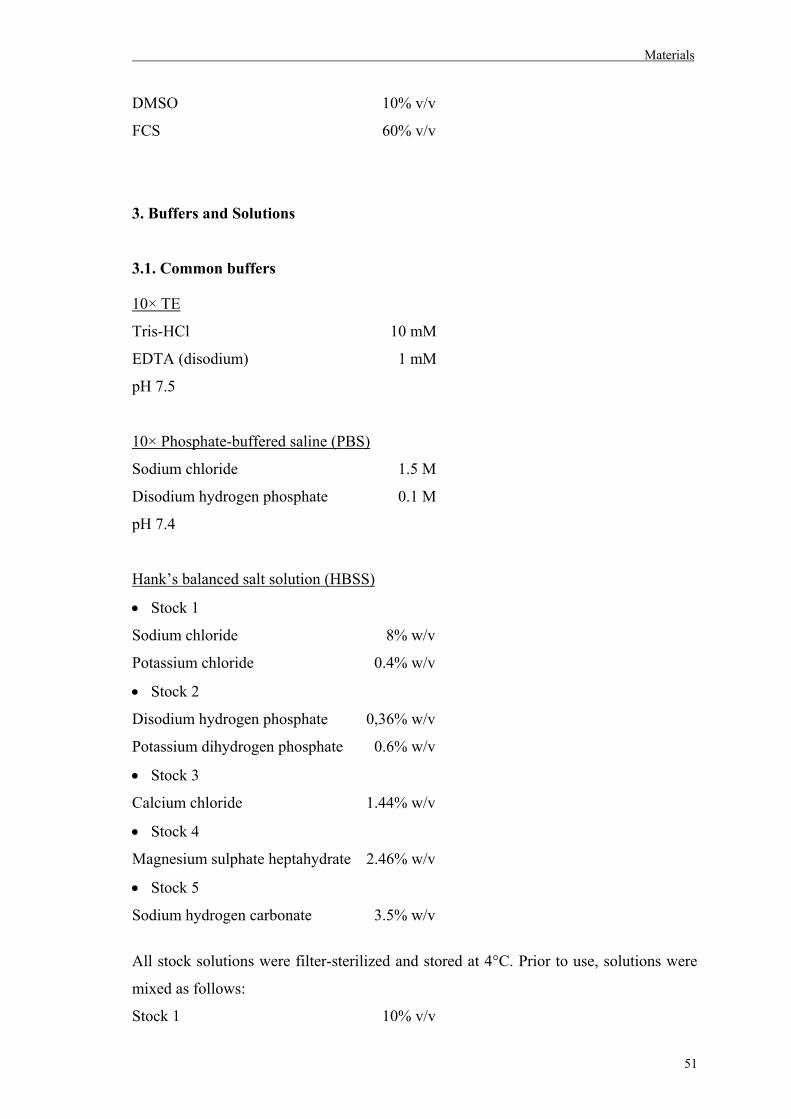
Materials
51
DMSO 10% v/v
FCS 60% v/v
3. Buffers and Solutions
3.1. Common buffers
10× TE
Tris-HCl 10 mM
EDTA (disodium) 1 mM
pH 7.5
10× Phosphate-buffered saline (PBS)
Sodium chloride 1.5 M
Disodium hydrogen phosphate 0.1 M
pH 7.4
Hank’s balanced salt solution (HBSS)
• Stock 1
Sodium chloride 8% w/v
Potassium chloride 0.4% w/v
• Stock 2
Disodium hydrogen phosphate 0,36% w/v
Potassium dihydrogen phosphate 0.6% w/v
• Stock 3
Calcium chloride 1.44% w/v
• Stock 4
Magnesium sulphate heptahydrate 2.46% w/v
• Stock 5
Sodium hydrogen carbonate 3.5% w/v
All stock solutions were filter-sterilized and stored at 4°C. Prior to use, solutions were
mixed as follows:
Stock 1 10% v/v
Materials
52
Stock 2 1% v/v
Stock 3 1% v/v
Stock 4 1% v/v
Stock 5 1% v/v
250× Luminol solution
Lminol 100 mM
in DMSO
Aliquots were stored at -20°C.
Lysis buffer
Tris 20 mM
Magnesium chloride 10 mM
Ammonium sulphate 0.3 M
EDTA 1 mM
Glycerin 5% v/v
Dithiothreitol 1 mM
Protease inhibitor cocktail 1×
Isolation buffer
Tris-HCl, pH 7.8 10 mM
100× PMSF 1% v/v
100× PMSF
PMSF 100 mM
in isopropanol
The solution was stored at -20°C.
1,000× DTT
DTT 1 M
in 10 mM sodium acetate, pH 5.2.
The solution was filter-sterilized and stored at -20°C.
Materials
53
3.2. Buffers for agarose gel electrophoresis
GLB (Gel Loading Buffer)
Glycerol 50% w/v
SDS 1% w/v
EDTA 125 mM
Bromophenol blue 0.05% w/v
Xylenecyanol 0.05% w/v
10× TBE
Tris base 0.89 M
Boric acid 0.89 M
EDTA 20 mM
3.3. Buffers for isolation of plasmid DNA
GTE
Glucose 50 mM
Tris-HCl, pH 8.0 25 mM
EDTA 10 mM
5 M Potassium acetate
Acetic acid (98%) 29.5% v/v
pH 4.8
NaOH/SDS
NaOH 200 mM
SDS 1% w/v
3.4. Solutions for transformation of Sz. pombe
10× TE
Tris 100 mM
EDTA 10 mM
Materials
54
pH 7.5
Lithium acetate / EDTA
Lithium acetate 100 mM
EDTA 1 mM
pH 4.9, filter-sterilized
PEG / lithium acetate / EDTA
Polyethylene glycol 3350 40% w/v
EDTA 1 mM
Lithium acetate 100 mM
3.5. Solutions for transformation of P. pastoris
10 × Bicin-NaOH pH 8.3
Bicin 100 mM
pH 8.3
BEDS Buffer
10 x Bicin-NaOH pH 8.3 10% v/v
Ethylene glycol 3% v/v
DMSO 3% v/v
Sorbitol 1 M
1 M Sorbitol
Sorbitol 1 M
The solution was filter-sterilized and stored at 4 °C.
3.6. Solutions for transformation of S. cerevisiae
10× lithium acetate
Lithium acetate 1 M
pH 7.5
The solution was filter-sterilized and stored at room temperature.
Materials
55
10× TE
Tris 100 mM
EDTA 10 mM
pH 7.5
Lithium acetate / TE
10× TE 10% v/v
10× lithium acetate pH 7.5 10% v/v
PEG solution
10× Lithiumacetat 10% v/v
10× TE pH 7,5 10% v/v
PEG 4000 50% (w/v) 80% v/v
3.7. Solutions for transformation of K. lactis
Yeast Transformation Reagent (New England Biolabs)
3.8. Buffers for VLP preparation
Spheroplasting buffer
Tris-HCl pH7.5 10 mM
Sorbit 0.8 M
CaCl2 10 mM
1,000× DTT 0.2% v/v
Zymolyase 20T 200 µg/ml
DTT and zymolyase were added separately.
PBSE(S)
NaCl 150 mM
Na2HPO4 10 mM
Na2EDTA 10 mM
(Sorbitol 1M)
pH 7.4
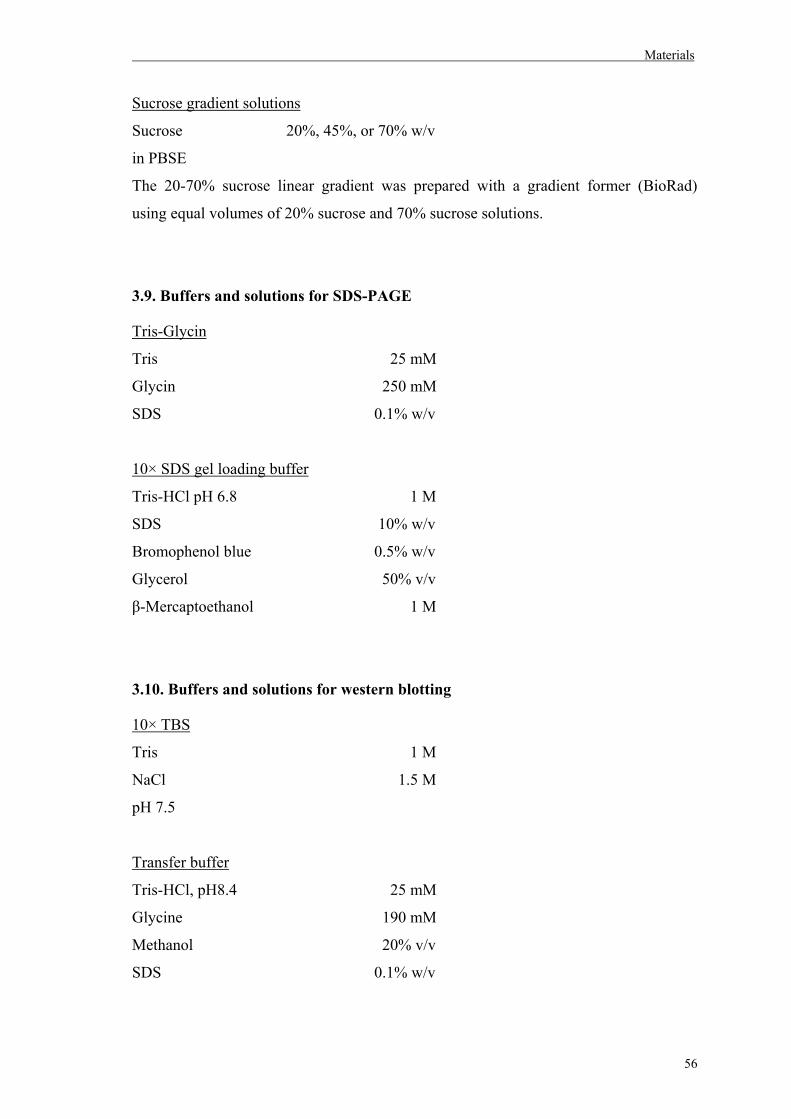
Materials
56
Sucrose gradient solutions
Sucrose 20%, 45%, or 70% w/v
in PBSE
The 20-70% sucrose linear gradient was prepared with a gradient former (BioRad)
using equal volumes of 20% sucrose and 70% sucrose solutions.
3.9. Buffers and solutions for SDS-PAGE
Tris-Glycin
Tris 25 mM
Glycin 250 mM
SDS 0.1% w/v
10× SDS gel loading buffer
Tris-HCl pH 6.8 1 M
SDS 10% w/v
Bromophenol blue 0.5% w/v
Glycerol 50% v/v
β-Mercaptoethanol 1 M
3.10. Buffers and solutions for western blotting
10× TBS
Tris 1 M
NaCl 1.5 M
pH 7.5
Transfer buffer
Tris-HCl, pH8.4 25 mM
Glycine 190 mM
Methanol 20% v/v
SDS 0.1% w/v
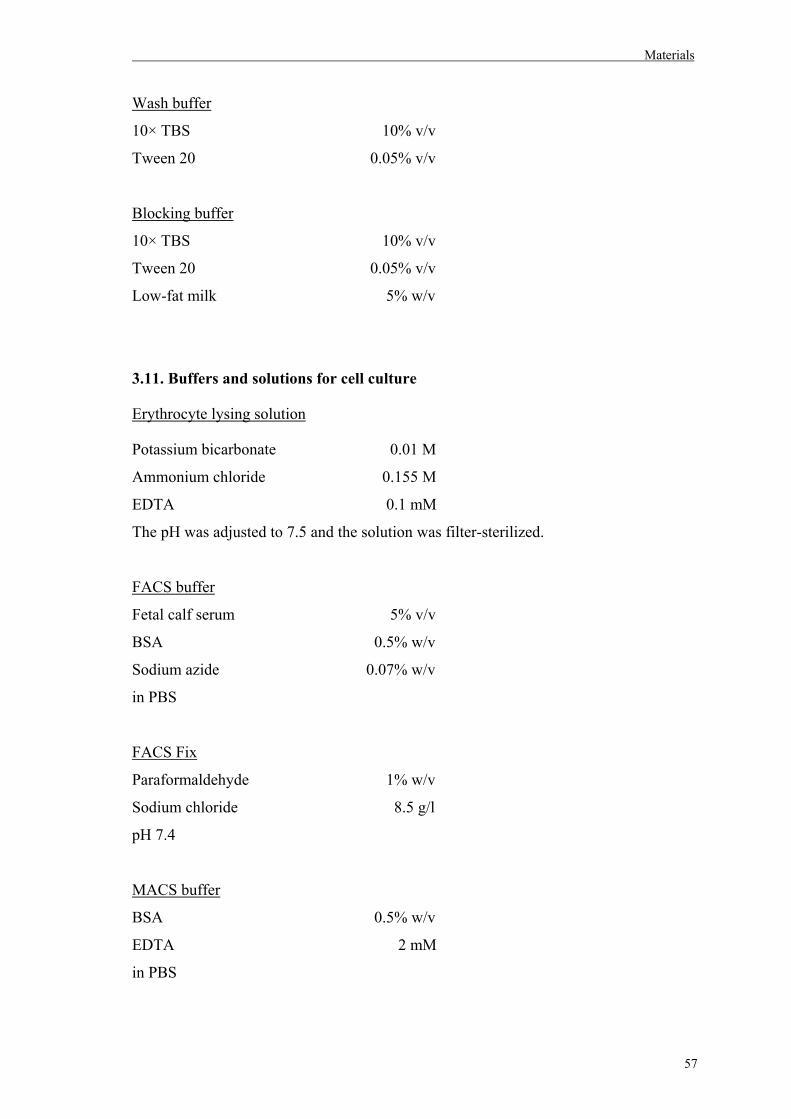
Materials
57
Wash buffer
10× TBS 10% v/v
Tween 20 0.05% v/v
Blocking buffer
10× TBS 10% v/v
Tween 20 0.05% v/v
Low-fat milk 5% w/v
3.11. Buffers and solutions for cell culture
Erythrocyte lysing solution
Potassium bicarbonate 0.01 M
Ammonium chloride 0.155 M
EDTA 0.1 mM
The pH was adjusted to 7.5 and the solution was filter-sterilized.
FACS buffer
Fetal calf serum 5% v/v
BSA 0.5% w/v
Sodium azide 0.07% w/v
in PBS
FACS Fix
Paraformaldehyde 1% w/v
Sodium chloride 8.5 g/l
pH 7.4
MACS buffer
BSA 0.5% w/v
EDTA 2 mM
in PBS
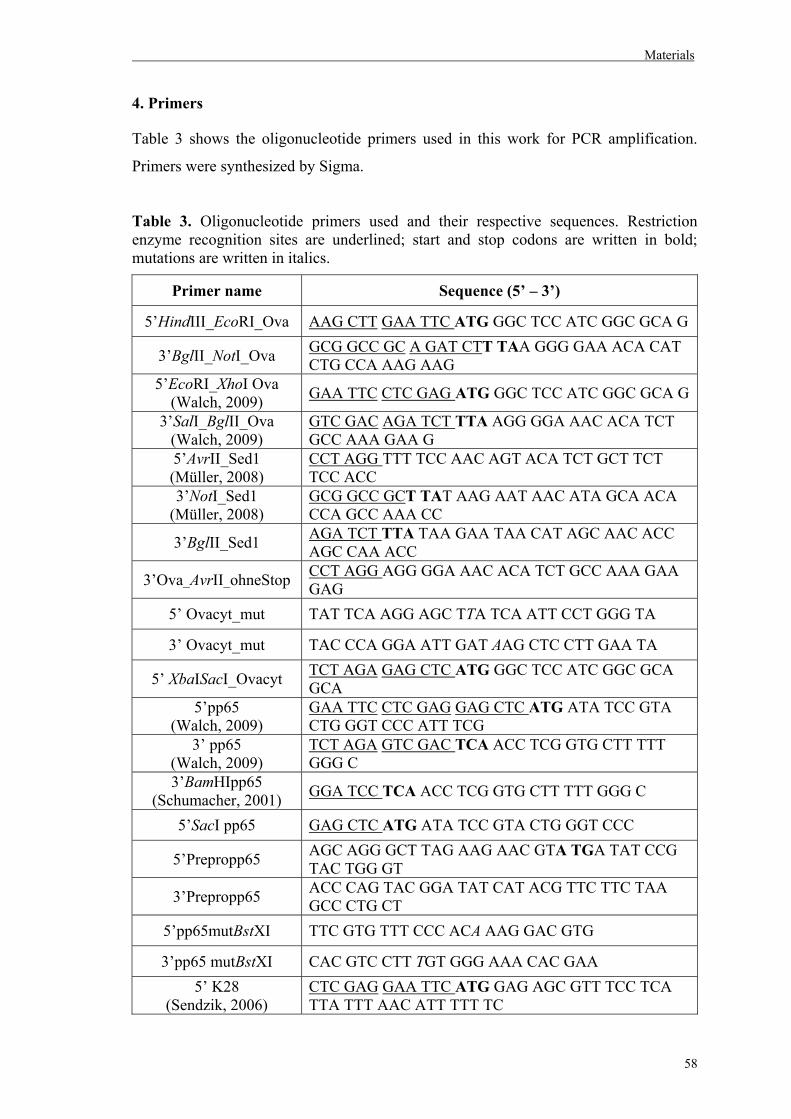
Materials
58
4. Primers
Table 3 shows the oligonucleotide primers used in this work for PCR amplification.
Primers were synthesized by Sigma.
Table 3. Oligonucleotide primers used and their respective sequences. Restriction enzyme recognition sites are underlined; start and stop codons are written in bold; mutations are written in italics.
Primer name Sequence (5’ – 3’)
5’HindIII_EcoRI_Ova AAG CTT GAA TTC ATG GGC TCC ATC GGC GCA G
3’BglII_NotI_Ova GCG GCC GC A GAT CTT TAA GGG GAA ACA CAT CTG CCA AAG AAG
5’EcoRI_XhoI Ova (Walch, 2009) GAA TTC CTC GAG ATG GGC TCC ATC GGC GCA G
3’SalI_BglII_Ova (Walch, 2009)
GTC GAC AGA TCT TTA AGG GGA AAC ACA TCT GCC AAA GAA G
5’AvrII_Sed1 (Müller, 2008)
CCT AGG TTT TCC AAC AGT ACA TCT GCT TCT TCC ACC
3’NotI_Sed1 (Müller, 2008)
GCG GCC GCT TAT AAG AAT AAC ATA GCA ACA CCA GCC AAA CC
3’BglII_Sed1 AGA TCT TTA TAA GAA TAA CAT AGC AAC ACC AGC CAA ACC
3’Ova_AvrII_ohneStop CCT AGG AGG GGA AAC ACA TCT GCC AAA GAA GAG
5’ Ovacyt_mut TAT TCA AGG AGC TTA TCA ATT CCT GGG TA
3’ Ovacyt_mut TAC CCA GGA ATT GAT AAG CTC CTT GAA TA
5’ XbaISacI_Ovacyt TCT AGA GAG CTC ATG GGC TCC ATC GGC GCA GCA
5’pp65 (Walch, 2009)
GAA TTC CTC GAG GAG CTC ATG ATA TCC GTA CTG GGT CCC ATT TCG
3’ pp65 (Walch, 2009)
TCT AGA GTC GAC TCA ACC TCG GTG CTT TTT GGG C
3’BamHIpp65 (Schumacher, 2001) GGA TCC TCA ACC TCG GTG CTT TTT GGG C
5’SacI pp65 GAG CTC ATG ATA TCC GTA CTG GGT CCC
5’Prepropp65 AGC AGG GCT TAG AAG AAC GTA TGA TAT CCG TAC TGG GT
3’Prepropp65 ACC CAG TAC GGA TAT CAT ACG TTC TTC TAA GCC CTG CT
5’pp65mutBstXI TTC GTG TTT CCC ACA AAG GAC GTG
3’pp65 mutBstXI CAC GTC CTT TGT GGG AAA CAC GAA 5’ K28
(Sendzik, 2006) CTC GAG GAA TTC ATG GAG AGC GTT TCC TCA TTA TTT AAC ATT TTT TC
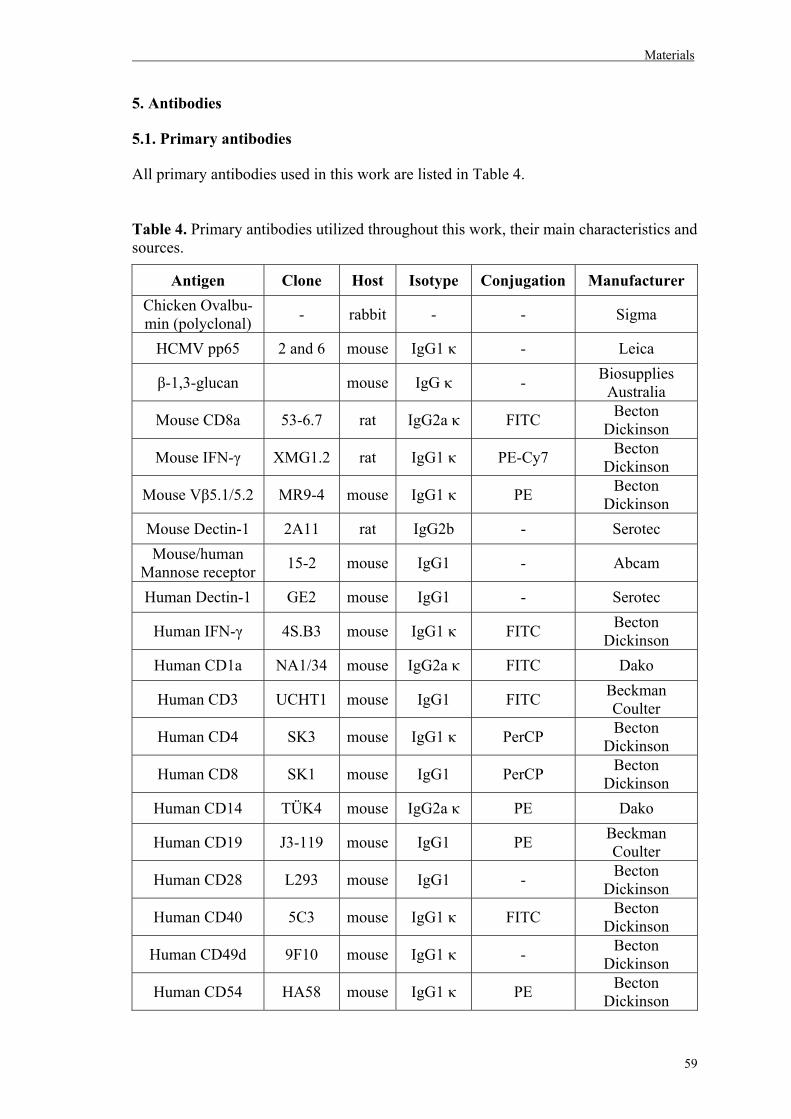
Materials
59
5. Antibodies
5.1. Primary antibodies
All primary antibodies used in this work are listed in Table 4.
Table 4. Primary antibodies utilized throughout this work, their main characteristics and sources.
Antigen Clone Host Isotype Conjugation Manufacturer Chicken Ovalbu-min (polyclonal) - rabbit - - Sigma
HCMV pp65 2 and 6 mouse IgG1 κ - Leica
β-1,3-glucan mouse IgG κ - Biosupplies Australia
Mouse CD8a 53-6.7 rat IgG2a κ FITC Becton Dickinson
Mouse IFN-γ XMG1.2 rat IgG1 κ PE-Cy7 Becton Dickinson
Mouse Vβ5.1/5.2 MR9-4 mouse IgG1 κ PE Becton Dickinson
Mouse Dectin-1 2A11 rat IgG2b - Serotec Mouse/human
Mannose receptor 15-2 mouse IgG1 - Abcam
Human Dectin-1 GE2 mouse IgG1 - Serotec
Human IFN-γ 4S.B3 mouse IgG1 κ FITC Becton Dickinson
Human CD1a NA1/34 mouse IgG2a κ FITC Dako
Human CD3 UCHT1 mouse IgG1 FITC Beckman Coulter
Human CD4 SK3 mouse IgG1 κ PerCP Becton Dickinson
Human CD8 SK1 mouse IgG1 PerCP Becton Dickinson
Human CD14 TÜK4 mouse IgG2a κ PE Dako
Human CD19 J3-119 mouse IgG1 PE Beckman Coulter
Human CD28 L293 mouse IgG1 - Becton Dickinson
Human CD40 5C3 mouse IgG1 κ FITC Becton Dickinson
Human CD49d 9F10 mouse IgG1 κ - Becton Dickinson
Human CD54 HA58 mouse IgG1 κ PE Becton Dickinson
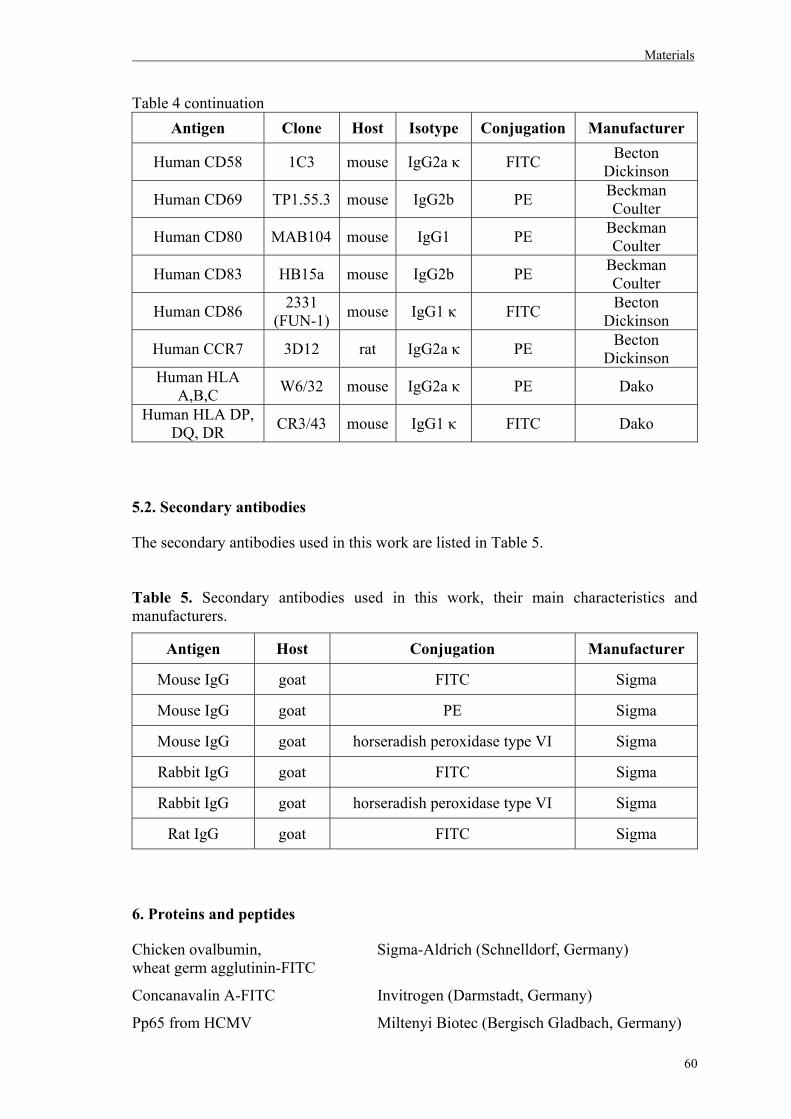
Materials
60
Table 4 continuation Antigen Clone Host Isotype Conjugation Manufacturer
Human CD58 1C3 mouse IgG2a κ FITC Becton Dickinson
Human CD69 TP1.55.3 mouse IgG2b PE Beckman Coulter
Human CD80 MAB104 mouse IgG1 PE Beckman Coulter
Human CD83 HB15a mouse IgG2b PE Beckman Coulter
Human CD86 2331 (FUN-1) mouse IgG1 κ FITC Becton
Dickinson
Human CCR7 3D12 rat IgG2a κ PE Becton Dickinson
Human HLA A,B,C W6/32 mouse IgG2a κ PE Dako
Human HLA DP, DQ, DR CR3/43 mouse IgG1 κ FITC Dako
5.2. Secondary antibodies
The secondary antibodies used in this work are listed in Table 5.
Table 5. Secondary antibodies used in this work, their main characteristics and manufacturers.
Antigen Host Conjugation Manufacturer
Mouse IgG goat FITC Sigma
Mouse IgG goat PE Sigma
Mouse IgG goat horseradish peroxidase type VI Sigma
Rabbit IgG goat FITC Sigma
Rabbit IgG goat horseradish peroxidase type VI Sigma
Rat IgG goat FITC Sigma
6. Proteins and peptides
Chicken ovalbumin, Sigma-Aldrich (Schnelldorf, Germany) wheat germ agglutinin-FITC
Concanavalin A-FITC Invitrogen (Darmstadt, Germany)
Pp65 from HCMV Miltenyi Biotec (Bergisch Gladbach, Germany)
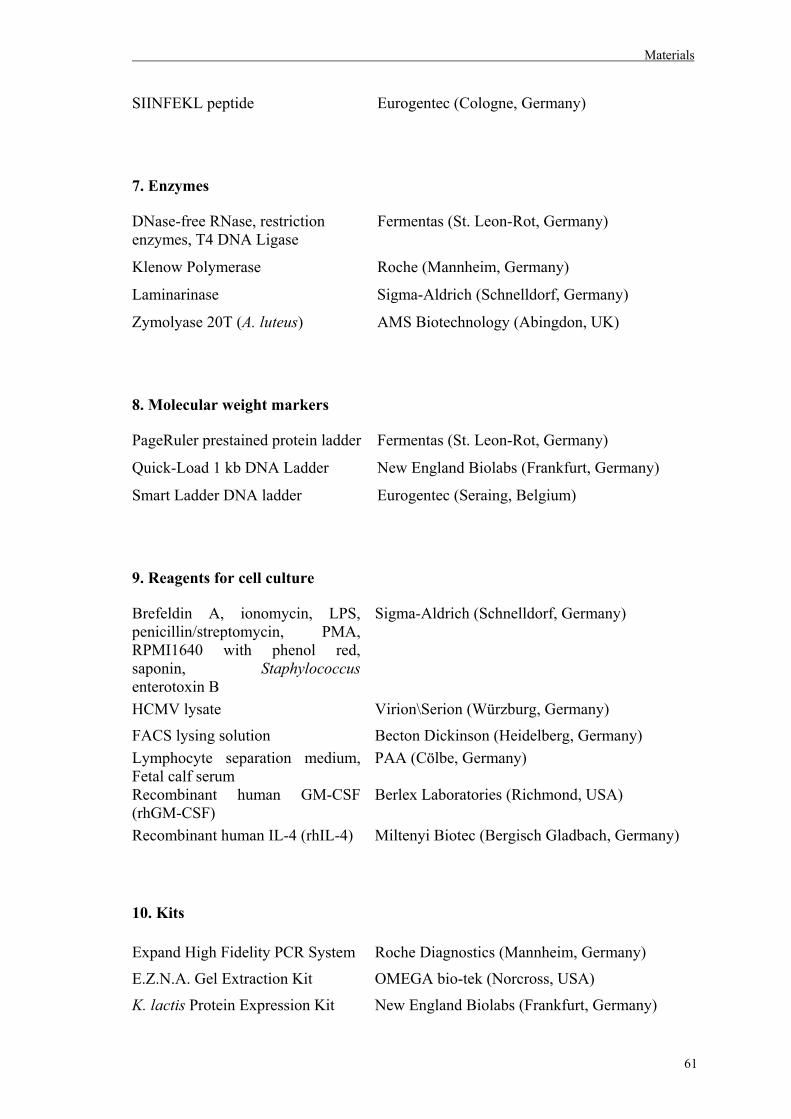
Materials
61
SIINFEKL peptide Eurogentec (Cologne, Germany)
7. Enzymes
DNase-free RNase, restriction Fermentas (St. Leon-Rot, Germany) enzymes, T4 DNA Ligase
Klenow Polymerase Roche (Mannheim, Germany)
Laminarinase Sigma-Aldrich (Schnelldorf, Germany)
Zymolyase 20T (A. luteus) AMS Biotechnology (Abingdon, UK)
8. Molecular weight markers
PageRuler prestained protein ladder Fermentas (St. Leon-Rot, Germany)
Quick-Load 1 kb DNA Ladder New England Biolabs (Frankfurt, Germany)
Smart Ladder DNA ladder Eurogentec (Seraing, Belgium)
9. Reagents for cell culture
Brefeldin A, ionomycin, LPS, penicillin/streptomycin, PMA, RPMI1640 with phenol red, saponin, Staphylococcus enterotoxin B
Sigma-Aldrich (Schnelldorf, Germany)
HCMV lysate Virion\Serion (Würzburg, Germany)
FACS lysing solution Becton Dickinson (Heidelberg, Germany) Lymphocyte separation medium, Fetal calf serum
PAA (Cölbe, Germany)
Recombinant human GM-CSF (rhGM-CSF)
Berlex Laboratories (Richmond, USA)
Recombinant human IL-4 (rhIL-4) Miltenyi Biotec (Bergisch Gladbach, Germany)
10. Kits
Expand High Fidelity PCR System Roche Diagnostics (Mannheim, Germany)
E.Z.N.A. Gel Extraction Kit OMEGA bio-tek (Norcross, USA)
K. lactis Protein Expression Kit New England Biolabs (Frankfurt, Germany)
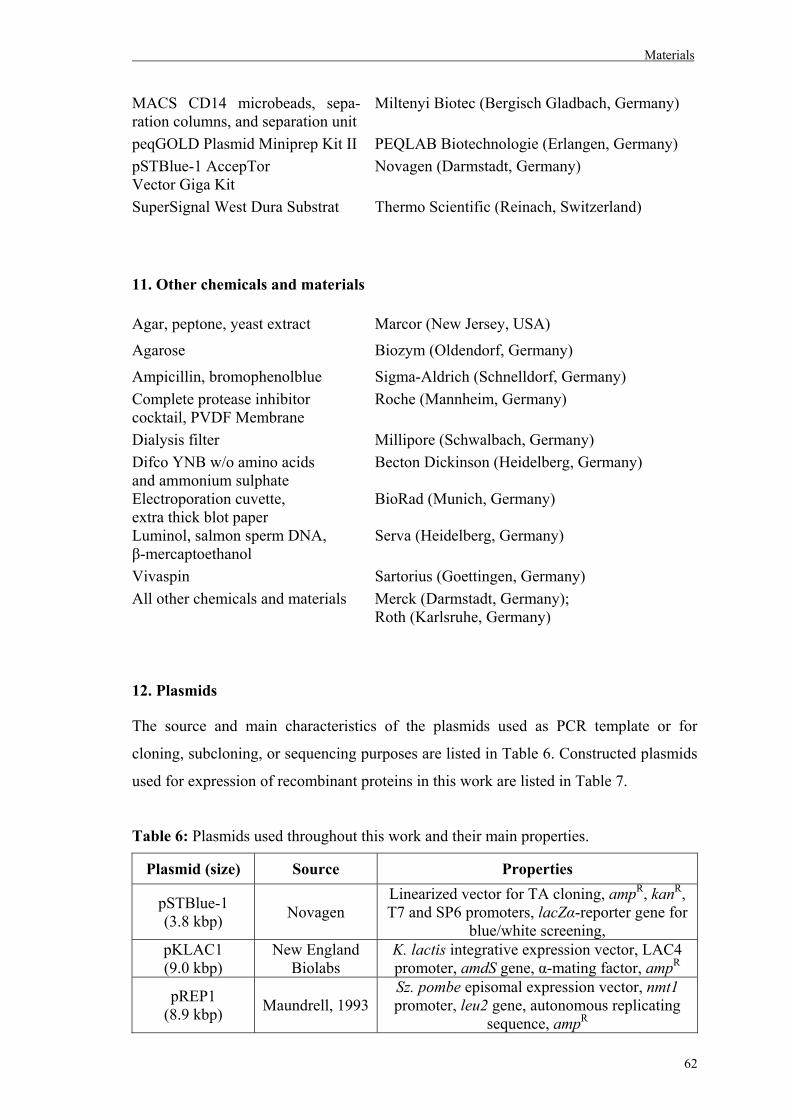
Materials
62
MACS CD14 microbeads, sepa- ration columns, and separation unit
Miltenyi Biotec (Bergisch Gladbach, Germany)
peqGOLD Plasmid Miniprep Kit II PEQLAB Biotechnologie (Erlangen, Germany) pSTBlue-1 AccepTor Vector Giga Kit
Novagen (Darmstadt, Germany)
SuperSignal West Dura Substrat Thermo Scientific (Reinach, Switzerland)
11. Other chemicals and materials
Agar, peptone, yeast extract Marcor (New Jersey, USA)
Agarose Biozym (Oldendorf, Germany)
Ampicillin, bromophenolblue Sigma-Aldrich (Schnelldorf, Germany) Complete protease inhibitor cocktail, PVDF Membrane
Roche (Mannheim, Germany)
Dialysis filter Millipore (Schwalbach, Germany) Difco YNB w/o amino acids and ammonium sulphate
Becton Dickinson (Heidelberg, Germany)
Electroporation cuvette, extra thick blot paper
BioRad (Munich, Germany)
Luminol, salmon sperm DNA, β-mercaptoethanol
Serva (Heidelberg, Germany)
Vivaspin Sartorius (Goettingen, Germany) All other chemicals and materials Merck (Darmstadt, Germany);
Roth (Karlsruhe, Germany)
12. Plasmids
The source and main characteristics of the plasmids used as PCR template or for
cloning, subcloning, or sequencing purposes are listed in Table 6. Constructed plasmids
used for expression of recombinant proteins in this work are listed in Table 7.
Table 6: Plasmids used throughout this work and their main properties.
Plasmid (size) Source Properties
pSTBlue-1 (3.8 kbp) Novagen
Linearized vector for TA cloning, ampR, kanR, T7 and SP6 promoters, lacZα-reporter gene for
blue/white screening, pKLAC1 (9.0 kbp)
New England Biolabs
K. lactis integrative expression vector, LAC4 promoter, amdS gene, α-mating factor, ampR
pREP1 (8.9 kbp) Maundrell, 1993
Sz. pombe episomal expression vector, nmt1 promoter, leu2 gene, autonomous replicating
sequence, ampR
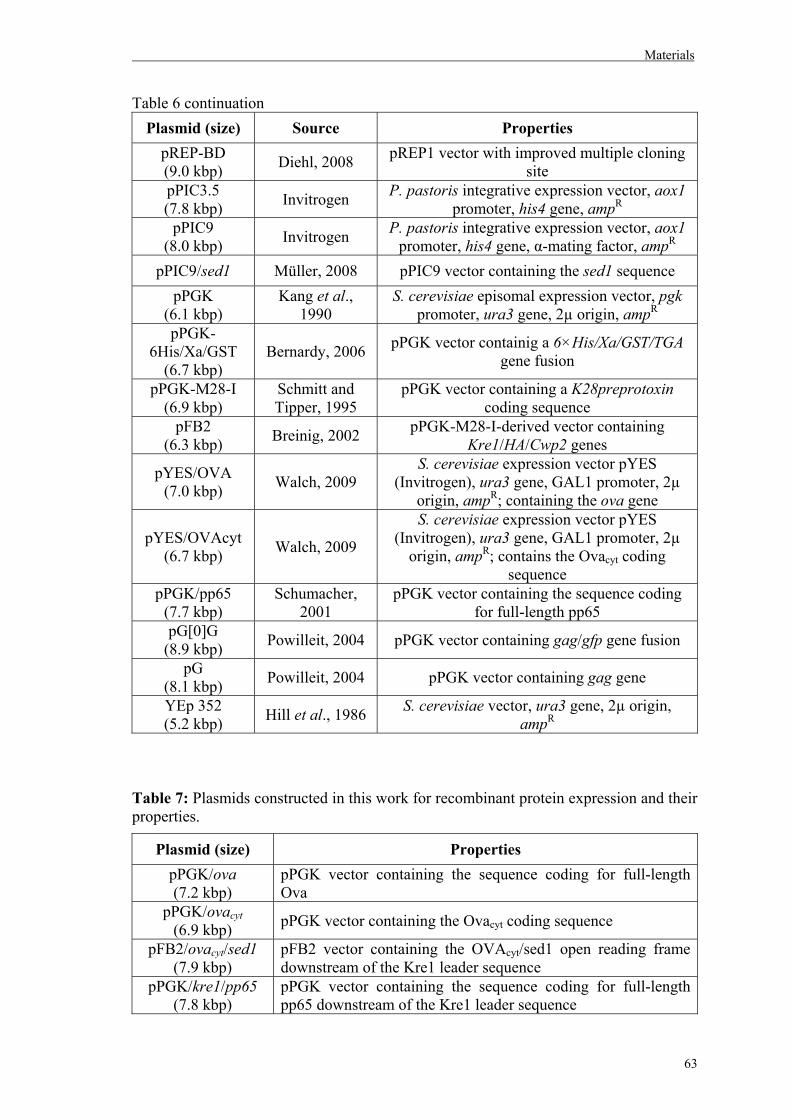
Materials
63
Table 6 continuation Plasmid (size) Source Properties
pREP-BD (9.0 kbp) Diehl, 2008 pREP1 vector with improved multiple cloning
site pPIC3.5 (7.8 kbp) Invitrogen P. pastoris integrative expression vector, aox1
promoter, his4 gene, ampR pPIC9
(8.0 kbp) Invitrogen P. pastoris integrative expression vector, aox1 promoter, his4 gene, α-mating factor, ampR
pPIC9/sed1 Müller, 2008 pPIC9 vector containing the sed1 sequence pPGK
(6.1 kbp) Kang et al.,
1990 S. cerevisiae episomal expression vector, pgk
promoter, ura3 gene, 2µ origin, ampR pPGK-
6His/Xa/GST (6.7 kbp)
Bernardy, 2006 pPGK vector containig a 6×His/Xa/GST/TGA gene fusion
pPGK-M28-I (6.9 kbp)
Schmitt and Tipper, 1995
pPGK vector containing a K28preprotoxin coding sequence
pFB2 (6.3 kbp) Breinig, 2002 pPGK-M28-I-derived vector containing
Kre1/HA/Cwp2 genes
pYES/OVA (7.0 kbp) Walch, 2009
S. cerevisiae expression vector pYES (Invitrogen), ura3 gene, GAL1 promoter, 2µ
origin, ampR; containing the ova gene
pYES/OVAcyt (6.7 kbp) Walch, 2009
S. cerevisiae expression vector pYES (Invitrogen), ura3 gene, GAL1 promoter, 2µ
origin, ampR; contains the Ovacyt coding sequence
pPGK/pp65 (7.7 kbp)
Schumacher, 2001
pPGK vector containing the sequence coding for full-length pp65
pG[0]G (8.9 kbp) Powilleit, 2004 pPGK vector containing gag/gfp gene fusion
pG (8.1 kbp) Powilleit, 2004 pPGK vector containing gag gene
YEp 352 (5.2 kbp) Hill et al., 1986 S. cerevisiae vector, ura3 gene, 2µ origin,
ampR
Table 7: Plasmids constructed in this work for recombinant protein expression and their properties.
Plasmid (size) Properties pPGK/ova (7.2 kbp)
pPGK vector containing the sequence coding for full-length Ova
pPGK/ovacyt (6.9 kbp) pPGK vector containing the Ovacyt coding sequence
pFB2/ovacyt/sed1 (7.9 kbp)
pFB2 vector containing the OVAcyt/sed1 open reading frame downstream of the Kre1 leader sequence
pPGK/kre1/pp65 (7.8 kbp)
pPGK vector containing the sequence coding for full-length pp65 downstream of the Kre1 leader sequence
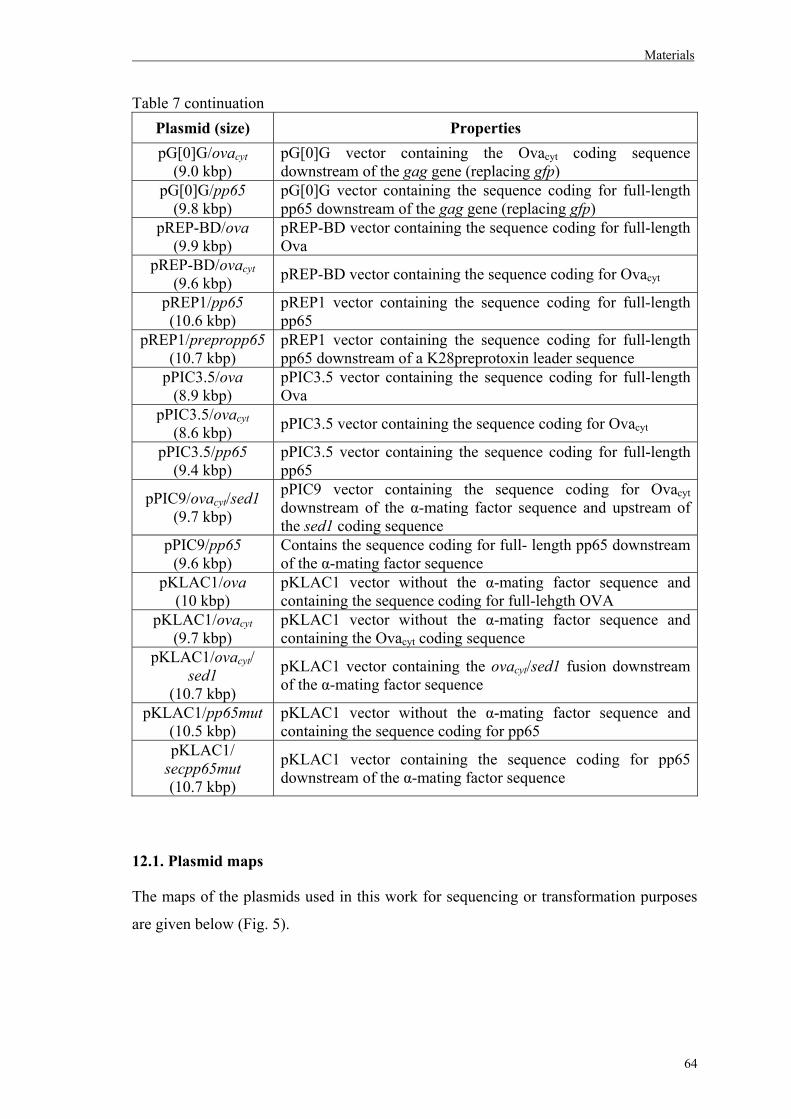
Materials
64
Table 7 continuation Plasmid (size) Properties pG[0]G/ovacyt
(9.0 kbp) pG[0]G vector containing the Ovacyt coding sequence downstream of the gag gene (replacing gfp)
pG[0]G/pp65 (9.8 kbp)
pG[0]G vector containing the sequence coding for full-length pp65 downstream of the gag gene (replacing gfp)
pREP-BD/ova (9.9 kbp)
pREP-BD vector containing the sequence coding for full-length Ova
pREP-BD/ovacyt (9.6 kbp) pREP-BD vector containing the sequence coding for Ovacyt
pREP1/pp65 (10.6 kbp)
pREP1 vector containing the sequence coding for full-length pp65
pREP1/prepropp65 (10.7 kbp)
pREP1 vector containing the sequence coding for full-length pp65 downstream of a K28preprotoxin leader sequence
pPIC3.5/ova (8.9 kbp)
pPIC3.5 vector containing the sequence coding for full-length Ova
pPIC3.5/ovacyt (8.6 kbp) pPIC3.5 vector containing the sequence coding for Ovacyt
pPIC3.5/pp65 (9.4 kbp)
pPIC3.5 vector containing the sequence coding for full-length pp65
pPIC9/ovacyt/sed1 (9.7 kbp)
pPIC9 vector containing the sequence coding for Ovacyt downstream of the α-mating factor sequence and upstream of the sed1 coding sequence
pPIC9/pp65 (9.6 kbp)
Contains the sequence coding for full- length pp65 downstream of the α-mating factor sequence
pKLAC1/ova (10 kbp)
pKLAC1 vector without the α-mating factor sequence and containing the sequence coding for full-lehgth OVA
pKLAC1/ovacyt (9.7 kbp)
pKLAC1 vector without the α-mating factor sequence and containing the Ovacyt coding sequence
pKLAC1/ovacyt/ sed1
(10.7 kbp)
pKLAC1 vector containing the ovacyt/sed1 fusion downstream of the α-mating factor sequence
pKLAC1/pp65mut (10.5 kbp)
pKLAC1 vector without the α-mating factor sequence and containing the sequence coding for pp65
pKLAC1/ secpp65mut (10.7 kbp)
pKLAC1 vector containing the sequence coding for pp65 downstream of the α-mating factor sequence
12.1. Plasmid maps
The maps of the plasmids used in this work for sequencing or transformation purposes
are given below (Fig. 5).
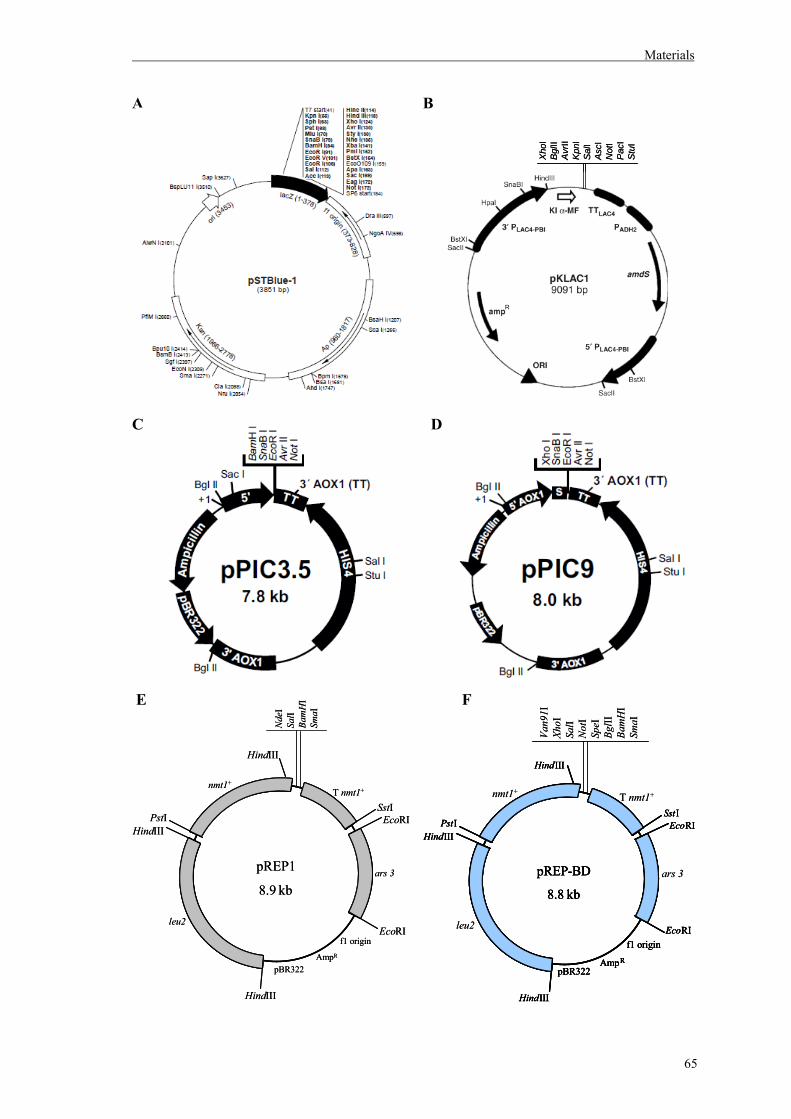
Materials
65
A B
C D
E F
Xho
IB
glII
Avr
IIK
pnI
Sal
IA
scI
Not
IP
acI
Stu
I
R
Xho
IB
glII
Avr
IIK
pnI
Sal
IA
scI
Not
IP
acI
Stu
I
R
AmpR
f1 originEcoRI
EcoRI
ars1
LEU2
Tnmt1Pnmt1
HindIII
HindIII
HindIII
PstISstI
pREP-BD
8.8 kb
pBR322AmpR
f1 originEcoRI
EcoRI
HindIII
HindIII
HindIII
PstISstI
pREP-BD
8.8 kb
pBR322
ars 3
leu2
nmt1+T nmt1+
Van9
1IXh
oISa
lIN
otI
SpeI
BglII
Bam
HI
SmaI
AmpR
f1 originEcoRI
EcoRI
ars1
LEU2
Tnmt1Pnmt1
HindIII
HindIII
HindIII
PstISstI
pREP-BD
8.8 kb
pBR322AmpR
f1 originEcoRI
EcoRI
HindIII
HindIII
HindIII
PstISstI
pREP-BD
8.8 kb
pBR322
ars 3
leu2
nmt1+T nmt1+
Van9
1IXh
oISa
lIN
otI
SpeI
BglII
Bam
HI
SmaI
ars 3
leu2
nmt1+
T nmt1+
pBR322AmpR
EcoRI
EcoRI
HindIII
HindIII
HindIII
PstISstI
pREP1
8.9 kb
Nde
ISa
lIBa
mH
ISm
aI
f1 origin
ars 3
leu2
nmt1+
T nmt1+
pBR322AmpR
EcoRI
EcoRI
HindIII
HindIII
HindIII
PstISstI
pREP1
8.9 kb
Nde
ISa
lIBa
mH
ISm
aI
f1 origin
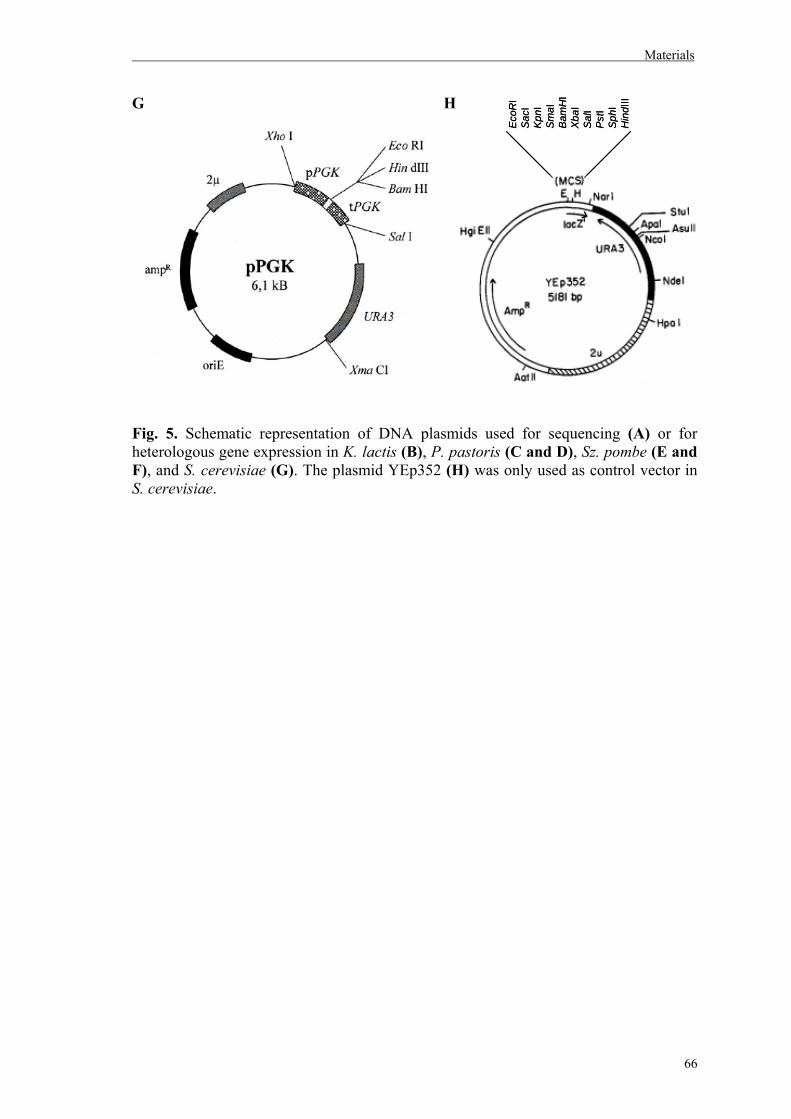
Materials
66
G H
Fig. 5. Schematic representation of DNA plasmids used for sequencing (A) or for heterologous gene expression in K. lactis (B), P. pastoris (C and D), Sz. pombe (E and F), and S. cerevisiae (G). The plasmid YEp352 (H) was only used as control vector in S. cerevisiae.
Eco
RI
Sac
IK
pnI
Sm
aIB
amH
IX
baI
Sal
IP
stI
Sph
IH
indI
II
Eco
RI
Sac
IK
pnI
Sm
aIB
amH
IX
baI
Sal
IP
stI
Sph
IH
indI
II
Methods
67
III. METHODS
1. Molecular Biology Methods
1.1. DNA amplification by polymerase chain reaction
The polymerase chain reaction (PCR) allows the amplification of a specific DNA
fragment flanked by regions of known sequence. This method relies on the selective
replication of a certain DNA segment catalyzed in vitro by a heat-stable DNA
polymerase in a series of cycles (Saiki et al., 1985). Two oligonucleotides which are
complementary to the 3’ ends of the region to be amplified are used as primers. These
can also contain additional restriction sites, in order to permit further cloning of the
DNA fragment into specific plasmid vectors. A typical reaction mixture contains the
template DNA, a thermostable DNA polymerase, at least two oligonucleotide primers,
and the four deoxynucleotides in a reaction buffer containing Mg2+. First, the reaction
mixture is heated to 94°C in order to denature the DNA, than cooled down below the
melting temperature of the primers (40-60°C) for hybridization of these synthetic
oligonucleotides to the complementary DNA strands (annealing). Next, when the
optimum temperature for the DNA polymerase is reached (68-72°C), elongation occurs.
In this step, DNA is synthesized by polymerization, starting from the oligonucleotide
primers. The most widely used polymerase is derived from the thermophilic bacterium
Thermus aquaticus and referred to as Taq polymerase. In order to minimize the
occurrence of mutations, a high-fidelity DNA polymerase with proofreading activity
was used.
A typical 50 μl-reaction was prepared as follows:
Template DNA (1:10 dilution) 1.0 µl
10 mM dNTP mix 0.5 µl
100 µM Forward primer 0.5 µl
100 µM Reverse primer 0.5 µl
Taq DNA Polimerase 5U/µl 0.7 µl
10× reaction buffer containing Mg2+ 5.0 µl
Distilled water ad 50 µl
Methods
68
PCRs were performed in a Peqlab or an Eppendorf thermocycler. A classical reaction
was run as follows:
Initial denaturation 94ºC 3 min
Denaturation 94ºC 30 s
Annealing 45-65ºC 30 s 30 cycles
Elongation 72ºC 1 min/kb
Terminal elongation 72ºC 6 min
SOE PCR
The “splicing by overlap extention” (SOE) method is used to construct a DNA fragment
encoding a fusion protein. In this technique, the sequences are fused in frame without
the use of restriction sites. A total of four oligonucleotide primers are used, so that the
reverse primer of the first sequence has an overlapping region with the forward primer
of the second coding sequence.
First, the genes to be fused are amplified in separate PCRs. Then, the PCR
products are isolated and brought together in a reaction tube containing the forward
primer of the first sequence and the reverse primer of the second sequence, among the
other reagents necessary for a classical reaction, as described above. In the course of the
reaction, the strands with the matching sequences overlap, acting as primers for each
other and allowing extension by DNA polymerase. Therefore, the resulting molecule is
a product of recombined genes, whose original sequences were ‘spliced’ together (Ho et
al., 1989; Horton et al., 1989). Reactions were basically run as described above in this
section.
1.2. Agarose gel electrophoresis
Agarose gel electrophoresis is a method used for determination of length and purity of
DNA molecules that migrate in an electric field (Aaij and Borst, 1972). Double-
stranded DNA molecules pass through the gel at rates that are inversely proportional to
the log10 of the number of base pairs. Large DNA fragments migrate through the matrix
pores with less efficiency in comparison to smaller molecules (Sambrook et al., 1989).
Migration patterns of DNA molecules also depend on molecular conformation and
Methods
69
agarose concentration. Since the phosphate backbone confers negative charge to nucleic
acids, these molecules migrate toward the positive electrode under the selected buffer
conditions (TBE, pH 8.3).
An appropriate amount of agarose (0.8-1% w/v) was diluted in 1× TBE buffer
and heated in a microwave oven until it was completely dissolved. After cooling to 50-
60°C, the solution was poured into a mould and allowed to gelatinize. After
solidification, the gel was submerged in 1X TBE running buffer. The DNA samples
were mixed with “Gel Loading Buffer” (5:1) before being loaded on the agarose gel.
This buffer also contains glycerol, which enhances the density of the samples, rendering
them to sink into the pockets. Electrophoresis was performed at approximately 8 V/cm.
The electrophoretic separation was monitored by the position of dyes (bromophenol
blue and xylene cyanol). Smart Ladder (range 200 bp – 10,000 bp, Fermentas) or Quick
Load 100 bp DNA Ladder (range 100 bp – 1517 bp, New England Biolabs) were used
as molecular weight markers.
After electrophoresis, the gel was incubated for 10 minutes in a water bath
containing 0.3 ‰ (v/v) ethidium bromide. This dye intercalates between base pairs of
nucleic acids, generating fluorescent complexes which can be visualised under UV
light.
1.3. Elution of DNA fragments from agarose gels
Reisolation of DNA fragments was performed with the “E.Z.N.A. Gel Extraction Kit”
(Omega Biotek). This procedure relies on the melting of agarose and subsequent
binding of the DNA to a membrane in the presence of chaotropic ions. The desired
DNA band was excised from the ethidium bromide stained agarose gel with a scalpel
and placed into a 2 ml tube. The gel slice was melted in 400 µl of XP2 binding buffer at
65°C for 7 minutes. The mixture was transferred to the silica column and centrifuged at
13,000 rpm for 1 minute. Then, the column was washed with 300 µl of XP2 binding
buffer, followed by 700 µl of SPW wash buffer. The column was further centrifuged for
2 min at 13,000 rpm to dry the matrix and 30 µl of sterile distilled water were added.
After 2 minutes, the DNA was eluted by centrifugation at 13,000 rpm.
Methods
70
1.4. Restriction enzyme digestion of plasmid DNA
Restriction enzymes are endonucleases of bacterial origin that bind to double-stranded
DNA at specific sites, breaking phosphodiester bonds inside or beyond the recognition
sequence. Restriction endonucleases have been divided into three groups (type I, type II,
type III), and type II enzymes are the most routinely used in molecular cloning, since
they digest the DNA within the recognition sequence. Some restriction endonucleases
generate staggered cuts, leaving short, 5’ or 3’ single-stranded overhanging ends at the
tails of the fragments, which are known as cohesive or sticky ends. Other DNA
endonucleases generate blunt-ended fragments. The majority of the recognition
sequences are 4-8 base pairs long and palindromic, i.e., rotationally symmetrical
(Bigger et al., 1973; Sambrook et al., 1989).
Restriction digestion was performed using 5 U of the specific enzyme, 0.5–2 µg
plasmid DNA, the correspondent buffer properly diluted (10-fold or 5-fold dilutions,
depending on the enzyme), and sterile distilled water to 20 µl. If DNA preparations
were derived from alkaline lysis, 5 U of RNase A was added in order to degrade any
remaining RNA in the sample. Reactions were incubated at the optimum temperature
for each enzyme (generally 37°C) for 1.5 h, then mixed with “Gel Loading Buffer” and
analyzed by agarose gel electrophoresis.
1.5. Cloning of PCR products using AccepTor Vector Kit
PCR amplification products were ligated to pSTBlue-1 vector (Novagen) for
sequencing purposes. This linearized vector contains single 3’-dU overhangs, providing
optimal conditions for ligation with PCR fragments generated by some thermostable
DNA polymerases, like Taq polymerase, which add single 3’-dA to the amplified
products. The dU residues are substituted for dT residues as the plasmid is replicated
within bacteria.
A typical ligation reaction of a PCR product in the pSTBlue-1 vector was
performed as follows: 0.5 µl (25 ng) of pSTBlue-1 vector were mixed with 1 µl of the
purified PCR product and 2.5 µl of “Clonables 2× Ligation Premix”. Water was added
to 5 µl and the reaction tube was incubated for 1 h at 16°C. After that, the ligation
product was used to transform “NovaBlue Singles Competent Cells” (Novagen), as
described in section 4.1.
Methods
71
Colonies were screened for the presence of insert in the pSTBlue-1 plasmid
following the method for blue/white selection. The pSTBlue-1 plasmid contains a gene
which codes for a lacZ α-peptide that complements the lacZ ω-fragment produced by
the E. coli strain supplied with the kit. The resulting product, β-galactosidase,
hydrolizes the galactoside substrate X-gal (5-bromo-4-chloro-3-indolyl-β-D-
galactopyranoside) yielding 5,5'-dibromo-4,4'-dichloro-indigo, an insoluble blue
pigment, which confers the colony a blue phenotype. Inserts successful cloned into
pSTBlue-1 vector interrupt the sequence encoding the α-peptide, which generates a
white colony on X-gal/IPTG plates.
1.6. DNA ligation
Ligation of two DNA molecules involves the formation of a phosphodiester bond
between the 3’-hydroxyl group at the terminus of one strand and a 5’phosphate at the
end of another strand, in a reaction that consumes ATP. In molecular cloning,
bacteriophage T4 DNA Ligase is the most routinely used enzyme, as it can efficiently
link blunt-ended DNA segments under normal reaction conditions (Sambrook et al.,
1989; Nelson and Cox, 2005).
Sticky-end ligation
A previously digested and purified DNA fragment was mixed with the correspondent
vector DNA carrying compatible cohesive ends. Normally, a threefold molar excess of
the insert in comparison to the vector was used. For a typical 20-µl reaction, 1 U of T4
DNA Ligase and 2 µl of 10× ligation buffer containing ATP were added. If necessary,
sterile distilled water was added up to 20 µl. Reactions were incubated overnight at
16°C or for 2 h at room temperature. After that, the ligation mixture was dialyzed
against 10% glycerine on a nitrocellulose membrane (0.025 µm mean pore size,
Millipore) at room temperature, for 1 h.
Blunt-end ligation
In order to fill recessed 3’ termini or to digest protruding 3’ ends created by digestion of
DNA with restriction enzymes, the large fragment of DNA polymerase I (Klenow
Fragment) was used. Klenow Fragment is a product of proteolytic cleavage of E. coli
Methods
72
DNA polymerase I which possesses polymerization and 3'→ 5' exonuclease activities,
but no 5'→ 3' exonuclease activity (Klenow and Henningsen, 1970). Klenow was used
to generate blunt ends by removing of 3´ overhangs or filling-in of 5´ overhangs. For
removal of protruding 3´ ends, 2 U of Klenow enzyme were added to the digestion
reaction after 1.5 h restriction, and the volume was brought up to 30 µl with sterile
distilled water and restriction enzyme buffer. Samples were incubated for 1 h at 37°C
and subsequently purified with “E.Z.N.A. Gel Extraction kit” for further digestion. For
filling 5´ overhangs, 4 µl 10 mM dNTPs were also added to the reaction mixture.
Ligation was performed as follows: for a 20-µl reaction, specific volumes of
insert and vector were mixed with 1 µl of 10 mM ATP, 1 µl of 40% PEG 8000, and 1 U
of T4 DNA Ligase. PEG 8000 is a condensing agent, which enhances macromolecular
crowding, increasing the efficiency of ligation reactions (Zimmerman and Pheiffer,
1983). Reactions were incubated overnight at 16°C and dialyzed on a filter membrane,
as described previously for sticky-end ligation.
1.7. Determination of DNA concentration and purity
Spectrophotometric determination of DNA concentration relies on the fact that nucleic
acids strongly absorb UV light at 260 nm. Since the aromatic amino acids
phenylalanine, tyrosine and tryptophane absorb strongly at 280 nm, purity of DNA
preparation can be assessed by the quotient A260/A280. An optimum A260/A280 ratio
ranges between 1.8-2.0 for a cuvette spectrophotometer. Values under 1.8 indicate
protein contamination, whereas values above 2.0 suggest the presence of RNA in the
sample.
One microliter of a DNA solution was mixed with 59 µl of sterile distilled water
and transferred to a 1 cm-thick quarz cuvette. Water was used as reference.
Concentrations were calculated in µg/ml.
Alternatively, the DNA concentration was roughly estimated by comparing the
intensity of the DNA band to a molecular marker of known concentration. Two
microliters of DNA solution were mixed with GLB and water to a final volume of 10
µl, applied on 1% agarose gel and allowed to migrate a certain distance, so that the
bands of the marker would be well separated. After incubation of the gel in ethidium
bromide bath for 30 minutes (for sufficient staining of the less concentrated bands),
bands were visualized under UV light for direct comparison.
Methods
73
1.8. DNA sequencing
DNA sequence analysis by the dideoxy chain termination method (Sanger, 1977) makes
use of labeled dideoxynucleotides as chain terminating agents. A new DNA strand is
synthesized, starting from a specific primer, and synthesis is interrupted after
incorporation of a dideoxynucleotide. The reactions are base-specific, so that the sizes
of the fragments are used to determine the exact positions in which a specific base
appears. At the very end of the procedure, four sets of labeled fragments are present,
which are then separated on a gel matrix and identified by a detector (Nelson and Cox,
2005).
Aliquots of miniprep-purified plasmid DNA (75 ng/µl) were subjected to
sequence analysis to confirm the predicted nucleotide sequences. For verification of
inserts cloned into the pSTBlue-1 vector the oligonucleotide primers T7 and SP6 were
used. Analyzes were performed on an automated DNA sequencer (GATC Biotech,
Konstanz, Germany). Data analysis was carried out using the softwares Chromas Lite
(Technelysium Pty Ltd) and GeneRunner (Hastings Software, Inc.).
1.9. Plasmid DNA extraction
1.9.1. Alkaline lysis
The alkaline lysis is the most routinely used method for isolation of plasmid DNA.
Bacteria are first resuspended in the osmotic stabilizing solution GTE. EDTA
destabilizes cell membranes by complexing with divalent cations. Then, cells are lysed
with SDS and NaOH denatures chromosomal DNA (unlike close circular DNA, linear
chromosomal DNA denatures upon exposure to alkaline pH). By adding potassium
acetate, the pH is neutralized, causing chromosomal DNA to aggregate, and protein-
SDS complexes and high-molecular weight RNA to precipitate. Thus, plasmid DNA
can be separated from the major contaminating macromolecules by centrifugation and
subsequently concentrated by ethanol precipitation (Birnboim and Doly, 1979).
A single bacterial colony was picked and inoculated in 5 ml of LB medium
supplemented with the appropriate antibiotic. The culture was incubated overnight at
37°C and 220 rpm. Solutions needed for isolation are described in Section 3.3 of
Materials. Cells from 1.5 ml culture were centrifuged at 13,000 rpm for 30 s. The
bacterial pellet was resuspended in 100 µl of GTE solution by vigorous vortexing. After
Methods
74
3 minutes of incubation at room temperature, 200 µl of NaOH/SDS were added. The
contents were mixed by inverting the tube rapidly and the tube was stored on ice for 5
min, after which 150 µl of potassium acetate were added. The tube was inverted for 10
seconds, stored for another 5 minutes on ice and then centrifuged at 13,000 rpm for 5
minutes at 4°C to pellet cell debris and chromosomal DNA. The supernatant was
transferred to a fresh 1.5 ml tube. The double-stranded plasmid DNA was precipitated
with 1 ml of ethanol at room temperature. After mixing, the mixture was incubated for 3
minutes at room temperature and centrifuged at 13,000 rpm for 10 min at 4°C. The
supernatant was removed and the DNA pellet was allowed to dry at 60°C for 10
minutes. The pellet was dissolved in 20 µl of distilled water at 60°C and stored at -
20°C. For restriction endonuclease digestion purposes, residual low-molecular weight
RNA was degraded by DNase-free RNase.
1.9.2. Plasmid DNA isolation with Miniprep-kit
By exploiting the selective binding of plasmid DNA to a silica membrane, this method
allows the isolation of plasmid DNA without RNA. After a modified alkaline lysis of
bacterial cells and removal of cellular debris by centrifugation, the supernatant is loaded
onto a silica membrane. Chaotropic salts lead to denaturation of contaminants, which
are washed away with wash buffers. Selectively bound circular DNA can then be eluted
from the membrane.
A bacterial colony grown on selective LB agar medium was inoculated in 5 ml
of liquid LB containing the appropriate antibiotic and incubated overnight at 37°C,
under agitation of 220 rpm. Cells from 4 ml culture were centrifuged at 13,000 rpm for
1 minute. Supernatant was discarded and the bacterial pellet was treated with reagents
of the “peqGOLD Plasmid Miniprep Kit II” (Peqlab) for plasmid DNA purification.
First, the pellet was thoroughly resuspended in 500 µl Solution I containing RNase.
Then, 500 µl of Solution II was added for lysis and the reagents were mixed by
inversion. After a short incubation period at room temperature (~ 3 minutes), 700 µl of
Solution III were added for neutralization. The tube was repeatedly inverted and
centrifuged at 13,000 rpm for 10 minutes (room temperature). The clarified supernatant
was transferred to the silica membrane and centrifuged for 1 minute at 10,000 rpm. This
step was followed by two sequential washes, with 600 µl HB buffer and 850 µl wash
buffer, respectively. The membrane was dried by further centrifugation at 13,000 rpm
Methods
75
for 2 minutes and the column was transferred to a 1.5 ml eppendorf tube. The plasmid
DNA was eluted after incubation with 40 µl sterile water for 2 minutes at room
temperature and a centrifugation step at 13,000 rpm for 2 minutes. The purified DNA
was kept at -20°C for any downstream application.
1.10. Isolation of genomic DNA from yeast
For PCR amplification of sequences within yeast genomic DNA, yeast cells were
mechanically broken and the DNA was isolated upon extraction with
phenol/chloroform/isoamyl alcohol and ethanol precipitation. This protocol was adapted
from Hoffman and Winston (1987).
One mililiter from a yeast culture grown overnight was centrifuged at 11,000
rpm for 3 minutes (room temperature), washed once with 1.5 ml distilled water and
resuspended in 100 μl of lysis buffer. Then, approximately 0.03 g of glass beads were
added, followed by addition of 100 μl of phenol/chloroform/isoamyl alcohol (25:24:1
v/v/v). Yeasts were lysed by vortexing for 3 minutes. Subsequently, 100 μl of TE were
added, briefly vortexed, and the mixture was centrifuged at 12,500 rpm for 5 minutes.
The aqueous phase was carefully transferred to another microcentrifuge tube and
incubated with 1 ml of 99% ethanol. The tube was kept at -20°C overnight and then
centrifuged at 12,500 rpm for 3 minutes at 4°C. The DNA pellet was washed twice with
70% ethanol, air-dried, dissolved in 30 μl distilled water and kept at -20°C until use.
2. Culture conditions
2.1. E. coli
E. coli was cultured in LB medium at 37°C and 220 rpm. Plates containing LB agar
medium were incubated overnight at 37°C. For culture of bacteria carrying recombinant
plasmid DNA, LB medium was supplemented with 100 μg/ml ampicillin or 25 μg/ml
kanamycin. For blue/white screening of colonies, 20 μl of X-gal stock solution (40
mg/ml) and 20 μl of IPTG stock solution (100 mM) were spread on agar plates
containing kanamycin.
Methods
76
2.2. Yeasts
All yeasts were cultivated aerobically either in YPD or in complete SC medium at 30°C,
under agitation of 220 rpm. In order to induce hyphal growth of C. albicans, a culture
grown in YPD medium was shifted to YPD containing 10% FCS and incubated at 37°C
and 220 rpm for 6 h. With respect to solid media, untransformed yeasts were grown in
YPD, except for Sz. pombe, which was grown in YES medium.
When recombinant protein production was necessary, the species S. cerevisiae,
Sz. pombe, K. lactis and P. pastoris were cultivated as follows:
S. cerevisiae transformants were selected on uracil-deficient (ura d/o) SC agar
medium. Recombinant protein expression was achieved by culturing yeasts for 3 days in
ura d/o-glucose medium at 30 °C and 220 rpm.
For transformation purposes, Sz. pombe was grown in EMM low glucose
medium. Transformants were selected on EMM plates containing 15μM thiamine. To
induce expression from the nmt1 promoter, transformants were grown in EMM medium
lacking leucine for 3 days at 30 °C and 220 rpm.
K. lactis transformants were selected onto YCB agar medium. For expression of
heterologous proteins cells were cultured in inducing YPGal medium at 30 °C for 72 h.
After transformation of P. pastoris, cells were plated onto selective SC agar
medium lacking histidine (his d/o). Colonies were cultivated in BMG medium for 3
days. Then, cultures were centrifuged at 7,000 rpm for 5 min, resuspended in BMM
medium and cultivated for another 3 days. Methanol (final concentration = 0.5%) was
added every 24 h to induce recombinant protein expression.
2.3. Mammalian cells
All mammalian cells were cultured in tissue culture flasks at 37°C under 5% CO2
atmosphere, unless otherwise stated.
2.3.1. IC-21 mouse peritoneal macrophages
For routine passaging of IC-21, cells were grown until approximately 80% confluence,
then the culture medium was aspirated and cells were detached from flasks with cold
PBS for approximately 10 minutes. Subsequently, cells were splitted 1:3 with pre-
warmed culture medium in 25 cm2 tissue culture flasks and incubated for 3-4 days.
Methods
77
2.4. Freezing and thawing cells
2.4.1. Bacteria and yeasts
Bacteria and yeast stocks were prepared by mixing equal volumes of a grown culture
and 99% sterile glycerol. Cryogenic vials were stored at -80°C. For recovering of a
stored microorganism, the strain was scraped with a pipette tip and streaked onto a
proper agar plate.
2.4.2. Freezing mammalian cells
Cells were counted, centrifuged at 300× g at 4°C, and resuspended with culture medium
in one half the volume needed to give the desired cell concentration. Subsequently, the
same volume of 2× freezing medium was added dropwise and the suspension was
carefully mixed. Cells were aliquoted in sterile cryogenic vials, frozen at -80°C
overnight, and then transferred to a liquid nitrogen tank.
2.4.3. Thawing mammalian cells
Cells in a storage vial were thawed in a water bath at 37°C for 2 minutes and then
transferred to a 15 ml tube containing 5 ml pre-warmed culture medium. After
centrifugation at 300× g for 10 minutes at 4°C, supernatant was discarded and the pellet
was resuspended with 5 ml culture medium. After that, cells were plated at a density of
1×10⁶ cells/ml in 75 cm2.
3. Cell number determination
3.1. Optical density
The optical density of a bacterial or yeast culture in liquid medium was determined
spectrophotometrically at the wavelength λ = 600 nm in a 1 cm-thick cuvette against
sterile medium.
Methods
78
3.2. Determination of yeast cell number
The total number of yeast cells in a culture was determined by light microscopy with a
Neubauer hemacytometer (0.1 mm depth). Yeast cells were properly diluted in PBS and
counted in 80 squares. The cell number was then calculated using the formula: yeast
cells/ml = number of yeasts counted in 5 large squares × number of large squares in the
entire chamber × dilution × (chamber volume)-1. The chamber volume was 10-4 ml and
there were 5 large squares in the chamber. Therefore, yeasts/ml = number of yeasts in 5
large squares × 5 × dilution factor × 104.
3.3. Determination of mammalian cell number
The total number of mammalian cells was determined using a hemacytometer
“Neubauer improved” (0.1 mm depth). Cells were diluted in PBS as needed and clumps
were dispersed. Cells were counted in the four corner squares and the mean value was
determined. The total number of cells per milliliter was calculated as follows: cells/ml =
average count per square × dilution factor × 104 (Phelan, 2007).
4. Transformation methods
4.1. E. coli transformation
Preparation of electrocompetent bacteria
Electrocompetent cells become permeable to nucleic acids upon exposure to high-
strength electric fields. Bacteria are grown to mid-log phase and washed thoroughly in a
low conductivity medium such as glycerol to reduce the ionic strength of the cell
suspension (Miller and Nickoloff, 1995).
Six mililiters of an E.coli DH5α or TOP10 overnight culture were inoculated in
300 ml LB medium and cultured at 37°C, 220 rpm, until OD600 = 0.6-0.8. The culture
was placed on ice for 5 minutes, then centrifuged at 6,000 rpm for 10 minutes at 4°C
and the pellet was washed twice with 100 ml of ice-cold 10% glycerol. Next, cells were
resuspended in the remaining fluid and transferred to sterile 1.5 ml eppendorf tubes on
ice. After centrifugation for 5 minutes at 8,000 rpm (4°C), the supernatant was
Methods
79
discarded, cell pellets were resuspended with the remaining fluid and stored as 40-µl
aliquots at -80°C.
Transformation of competent bacteria by electroporation
In the electroporation process, short electric impulses of high frequency produce
transient pores in the outer membranes of exponentially grown cells, which are then
able to take up high molecular mass molecules, such as DNA (Calvin and Hanawalt,
1988; Dower et al., 1988). This method allows highly efficient transformations, up to
109-1010 cfu/µg plasmid DNA (Dower et al., 1988).
A 40-µl aliquot of competent E. coli DH5α or TOP10 was thawed on ice and
incubated with plasmid DNA (50-200 ng) for 5 min. If cells were incubated with the
product of a ligation reaction, this latter had to be previously dialyzed against a 10%
glycerol solution for 1 h in order to reduce the salt content. Too high salt or DNA
concentrations in the electroporation cuvette result in arcing, which damages the cells.
The mixture was then transferred to a prechilled electroporation cuvette (2 mm gap) and
the cells were pulsed at 2,5kV/cm, 200Ω, 25 µF in an electroporator (“Gene Pulser II”,
BioRad). Immediately after the pulse, cells were incubated with 500 µl SOC medium at
37°C under agitation of 220 rpm for 1 h. After this period, the transformed cells were
plated in suitable dilutions on selective LB agar plates and incubated overnight at 37°C.
Transformation of Nova Blue Singles™ competent bacteria
Nova Blue Singles™ competent bacteria were transformed with pSTBlue-1 vectors
containing PCR-derived inserts. These chemically competent bacteria belong to the
AccepTor™ kit.
Competent cells were thawed on ice for 5 minutes. Then, 1 μl of the ligation
reaction was added directly to the cells and the tube was incubated on ice for 5 minutes.
Subsequently, tubes were heated for 30 s at 42°C in a water bath and immediately
placed on ice. After 2 minutes, cells were given 250 μl of SOC medium at room
temperature and shaken at 220 rpm for 45 minutes before being plated on LB agar
medium supplemented with kanamycin, X-gal, and IPTG, as described in section 2.1 of
Materials. Plates were incubated overnight at 37°C.
Methods
80
4.2. Transformation of S. cerevisiae
The most common procedure for introducing plasmid DNA into S. cerevisiae cells is
the lithium-acetate method. This technique was first described by Ito et al. (1983), who
observed that alkali metal ions, especially Li+, are able to induce the uptake of DNA by
yeast cells. Addition of PEG and a heat-shock by 42°C have been shown to improve
transformation (Ito et al., 1983). Schiestl and Gietz (1989) demonstrated that adding
heat-denatured salmon sperm DNA to LiAc competent cells led to increased
transformation efficiency (approximately 105 transformants per µg DNA), since it
functions as carrier DNA. Interactions between negatively charged PEG, monovalent
cations, and the yeast cell surfaces alter membrane charges, which may lead to
conformational changes. The effectiveness of monovalent cations might be attributed to
a mild chaotropic effect (Kawai et al., 2010).
A volume of 2 ml of an overnight S. cerevisiae culture grown in YPD was
centrifuged at 7,000 rpm for 5 min. Solutions for S. cerevisiae transformation are
described in Section 3.6. The cell pellet was washed with 500 µl of LiAc/TE solution
and resuspended in 200 µl of this solution. To this yeast suspension 20 µl of salmon
sperm DNA, 2 µl of plasmid DNA (from an alkaline lysis), 600 µl of PEG solution and
50 µl of 10× LiAc were added. The cells were incubated at 30°C under agitation at 220
rpm for 2 h and then heat-shocked at 42°C for 15 min. After that, yeasts were spun at
13,000 rpm, washed twice with 500 µl of TE solution and resuspended in 500 µl of TE.
Cells were plated as 250 µl aliquots on ura d/o plates and incubated at 30°C for 3 days.
4.3. K. lactis transformation (New England Biolabs)
Transformation of chemical competent K. lactis cells was performed using the kit “K.
lactis Competent Cells” and “NEB Yeast Transformation Reagent” (New England
Biolabs). A linearised pKLAC1-derived expression cassette is introduced into
chemically competent cells and integrates at the LAC4 locus in the K. lactis genome.
Selection of transformants is based on growth onto acetamide-containing medium. The
amdS gene in the pKLAC1 vector codes for acetamidase, which breaks down acetamide
to ammonia, which in turn can be used by K. lactis as a nitrogen source.
A tube of K. lactis GG799 Competent Cells was thawed on ice. One hundred
and fifty five microliter of NEB Yeast Transformation Reagent was added to the cells.
The solution was homogenized by inverting the tube. Linearized pKLAC1-DNA
Methods
81
containing the gene of interest (1 μg) was added to the cell mixture. After an incubation
time of 30 minutes at 30°C, the cell mixture was heat-shocked by incubation at 37°C for
1 hour in a water bath. Cells were pelleted by centrifugation at 7,000 rpm for 2 minutes
and washed with 1 ml sterile deionized water. Cells were pelleted by centrifugation at
7,000 rpm for 2 minutes, resuspended in 1 ml YPD medium, transferred to a sterile
culture tube and incubated with shaking (220 rpm) at 30°C for 30 minutes. The cell
mixture was transferred to a sterile 1.5 ml microcentrifuge tube and pelleted by
microcentrifugation at 7,000 rpm for 2 minutes. The cell pellet was resuspended in 1 ml
sterile deionized water. One, 10 and 50 μl of the cell suspension were removed to
separate fresh sterile tubes each containing 50 μl of sterile deionized water. The entire
cell mixture from each tube was spread onto separate YCB Agar Medium plates
containing 5 mM acetamide. Plates were incubated at 30°C for 3 days.
4.4. Sz. pombe transformation by the rapid lithium acetate method
Of the several existing methods for transformation of Sz. pombe cells, the one that
yields the highest transformation frequency utilizes alkali cations. Kanter-Smoler et al.
(1994) have described for Sz. pombe an adaptation of the LiAc method developed for S.
cerevisiae.
Sz. pombe PW260 cells were grown in 5 ml EMM low glucose medium to a
density of 0.5 - 1.0 x 10⁷ cells/ml (2 - 3 days). Growth in low glucose medium has been
shown to increase transformation efficiency for this transformation method (Kanter-
Smoler et al., 1994). The cells were then harvested at 7,000 rpm for 5 min at room
temperature and washed twice with 1 ml of sterile water. Solutions for Sz. pombe
transformation are described in section 3.4. The cells were washed with 200 µl of
lithium acetate/EDTA and resuspended in 50 µl of lithium acetate/EDTA solution. After
that, 30 µl of TE buffer containing 1 µg of plasmid DNA and 300 µl of lithium
acetate/EDTA/PEG solution were added. Cells were incubated under agitation at 220
rpm at 30°C, for 30 min and then heat-shocked at 42°C for 15 min. The cells were
centrifuged at 7,000 rpm, resuspended in 1 ml of TE buffer, plated on EMM leu d/o
thiamine solid medium as 200 µl-aliquots and incubated for 5 days at 30°C.
Methods
82
4.5. P. pastoris transformation
Preparation of competent cells
P. pastoris (GS115 or KM71) was inoculated in 5 ml of YPD. The culture was
incubated at 30°C, under agitation at 220 rpm, for 16 hours. After this period, culture
was re-inoculated in 50 ml of YPD. This culture was cultivated at 30°C, 220 rpm, until
an O.D. of 0,8-1,0 was reached. After that, culture was centrifugated at 500 g, 5 minutes
at room temperature. Supernatant was discarded and cells were resuspended in 9 ml of
cold BEDS and 1 ml 1M DTT. The suspension was incubated at 30°C, under agitation
at 100 rpm, and centrifuged again as previously. Cells were ressuspended in 1 ml of
BEDS and frozen at -80°C as 55-µl aliquots.
Transformation
A 55 µl-aliquot of competent cells was mixed with 5 µl of linearized plasmid DNA and
incubated on ice for 5 minutes. The mixture was transferred to a previously cooled
electroporation cuvette (2 mm) and subjected to a pulse of 200 Ω, 25 µF, 1.5 kV/cm.
Imediatelly after the pulse, cells were resuspended in 1 ml of cold 1M sorbitol and 0.5
ml of YPD, transferred to a sterile 15 ml tube and incubated at 220 rpm, 30°C, for 3
hours. After that, 750 µl of culture were plated onto his d/o agar medium. Plates were
incubated for 3 days at 30°C.
5. Protein Methods
5.1. Protein extraction from yeast cells or from cell-free culture medium
Mechanical shearing of yeasts by vortexing with glass beads releases their
cytoplasmatic contents by virtue of the abrasive action of the vortexed beads.
Protein extracts were prepared from 3×10⁸ yeast cells collected by centrifugation (7,000
rpm for 5 minutes), washed three times with PBS and resuspended in 200 µl of
disruption buffer containing a cocktail of protease inhibitors (Complete, Roche). One
volume of glass beads (0.5 mm diameter) was added and cells were disrupted using a
Beadbeater (Retsch) for 10 min at maximum speed at 4 °C. After cell breakage, the
soluble protein fraction was recovered by centrifugation at 13,000 rpm for 10 min at
4°C, transferred to new microcentrifuge tubes, and precipitated as described in section
5.3.
Methods
83
For analysis of secreted proteins, a volume of culture medium corresponding to
3×10⁸ cells was centrifuged at 7,000 rpm for 5 minutes to remove the cells.
Supernatants were transferred to new microcentrifuge tubes and concentrated by
employing one of the methods described in section 5.3.
5.2. Protein isolation from yeast cell walls
Glucanase extraction of proteins from yeast cell walls was performed as described by
Schreuder et al. (1993), with minor modifications. Yeast cells grown for three days
under inducing conditions were counted, and 3×10⁸ cells were centrifuged and washed
three times in ice-cold isolation buffer. Then, 3 ml of isolation buffer and 10 g of glass
beads were added per gram of cells (fresh weight) and yeasts were lysed in a Beadbeater
at maximum speed for 10 minutes. Cell extracts were transferred to a new tube, and
glass beads were extensively washed. Raw cell extracts and washes were pooled and
centrifuged for 5 minutes at 1,000 × g. Pellets were washed three times with 1 ml of 100
mM-sodium acetate, pH 5.0, containing 1 mM PMSF, and resuspended in the same
buffer (20 µl of buffer for 10 mg of cell walls). To this volume was added 0.5 mU of β-
1,3-glucanase (laminarinase), and the tubes were incubated for 2 h at 37°C. Then,
another 0.5 mU of laminarinase was added and the mixtures were further incubated for
2 h at 37°C. Afterwards, samples were centrifuged for 5 minutes at 12,000 rpm and the
supernatant was precipitated as described in section 5.3.
5.3. Protein precipitation
A number of precipitation techniques has been routinely used for recovery of proteins.
In order to concentrate proteins present in a large volume of a certain solution,
precipitation can be induced by addition of organic solvents or by changes in the pH, for
example.
Ethanol precipitation
Dehydration caused by ethanol makes proteins attract each other in such an extent that
they become insoluble in ethanol-water mixtures (van Oss, 1989). One volume of
culture supernatant was mixed with 3 volumes of 99% ethanol. Samples were kept
Methods
84
overnight at -80°C and centrifuged at 13,000 rpm for 30 min at 4°C. Pellets were
allowed to dry and subsequently resuspended in SDS-loading buffer.
Deoxycholate (DOC) and 2,2,2-trichloroacetic acid (TCA) precipitation
TCA is one of the most efficient agents used for protein precipitation, although its
mechanism of action has not been completely elucidated yet. Rajalingam et al. (2009)
suggested that the tricholoroacetate ions lead to protein unfolding by disrupting
electrostatic interactions. Partial unfolding of proteins gives rise to exposure of nonpolar
surfaces, resulting in intermolecular coalescence of protein molecules and consequently
precipitation. Addition of the detergent DOC improves recovery (Bensadoun and
Weinstein, 1976). To one volume of protein solution, 0.01 volume of 2% sodium
deoxycholate was added. Samples were vortexed and incubated for 30 minutes at 4°C.
Then, 0.1 volume of 100% trichloroacetic acid was added, and samples were incubated
overnight at 4°C after brief vortexing. Next, tubes were centrifuged at 15,000 rpm for
15 minutes at 4°C and the pellets were washed twice with 1 ml of cold acetone (kept at -
20°C). Samples were centrifuged for 5 minutes at 15,000 rpm between washes, allowed
to dry at room temperature, and resuspended in a minimal volume of SDS-loading
buffer.
5.4. Polyacrylamide gel electrophoresis
Polyacrylamide gel electrophoresis (PAGE) is a method that allows protein separation
by applying an electric field. This procedure is carried out under conditions that permit
dissociation of the proteins into their individual subunits and minimize aggregation.
Samples are denaturated at high temperatures with the anionic detergent sodium
dodecyl sulfate (SDS), which interacts with the hydrophobic amino acid residues of the
proteins, disrupting their folded structure and allowing them to adopt an extended
conformation. Since the amount of SDS bound is proportional to the molecular weight
of the polypeptide and independs on its sequence, SDS-polypeptide complexes migrate
through polyacrylamide gels at rates that reflect their sizes. The denatured polypeptides
become negatively charged and migrate towards the positive electrode (anode). A thiol
reducing agent such as β-mercaptoethanol is often used to reduce disulfide bonds within
or between molecules (Sambrook et al. 1989).
Methods
85
Following the classical system developed by Laemmli (1970), tris-glycine
polyacrylamide gels (8-12%) were assembled in a “Mini-PROTEAN 3” system
(BioRad) and run as a stacking gel bottomed by a running gel, in a discontinuous buffer
system, according to Sambrook et al. (1989). The resolving gel (10% polyacrylamide)
were prepared as follows (final volume = 10 ml):
Distilled water 4.0 ml
30% polyacrilamide mix 3.3 ml
1.5 M tris pH 8.8 2.5 ml
10% SDS 0.1 ml
10% APS 0.1 ml
TEMED 0.004 ml
The mixture was pippeted between two assembled glass plates (1.0 or 1.5 mm
spacer), followed by addition of 1 ml isopropanol. After polymerization, the
isopropanol was removed, plates were carefully dried, the stacking gel was poured and
the comb was inserted.
The stacking gel (5% polyacrylamide) was prepared in the following manner
(final volume = 5 ml):
Distilled water 3.4 ml
30% polyacrilamide mix 0.83 ml
1.0 M tris pH 6.8 0.63 ml
10% SDS 0.05 ml
10% APS 0.05 ml
TEMED 0.005 ml
After complete polymerization, the plates were loaded into the cassette, which in turn
was placed inside an electrophoresis chamber. Protein samples were mixed with SDS
buffer containing β-mercaptoethanol, incubated at 100°C for 10 minutes and loaded on
the gel. The “Page Ruler Prestained Protein Ladder” (Fermentas) was applied as a
molecular mass standard. After applying the samples, the gel was run in tris-glycine
buffer at a constant voltage of 150 V.
Methods
86
5.5. Western blotting
Western blotting is a method for immunologic detection of a specific protein
immobilized on a membrane. Proteins separated by electrophoresis are transferred to a
membrane, such as PVDF, which is then incubated with a specific antibody that
recognizes the protein of interest. Subsequently, the primary antibody is bound by a
secondary antibody (anti-immunoglobulin), which is normally coupled to an enzyme.
Addition of an appropriate substrate generates a detectable product (Towbin et al.,
1979).
After SDS-PAGE, the gel was incubated with transfer buffer for removal of
salts and detergents. The PVDF membrane was previously immersed in methanol and
then equilibrated with transfer buffer. One piece of transfer buffer-soaked Whatmann
filter paper was placed on the lower electrode of a semi-dry transfer apparatus, followed
by the PVDF membrane, the gel and another buffer-soaked filter paper. Transfer was
carried out at 0.85 mA/cm2, in a “Trans Blot SD Electroforectic Transfer Cell”
(BioRad) for 1.5 h.
The membrane was blocked overnight at 4°C in blocking buffer in order to
prevent nonspecific binding of the antibodies and then incubated for 1 h at room
temperature with a properly diluted primary antibody. The membrane was washed with
TBST for 15 min and then incubated for 1 h at room temperature with specific
peroxidase-conjugated anti-IgG diluted in blocking buffer, under agitation. This step
was followed by 15-min washes in TBST and TBS. The membrane was further
incubated with reagents of an enhanced chemiluminescence detection kit consisting of
luminol and peroxide solutions. The horseradish peroxidase coupled to the secondary
antibody catalyzes the oxidation of luminol by peroxide. This reaction generates a
product (3-aminophthalate) in an excited state, which emits light at 425 nm upon decay
to a lower energy state. Luminescence was detected and recorded by a ChemiDoc XRS
System (BioRad).
Protein quantitation was performed by comparison of the relative intensity of the
bands from 3×10⁸ cells or the corresponding amount of culture medium to a standard
curve of commercially available protein of known concentration by densitometry using
QuantityOne software (version 4.6.2, Bio-Rad).
Methods
87
5.6. VLP preparation and transmission electron microscopy (TEM)
The protocols for VLP isolation and preparation for TEM analysis were performed as
described by Powilleit et al., 2004. Yeasts are treated for spheroplast formation, lysed,
and the cell extract is submitted to two ultracentrifugation steps and dialysis before the
electron microscopy.
S. cerevisiae S86c transformed with pG[0]G/ovacytmut, pG[0]G/pp65, and pG
were inoculated in 8 ml ura d/o glucose for 72 h, transferred to 400 ml ura d/o medium
and grown to a density of 4-6×10⁷cells/ml at 30°C, 220 rpm. Next, cells were
centrifuged at 6,000 rpm for 5 minutes, washed with 50 ml of prechilled water and
subsequently with the same volume of spheroplasting buffer, and resuspended in 50 ml
spheroplasting buffer containing 2 mM DTT and 200 µg/ml zymolyase 20T. After 1.5 h
of incubation at 120 rpm and 30°C, spheroplasts were centrifuged for 20 min at 2,200
rpm (4°C) and washed with 50 ml of cold PBSES. Then, cells were resuspended in 10
ml PBSE and 10 g of micro glass beads (0.25–0.50 mm diameter) were added. Cells
were lysed by vortexing six times for 1 min, with 1 min intervals on ice. Total yeast
extracts were supplemented with 5 ml PBSE and pelleted at 10,000 rpm for 1 h at 4°C.
The supernatant (15 ml) was layered onto a 15-ml cushion of 45% sucrose and
ultracentrifuged at 19,000 rpm overnight at 4°C using a Beckman SW28 rotor. In this
step, only high molecular weight structures can pass the cushion and form a pellet. The
cushion pellet was gently resuspended in 1 ml PBSE, layered onto a linear density
gradient of 20–70% sucrose, and further ultracentrifuged at 20,000 rpm overnight at
4°C. After that, the gradient was fractionated into 2-ml fractions and the gradient pellet
was resuspended in 2 ml PBSE. Aliquots of each fraction were analyzed by SDS-PAGE
and western blotting. For reisolation of VLP, a maximum of 6 gradient fractions was
pooled and dialyzed against 5 l PBSE overnight (4°C) in membranes with an exclusion
limit of 14 kDa. The dialysed solution was concentrated to 200–500 μl using a 10 kDa
cut-off Vivaspin and examined for the presence of VLP by TEM analysis.
For TEM analysis, samples were adsorbed to poly-L-lysine-coated cupper grids
for 5 min. The grids were rinsed twice with distilled water, negatively stained with 2%
uranyl acetate for 5 min, and allowed to to air-dry. Samples were imaged with diverse
magnifications with a TECNAI 12 (FEI) transmission electron microscope at the
Department of Anatomy and Cell Biology of Medical Faculty at the Saarland University
(Homburg, Germany).
Methods
88
6. Cell- and immunobiology methods
6.1. Immunolabelling of yeasts
Immunostaining of yeasts was performed as follows: 100 µl of an exponentially
growing yeast culture were pelleted, washed three times with phosphate-buffered saline
(PBS, 10 mM potassium phosphate buffer, 150 mM sodium chloride, pH 7.4), and
resuspended in 100 μl PBS. The cell suspension was incubated with the primary
antibody at a dilution rate of 1:100 for 1 h at room temperature in an orbital shaker.
After the cells had been washed three times with PBS, the second antibody (FITC- or
PE-conjugated) was diluted to 1:100 and allowed to react with the cells at room
temperature for 1 h in the dark. The cells were then washed three times with PBS and
examined using either a fluorescence microscope (Keyence), or a confocal laser
scanning microscope equipped with a 560-615 nm filter (Zeiss LSM 510 meta).
Microscopic observations were carried out using 100× objectives. When necessary,
cells were analyzed by flow cytometry. Data for 50,000 events were collected.
For detection of mannose or chitin in yeast cell walls, staining was performed as
described above, except for the incubation steps with antibodies, which were substituted
for a one-step incubation with 200 μg/ml of Concanavalin A-FITC or wheat germ
agglutinin-FITC, respectively, in the dark (Buck and Andrews, 1999).
6.2. Staining cell surface antigens in mammalian cells
Cells were centrifuged at 1,400 rpm for 6 minutes, washed with PBS containing 10%
FCS and resuspended in 100 µl at a concentration of at least 106 cells/ml. Then, an
appropriate volume of antibody (previously determined by titration) was added to the
cells, and samples were vortexed and incubated on ice for 45 minutes in the dark. After
this period, cells were washed with 3 ml PBS containing 10% FCS, fixed with 150 µl of
FACS-Fix and kept at 4°C in the dark until flow cytometric analysis.
6.3. Intracellular cytokine staining in mammalian cells
Detection of intracellular molecules presupposes permeabilization of the cell membrane
in order to allow access of the antibodies to the antigens within the cells. Cells are
Methods
89
initially stimulated in the presence of a secretion inhibitor. Brefeldin A from Penicillium
brefeldianum destroys the structure and function of the Golgi apparatus, so that
secretion of proteins no longer occurs. Therefore, generally secreted proteins remain in
the cell interior and can be detected. Cells are then fixed to prevent leakage of the
proteins, permeabilized, and incubated with a specific conjugated antibody, which
penetrates the cell, subsequently binding to its target. Cells were made permeable upon
incubation with saponin, a surfactant from Quillaya saponaria bark that increases the
penetration of macromolecules through cell membranes (Jacob et al., 1991).
Cells were incubated in FACS-buffer containing 0.5% saponin for 10 minutes at
room temperature. Then, cells were centrifuged at 1,400 rpm for 6 minutes, supernatant
was discarded and the antibody was added to the cells in the remaining buffer. After
brief vortexing, cells were incubated on ice for 45 minutes in the dark, then washed with
2 ml of FACS-buffer, fixed with 150 µl of FACS-Fix and kept at 4°C in the dark until
flow cytometric analysis.
When both surface and intracellular staining in the same cell population was
necessary, stainings were carried out successively, i.e., cells were first stained for
surface molecules (as described above) and thereafter permeabilized with saponin for
intracellular staining.
6.4. Flow cytometry
Flow cytometry is a powerful method for detecting individual cells from a certain cell
population or subset, based on their morphologic characteristics (such as size and
granularity) and the presence of specific surface or intracellular molecules, which are
previous stained with fluorescent substances. A mixture of cells is forced with a sheath
fluid through a nozzle, which generates a stream of single cells. These cells pass
through a laser beam, scattering the light, and the fluorochrome molecules are excited,
emitting fluorescence. Photomultipliers sense fluorescence emissions and scattered
light. The fluorescence intensity gives information on the presence of a certain molecule
in the cell interior or on the cell surface. Scattered light is collected as forward scatter
(FSC) and side scatter (SSC). FSC measures the light scattered in the same axis of the
laser beam path and is proportional to the particle size. SSC is detected at approximately
90 degrees to the laser path and is directly proportional to cell granularity (Janeway et
al., 2001).
Methods
90
It is possible to set a gate on a FSC vs. SSC plot so that the resulting information
refers only to the cell population inside it. For two or three colour analysis, spectral
overlap compensation was performed.
Cells were stained as described in section 2.29 and examined on a FACScan or a
FACScalibur (Becton Dickinson). Data were analyzed using CELLQuest software
(Becton Dickinson).
6.5. Isolation of peripheral blood mononuclear cells (PBMC)
Dendritic cells can be obtained from isolated monocytes cultured with appropriate
cytokines. Mononuclear cells are isolated from peripheral whole blood by density
gradient centrifugation (Ficoll-Paque, 1.077 g/ml), which is a widely used method.
Lymphocytes and monocytes, according to their respective densities, accumulate in the
interphase between supernatant (which contains plasma and thrombocytes) and Ficoll
(where erythrocytes and granulocytes sediment by virtue of their higher densities).
Sallusto and Lanzavecchia (1994) demonstrated the generation of DCs from adult
peripheral blood in the presence of IL-4 and GM-CSF. This protocol has been widely
used, with some minor modifications.
Fresh human anticoagulated blood (100 ml) was obtained from the blood bank
of the Winterberg Klinik in Saarbrücken. Human blood was carefully transferred to five
sterile 50 ml tubes containing 15 ml PBS (Ca2+- and Mg2+-free) until a final volume of
35 ml each, and carefully mixed. The diluted cell suspension was gently transferred to
tubes containing 15 ml of the lymphocyte separation medium Ficoll-Paque. Tubes were
centrifugated at 1,600 rpm for 25 minutes at room temperature without brake, in order
to preserve the layering. Ten millilitres of plasma from each tube were discarded. The
white blood cell ring fraction (buffy coat with PBMC) was carefully aspirated and
transferred to new 50 ml tubes. The volume was adjusted to 50 ml per tube using PBS.
Samples were centrifuged for 6 minutes at 1,600 rpm (brake switched on) and the
supernatant was carefully discarded. Each pellet was resuspended in 5 ml of sterile
water to lyse remaining erythrocytes, immediately adding enough PBS to the PBMC to
make up 50 ml. Cells were centrifuged and this step was repeated until no red blood
cells could be seen. Cells were then joined in one tube by pipetting PBS from tube to
tube. Tubes were rinsed with PBS and volume was adjusted to 50 ml. After 10 minutes
of centrifugation at 900 rpm in order to eliminate trombocytes, the pellets were
Methods
91
resuspended in PBS and cells were counted under the light microscope, as described in
section 3.3.
6.6. Monocytes isolation and differentiation into dendritic cells
Monocyte isolation by adherence to plastic surfaces
The isolated PBMC were suspended in RPMI 1640 containing 10% heat-inactivated
FCS (LPS-free), 100 U/ml penicillin and 0.1 mg/ml streptomycin at a density of 7.5 ×
106 cells/ml, plated onto cell-culture flasks (20 ml culture for 125 cm2 area), and
incubated for 1.5 h at 37°C. Then, the peripheral blood lymphocytes (PBL), which do
not adhere to plastic surfaces, were harvested, centrifuged at 1,400 rpm for 6 minutes,
resuspended in PBS, counted, and properly frozen as described in section 2.4.2.
Adherent cells (monocytes) were gently rinsed with PBS to remove remaining
nonadherent cells. Monocytes were cultured at 7.5 × 10⁶ cells/ml in RPMI 1640
containing 10% heat-inactivated FCS (LPS-free), 100 U/ml penicillin, 0.1 mg/ml
streptomycin, 20 U/ml recombinant human IL-4, and 800 U/ml recombinant human
GM-CSF. Immature monocyte-derived dendritic cells (MDDCs) were obtained after
cells had been incubated at 37 °C with 5% CO2 for 7 days, and re-fed on day 3. Cells
harvested at day 7 were analyzed by flow cytometry for typical immature DC surface
phenotype (CD1a+, CD14low, CD80+, CD86+, HLA-I+, HLA-II+, CD83low) and
contamination with CD3+ T cells or CD19+ B cells.
Monocyte isolation by positive selection using magnetic microbeads
Alternatively, monocytes were isolated from PBMC using magnetic microbeads
conjugated with anti-CD14 antibody. Taking advantage of the fact that CD14 is strongly
expressed on the surface of monocytes, these cells can be labeled with anti-CD14 micro
beads. In the presence of a magnetic field, the cell suspension is applied onto a column,
and the magnetically labeled cells are retained, whereas the other cells pass through.
When the column is removed from the magnetic field, the CD14+ cells can be eluted.
Binding of antibody to CD14 does not trigger any signal transduction.
PBMC isolated as described in section 7.1 were counted and resuspended in
MACS buffer (80 µl per 107 cells). For 107 cells, 20 µl of anti-CD14 micro beads were
added, and the cell suspension was incubated for 15 minutes at 4°C. Then, 2 ml MACS
buffer were added per 107 cells. After centrifugation for 10 minutes at 1,200 rpm, the
Methods
92
supernatant was discarded and cells were resuspended in MACS buffer (50 µl per 107
cells). A column was placed in the magnetic field of a separator and rinsed with 3 ml of
MACS buffer. Then, the cell suspension was applied onto the column and the cells that
passed through were collected. The column was washed three times with 3 ml of MACS
buffer and subsequently placed on a sterile tube. Afterwards, 5 ml of buffer was
pipetted onto the column and the magnetically labeled cells were forced through the
column with a plunger. Cells were then incubated in tissue culture flasks containing the
appropriate medium to induce differentiation into DCs as described above in this
section.
6.7. Maturation of dendritic cells by different stimuli and analysis of cytokine
secretion
For maturation studies, day 7-immature dendritic cells were harvested, resuspended at
1×10⁶ cells/mL, plated in 24-well plates and incubated either with yeasts at a ratio of
1:1, or with other maturation factors (250 ng/ml LPS and 32 μl/ml of a lysate of
HCMV-infected fibroblasts), or left untreated, for 48 h, at 37°C in 5% CO2. Cells were
then analyzed by dual-color flow cytometry for classical surface maturation markers
using the following monoclonal antibodies: anti-HLA DP/DQ/DR FITC, anti-HLA
A/B/C PE, anti-CD80 PE, anti-CD83 PE, anti-CD86 FITC, anti-CD58 FITC, anti-CD54
PE, anti-CD40 FITC, anti-CCR7 PE. Cells were stained as described in section 6.2 and
fixed with 1% paraformaldehyde before flow cytometric analysis (section 6.4). DCs
were gated following characteristic forward/side scatter patterns. Data were collected
from 10,000 cells and expressed as median of fluorescence intensity of all cells, or
percentage of positive cells.
For quantitation of diverse cytokines secreted by stimulated DCs, supernatants
from DCs incubated with the various stimuli were collected and stored at -80°C until
analysis with a multiplex cytokine kit (PROGEN Biotechnik, Heidelberg, Germany).
6.8. Incubation of immature dendritic cells with yeast vectors
Human MDDCs were generated as described in section 6.6, collected on day 7 by
centrifugation at 1,400 rpm for 6 minutes, counted, and aliquoted at 106 cells/ml. For
phagocytosis of yeasts carrying pp65, 2×10⁶ DCs from HCMV-infected individuals
Methods
93
were incubated with yeasts expressing recombinant pp65 or harbouring empty vectors
(MOI 5) in sterile 50 ml tubes. Samples were briefly centrifuged, incubated for 2 days at
37°C and subsequently added to autologous T lymphocytes (Methods, section 6.9).
6.9. Stimulation of antigen-specific memory T lymphocytes by autologous dendritic
cells
For stimulation of antigen-specific memory T lymphocytes by autologous dendritic
cells from HCMV-seropositive donors, a protocol based on Scheller et al. (2008) was
used. Frozen lymphocytes obtained after monocyte isolation by adherence to plastic
(section 6.6) were thawed, washed twice with medium, and counted. Subsequently,
2×10⁶ cells were incubated in 15-ml tubes with 1 µg/ml of the costimulatory antibodies
anti-CD28 and anti-CD49d and with DCs (1:1) which had been previously incubated
with yeasts expressing pp65 or control yeasts. Samples were incubated for 2 h at 37°C,
then 10 µg/ml Brefeldin A were added and tubes were further incubated at 37°C for 4 h.
Subsequently, EDTA was added (final concentration = 0.4 mM), followed by
incubation at room temperature for 15 minutes. Thereafter, samples were incubated for
5 minutes with 0.008% EDTA in PBS. After centrifugation at 1,400 rpm for 6 minutes,
supernatants were discarded and 300 µl of 4% paraformaldehyde were added. After
incubation for 5 minutes at room temperature, 2 ml of FACS-buffer were added and
samples were centrifuged for 6 minutes at 1,400 rpm. Supernatants were discarded and
cells were stained for surface and intracellular antigens as described in sections 6.2 and
6.3 of Methods.
6.10. Measurement of ROS production in whole blood
The ability of phagocytes to produce reactive oxygen species (ROS) is a critical aspect
in host immune responses against potential pathogens. ROS play an important role as
antimicrobial agents by killing microorganisms directly and as signaling molecules
involved in various physiological pathways in neutrophils and macrophages (Fialkow et
al., 2007; Kelly et al., 2010). Chemiluminescence is a low-cost method used to examine
the respiratory burst of phagocytes. Luminol reacts with diverse ROS, such as
superoxide, hydrogen peroxide, and hydroxyl radicals, generating aminophthalate ion in
Methods
94
an excited state, which emits light when returning to the ground state (Marquette and
Blum, 2006).
Production of ROS by phagocytic cells in whole blood after incubation with the
yeasts S. cerevisiae, Sz. pombe, K. lactis and P. pastoris was examined. Yeasts were
grown in SC medium, washed three times with HBBS, counted and aliquoted at 108
yeasts cells/ml in HBBS. Then, yeasts were incubated at 65°C for 1 h or left at room
temperature before the chemiluminescence assay.
Fresh heparinised whole blood was 1:10 diluted in HBSS containing 0.1%
gelatine. Diluted blood samples were divided into three groups: stimulated, resting and
blank. In stimulated samples 90.5 μl diluted blood were incubated with 7.5 μl (2.5×10⁵
yeasts) of a yeast suspension (108 yeasts cells/ml in HBSS) and 2 μl of luminol solution
(final concentration = 400 μM/well); in resting samples the same volume of blood was
incubated with 7.5 μl HBSS and 400 μM luminol; in blank samples blood was
incubated with 2.5×10⁵ yeasts and 2 μl DMSO. All samples were plated in triplicates
(100 μl/well) in a white Lumitrac Greiner 96-well plate. Luminescence was recorded at
37°C over a 150-minute interval with 1s integration time, using a plate reader
(PARADIGM, BeckmanCoulter). Data were analyzed with the software Multimode
Analysis version 3.3.0.9 (BeckmanCoulter).
6.11. In vitro yeast phagocytosis assays
6.11.1. Determination of percent phagocytic cells and phagocytic index
Human dendritic cells or murine IC21 macrophages were seeded in 24-well plates at a
density of 1×10⁵ cells/well. In the case of macrophages, cells were allowed to adhere
overnight. Phagocytes were then incubated with yeasts at various MOI for 4 h or at
MOI 5 for various periods of time, in 1 ml culture medium per well, at 37 °C in 5%
CO2. Plates were briefly centrifuged to ensure that yeasts and cells were brought
together. After incubation, samples were vigorously resuspended to detach loosely
bound yeasts from cells. The cells were then washed with PBS and fixed in 1%
paraformaldehyde at 4 °C. At least 100 cells were examined per well for attachment and
uptake of yeasts by direct visual enumeration using a light microscope equipped with a
40× objective lens (Olympus) to determine the percentage of phagocytes containing at
least one yeast cell (% phagocytic cells) or the number of yeasts in 100 phagocytes
Methods
95
(phagocytic index). Experiments were performed in triplicate and results are shown as
mean ± standard deviation (SD).
6.11.2. Effect of blocking antibodies on yeast phagocytosis
Immature DCs or murine IC21 macrophages (1×10⁵cells/ml in the respective culture
media) were pre-incubated with 25 μg/ml of the mouse monoclonal antibodies anti-
human Dectin-1, or anti-human mannose receptor, as well as with a correspondent
isotype control antibody, in 24-well plates for 1 h at 37°C. All assays were performed in
media supplemented with heat-inactivated serum to exclude contributions of
complement. Yeasts were added at a 5:1 ratio and incubated for another 4 h. Mean ± SD
of triplicate experiments is shown. Student’s t test was used to establish the statistical
significance of differences between mean values using GraphPad Prism 4. One-sided p
values less than 0.05 were considered statistically significant.
6.12. Whole blood assay
The presence of antigen-specific memory T cells in human blood can be quantified by
means of a whole blood assay. The antigens are incubated with aliquots of whole blood
where they are taken up by phagocytic cells, processed and presented to CD4 and CD8
T lymphocytes in context of MHC class I and II, respectively. Activated T cells produce
certain molecules, such as CD69 on the cell surface and secreted IFN-γ. Simultaneous
staining of CD4 or CD8, CD69, and IFN-γ allows identification and determination of
the frequency of antigen-specific activated T lymphocytes. Incubation of cells with
Brefeldin A avoids secretion of IFN-γ, which remains intracellular and can be stained
for flow cytometric analyses after cell permeabilisation with saponin. The incubation
time of the assay (6 h) is not enough for activation of naïve T cells, so that only effector
and memory T cells are specifically stimulated (Breinig et al., 2006).
Whole blood assays were performed as described by Breinig et al. (2006).
Aliquots of 450 µl heparinized human blood were incubated in 15-ml polypropylene
tubes and mixed with 1 µg/ml of the costimulatory antibodies anti-CD28 and anti-
CD49d. As positive control, 2.5 µg/ml Staphylococcus enterotoxin B were used and
cells incubated with costimulatory antibodies only served as negative control. A lysate
of HCMV-infected fibroblasts (3.8 μl) was used to confirm whether donors were
positive for this virus.
Methods
96
The polypropylene tubes were incubated at 37°C and 5% CO2. After 2 h, 10
µg/ml of Brefeldin A were added and samples were further incubated for 4 h. After this
period, the blood was incubated for 15 min in the presence of 2 mM EDTA and then for
10 min with “FACS lysing solution” to lyse erythrocytes and fix leukocytes. Cells were
washed with FACS buffer (PBS, 5% FCS, 0.5% BSA, 0.07% NaN3) and let overnight at
4°C. Cells were then permeabilized with FACS buffer containing 0.1% saponin for 10
min and immunostained using saturating conditions of the antibodies anti-CD4 (4 µl),
anti-CD8 (4 µl), anti-IFNγ (5 µl, 1:10 diluted) and anti-CD69 (2 µl).
Cells were washed with FACS buffer, fixed in 1% paraformaldehyde and
analyzed (at least 25,000 of CD4- and CD8-positive lymphocytes each) on a FACScan
flow cytometer (Beckton Dickinson). Antigen-specific activated T lymphocytes were
identified and quantified as CD69 and IFN-γ double-positive cells.
6.13. In vitro antigen presentation assay
These experiments were performed in collaboration with Dr. Gernot Geginat at the
Institute for Medical Microbiology and Hygiene (Faculty for Clinical Medicine
Mannheim of the University Heidelberg).
Bone marrow macrophages from C57BL/6 mice were plated at a density of
1×10⁵ cells per well (100 μl DMEM high glucose supplemented with L-glutamine, 100
U/ml penicillin, 100 μg/ml streptomycin) in 96-well microtiter plates and loaded with
the different yeast genera (MOIs 1.75, 3.5, and 7), as well as with synthetic OVA257–264
peptide (SIINFEKL), or left untreated. Phagocytes and yeasts were brought together
after centrifugation at 300 rpm for 3 min. After overnight incubation at 37°C, infected
cells were washed twice and resuspended in culture medium supplemented with nystatin
(200 U/ml) to kill any remaining uninternalized yeast cells. T cells specific for the H-
2Kb-restricted epitope SIINFEKL were added 16 h after infection (3×10⁴/well). Culture
supernatants were harvested 18 h after addition of T cells and IFN γ protein content was
assessed using a specific enzyme-linked immunosorbent assay (ELISA) kit with a
detection limit of 0.05 pg (Bazan et al., 2011). The ELISA was carried out as directed
by the manufacturer. The amount of IFN-γ in individual wells was determined based on
a supplied recombinant mouse IFN-γ standard.
Methods
97
6.14. Immunization of OT-I mice
These experiments were carried out in cooperation with Elisabeth Kenngott at the
Medical Clinic for Rheumatology and Clinical Immunology (Charité, Berlin).
OT-I transgenic mice were immunized subcutaneously (s.c.) at the tail base with
5×10⁷ yeasts (either expressing Ovacyt or carrying empty vector), in 100 µl PBS, or with
PBS alone. Boost injections were given 7 and 14 days after priming. On day 21,
inguinal lymph nodes and spleens were collected for ex vivo restimulation and further
analysis of IFN- γ production.
6.15. Analysis of cellular immune responses in lymph nodes and spleen cells from
immunized OT-I transgenic mice
These experiments were performed in collaboration with Elisabeth Kenngott at the
Medical Clinic for Rheumatology and Clinical Immunology (Charité, Berlin).
Immunized OT-I mice were killed by cervical dislocation. Inguinal lymph nodes and
spleens were harvested one week after the last immunization. Single cell suspensions
were obtained by grinding the lymph nodes or spleens with a syringe plunger against
cell strainers in RPMI 1640 containing 10% FCS. Spleen cells preparations were
incubated with erythrocyte lysing solution for 3 minutes at 4°C. Cells were centrifuged
at 1,200 rpm at room temperature for 8 minutes, washed with PBS and counted.
Subsequently, 2×10⁶ lymphoid cells in 1 ml culture medium were restimulated in sterile
15-ml tubes with 10 µg/ml of SIINFEKL peptide or PMA/ionomycin, at 37°C under 5%
CO2 atmosphere. After 2 h of incubation, 10 μg/ml Brefeldin A were added and
SIINFEKL-stimulated cells were incubated for further 4 h, and PMA/ionomycin were
incubated for further 2h. Then, cells were harvested, washed with PBS/BSA, fixed with
2 % paraformaldehyde in PBS, washed twice with PBS/BSA and stained for the surface
molecules CD8 and Vβ5 TCR as described in section 6.2. Samples were left overnight
at 4°C in the dark. Afterwards, cells were centrifuged and resuspended in 100 µl PBS
containing 0.5% saponin, 10 µg/ml rat IgG and anti-IFN-γ PECy7 (100-fold diluted) or
PECy7-conjugated isotype control. After incubation at room temperature for 30
minutes, cells were washed with 1 ml of saponin buffer, then with 1 ml PBS, and
resuspended in 200 µl PBS prior to flow cytometric analyses on a FACSCanto (BD
Biosciences).
Methods
98
For determination of the frequencies of activated (IFN-γ-producing) cells, CD8+
Vβ5+ lymphocytes were gated. Samples were measured using a FACSCanto flow
cytometer equipped with a FACSDiva software (BD Biosciences) and analyzed using
Flowjo (Tree Star, Inc).
Results
99
IV. RESULTS
1. Effects of different yeast genera on maturation and activation of human
immature DCs
Interaction of non-pathogenic as well as disease-associated yeasts with mammalian
APCs such as DCs has been repeatedly demonstrated (Buentke et al., 2000; Newman
and Holly, 2001; Heintel et al., 2003). Here, the expression profile of diverse cell
surface markers and cytokines by DCs after incubation with distinct yeast genera,
species, strains, or yeast mutants was examined and compared in an attempt to identify
attractive antigen delivery vehicles for potential vaccination approaches.
1.1. Maturation of human DCs by diverse yeast genera
Maturation of human and murine DCs stimulated with whole yeasts or yeast
components has been described. Among the species analyzed are the baker’s yeast S.
cerevisiae, and the potentially pathogenic yeasts C. albicans, M. furfur and C.
neoformans (Buentke et al., 2001; Romani et al., 2004; Stubbs et al., 2001; Pietrella et
al., 2005). However, no study comparing several yeast strains with respect to their
ability to stimulate DCs has so far been performed.
Other inflammatory stimuli, such as bacteria and viruses, have also been
demonstrated to induce DC maturation (Rescigno et al., 1998; Rudolf et al., 2001). In
this way, DC responses to fungal, bacterial and viral stimuli were examined in the
present work. Immature DCs derived from PBMC of four individuals were cultured for
48 h with various yeast genera, E. coli LPS, a lysate from HCMV-infected fibroblasts,
or left untreated. Then, phenotypic analysis of DCs was performed by flow cytometry
using specific antibodies. The influence of each stimulus on DC maturation was
determined by analyzing changes in the expression of 9 surface markers (CD40, CD54,
CD58, CD80, CD83, CD86, CCR7, HLA I, and HLA II molecules).
The expression of all these molecules is upregulated in mature DCs. The initial
association of DCs with naïve T cells is mediated by cell-adhesion molecules, such as
CD54 and CD58 on DC surface and LFA-1 and CD2, respectively, on the T cell.
Costimulatory molecules, including CD80 and CD86, provide the second
(costimulatory) signal needed for the clonal expansion of antigen-specific T cells.
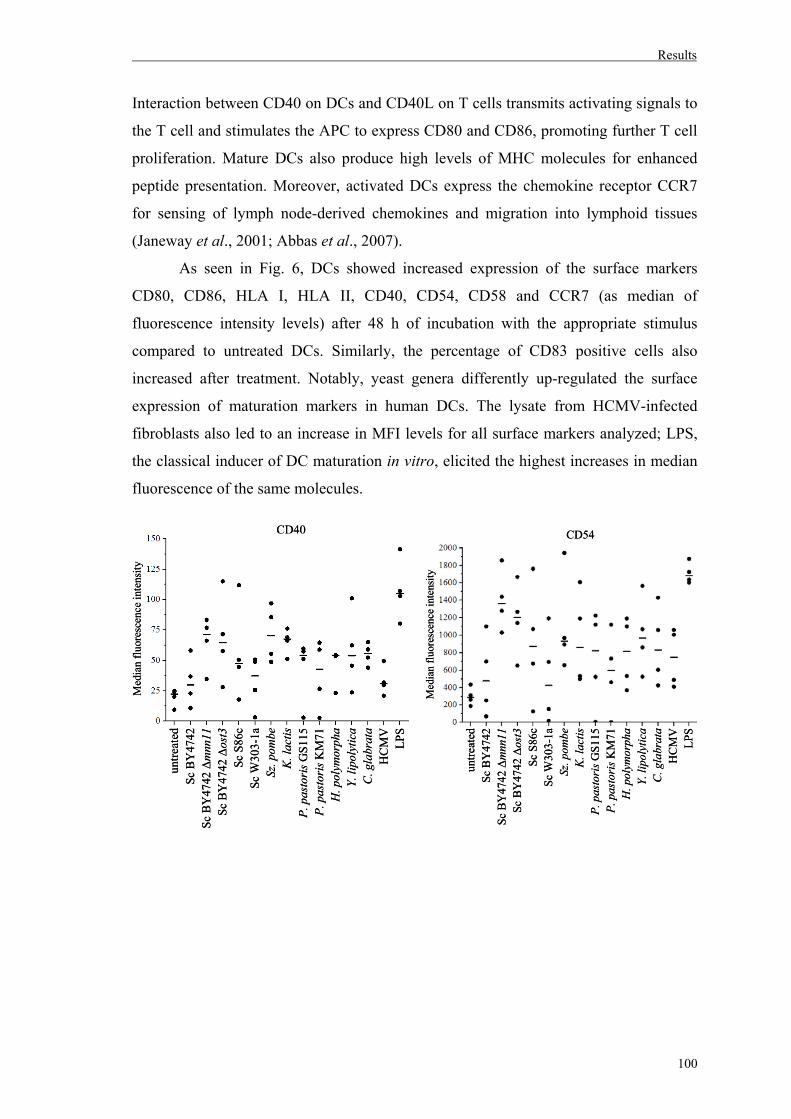
Results
100
Interaction between CD40 on DCs and CD40L on T cells transmits activating signals to
the T cell and stimulates the APC to express CD80 and CD86, promoting further T cell
proliferation. Mature DCs also produce high levels of MHC molecules for enhanced
peptide presentation. Moreover, activated DCs express the chemokine receptor CCR7
for sensing of lymph node-derived chemokines and migration into lymphoid tissues
(Janeway et al., 2001; Abbas et al., 2007).
As seen in Fig. 6, DCs showed increased expression of the surface markers
CD80, CD86, HLA I, HLA II, CD40, CD54, CD58 and CCR7 (as median of
fluorescence intensity levels) after 48 h of incubation with the appropriate stimulus
compared to untreated DCs. Similarly, the percentage of CD83 positive cells also
increased after treatment. Notably, yeast genera differently up-regulated the surface
expression of maturation markers in human DCs. The lysate from HCMV-infected
fibroblasts also led to an increase in MFI levels for all surface markers analyzed; LPS,
the classical inducer of DC maturation in vitro, elicited the highest increases in median
fluorescence of the same molecules.
CD54
Med
ian
fluor
esce
nce
inte
nsity
untre
ated
Sc B
Y47
42Sc
BY
4742
Δm
nn11
Sc B
Y47
42 Δ
ost3
Sc S
86c
Sc W
303-
1aSz
. pom
beK
. lac
tisP.
pas
tori
sGS1
15P.
pas
tori
sKM
71H
. pol
ymor
pha
Y. li
poly
tica
C. g
labr
ata
HC
MV
LPS
CD54
Med
ian
fluor
esce
nce
inte
nsity
untre
ated
Sc B
Y47
42Sc
BY
4742
Δm
nn11
Sc B
Y47
42 Δ
ost3
Sc S
86c
Sc W
303-
1aSz
. pom
beK
. lac
tisP.
pas
tori
sGS1
15P.
pas
tori
sKM
71H
. pol
ymor
pha
Y. li
poly
tica
C. g
labr
ata
HC
MV
LPS
Med
ian
fluor
esce
nce
inte
nsity
untre
ated
Sc B
Y47
42Sc
BY
4742
Δm
nn11
Sc B
Y47
42 Δ
ost3
Sc S
86c
Sc W
303-
1aSz
. pom
beK
. lac
tisP.
pas
tori
sGS1
15P.
pas
tori
sKM
71H
. pol
ymor
pha
Y. li
poly
tica
C. g
labr
ata
HC
MV
LPS
CD40
Med
ian
fluor
esce
nce
inte
nsity
untre
ated
Sc B
Y47
42Sc
BY
4742
Δm
nn11
Sc B
Y47
42 Δ
ost3
Sc S
86c
Sc W
303-
1aSz
. pom
beK
. lac
tisP.
pas
tori
sGS1
15P.
pas
tori
sKM
71H
. pol
ymor
pha
Y. li
poly
tica
C. g
labr
ata
HC
MV
LPS
CD40
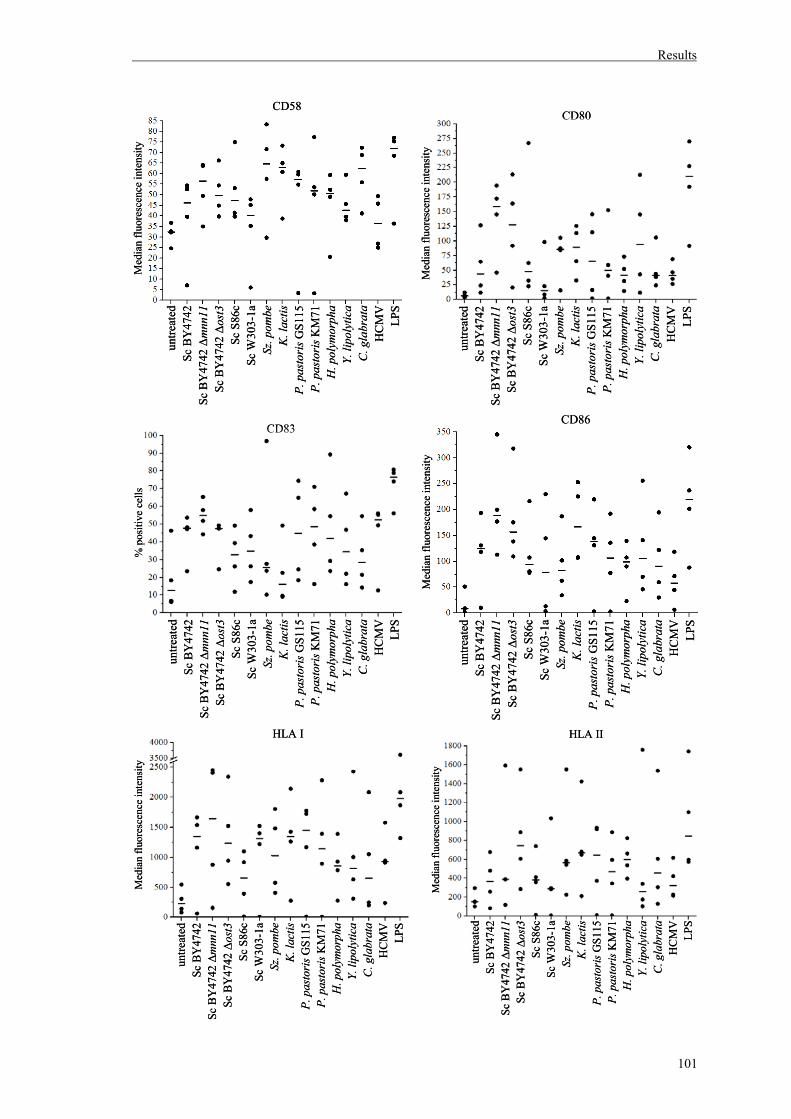
Results
101
untre
ated
Sc B
Y47
42Sc
BY
4742
Δm
nn11
Sc B
Y47
42 Δ
ost3
Sc S
86c
Sc W
303-
1aSz
. pom
beK
. lac
tisP.
pas
tori
sGS1
15P.
pas
tori
sKM
71H
. pol
ymor
pha
Y. li
poly
tica
C. g
labr
ata
HC
MV
LPS
HLA II
Med
ian
fluor
esce
nce
inte
nsity
untre
ated
Sc B
Y47
42Sc
BY
4742
Δm
nn11
Sc B
Y47
42 Δ
ost3
Sc S
86c
Sc W
303-
1aSz
. pom
beK
. lac
tisP.
pas
tori
sGS1
15P.
pas
tori
sKM
71H
. pol
ymor
pha
Y. li
poly
tica
C. g
labr
ata
HC
MV
LPS
HLA II
Med
ian
fluor
esce
nce
inte
nsity
Med
ian
fluor
esce
nce
inte
nsity
untre
ated
Sc B
Y47
42Sc
BY
4742
Δm
nn11
Sc B
Y47
42 Δ
ost3
Sc S
86c
Sc W
303-
1aSz
. pom
beK
. lac
tisP.
pas
tori
sGS1
15P.
pas
tori
sKM
71H
. pol
ymor
pha
Y. li
poly
tica
C. g
labr
ata
HC
MV
LPS
CD80
Med
ian
fluor
esce
nce
inte
nsity
untre
ated
Sc B
Y47
42Sc
BY
4742
Δm
nn11
Sc B
Y47
42 Δ
ost3
Sc S
86c
Sc W
303-
1aSz
. pom
beK
. lac
tisP.
pas
tori
sGS1
15P.
pas
tori
sKM
71H
. pol
ymor
pha
Y. li
poly
tica
C. g
labr
ata
HC
MV
LPS
CD80
Med
ian
fluor
esce
nce
inte
nsity
untre
ated
Sc B
Y47
42Sc
BY
4742
Δm
nn11
Sc B
Y47
42 Δ
ost3
Sc S
86c
Sc W
303-
1aSz
. pom
beK
. lac
tisP.
pas
tori
sGS1
15P.
pas
tori
sKM
71H
. pol
ymor
pha
Y. li
poly
tica
C. g
labr
ata
HC
MV
LPS
CD58
Med
ian
fluor
esce
nce
inte
nsity
untre
ated
Sc B
Y47
42Sc
BY
4742
Δm
nn11
Sc B
Y47
42 Δ
ost3
Sc S
86c
Sc W
303-
1aSz
. pom
beK
. lac
tisP.
pas
tori
sGS1
15P.
pas
tori
sKM
71H
. pol
ymor
pha
Y. li
poly
tica
C. g
labr
ata
HC
MV
LPS
CD58
untre
ated
Sc B
Y47
42Sc
BY
4742
Δm
nn11
Sc B
Y47
42 Δ
ost3
Sc S
86c
Sc W
303-
1aSz
. pom
beK
. lac
tisP.
pas
tori
sGS1
15P.
pas
tori
sKM
71H
. pol
ymor
pha
Y. li
poly
tica
C. g
labr
ata
HC
MV
LPS
CD83
% p
ositi
ve c
ells
untre
ated
Sc B
Y47
42Sc
BY
4742
Δm
nn11
Sc B
Y47
42 Δ
ost3
Sc S
86c
Sc W
303-
1aSz
. pom
beK
. lac
tisP.
pas
tori
sGS1
15P.
pas
tori
sKM
71H
. pol
ymor
pha
Y. li
poly
tica
C. g
labr
ata
HC
MV
LPS
CD83
% p
ositi
ve c
ells
Med
ian
fluor
esce
nce
inte
nsity
untre
ated
Sc B
Y47
42Sc
BY
4742
Δm
nn11
Sc B
Y47
42 Δ
ost3
Sc S
86c
Sc W
303-
1aSz
. pom
beK
. lac
tisP.
pas
tori
sGS1
15P.
pas
tori
sKM
71H
. pol
ymor
pha
Y. li
poly
tica
C. g
labr
ata
HC
MV
LPS
CD86M
edia
n flu
ores
cenc
e in
tens
ity
untre
ated
Sc B
Y47
42Sc
BY
4742
Δm
nn11
Sc B
Y47
42 Δ
ost3
Sc S
86c
Sc W
303-
1aSz
. pom
beK
. lac
tisP.
pas
tori
sGS1
15P.
pas
tori
sKM
71H
. pol
ymor
pha
Y. li
poly
tica
C. g
labr
ata
HC
MV
LPS
CD86
Med
ian
fluor
esce
nce
inte
nsity
untre
ated
Sc B
Y47
42Sc
BY
4742
Δm
nn11
Sc B
Y47
42 Δ
ost3
Sc S
86c
Sc W
303-
1aSz
. pom
beK
. lac
tisP.
pas
tori
sGS1
15P.
pas
tori
sKM
71H
. pol
ymor
pha
Y. li
poly
tica
C. g
labr
ata
HC
MV
LPS
HLA I
Med
ian
fluor
esce
nce
inte
nsity
untre
ated
Sc B
Y47
42Sc
BY
4742
Δm
nn11
Sc B
Y47
42 Δ
ost3
Sc S
86c
Sc W
303-
1aSz
. pom
beK
. lac
tisP.
pas
tori
sGS1
15P.
pas
tori
sKM
71H
. pol
ymor
pha
Y. li
poly
tica
C. g
labr
ata
HC
MV
LPS
HLA I
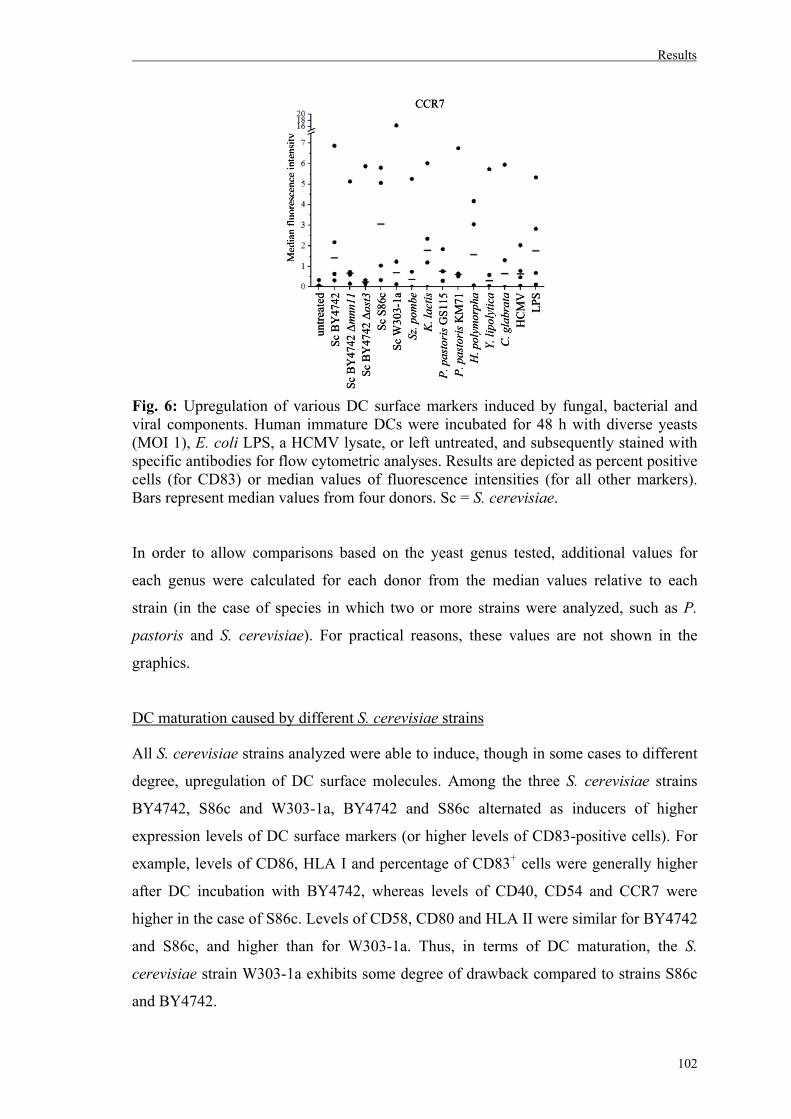
Results
102
Fig. 6: Upregulation of various DC surface markers induced by fungal, bacterial and viral components. Human immature DCs were incubated for 48 h with diverse yeasts (MOI 1), E. coli LPS, a HCMV lysate, or left untreated, and subsequently stained with specific antibodies for flow cytometric analyses. Results are depicted as percent positive cells (for CD83) or median values of fluorescence intensities (for all other markers). Bars represent median values from four donors. Sc = S. cerevisiae. In order to allow comparisons based on the yeast genus tested, additional values for
each genus were calculated for each donor from the median values relative to each
strain (in the case of species in which two or more strains were analyzed, such as P.
pastoris and S. cerevisiae). For practical reasons, these values are not shown in the
graphics.
DC maturation caused by different S. cerevisiae strains
All S. cerevisiae strains analyzed were able to induce, though in some cases to different
degree, upregulation of DC surface molecules. Among the three S. cerevisiae strains
BY4742, S86c and W303-1a, BY4742 and S86c alternated as inducers of higher
expression levels of DC surface markers (or higher levels of CD83-positive cells). For
example, levels of CD86, HLA I and percentage of CD83+ cells were generally higher
after DC incubation with BY4742, whereas levels of CD40, CD54 and CCR7 were
higher in the case of S86c. Levels of CD58, CD80 and HLA II were similar for BY4742
and S86c, and higher than for W303-1a. Thus, in terms of DC maturation, the S.
cerevisiae strain W303-1a exhibits some degree of drawback compared to strains S86c
and BY4742.
CCR7
Med
ian
fluor
esce
nce
inte
nsity
untre
ated
Sc B
Y47
42Sc
BY
4742
Δm
nn11
Sc B
Y47
42 Δ
ost3
Sc S
86c
Sc W
303-
1aSz
. pom
beK
. lac
tisP.
pas
tori
sGS1
15P.
pas
tori
sKM
71H
. pol
ymor
pha
Y. li
poly
tica
C. g
labr
ata
HC
MV
LPS
CCR7
Med
ian
fluor
esce
nce
inte
nsity
untre
ated
Sc B
Y47
42Sc
BY
4742
Δm
nn11
Sc B
Y47
42 Δ
ost3
Sc S
86c
Sc W
303-
1aSz
. pom
beK
. lac
tisP.
pas
tori
sGS1
15P.
pas
tori
sKM
71H
. pol
ymor
pha
Y. li
poly
tica
C. g
labr
ata
HC
MV
LPS
Results
103
DC maturation caused by different S. cerevisiae mutants
In order to verify the role of the yeast cell wall composition in DC maturation, two cell-
wall mutants of S. cerevisiae BY4742 were also tested, the Δmnn11 mutant, which lacks
an α-1,6-mannosyltransferase and cannot elongate mannan chains, and the Δost3
mutant, in which glycoproteins show an underglycosylated pattern due to the absence of
an oligosaccharyltransferase (Karaoglu et al., 1995; Jungmann and Munro, 1998). In
general, the mutants were more efficient than the parental strain in terms of
upregulation of DC maturation markers, except in the case of CCR7. Higher surface
marker levels (or percentage of positive cells) were observed after incubation of DCs
with Δmnn11, except for HLA II, which was detected in higher levels after stimulation
with Δost3 (Fig. 6). This higher activation induced by cell-wall mutants compared to the
wild-type strain indicates that the degree of maturation depends on antigen nature. Also,
shorter mannan chains on yeast cell surface seem to affect maturation in a more explicit
manner than the presence of underglycosylated proteins.
DC maturation caused by different P. pastoris strains
Increases in the expression of DC surface markers induced by the two P. pastoris strains
examined (GS115 and KM71) showed similar patterns, indicating that both strains share
similar characteristics in terms of promoting DC maturation. The median of
fluorescence intensity for most of the markers analyzed were slightly higher in the case
of GS115 (CD40, CD54, CD58, CD80, CD86, HLA I, HLA II and CCR7), whereas the
percentage of CD83+ cells was a little higher when KM71 was added to DCs. However,
these differences are not distinct enough to place one strain in a more favoured position
than the other with respect to DC maturation.
DC maturation caused by different yeast genera
When only the yeast genera are compared, it can be assumed that there is no
preponderance of one genus among the set of genera analyzed. For instance, the highest
levels of CD86, HLA I and HLA II were induced by K. lactis. Y. lipolytica caused the
strongest upregulation of CD54 and CD80, Sz. pombe of CD40 and CD58, and S.
cerevisiae of CCR7, whereas the percentage of CD83+ cells was more elevated after
incubation with P. pastoris.
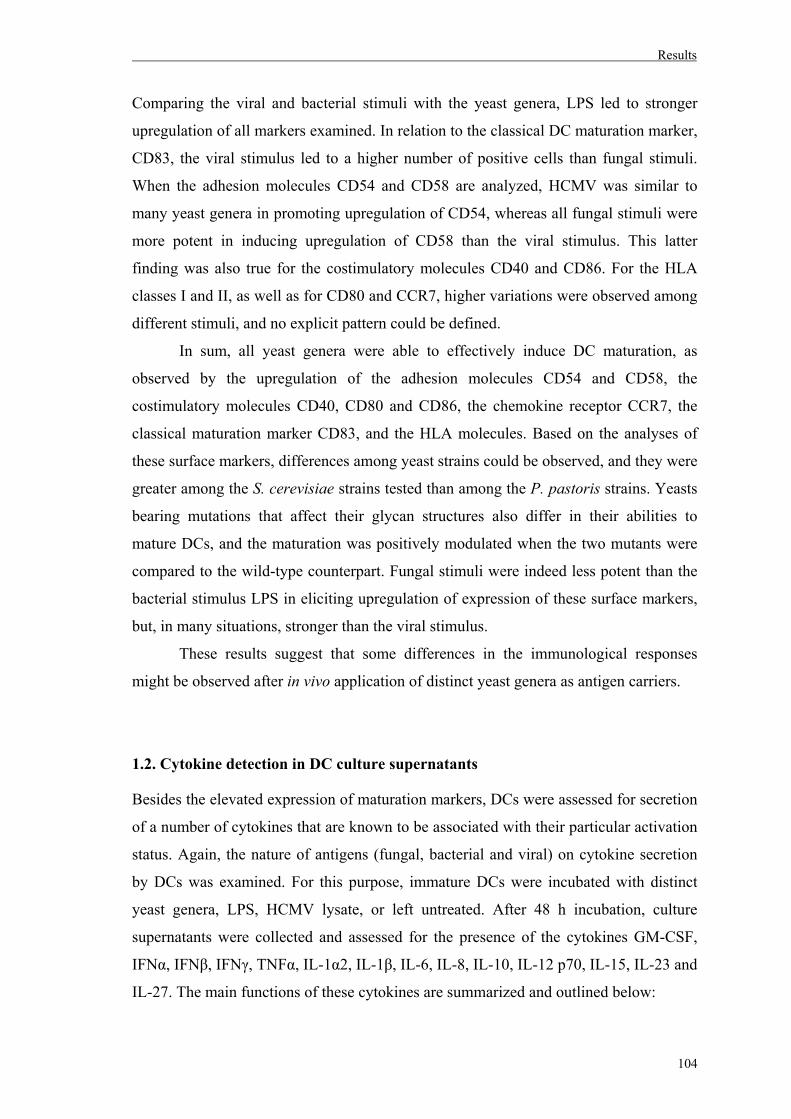
Results
104
Comparing the viral and bacterial stimuli with the yeast genera, LPS led to stronger
upregulation of all markers examined. In relation to the classical DC maturation marker,
CD83, the viral stimulus led to a higher number of positive cells than fungal stimuli.
When the adhesion molecules CD54 and CD58 are analyzed, HCMV was similar to
many yeast genera in promoting upregulation of CD54, whereas all fungal stimuli were
more potent in inducing upregulation of CD58 than the viral stimulus. This latter
finding was also true for the costimulatory molecules CD40 and CD86. For the HLA
classes I and II, as well as for CD80 and CCR7, higher variations were observed among
different stimuli, and no explicit pattern could be defined.
In sum, all yeast genera were able to effectively induce DC maturation, as
observed by the upregulation of the adhesion molecules CD54 and CD58, the
costimulatory molecules CD40, CD80 and CD86, the chemokine receptor CCR7, the
classical maturation marker CD83, and the HLA molecules. Based on the analyses of
these surface markers, differences among yeast strains could be observed, and they were
greater among the S. cerevisiae strains tested than among the P. pastoris strains. Yeasts
bearing mutations that affect their glycan structures also differ in their abilities to
mature DCs, and the maturation was positively modulated when the two mutants were
compared to the wild-type counterpart. Fungal stimuli were indeed less potent than the
bacterial stimulus LPS in eliciting upregulation of expression of these surface markers,
but, in many situations, stronger than the viral stimulus.
These results suggest that some differences in the immunological responses
might be observed after in vivo application of distinct yeast genera as antigen carriers.
1.2. Cytokine detection in DC culture supernatants
Besides the elevated expression of maturation markers, DCs were assessed for secretion
of a number of cytokines that are known to be associated with their particular activation
status. Again, the nature of antigens (fungal, bacterial and viral) on cytokine secretion
by DCs was examined. For this purpose, immature DCs were incubated with distinct
yeast genera, LPS, HCMV lysate, or left untreated. After 48 h incubation, culture
supernatants were collected and assessed for the presence of the cytokines GM-CSF,
IFNα, IFNβ, IFNγ, TNFα, IL-1α2, IL-1β, IL-6, IL-8, IL-10, IL-12 p70, IL-15, IL-23 and
IL-27. The main functions of these cytokines are summarized and outlined below:
Results
105
• GM-CSF is involved in the production and functional activation of
hematopoietic cells, particularly granulocytes and monocyte/macrophages (Metcalf,
2008; Hercus et al., 2009). GM-CSF is also crucial for the proinflammatory activity of
TH17 cells (McGeachy, 2011).
• IFN-α and IFN-β belong to a family of cytokines (type I IFNs) with pleiotropic
activities on nearly all somatic cells. Secretion of IFN-α/β is mainly induced upon viral
infection, but can also occur in response to other biological stresses. One remarkable
function of IFN-α/β is its interference with virus replication and spread (Huber and
Farrar, 2011). IFN-α promotes a number of biological effects, such as induction of
apoptosis and inhibition of cell growth, as well as induction of differentiation and
activity of host immune cells (Rizza et al., 2010). IFN-β and IFN-γ inhibit upregulation
of CCR7 expression in mature DCs, reducing their migratory capacity. However, unlike
IFN-γ, IFN-β significantly inhibits production of IL-12 (Szabo et al., 2000; Yen et al.,
2010). Human T cells, in contrast to mice T cells, induce TH1 development in response
to type I IFNs (Moser and Murphy, 2000). IFN-γ is a type II IFN, whose functions play
an essential role in immunity towards intracellular microorganisms. IFN-γ is critical for
TH1 cells responses, inhibiting differentiation of TH2 cells. It also stimulates APCs to
upregulate expression of MHC class I and class II as well as costimulatory molecules.
IFN-γ activates NK cells and stimulates macrophages to kill internalized microbes
(reviewed by Abbas et al., 2007; Miller et al., 2009).
• IL-1 is a proinflammatory cytokine comprising IL-1α and IL-1β, which are
products from different genes and exert distinct immunological activities, but are
mutually inductive (Horai et al., 1998; Nakae et al., 2001a). Both IL-1α and IL-1β
induce inflammation and activate lymphocytes. IL-1β strongly activates humoral
immune responses, whereas IL-1α is involved in the development of antigen-specific
memory T cells (Nakae et al., 2001a; Nakae et al., 2001b).
• IL-6 stimulates production of neutrophils, the growth of antibody-producer B
cells and induces the proliferation and differentiation of TH17 cells (Abbas et al., 2007).
• IL-8, a constituent of the chemokine family, exerts various functions on
leukocytes, especially neutrophils, playing an important role in the establishment of
acute inflammation. Among other functions, it is involved in leukocyte chemotaxis and
induction of neutrophils to release lysosomal enzymes (Harada et al., 1994;
Vlahopoulos et al., 1999).
Results
106
• IL-10 possesses anti-inflammatory properties and targets different leukocytes.
This cytokine functions to repress excessive inflammatory responses and to limit
subsequent tissue damage. In phagocytes, IL-10 reduces antigen presentation and
expression of inflammatory mediators, but enhances antigen uptake. Moreover, IL-10 is
critical in the biology of B and T cells and contributes to induced tolerance (Sabat et al.,
2010; Ouyang et al., 2011).
• IL-12 plays a crucial role in priming TH1 cell responses and stimulating IFN-γ
production and cytotoxic activity by T lymphocytes and NK cells. Furthermore, it
functions as a third signal in activation of CD8+ T cells and is involved in the
reactivation and survival of memory CD4+ T cells (DelVecchio et al., 2007). IL-12 and
type I IFN-α/β are important in responses against viruses due to their antimicrobial and
immunoregulatory activities (Dalod et al., 2002).
• IL-15 has been associated with the stimulation and survival of CD8+ memory T
cells and NK cells (Zhang et al., 1998; Abbas et al., 2007).
• IL-23 might expand the pool of IL-17-producing cells from activated and
memory T-cell populations, but cannot trigger differentiation into TH17 cells from naive
T-cell precursors (Bettelli et al., 2006). Leibundgut-Landmann and colleagues (2007)
showed that Dectin-1 signaling in DCs through Syk kinase strongly triggers TH cell
differentiation into TH17 cells, and also observed that Dectin-1 agonists induce TH17
and TH1 responses in vivo.
• IL-27 inhibits development of TH17 and TH2 cells, inducing CD4+ T cell
differentiation into TH1 cells that produce IFN-γ (Baten et al., 2006; Yoshimoto et al.,
2007).
• Secretion of the pluripotent cytokine TNF-α activates a cytokine cascade needed
for proper cellular responses in the affected tissue. In monocytes, TNF-α leads to
enhanced cytotoxic capacity and increased secretion of other inflammatory mediators,
such as IL-1 and IL-8 (Vlahopoulos et al., 1999).
As illustrated in Fig. 7, DCs incubated with yeasts up-regulated the production
of several cytokines, in some cases even more pronounced than after LPS treatment.
Results from four different blood donors showed great variability for a specific
cytokine. This observation has also been described by others (Buentke et al., 2001;
Barron et al., 2006; Remondo et al., 2009).
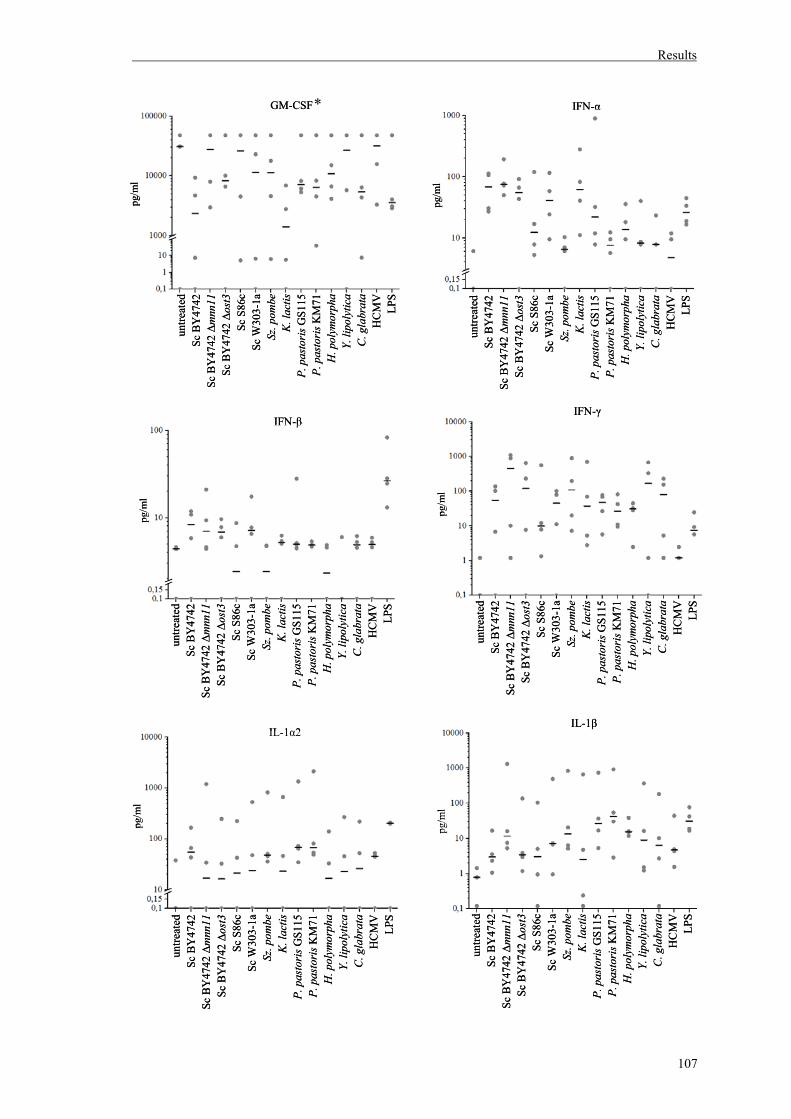
Results
107
GM-CSF
untre
ated
Sc B
Y47
42Sc
BY
4742
Δm
nn11
Sc B
Y47
42 Δ
ost3
Sc S
86c
Sc W
303-
1aSz
. pom
beK
. lac
tisP.
pas
tori
sGS1
15P.
pas
tori
sKM
71H
. pol
ymor
pha
Y. li
poly
tica
C. g
labr
ata
HC
MV
LPS
pg/m
l
GM-CSF
untre
ated
Sc B
Y47
42Sc
BY
4742
Δm
nn11
Sc B
Y47
42 Δ
ost3
Sc S
86c
Sc W
303-
1aSz
. pom
beK
. lac
tisP.
pas
tori
sGS1
15P.
pas
tori
sKM
71H
. pol
ymor
pha
Y. li
poly
tica
C. g
labr
ata
HC
MV
LPS
pg/m
l
IFN-α
pg/m
l
untre
ated
Sc B
Y47
42Sc
BY
4742
Δm
nn11
Sc B
Y47
42 Δ
ost3
Sc S
86c
Sc W
303-
1aSz
. pom
beK
. lac
tisP.
pas
tori
sGS1
15P.
pas
tori
sKM
71H
. pol
ymor
pha
Y. li
poly
tica
C. g
labr
ata
HC
MV
LPS
IFN-α
pg/m
l
untre
ated
Sc B
Y47
42Sc
BY
4742
Δm
nn11
Sc B
Y47
42 Δ
ost3
Sc S
86c
Sc W
303-
1aSz
. pom
beK
. lac
tisP.
pas
tori
sGS1
15P.
pas
tori
sKM
71H
. pol
ymor
pha
Y. li
poly
tica
C. g
labr
ata
HC
MV
LPS
IFN-β
untre
ated
Sc B
Y47
42Sc
BY
4742
Δm
nn11
Sc B
Y47
42 Δ
ost3
Sc S
86c
Sc W
303-
1aSz
. pom
beK
. lac
tisP.
pas
tori
sGS1
15P.
pas
tori
sKM
71H
. pol
ymor
pha
Y. li
poly
tica
C. g
labr
ata
HC
MV
LPS
pg/m
l
IFN-β
untre
ated
Sc B
Y47
42Sc
BY
4742
Δm
nn11
Sc B
Y47
42 Δ
ost3
Sc S
86c
Sc W
303-
1aSz
. pom
beK
. lac
tisP.
pas
tori
sGS1
15P.
pas
tori
sKM
71H
. pol
ymor
pha
Y. li
poly
tica
C. g
labr
ata
HC
MV
LPS
pg/m
l
untre
ated
Sc B
Y47
42Sc
BY
4742
Δm
nn11
Sc B
Y47
42 Δ
ost3
Sc S
86c
Sc W
303-
1aSz
. pom
beK
. lac
tisP.
pas
tori
sGS1
15P.
pas
tori
sKM
71H
. pol
ymor
pha
Y. li
poly
tica
C. g
labr
ata
HC
MV
LPS
pg/m
l
IFN-γ
untre
ated
Sc B
Y47
42Sc
BY
4742
Δm
nn11
Sc B
Y47
42 Δ
ost3
Sc S
86c
Sc W
303-
1aSz
. pom
beK
. lac
tisP.
pas
tori
sGS1
15P.
pas
tori
sKM
71H
. pol
ymor
pha
Y. li
poly
tica
C. g
labr
ata
HC
MV
LPS
pg/m
l
IFN-γ
IL-1α2
untre
ated
Sc B
Y47
42Sc
BY
4742
Δm
nn11
Sc B
Y47
42 Δ
ost3
Sc S
86c
Sc W
303-
1aSz
. pom
beK
. lac
tisP.
pas
tori
sGS1
15P.
pas
tori
sKM
71H
. pol
ymor
pha
Y. li
poly
tica
C. g
labr
ata
HC
MV
LPS
pg/m
l
IL-1α2
untre
ated
Sc B
Y47
42Sc
BY
4742
Δm
nn11
Sc B
Y47
42 Δ
ost3
Sc S
86c
Sc W
303-
1aSz
. pom
beK
. lac
tisP.
pas
tori
sGS1
15P.
pas
tori
sKM
71H
. pol
ymor
pha
Y. li
poly
tica
C. g
labr
ata
HC
MV
LPS
pg/m
l
untre
ated
Sc B
Y47
42Sc
BY
4742
Δm
nn11
Sc B
Y47
42 Δ
ost3
Sc S
86c
Sc W
303-
1aSz
. pom
beK
. lac
tisP.
pas
tori
sGS1
15P.
pas
tori
sKM
71H
. pol
ymor
pha
Y. li
poly
tica
C. g
labr
ata
HC
MV
LPS
pg/m
l
IL-1β
untre
ated
Sc B
Y47
42Sc
BY
4742
Δm
nn11
Sc B
Y47
42 Δ
ost3
Sc S
86c
Sc W
303-
1aSz
. pom
beK
. lac
tisP.
pas
tori
sGS1
15P.
pas
tori
sKM
71H
. pol
ymor
pha
Y. li
poly
tica
C. g
labr
ata
HC
MV
LPS
pg/m
l
IL-1β
*
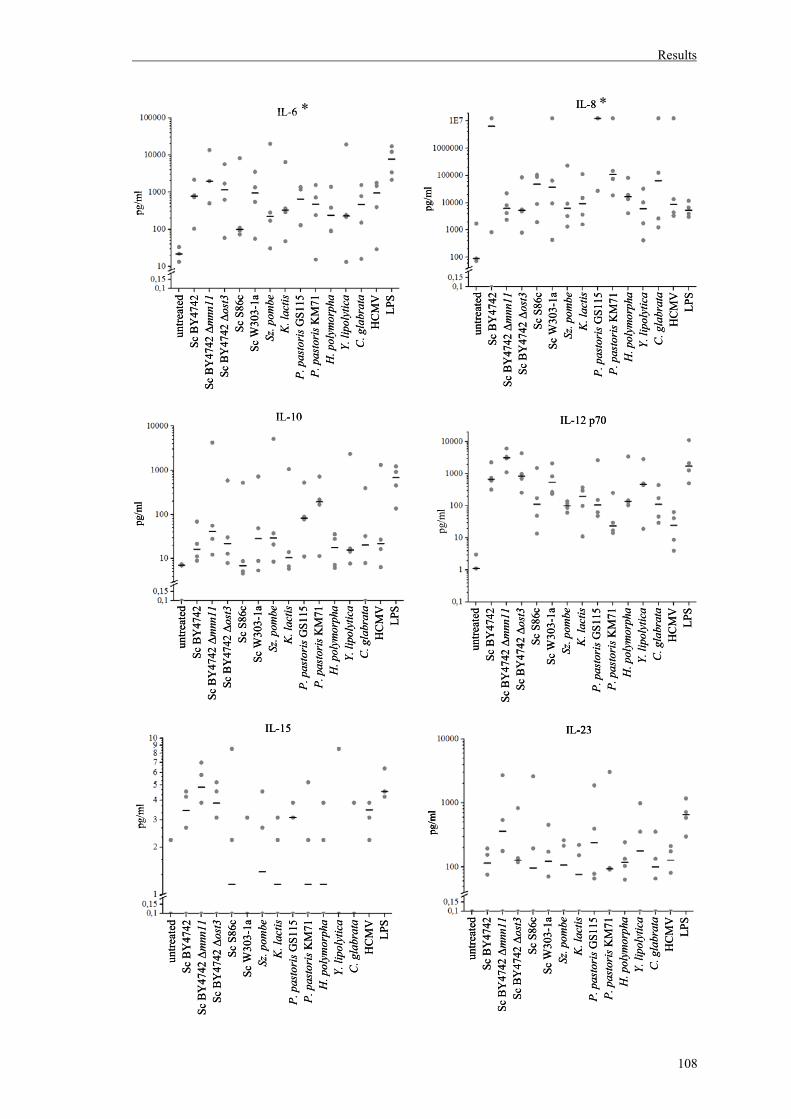
Results
108
untre
ated
Sc B
Y47
42Sc
BY
4742
Δm
nn11
Sc B
Y47
42 Δ
ost3
Sc S
86c
Sc W
303-
1aSz
. pom
beK
. lac
tisP.
pas
tori
sGS1
15P.
pas
tori
sKM
71H
. pol
ymor
pha
Y. li
poly
tica
C. g
labr
ata
HC
MV
LPS
pg/m
l
IL-6
untre
ated
Sc B
Y47
42Sc
BY
4742
Δm
nn11
Sc B
Y47
42 Δ
ost3
Sc S
86c
Sc W
303-
1aSz
. pom
beK
. lac
tisP.
pas
tori
sGS1
15P.
pas
tori
sKM
71H
. pol
ymor
pha
Y. li
poly
tica
C. g
labr
ata
HC
MV
LPS
pg/m
l
IL-6IL-8
untre
ated
Sc B
Y47
42Sc
BY
4742
Δm
nn11
Sc B
Y47
42 Δ
ost3
Sc S
86c
Sc W
303-
1aSz
. pom
beK
. lac
tisP.
pas
tori
sGS1
15P.
pas
tori
sKM
71H
. pol
ymor
pha
Y. li
poly
tica
C. g
labr
ata
HC
MV
LPS
pg/m
l
IL-8
untre
ated
Sc B
Y47
42Sc
BY
4742
Δm
nn11
Sc B
Y47
42 Δ
ost3
Sc S
86c
Sc W
303-
1aSz
. pom
beK
. lac
tisP.
pas
tori
sGS1
15P.
pas
tori
sKM
71H
. pol
ymor
pha
Y. li
poly
tica
C. g
labr
ata
HC
MV
LPS
pg/m
l
untre
ated
Sc B
Y47
42Sc
BY
4742
Δm
nn11
Sc B
Y47
42 Δ
ost3
Sc S
86c
Sc W
303-
1aSz
. pom
beK
. lac
tisP.
pas
tori
sGS1
15P.
pas
tori
sKM
71H
. pol
ymor
pha
Y. li
poly
tica
C. g
labr
ata
HC
MV
LPS
pg/m
l
IL-10
untre
ated
Sc B
Y47
42Sc
BY
4742
Δm
nn11
Sc B
Y47
42 Δ
ost3
Sc S
86c
Sc W
303-
1aSz
. pom
beK
. lac
tisP.
pas
tori
sGS1
15P.
pas
tori
sKM
71H
. pol
ymor
pha
Y. li
poly
tica
C. g
labr
ata
HC
MV
LPS
pg/m
l
IL-10
untre
ated
Sc B
Y47
42Sc
BY
4742
Δm
nn11
Sc B
Y47
42 Δ
ost3
Sc S
86c
Sc W
303-
1aSz
. pom
beK
. lac
tisP.
pas
tori
sGS1
15P.
pas
tori
sKM
71H
. pol
ymor
pha
Y. li
poly
tica
C. g
labr
ata
HC
MV
LPS
pg/m
l
IL-12 p70
untre
ated
Sc B
Y47
42Sc
BY
4742
Δm
nn11
Sc B
Y47
42 Δ
ost3
Sc S
86c
Sc W
303-
1aSz
. pom
beK
. lac
tisP.
pas
tori
sGS1
15P.
pas
tori
sKM
71H
. pol
ymor
pha
Y. li
poly
tica
C. g
labr
ata
HC
MV
LPS
pg/m
l
IL-12 p70
untre
ated
Sc B
Y47
42Sc
BY
4742
Δm
nn11
Sc B
Y47
42 Δ
ost3
Sc S
86c
Sc W
303-
1aSz
. pom
beK
. lac
tisP.
pas
tori
sGS1
15P.
pas
tori
sKM
71H
. pol
ymor
pha
Y. li
poly
tica
C. g
labr
ata
HC
MV
LPS
pg/m
l
IL-23
untre
ated
Sc B
Y47
42Sc
BY
4742
Δm
nn11
Sc B
Y47
42 Δ
ost3
Sc S
86c
Sc W
303-
1aSz
. pom
beK
. lac
tisP.
pas
tori
sGS1
15P.
pas
tori
sKM
71H
. pol
ymor
pha
Y. li
poly
tica
C. g
labr
ata
HC
MV
LPS
pg/m
l
IL-23
pg/m
l
IL-23
**
untre
ated
Sc B
Y47
42Sc
BY
4742
Δm
nn11
Sc B
Y47
42 Δ
ost3
Sc S
86c
Sc W
303-
1aSz
. pom
beK
. lac
tisP.
pas
tori
sGS1
15P.
pas
tori
sKM
71H
. pol
ymor
pha
Y. li
poly
tica
C. g
labr
ata
HC
MV
LPS
pg/m
l
IL-15
untre
ated
Sc B
Y47
42Sc
BY
4742
Δm
nn11
Sc B
Y47
42 Δ
ost3
Sc S
86c
Sc W
303-
1aSz
. pom
beK
. lac
tisP.
pas
tori
sGS1
15P.
pas
tori
sKM
71H
. pol
ymor
pha
Y. li
poly
tica
C. g
labr
ata
HC
MV
LPS
pg/m
l
IL-15
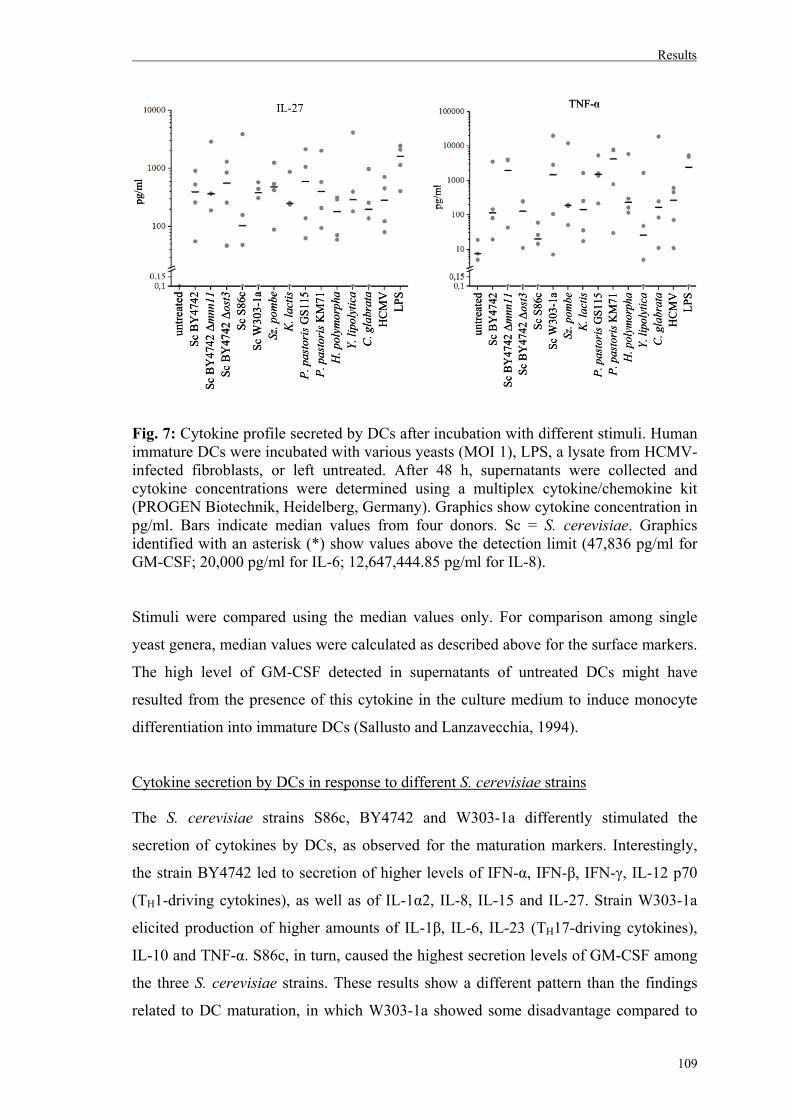
Results
109
Fig. 7: Cytokine profile secreted by DCs after incubation with different stimuli. Human immature DCs were incubated with various yeasts (MOI 1), LPS, a lysate from HCMV-infected fibroblasts, or left untreated. After 48 h, supernatants were collected and cytokine concentrations were determined using a multiplex cytokine/chemokine kit (PROGEN Biotechnik, Heidelberg, Germany). Graphics show cytokine concentration in pg/ml. Bars indicate median values from four donors. Sc = S. cerevisiae. Graphics identified with an asterisk (*) show values above the detection limit (47,836 pg/ml for GM-CSF; 20,000 pg/ml for IL-6; 12,647,444.85 pg/ml for IL-8). Stimuli were compared using the median values only. For comparison among single
yeast genera, median values were calculated as described above for the surface markers.
The high level of GM-CSF detected in supernatants of untreated DCs might have
resulted from the presence of this cytokine in the culture medium to induce monocyte
differentiation into immature DCs (Sallusto and Lanzavecchia, 1994).
Cytokine secretion by DCs in response to different S. cerevisiae strains
The S. cerevisiae strains S86c, BY4742 and W303-1a differently stimulated the
secretion of cytokines by DCs, as observed for the maturation markers. Interestingly,
the strain BY4742 led to secretion of higher levels of IFN-α, IFN-β, IFN-γ, IL-12 p70
(TH1-driving cytokines), as well as of IL-1α2, IL-8, IL-15 and IL-27. Strain W303-1a
elicited production of higher amounts of IL-1β, IL-6, IL-23 (TH17-driving cytokines),
IL-10 and TNF-α. S86c, in turn, caused the highest secretion levels of GM-CSF among
the three S. cerevisiae strains. These results show a different pattern than the findings
related to DC maturation, in which W303-1a showed some disadvantage compared to
untre
ated
Sc B
Y47
42Sc
BY
4742
Δm
nn11
Sc B
Y47
42 Δ
ost3
Sc S
86c
Sc W
303-
1aSz
. pom
beK
. lac
tisP.
pas
tori
sGS1
15P.
pas
tori
sKM
71H
. pol
ymor
pha
Y. li
poly
tica
C. g
labr
ata
HC
MV
LPS
pg/m
l
IL-27
untre
ated
Sc B
Y47
42Sc
BY
4742
Δm
nn11
Sc B
Y47
42 Δ
ost3
Sc S
86c
Sc W
303-
1aSz
. pom
beK
. lac
tisP.
pas
tori
sGS1
15P.
pas
tori
sKM
71H
. pol
ymor
pha
Y. li
poly
tica
C. g
labr
ata
HC
MV
LPS
pg/m
l
IL-27
untre
ated
Sc B
Y47
42Sc
BY
4742
Δm
nn11
Sc B
Y47
42 Δ
ost3
Sc S
86c
Sc W
303-
1aSz
. pom
beK
. lac
tisP.
pas
tori
sGS1
15P.
pas
tori
sKM
71H
. pol
ymor
pha
Y. li
poly
tica
C. g
labr
ata
HC
MV
LPS
TNF-α
pg/m
l
untre
ated
Sc B
Y47
42Sc
BY
4742
Δm
nn11
Sc B
Y47
42 Δ
ost3
Sc S
86c
Sc W
303-
1aSz
. pom
beK
. lac
tisP.
pas
tori
sGS1
15P.
pas
tori
sKM
71H
. pol
ymor
pha
Y. li
poly
tica
C. g
labr
ata
HC
MV
LPS
TNF-α
pg/m
l
Results
110
the other two strains. However, a significantly higher number of donors needs to be
tested in order to confirm these observations.
Cytokine secretion by DCs in response to S. cerevisiae BY4742 and its mutants
Among the tested S. cerevisiae mutants, the wild-type strain BY4742 provoked superior
secretion levels of IFN-β, IL-1α2, and IL-8 by DCs. Its isogenic Δost3 mutant induced
higher expression levels of IL-27 only, whereas the Δmnn11 knock-out was more
effective in inducing DC expression of GM-CSF, IFN-α, IFN-γ, TNF-α, IL-1β, IL-6,
IL-10, IL-12 p70, IL-15 and IL-23. This bias for the Δmnn11 mutant confirms the
results observed for DC maturation. Again, these results demonstrate a positive
influence of shorter mannose structures within yeast cell wall components on immune
recognition and activation in comparison to normal yeasts or yeasts carrying
glycosylation defects.
Cytokine secretion by DCs in response to the P. pastoris strains
As observed for the DC surface maturation markers, no outstanding difference in
cytokine production was seen after incubation of DCs with either P. pastoris GS115 or
KM71, except for IL-8, whose levels were more than hundred fold higher in
supernatants from DCs incubated with GS115. Levels of GM-CSF, IFN-β, IL-1α2, IL-
1β and IL-6 were very similar in supernatants from DCs incubated with either strain
GS115 or KM71. Higher production of IL-10 and TNF-α was detected after incubation
of DCs with KM71, whereas slightly higher levels of IFN-α, IFN-γ, IL-8, IL-12 p70,
IL-15, IL-23 and IL-27 were measured after incubation with GS115. The much higher
levels of IL-8 observed after incubation of DCs with strain GS115 could be
advantageous, since IL-8 acts as chemoattractant and inflammatory mediator, and it has
been demonstrated that its synthesis precedes upregulation of the activation marker
CD40 (Hellman and Eriksson, 2007).
Cytokine secretion by DCs in response to different yeast genera
Comparing the single yeast genera only, a slight bias could be observed towards P.
pastoris, which induced the highest expression levels of IL-1α2, IL-1β, IL-8, IL-10, IL-
15, IL-27 and TNF-α by DCs, while Y. lipolytica led to secretion of the highest levels of
GM-CSF, IFN-γ and IL-23, S. cerevisiae of IFN-β, IL-6 and IL-12, and K. lactis of
Results
111
IFN-α. However, it has to be underscored that levels of IFN-β, IL-1α2, IL-23 and IL-27
in culture supernatants were very similar for all yeast genera analyzed. Yeast genera
upregulated the production of almost all cytokines analyzed. Secretion of IL-15 and
IFN-β by DCs was, in some cases such as after incubation with Y. lipolytica, not
upregulated in comparison to the median value of the untreated control. However, no
data in the literature describing secretion of both cytokines in response to yeast could be
found.
Comparing all yeast genera with the viral and the bacterial stimuli, it could be observed
that LPS was responsible for the highest levels of IFN-β, IL-1α2, IL-6, IL-10, IL-12, IL-
15, IL-23 and IL-27. The lysate of HCMV-infected fibroblasts provoked more GM-CSF
secretion than any other stimulus. Besides GM-CSF, the only cytokine whose level was
higher in response to HCMV than to LPS was IL-8. Secretion of IL-8 was markedly
high for almost all yeasts tested, especially P. pastoris, which was by far the most
effective stimulus, with DCs exhibiting IL-8 levels above 106 pg/ml (Fig. 7). Levels of
IFN-α, IFN-γ, IL-1β and TNF-α, as well as the already mentioned IL-8, were higher in
response to at least one yeast stimulus than for the viral or bacteria stimulus. IFN-γ
levels in response to LPS and especially to HCMV were several times lower than to any
yeast genus tested. Interestingly, lowest secretion of IFN-α was observed when DCs
were incubated with the viral stimulus, and IFN-β levels did not significantly increase
after DC incubation with HCMV in comparison to the untreated samples.
From these results it could be inferred that a wide spectrum of cytokines can be
produced by DCs after incubation with different yeast stimuli, and that yeasts differ in
their ability to stimulate cytokine production by DCs. Moreover, for a given set of
cytokines, fungal stimuli can promote stronger DC activation than bacterial or viral
antigens.
2. Fungal cell wall staining
The observation that distinct yeast genera lead to maturation of human DCs and
production of a variety of cytokines, and that the composition of the fungal cell wall
plays an important role in these events (as demonstrated previously), provided the
rationale for investigating the variations in yeast cell wall constitution more closely. For
this purpose, three of the major yeast cell wall components, mannan, β-glucan and
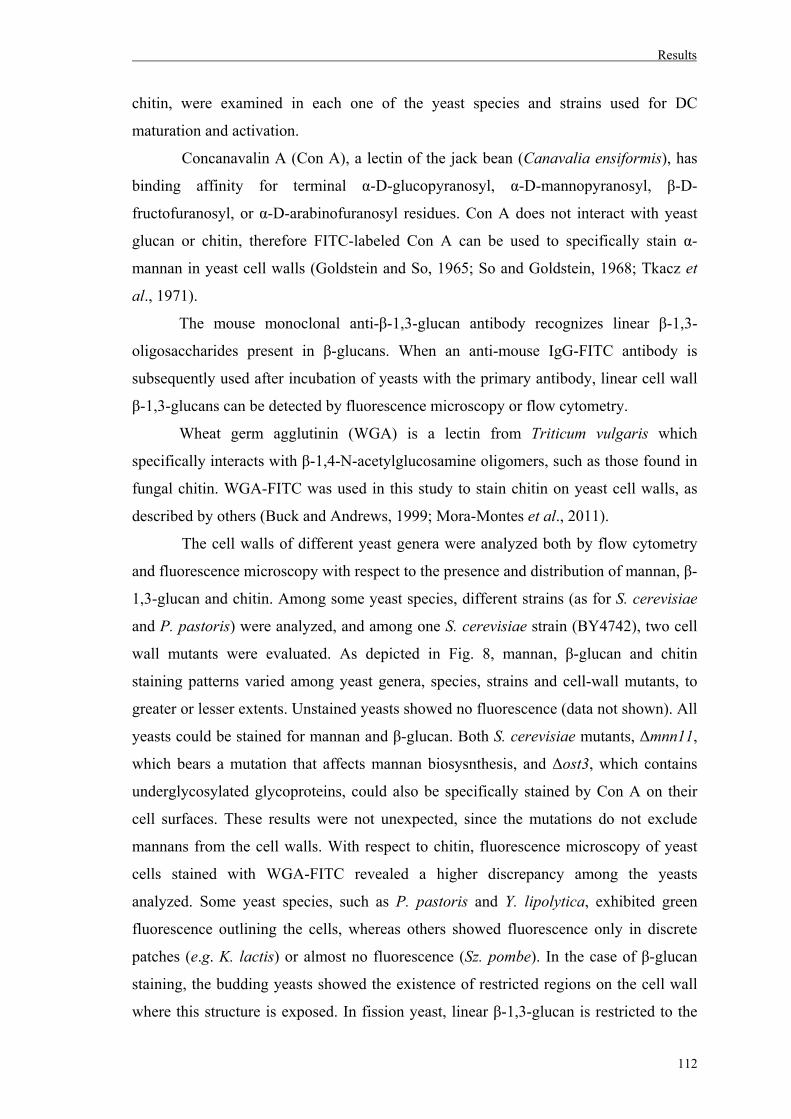
Results
112
chitin, were examined in each one of the yeast species and strains used for DC
maturation and activation.
Concanavalin A (Con A), a lectin of the jack bean (Canavalia ensiformis), has
binding affinity for terminal α-D-glucopyranosyl, α-D-mannopyranosyl, β-D-
fructofuranosyl, or α-D-arabinofuranosyl residues. Con A does not interact with yeast
glucan or chitin, therefore FITC-labeled Con A can be used to specifically stain α-
mannan in yeast cell walls (Goldstein and So, 1965; So and Goldstein, 1968; Tkacz et
al., 1971).
The mouse monoclonal anti-β-1,3-glucan antibody recognizes linear β-1,3-
oligosaccharides present in β-glucans. When an anti-mouse IgG-FITC antibody is
subsequently used after incubation of yeasts with the primary antibody, linear cell wall
β-1,3-glucans can be detected by fluorescence microscopy or flow cytometry.
Wheat germ agglutinin (WGA) is a lectin from Triticum vulgaris which
specifically interacts with β-1,4-N-acetylglucosamine oligomers, such as those found in
fungal chitin. WGA-FITC was used in this study to stain chitin on yeast cell walls, as
described by others (Buck and Andrews, 1999; Mora-Montes et al., 2011).
The cell walls of different yeast genera were analyzed both by flow cytometry
and fluorescence microscopy with respect to the presence and distribution of mannan, β-
1,3-glucan and chitin. Among some yeast species, different strains (as for S. cerevisiae
and P. pastoris) were analyzed, and among one S. cerevisiae strain (BY4742), two cell
wall mutants were evaluated. As depicted in Fig. 8, mannan, β-glucan and chitin
staining patterns varied among yeast genera, species, strains and cell-wall mutants, to
greater or lesser extents. Unstained yeasts showed no fluorescence (data not shown). All
yeasts could be stained for mannan and β-glucan. Both S. cerevisiae mutants, Δmnn11,
which bears a mutation that affects mannan biosysnthesis, and Δost3, which contains
underglycosylated glycoproteins, could also be specifically stained by Con A on their
cell surfaces. These results were not unexpected, since the mutations do not exclude
mannans from the cell walls. With respect to chitin, fluorescence microscopy of yeast
cells stained with WGA-FITC revealed a higher discrepancy among the yeasts
analyzed. Some yeast species, such as P. pastoris and Y. lipolytica, exhibited green
fluorescence outlining the cells, whereas others showed fluorescence only in discrete
patches (e.g. K. lactis) or almost no fluorescence (Sz. pombe). In the case of β-glucan
staining, the budding yeasts showed the existence of restricted regions on the cell wall
where this structure is exposed. In fission yeast, linear β-1,3-glucan is restricted to the
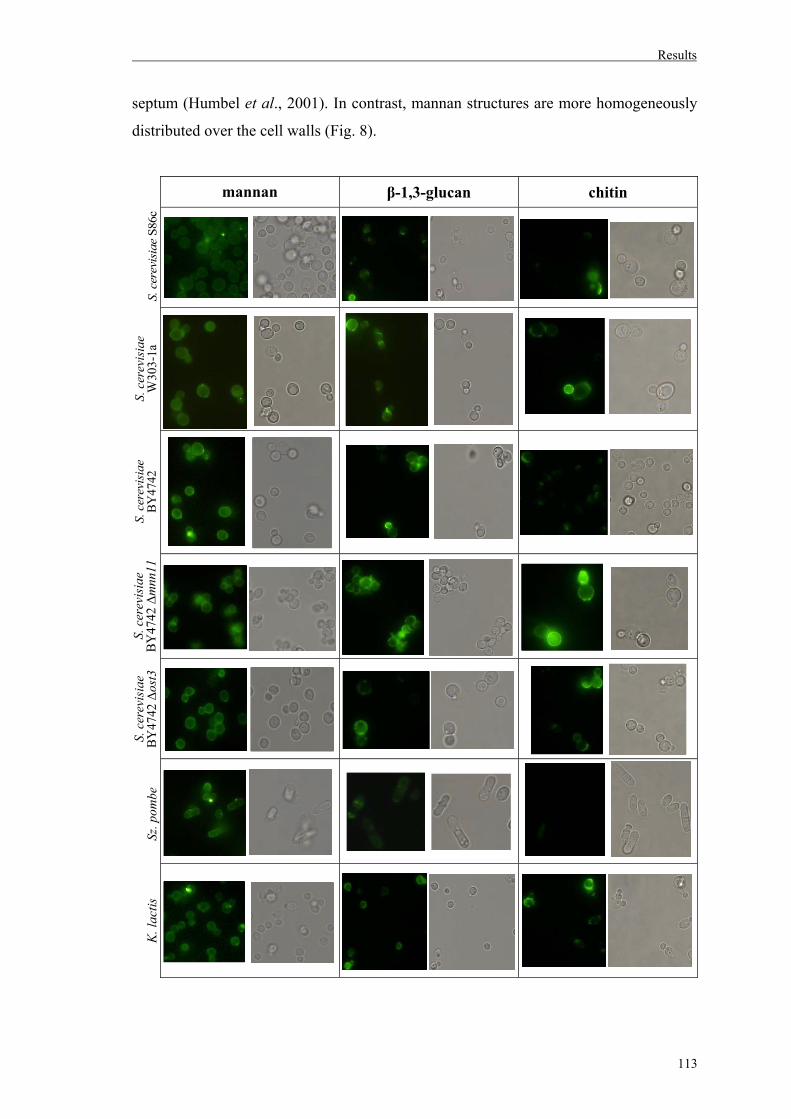
Results
113
septum (Humbel et al., 2001). In contrast, mannan structures are more homogeneously
distributed over the cell walls (Fig. 8).
mannan β-1,3-glucan chitin
S. c
erev
isia
eS8
6c
S. c
erev
isia
eB
Y47
42 Δ
mnn
11
S. c
erev
isia
eB
Y47
42S.
cer
evis
iae
W30
3-1a
S. c
erev
isia
eB
Y47
42 Δ
ost3
Sz. p
ombe
K. l
actis
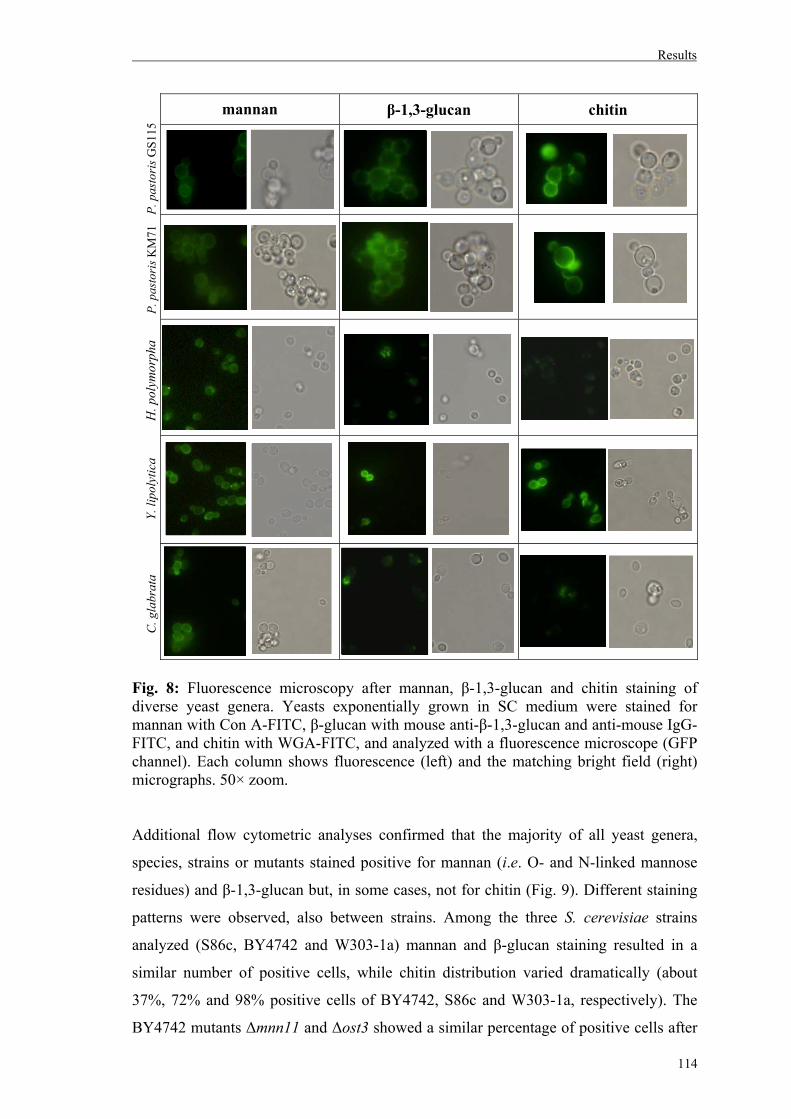
Results
114
mannan β-1,3-glucan chitin
Fig. 8: Fluorescence microscopy after mannan, β-1,3-glucan and chitin staining of diverse yeast genera. Yeasts exponentially grown in SC medium were stained for mannan with Con A-FITC, β-glucan with mouse anti-β-1,3-glucan and anti-mouse IgG-FITC, and chitin with WGA-FITC, and analyzed with a fluorescence microscope (GFP channel). Each column shows fluorescence (left) and the matching bright field (right) micrographs. 50× zoom. Additional flow cytometric analyses confirmed that the majority of all yeast genera,
species, strains or mutants stained positive for mannan (i.e. O- and N-linked mannose
residues) and β-1,3-glucan but, in some cases, not for chitin (Fig. 9). Different staining
patterns were observed, also between strains. Among the three S. cerevisiae strains
analyzed (S86c, BY4742 and W303-1a) mannan and β-glucan staining resulted in a
similar number of positive cells, while chitin distribution varied dramatically (about
37%, 72% and 98% positive cells of BY4742, S86c and W303-1a, respectively). The
BY4742 mutants Δmnn11 and Δost3 showed a similar percentage of positive cells after
P. p
asto
risG
S115
P. p
asto
risK
M71
H. p
olym
orph
aY.
lipo
lytic
a
C. g
labr
ata
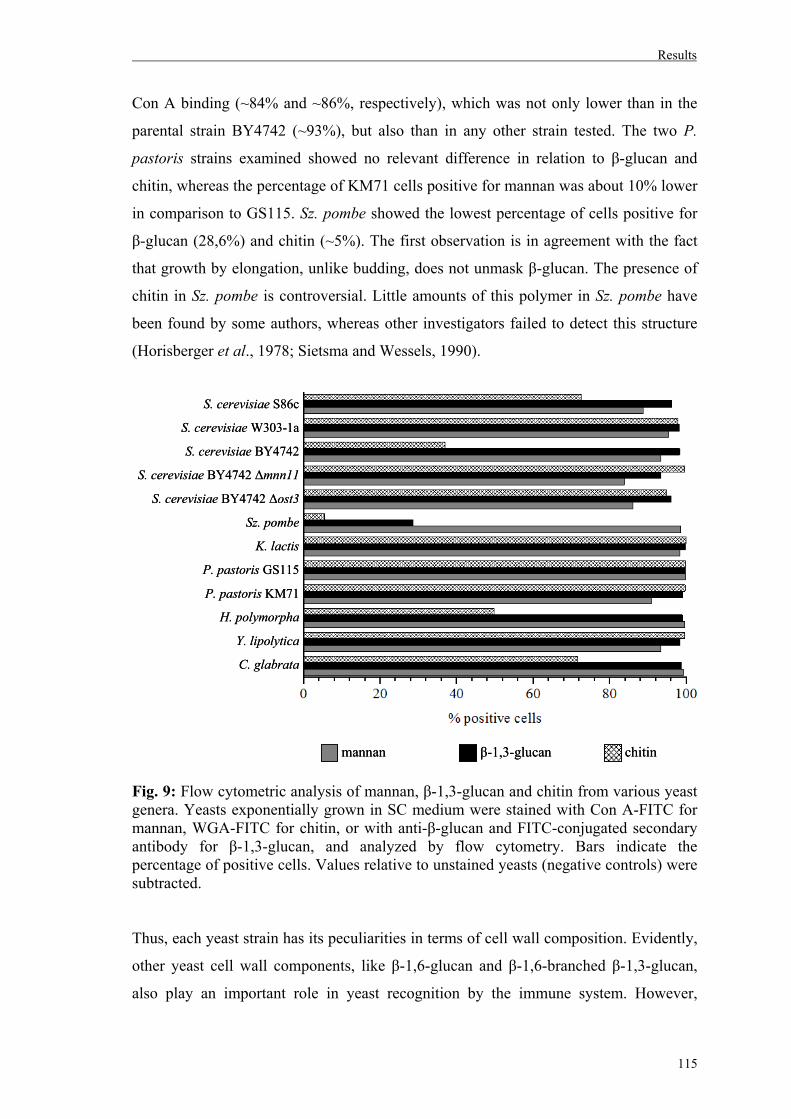
Results
115
Con A binding (~84% and ~86%, respectively), which was not only lower than in the
parental strain BY4742 (~93%), but also than in any other strain tested. The two P.
pastoris strains examined showed no relevant difference in relation to β-glucan and
chitin, whereas the percentage of KM71 cells positive for mannan was about 10% lower
in comparison to GS115. Sz. pombe showed the lowest percentage of cells positive for
β-glucan (28,6%) and chitin (~5%). The first observation is in agreement with the fact
that growth by elongation, unlike budding, does not unmask β-glucan. The presence of
chitin in Sz. pombe is controversial. Little amounts of this polymer in Sz. pombe have
been found by some authors, whereas other investigators failed to detect this structure
(Horisberger et al., 1978; Sietsma and Wessels, 1990).
Fig. 9: Flow cytometric analysis of mannan, β-1,3-glucan and chitin from various yeast genera. Yeasts exponentially grown in SC medium were stained with Con A-FITC for mannan, WGA-FITC for chitin, or with anti-β-glucan and FITC-conjugated secondary antibody for β-1,3-glucan, and analyzed by flow cytometry. Bars indicate the percentage of positive cells. Values relative to unstained yeasts (negative controls) were subtracted. Thus, each yeast strain has its peculiarities in terms of cell wall composition. Evidently,
other yeast cell wall components, like β-1,6-glucan and β-1,6-branched β-1,3-glucan,
also play an important role in yeast recognition by the immune system. However,
mannan β-1,3-glucan chitinmannan β-1,3-glucan chitin
S. cerevisiae S86c
S. cerevisiae W303-1a
S. cerevisiae BY4742
S. cerevisiae BY4742 Δmnn11
S. cerevisiae BY4742 Δost3
Sz. pombe
K. lactis
P. pastoris GS115
P. pastoris KM71
H. polymorpha
Y. lipolytica
C. glabrata
S. cerevisiae S86c
S. cerevisiae W303-1a
S. cerevisiae BY4742
S. cerevisiae BY4742 Δmnn11
S. cerevisiae BY4742 Δost3
Sz. pombe
K. lactis
P. pastoris GS115
P. pastoris KM71
H. polymorpha
Y. lipolytica
C. glabrata
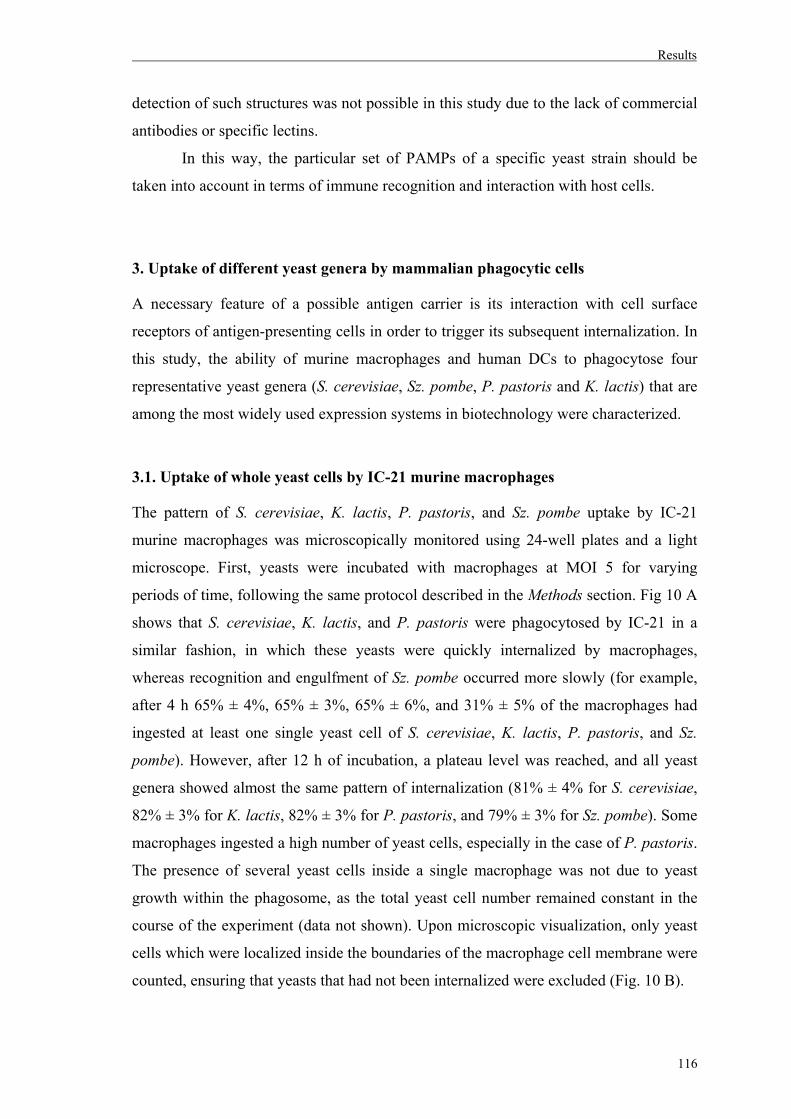
Results
116
detection of such structures was not possible in this study due to the lack of commercial
antibodies or specific lectins.
In this way, the particular set of PAMPs of a specific yeast strain should be
taken into account in terms of immune recognition and interaction with host cells.
3. Uptake of different yeast genera by mammalian phagocytic cells
A necessary feature of a possible antigen carrier is its interaction with cell surface
receptors of antigen-presenting cells in order to trigger its subsequent internalization. In
this study, the ability of murine macrophages and human DCs to phagocytose four
representative yeast genera (S. cerevisiae, Sz. pombe, P. pastoris and K. lactis) that are
among the most widely used expression systems in biotechnology were characterized.
3.1. Uptake of whole yeast cells by IC-21 murine macrophages
The pattern of S. cerevisiae, K. lactis, P. pastoris, and Sz. pombe uptake by IC-21
murine macrophages was microscopically monitored using 24-well plates and a light
microscope. First, yeasts were incubated with macrophages at MOI 5 for varying
periods of time, following the same protocol described in the Methods section. Fig 10 A
shows that S. cerevisiae, K. lactis, and P. pastoris were phagocytosed by IC-21 in a
similar fashion, in which these yeasts were quickly internalized by macrophages,
whereas recognition and engulfment of Sz. pombe occurred more slowly (for example,
after 4 h 65% ± 4%, 65% ± 3%, 65% ± 6%, and 31% ± 5% of the macrophages had
ingested at least one single yeast cell of S. cerevisiae, K. lactis, P. pastoris, and Sz.
pombe). However, after 12 h of incubation, a plateau level was reached, and all yeast
genera showed almost the same pattern of internalization (81% ± 4% for S. cerevisiae,
82% ± 3% for K. lactis, 82% ± 3% for P. pastoris, and 79% ± 3% for Sz. pombe). Some
macrophages ingested a high number of yeast cells, especially in the case of P. pastoris.
The presence of several yeast cells inside a single macrophage was not due to yeast
growth within the phagosome, as the total yeast cell number remained constant in the
course of the experiment (data not shown). Upon microscopic visualization, only yeast
cells which were localized inside the boundaries of the macrophage cell membrane were
counted, ensuring that yeasts that had not been internalized were excluded (Fig. 10 B).
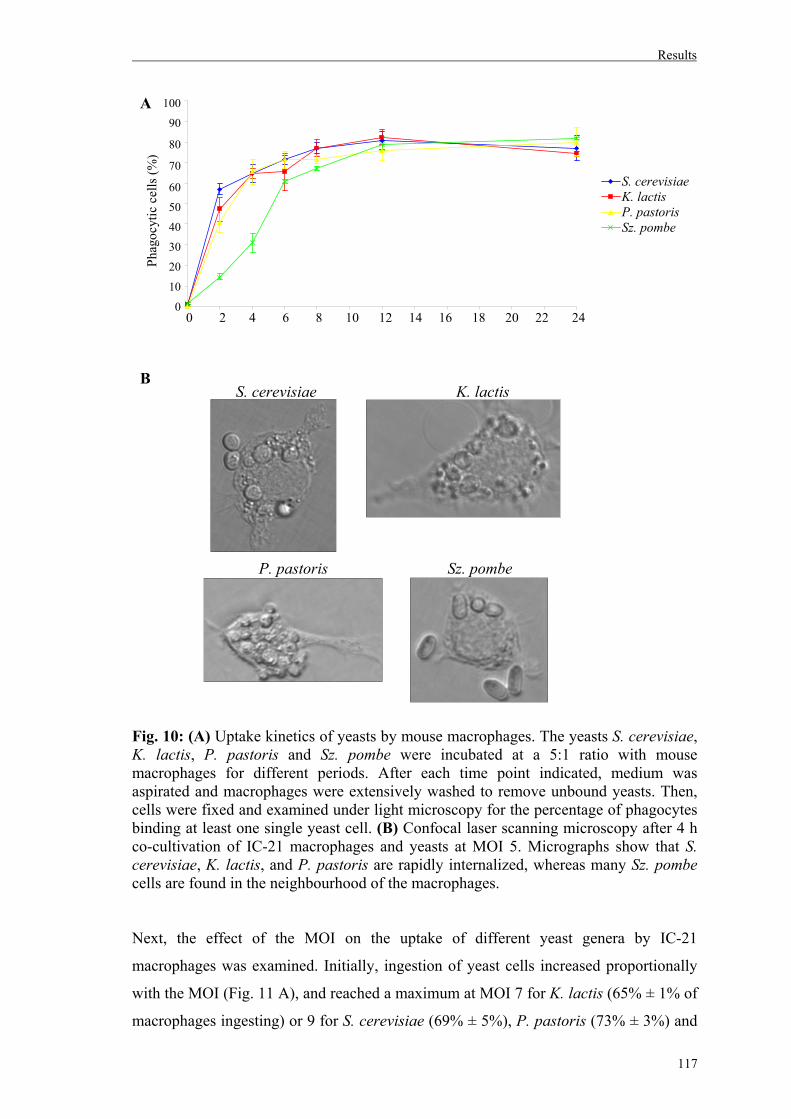
Results
117
A
B
Fig. 10: (A) Uptake kinetics of yeasts by mouse macrophages. The yeasts S. cerevisiae, K. lactis, P. pastoris and Sz. pombe were incubated at a 5:1 ratio with mouse macrophages for different periods. After each time point indicated, medium was aspirated and macrophages were extensively washed to remove unbound yeasts. Then, cells were fixed and examined under light microscopy for the percentage of phagocytes binding at least one single yeast cell. (B) Confocal laser scanning microscopy after 4 h co-cultivation of IC-21 macrophages and yeasts at MOI 5. Micrographs show that S. cerevisiae, K. lactis, and P. pastoris are rapidly internalized, whereas many Sz. pombe cells are found in the neighbourhood of the macrophages. Next, the effect of the MOI on the uptake of different yeast genera by IC-21
macrophages was examined. Initially, ingestion of yeast cells increased proportionally
with the MOI (Fig. 11 A), and reached a maximum at MOI 7 for K. lactis (65% ± 1% of
macrophages ingesting) or 9 for S. cerevisiae (69% ± 5%), P. pastoris (73% ± 3%) and
100
90
80
70
60
50
40
30
20
10
0
S. cerevisiae K. lactis
P. pastoris Sz. pombe
Time course (h)
Phag
ocyt
ic c
ells
(%)
0 2 4 6 8 10 12 14 16 18 20 22 24
S. cerevisiae K. lactis P. pastoris Sz. pombe
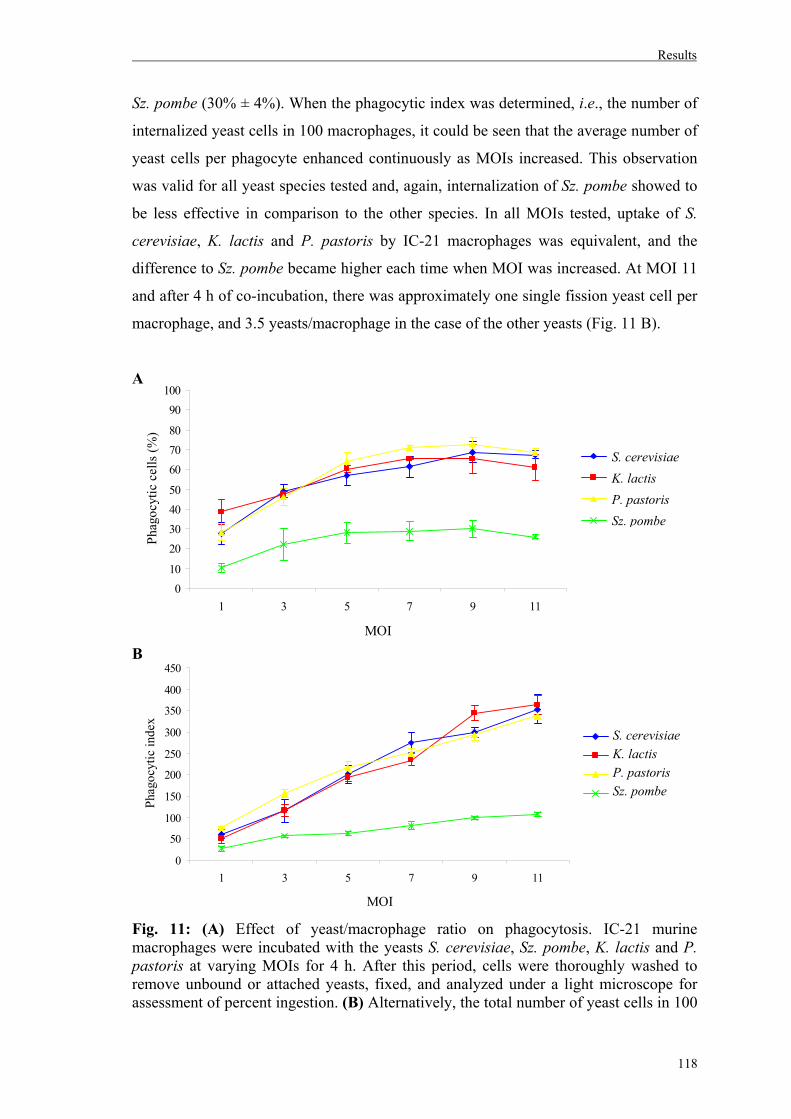
Results
118
Sz. pombe (30% ± 4%). When the phagocytic index was determined, i.e., the number of
internalized yeast cells in 100 macrophages, it could be seen that the average number of
yeast cells per phagocyte enhanced continuously as MOIs increased. This observation
was valid for all yeast species tested and, again, internalization of Sz. pombe showed to
be less effective in comparison to the other species. In all MOIs tested, uptake of S.
cerevisiae, K. lactis and P. pastoris by IC-21 macrophages was equivalent, and the
difference to Sz. pombe became higher each time when MOI was increased. At MOI 11
and after 4 h of co-incubation, there was approximately one single fission yeast cell per
macrophage, and 3.5 yeasts/macrophage in the case of the other yeasts (Fig. 11 B).
A
B
Fig. 11: (A) Effect of yeast/macrophage ratio on phagocytosis. IC-21 murine macrophages were incubated with the yeasts S. cerevisiae, Sz. pombe, K. lactis and P. pastoris at varying MOIs for 4 h. After this period, cells were thoroughly washed to remove unbound or attached yeasts, fixed, and analyzed under a light microscope for assessment of percent ingestion. (B) Alternatively, the total number of yeast cells in 100
Phag
ocyt
ic in
dex
S. cerevisiae K. lactis P. pastoris Sz. pombe
Phag
ocyt
ic c
ells
(%)
S. cerevisiae K. lactis P. pastoris Sz. pombe
010
20304050
607080
90100
1 3 5 7 9 11
MOI
0
50
100
150
200
250
300
350
400
450
1 3 5 7 9 11
MOI
Results
119
macrophages was assessed for each MOI. Results are presented as mean values ± standard deviation from triplicates.
3.1.1. Role of Dectin-1 on yeast uptake by IC-21 murine macrophages
Since some macrophages do not bear the mannose receptor (MR) on the cell surface,
such as resident peritoneal mouse macrophages (Taylor et al., 2002) and the J774
murine macrophage cell line (Martinez-Pomares et al., 2003), the presence of this
receptor in IC-21 cells was investigated.
Murine macrophages were incubated with rat anti-mouse MR or mouse anti-
mouse Dectin-1 and subsequently with anti-rat IgG-FITC and anti-mouse IgG-FITC,
respectively, before being analyzed by flow cytometry. As shown in Fig. 12 A, IC-21
macrophages do not express MR on their surface. In contrast, Dectin-1 is highly
expressed in this cell line (Fig. 12 B).
A B
Fig. 12. IC-21 murine macrophages were assessed for surface expression of MR (A) and Dectin-1 (B). Cells were first stained with monoclonal anti-MR, anti-Dectin-1, or an isotype control antibody, and then with a FITC-conjugated anti-IgG secondary antibody. Dashed lines represent cells stained with the isotype control antibody. Green solid lines represent cells stained for the mannose receptor and red solid lines represent cells stained for the Dectin-1 receptor. A total of 25,000 cells was analyzed. Next, the effect of Dectin-1 on yeast uptake by IC-21 was examined. Cells were
incubated with 25 μg/ml anti-Dectin-1 for 1 h at 37°C, prior to the addition of S.
cerevisiae, K. lactis, P. pastoris and Sz. pombe, at MOI 5. This yeast:macrophage ratio
was chosen because it provided sufficient yeast-phagocyte interactions, and MOI values
higher than 5 are very difficult to analyze microscopically. The appropriate antibody
concentration was previously determined (not shown). After 4 h of incubation, cells
were vigorously washed, fixed, and analyzed by light microscopy. As seen in Fig. 13,
blocking of Dectin-1 caused a decrease in uptake of all yeast species tested. The
Num
ber o
f cel
ls
300
240
180
120
60
0 100 101 102 103 104
Fluorescence 100 101 102 103 104
Fluorescence
300
240
180
120
60
0
Num
ber o
f cel
ls
~ 0.75% ~ 96%
MR Dectin-1
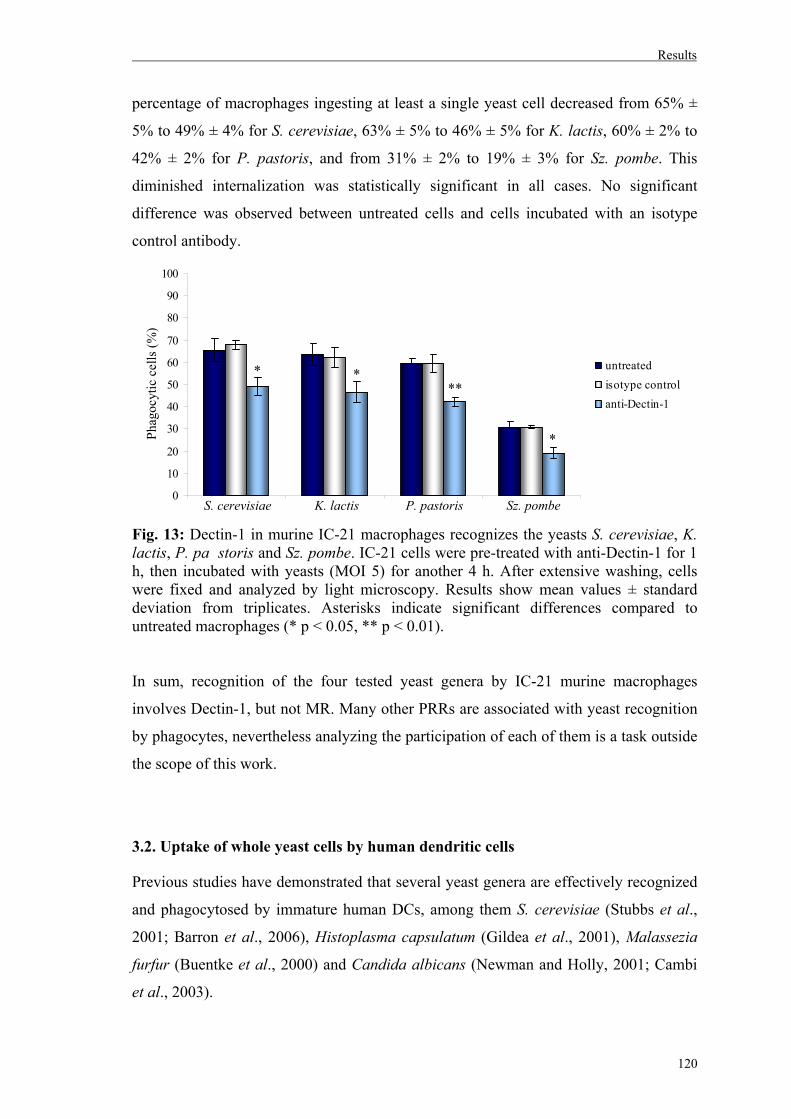
Results
120
percentage of macrophages ingesting at least a single yeast cell decreased from 65% ±
5% to 49% ± 4% for S. cerevisiae, 63% ± 5% to 46% ± 5% for K. lactis, 60% ± 2% to
42% ± 2% for P. pastoris, and from 31% ± 2% to 19% ± 3% for Sz. pombe. This
diminished internalization was statistically significant in all cases. No significant
difference was observed between untreated cells and cells incubated with an isotype
control antibody.
Fig. 13: Dectin-1 in murine IC-21 macrophages recognizes the yeasts S. cerevisiae, K. lactis, P. pa storis and Sz. pombe. IC-21 cells were pre-treated with anti-Dectin-1 for 1 h, then incubated with yeasts (MOI 5) for another 4 h. After extensive washing, cells were fixed and analyzed by light microscopy. Results show mean values ± standard deviation from triplicates. Asterisks indicate significant differences compared to untreated macrophages (* p < 0.05, ** p < 0.01). In sum, recognition of the four tested yeast genera by IC-21 murine macrophages
involves Dectin-1, but not MR. Many other PRRs are associated with yeast recognition
by phagocytes, nevertheless analyzing the participation of each of them is a task outside
the scope of this work.
3.2. Uptake of whole yeast cells by human dendritic cells
Previous studies have demonstrated that several yeast genera are effectively recognized
and phagocytosed by immature human DCs, among them S. cerevisiae (Stubbs et al.,
2001; Barron et al., 2006), Histoplasma capsulatum (Gildea et al., 2001), Malassezia
furfur (Buentke et al., 2000) and Candida albicans (Newman and Holly, 2001; Cambi
et al., 2003).
0
10
20
30
40
50
60
70
80
90
100
untreatedisotype controlanti-Dectin-1
*
* ***
0
10
20
30
40
50
60
70
80
90
100
untreatedisotype controlanti-Dectin-1
*
* ***
S. cerevisiae K. lactis P. pastoris Sz. pombe
Phag
ocyt
ic c
ells
(%)
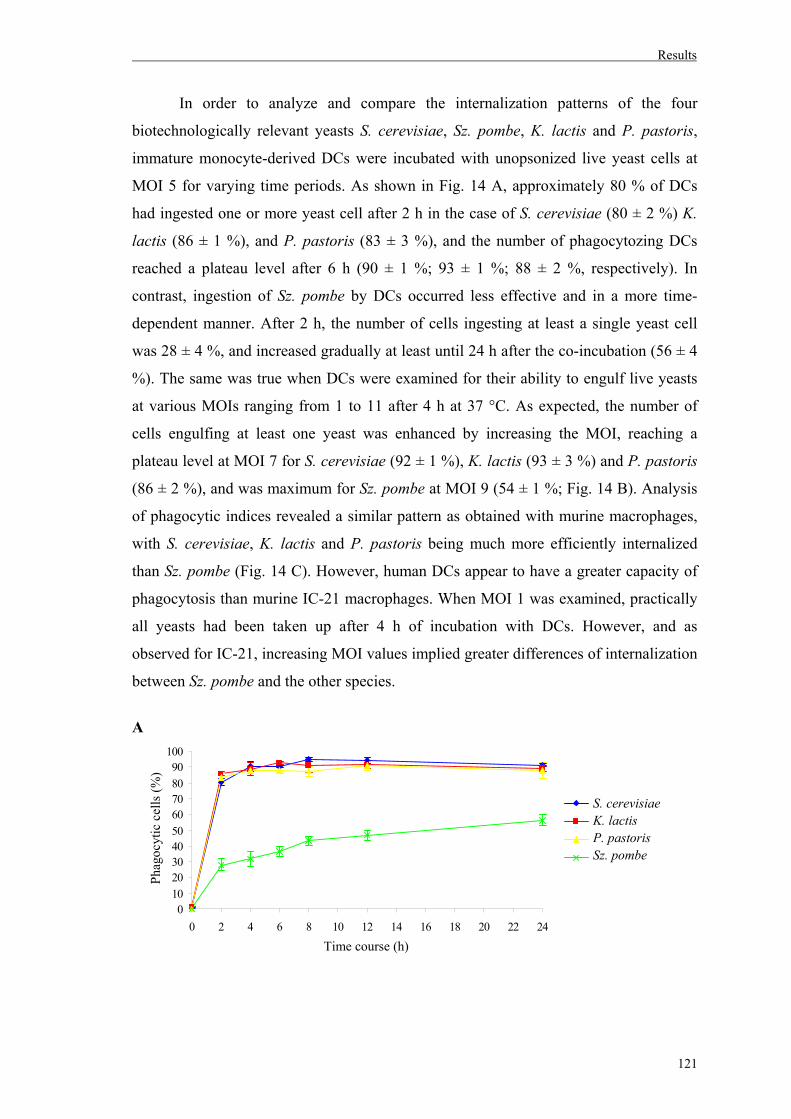
Results
121
In order to analyze and compare the internalization patterns of the four
biotechnologically relevant yeasts S. cerevisiae, Sz. pombe, K. lactis and P. pastoris,
immature monocyte-derived DCs were incubated with unopsonized live yeast cells at
MOI 5 for varying time periods. As shown in Fig. 14 A, approximately 80 % of DCs
had ingested one or more yeast cell after 2 h in the case of S. cerevisiae (80 ± 2 %) K.
lactis (86 ± 1 %), and P. pastoris (83 ± 3 %), and the number of phagocytozing DCs
reached a plateau level after 6 h (90 ± 1 %; 93 ± 1 %; 88 ± 2 %, respectively). In
contrast, ingestion of Sz. pombe by DCs occurred less effective and in a more time-
dependent manner. After 2 h, the number of cells ingesting at least a single yeast cell
was 28 ± 4 %, and increased gradually at least until 24 h after the co-incubation (56 ± 4
%). The same was true when DCs were examined for their ability to engulf live yeasts
at various MOIs ranging from 1 to 11 after 4 h at 37 °C. As expected, the number of
cells engulfing at least one yeast was enhanced by increasing the MOI, reaching a
plateau level at MOI 7 for S. cerevisiae (92 ± 1 %), K. lactis (93 ± 3 %) and P. pastoris
(86 ± 2 %), and was maximum for Sz. pombe at MOI 9 (54 ± 1 %; Fig. 14 B). Analysis
of phagocytic indices revealed a similar pattern as obtained with murine macrophages,
with S. cerevisiae, K. lactis and P. pastoris being much more efficiently internalized
than Sz. pombe (Fig. 14 C). However, human DCs appear to have a greater capacity of
phagocytosis than murine IC-21 macrophages. When MOI 1 was examined, practically
all yeasts had been taken up after 4 h of incubation with DCs. However, and as
observed for IC-21, increasing MOI values implied greater differences of internalization
between Sz. pombe and the other species.
A
0102030405060708090
100
0 2 4 6 8 10 12 14 16 18 20 22 24
S. cerevisiae K. lactis P. pastoris Sz. pombe
Phag
ocyt
ic c
ells
(%)
Time course (h)
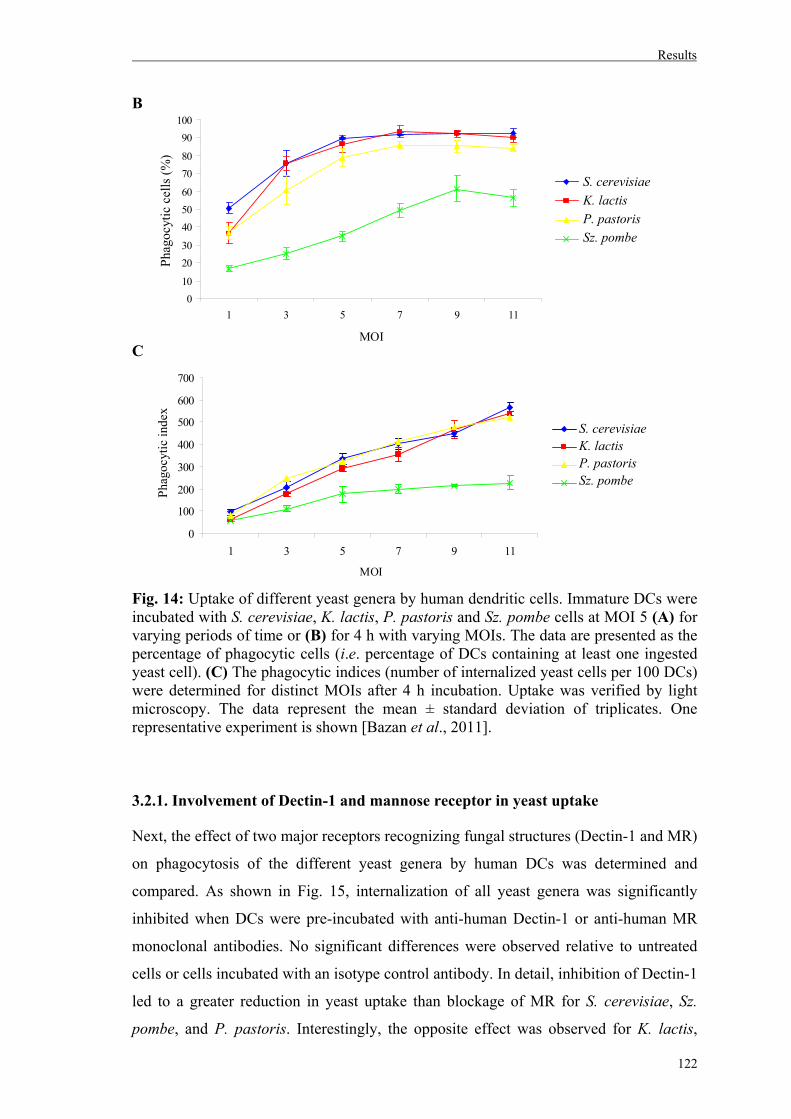
Results
122
B
C
Fig. 14: Uptake of different yeast genera by human dendritic cells. Immature DCs were incubated with S. cerevisiae, K. lactis, P. pastoris and Sz. pombe cells at MOI 5 (A) for varying periods of time or (B) for 4 h with varying MOIs. The data are presented as the percentage of phagocytic cells (i.e. percentage of DCs containing at least one ingested yeast cell). (C) The phagocytic indices (number of internalized yeast cells per 100 DCs) were determined for distinct MOIs after 4 h incubation. Uptake was verified by light microscopy. The data represent the mean ± standard deviation of triplicates. One representative experiment is shown [Bazan et al., 2011].
3.2.1. Involvement of Dectin-1 and mannose receptor in yeast uptake
Next, the effect of two major receptors recognizing fungal structures (Dectin-1 and MR)
on phagocytosis of the different yeast genera by human DCs was determined and
compared. As shown in Fig. 15, internalization of all yeast genera was significantly
inhibited when DCs were pre-incubated with anti-human Dectin-1 or anti-human MR
monoclonal antibodies. No significant differences were observed relative to untreated
cells or cells incubated with an isotype control antibody. In detail, inhibition of Dectin-1
led to a greater reduction in yeast uptake than blockage of MR for S. cerevisiae, Sz.
pombe, and P. pastoris. Interestingly, the opposite effect was observed for K. lactis,
0
100
200
300
400
500
600
700
1 3 5 7 9 11
MOI
S. cerevisiae K. lactis P. pastoris Sz. pombe
010
2030
405060
7080
90100
1 3 5 7 9 11
MOI
Phag
ocyt
ic c
ells
(%)
S. cerevisiae K. lactis P. pastoris Sz. pombe
Phag
ocyt
ic in
dex
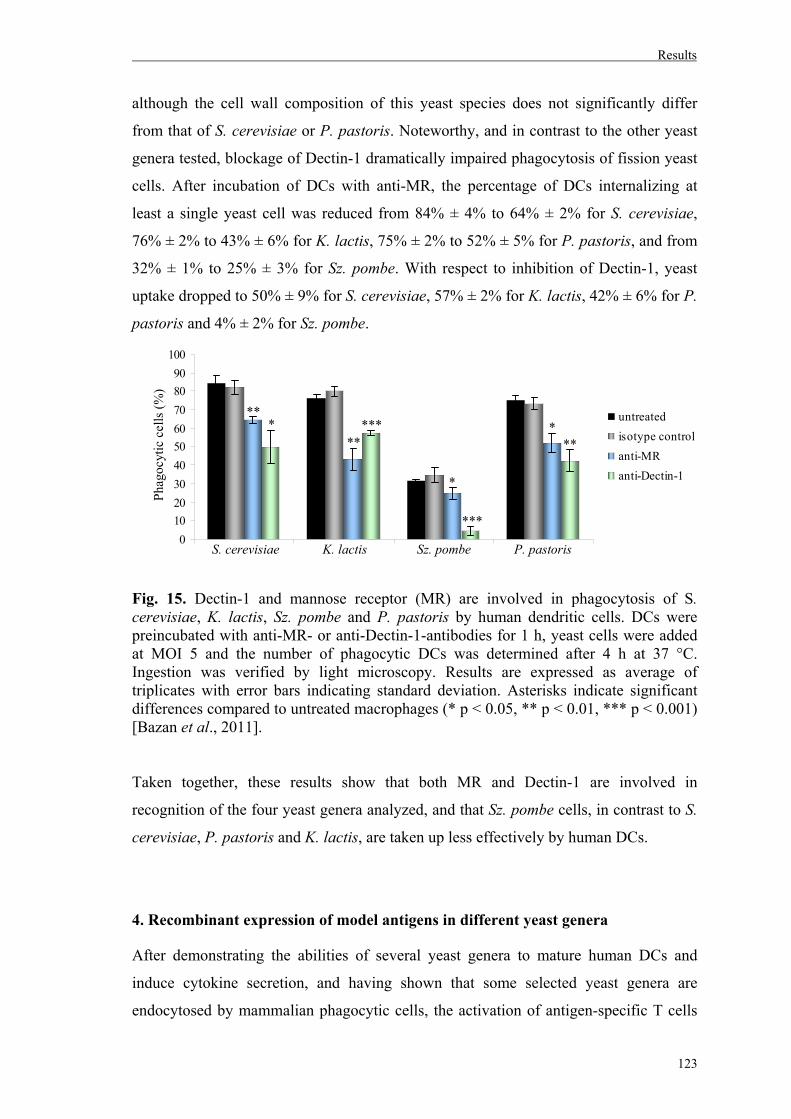
Results
123
although the cell wall composition of this yeast species does not significantly differ
from that of S. cerevisiae or P. pastoris. Noteworthy, and in contrast to the other yeast
genera tested, blockage of Dectin-1 dramatically impaired phagocytosis of fission yeast
cells. After incubation of DCs with anti-MR, the percentage of DCs internalizing at
least a single yeast cell was reduced from 84% ± 4% to 64% ± 2% for S. cerevisiae,
76% ± 2% to 43% ± 6% for K. lactis, 75% ± 2% to 52% ± 5% for P. pastoris, and from
32% ± 1% to 25% ± 3% for Sz. pombe. With respect to inhibition of Dectin-1, yeast
uptake dropped to 50% ± 9% for S. cerevisiae, 57% ± 2% for K. lactis, 42% ± 6% for P.
pastoris and 4% ± 2% for Sz. pombe.
Fig. 15. Dectin-1 and mannose receptor (MR) are involved in phagocytosis of S. cerevisiae, K. lactis, Sz. pombe and P. pastoris by human dendritic cells. DCs were preincubated with anti-MR- or anti-Dectin-1-antibodies for 1 h, yeast cells were added at MOI 5 and the number of phagocytic DCs was determined after 4 h at 37 °C. Ingestion was verified by light microscopy. Results are expressed as average of triplicates with error bars indicating standard deviation. Asterisks indicate significant differences compared to untreated macrophages (* p < 0.05, ** p < 0.01, *** p < 0.001) [Bazan et al., 2011]. Taken together, these results show that both MR and Dectin-1 are involved in
recognition of the four yeast genera analyzed, and that Sz. pombe cells, in contrast to S.
cerevisiae, P. pastoris and K. lactis, are taken up less effectively by human DCs.
4. Recombinant expression of model antigens in different yeast genera
After demonstrating the abilities of several yeast genera to mature human DCs and
induce cytokine secretion, and having shown that some selected yeast genera are
endocytosed by mammalian phagocytic cells, the activation of antigen-specific T cells
0102030405060708090
100
untreatedisotype controlanti-MRanti-Dectin-1*
* ***
** *****
***0
102030405060708090
100
untreatedisotype controlanti-MRanti-Dectin-1*
* ***
** *****
***
Phag
ocyt
ic c
ells
(%)
S. cerevisiae K. lactis Sz. pombe P. pastoris
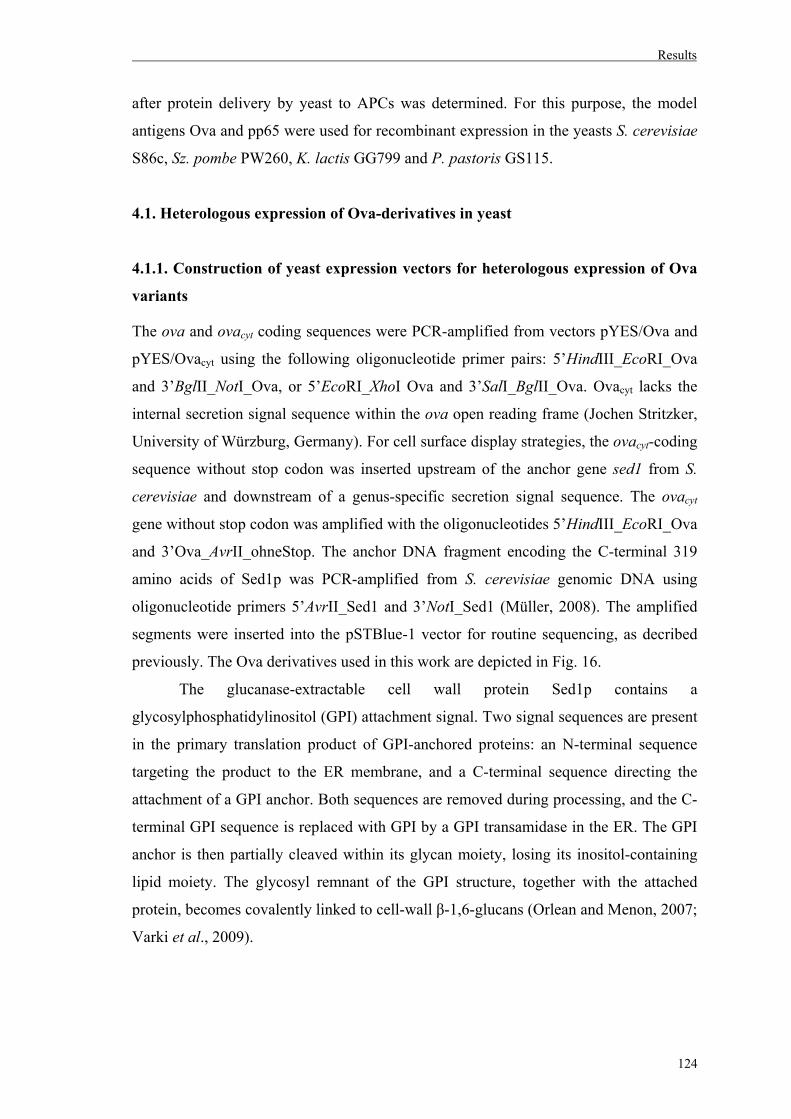
Results
124
after protein delivery by yeast to APCs was determined. For this purpose, the model
antigens Ova and pp65 were used for recombinant expression in the yeasts S. cerevisiae
S86c, Sz. pombe PW260, K. lactis GG799 and P. pastoris GS115.
4.1. Heterologous expression of Ova-derivatives in yeast
4.1.1. Construction of yeast expression vectors for heterologous expression of Ova
variants
The ova and ovacyt coding sequences were PCR-amplified from vectors pYES/Ova and
pYES/Ovacyt using the following oligonucleotide primer pairs: 5’HindIII_EcoRI_Ova
and 3’BglII_NotI_Ova, or 5’EcoRI_XhoI Ova and 3’SalI_BglII_Ova. Ovacyt lacks the
internal secretion signal sequence within the ova open reading frame (Jochen Stritzker,
University of Würzburg, Germany). For cell surface display strategies, the ovacyt-coding
sequence without stop codon was inserted upstream of the anchor gene sed1 from S.
cerevisiae and downstream of a genus-specific secretion signal sequence. The ovacyt
gene without stop codon was amplified with the oligonucleotides 5’HindIII_EcoRI_Ova
and 3’Ova_AvrII_ohneStop. The anchor DNA fragment encoding the C-terminal 319
amino acids of Sed1p was PCR-amplified from S. cerevisiae genomic DNA using
oligonucleotide primers 5’AvrII_Sed1 and 3’NotI_Sed1 (Müller, 2008). The amplified
segments were inserted into the pSTBlue-1 vector for routine sequencing, as decribed
previously. The Ova derivatives used in this work are depicted in Fig. 16.
The glucanase-extractable cell wall protein Sed1p contains a
glycosylphosphatidylinositol (GPI) attachment signal. Two signal sequences are present
in the primary translation product of GPI-anchored proteins: an N-terminal sequence
targeting the product to the ER membrane, and a C-terminal sequence directing the
attachment of a GPI anchor. Both sequences are removed during processing, and the C-
terminal GPI sequence is replaced with GPI by a GPI transamidase in the ER. The GPI
anchor is then partially cleaved within its glycan moiety, losing its inositol-containing
lipid moiety. The glycosyl remnant of the GPI structure, together with the attached
protein, becomes covalently linked to cell-wall β-1,6-glucans (Orlean and Menon, 2007;
Varki et al., 2009).
Results
125
Fig. 16. Schematic representation and subcellular localization of the different Ova derivatives used in this study. Ova is secreted due to the presence of an internal secretion signal (SS), which is removed for intracellular expression (Ovacyt). Alternatively, Ovacyt was fused to the C-terminal part of the cell wall protein Sed1p leading to a anchoring of the fusion within the cell wall; in this derivative, the particular genus-specific SS was used. The position of the epitope SIINFEKL is indicated. Cloning into yeast expression vectors was performed as follows:
S. cerevisiae
The ova and ovacyt coding sequences were digested from the cloning vector pSTBlue-1
with XhoI and BglII for inserting into XhoI/BglII-digested S. cerevisiae pFB2
expression vector. The resultant plasmids were named pPGK/ova and pPGK/ovacyt,
respectively. For cell-surface display of Ovacyt, the fusion ovacyt/sed1 was excised from
vector pPIC9/ovacyt/sed1 (described below) by digestion with NotI, end-filling with
Klenow polymerase, and then restricting with EcoRI. This fragment was cloned into
pFB2 digested with BglII, blunted with Klenow and finally digested with EcoRI. This
pPGK-derived expression vector contains a KRE1 signal peptide sequence upstream of
the cloning region. The resultant plasmid was named pFB/ovacyt/sed1.
Sz. pombe
The multiple cloning site of the thiamine-repressible expression vector pREP1 was
modified and the plasmid is referred to as pREP-BD (Diehl, 2008). This Sz. pombe
expression vector was XhoI and BglII digested for ligation with both full-length
ovalbumin and ovacyt which were isolated from XhoI/BglII-digested pSTBlue-1 vector.
The resulting plasmids were named pREP-BD/ova and pREP-BD/ovacyt, respectively.
SS
SS
secreted
cytosolic
cell wall
SSSS
SSSS
secreted
cytosolic
cell wall
secreted
cytosolic
cell wall
SIINFEKL
SS
SS
secreted
cytosolic
cell wall
SSSS
SSSS
secreted
cytosolic
cell wall
secreted
cytosolic
cell wall
SIINFEKLSIINFEKL
Ova Ovacyt
Ovacyt/Sed1
Results
126
K. lactis
For cloning into the K. lactis expression vector, full-length ova was digested with
HindIII and NotI and ligated to pKLAC1 previously digested with the same restriction
endonucleases. The gene encoding ovacyt was restricted with HindIII/BglII and inserted
into the HindIII and BglII sites of pKLAC1. The fusion ovacyt/sed was digested from
pPIC9/ovacyt/sed1 with EcoRI, filled with Klenow polymerase and subsequently
digested with NotI for cloning into pKLAC1 restricted with SalI, blunt-ended and
digested with NotI, giving rise to pKLAC1/ovacyt/sed. The constructed vectors
pKLAC1/ova, pKLAC1/ovacyt and pKLAC1/ovacyt/sed were linearized with SacII prior
to integrative transformation of chemically competent K. lactis GG799. The expression
cassette can therefore integrate into the K. lactis genome at the LAC4 locus by means of
homologous recombination.
P. pastoris
The genes encoding ova and ovacyt were excised from pSTBlue-1 by digestion with
EcoRI and NotI, and ligated to the EcoRI/NotI sites in pPIC3.5 vector, giving rise to
pPIC3.5/ova and pPIC3.5/ovacyt. To link ovacyt to sed1, the sequence encoding ovacyt
without stop codon was isolated as an EcoRI-AvrII fragment from pSTBlue-1 and
inserted upstream of the sed1 coding sequence in vector pPIC9/sed1 previously digested
with EcoRI and AvrII, generating pPIC9/ovacyt/sed1. The vectors were linearized with
SalI before transformation of P. pastoris cells in order to direct genomic integration at
the his4 locus.
4.1.2. Analysis of recombinant expression of Ovacyt by different yeast genera
In order to verify cytosolic expression of recombinant Ovacyt, lysates from 3×10⁸ yeast
cells cultured for until 72 h in the respective media were precipitated with DOC/TCA
and applied to SDS-polyacrylamide gels. Western blots were performed using rabbit
anti-chicken egg albumin and goat anti-rabbit IgG-peroxidase.
After transformation of S. cerevisiae S86c with pPGK/ovacyt, some transformant
colonies were inoculated in ura d/o medium and then analyzed for cytosolic expression
of the recombinant protein. Foreign protein expression in S. cerevisiae was driven from
the constitutive promoter PGK. As seen in Fig. 17 A (lane 1), a single protein band in
the expected size of ~28 kDa could be detected by the anti-Ova antibody in cell lysates
Results
127
of S. cerevisiae transformed with pPGK/ovacyt. This band was absent in the cell extract
of S. cerevisiae carrying the empty vector YEp352 (Fig. 17 A, lane 2).
Sz. pombe strain PW260 was transformed with the expression vector pREP-
BD/ovacyt, as well as with the plasmid pREP-BD containing no insert. To induce
expression from the nmt1 promoter, transformants were grown in EMM medium
lacking leucine. Fig 17 B shows a 28 kDa protein band specific to the cell extract of
yeast cells transformed with pREP-BD/ovacyt (lane 2). It was observed that some lower
molecular weight proteins present in the cell lysates of Sz. pombe containing pREP-
BD/ovacyt reacted positively with the antibody, probably being produced or created
during recombinant protein expression, and presumably resulting from degradation of
Ovacyt, since these bands are not present in lysates of PW260 cells carrying the empty
vector (Fig. 17 B, lane 3).
K. lactis GG799 transformant colonies selected on YCB agar plates were
cultivated in YPGal medium for LAC4-driven expression of Ovacyt. As a control, K.
lactis was also transformed with empty pKLAC1. As shown in Fig. 17 C, a 28-kDa
protein band in total yeast extracts reacted positively with the anti-Ova antibody (lane
2). This band was absent in cell lysates from K. lactis harbouring the empty vector
pKLAC1 (Fig. 17 C, lane 1). Some proteins above the Ovacyt band reacted
unspecifically with the anti-Ova antibody, as they also appeared in the negative control
(K. lactis carrying the empty vector pKLAC1).
Colonies of P. pastoris GS115 transformed with the expression vector
pPIC3.5/ovacyt and selected onto his d/o agar medium were grown in BMG medium and
shifted to inducing BMM medium for proper protein expression. Methanol was added
every 24 h (final concentration = 0.5% v/v) to maintain induction. As shown in Fig. 17
D, cell lysates of induced P. pastoris cells showed a specific 28-kDa protein band
corresponding to Ovacyt (lane 2), which was absent in total extracts from methanol-
induced control cells (lane 3). Additional bands present in the lysates from cells
harboring pPIC3.5/ovacyt and pPIC9 reacted unspecifically with the anti-Ova antibody.
Another lower molecular weight protein band could be seen in the lysate from Ovacyt-
expressing cells (~15 kDa, lane 2), which might indicate degradation of the recombinant
protein.
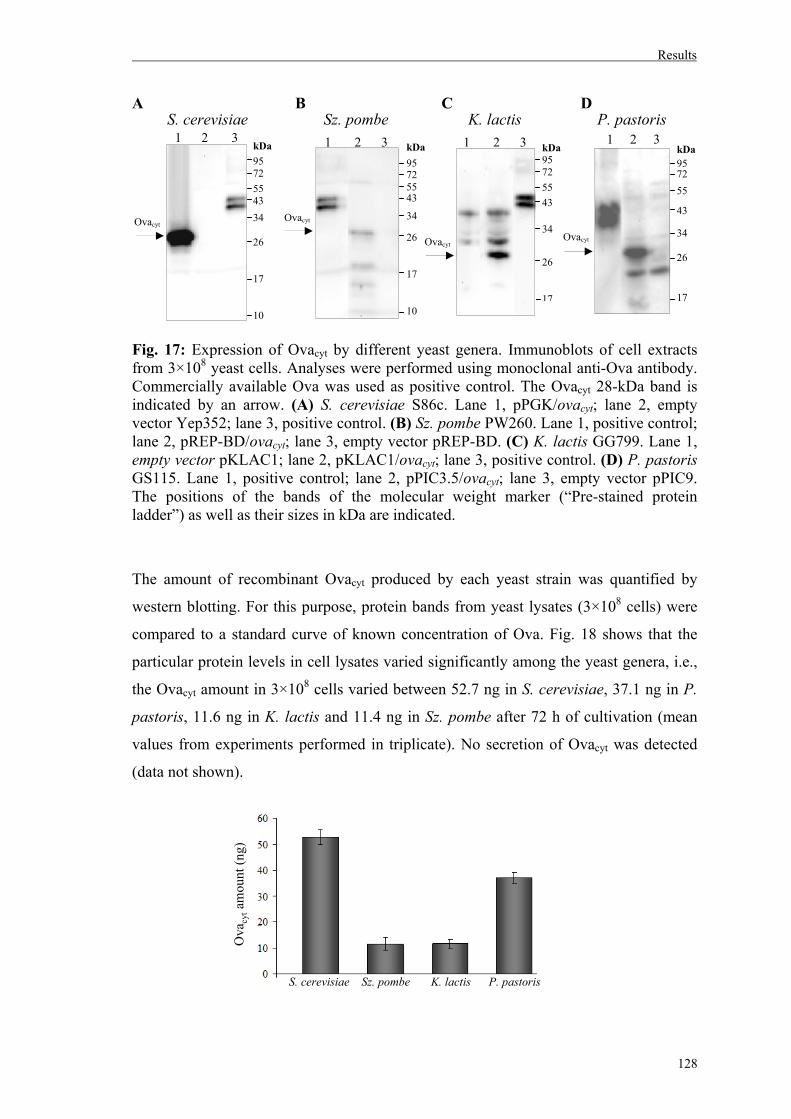
Results
128
A B C D
Fig. 17: Expression of Ovacyt by different yeast genera. Immunoblots of cell extracts from 3×10⁸ yeast cells. Analyses were performed using monoclonal anti-Ova antibody. Commercially available Ova was used as positive control. The Ovacyt 28-kDa band is indicated by an arrow. (A) S. cerevisiae S86c. Lane 1, pPGK/ovacyt; lane 2, empty vector Yep352; lane 3, positive control. (B) Sz. pombe PW260. Lane 1, positive control; lane 2, pREP-BD/ovacyt; lane 3, empty vector pREP-BD. (C) K. lactis GG799. Lane 1, empty vector pKLAC1; lane 2, pKLAC1/ovacyt; lane 3, positive control. (D) P. pastoris GS115. Lane 1, positive control; lane 2, pPIC3.5/ovacyt; lane 3, empty vector pPIC9. The positions of the bands of the molecular weight marker (“Pre-stained protein ladder”) as well as their sizes in kDa are indicated.
The amount of recombinant Ovacyt produced by each yeast strain was quantified by
western blotting. For this purpose, protein bands from yeast lysates (3×10⁸ cells) were
compared to a standard curve of known concentration of Ova. Fig. 18 shows that the
particular protein levels in cell lysates varied significantly among the yeast genera, i.e.,
the Ovacyt amount in 3×10⁸ cells varied between 52.7 ng in S. cerevisiae, 37.1 ng in P.
pastoris, 11.6 ng in K. lactis and 11.4 ng in Sz. pombe after 72 h of cultivation (mean
values from experiments performed in triplicate). No secretion of Ovacyt was detected
(data not shown).
Ovacyt
kDa
95 72
55 43
34 26 17 10
kDa
95 72 55 43
34 26 17 10
kDa
95 72
55 43 34 26 17
1 2 3 1 2 3 kDa 95 72
55
43
34
26 17
1 2 3 1 2 3
S. cerevisiae Sz. pombe K. lactis P. pastoris
S. cerevisiae Sz. pombe K. lactis P. pastoris
Ova
cytam
ount
(ng)
Ovacyt
Ovacyt Ovacyt
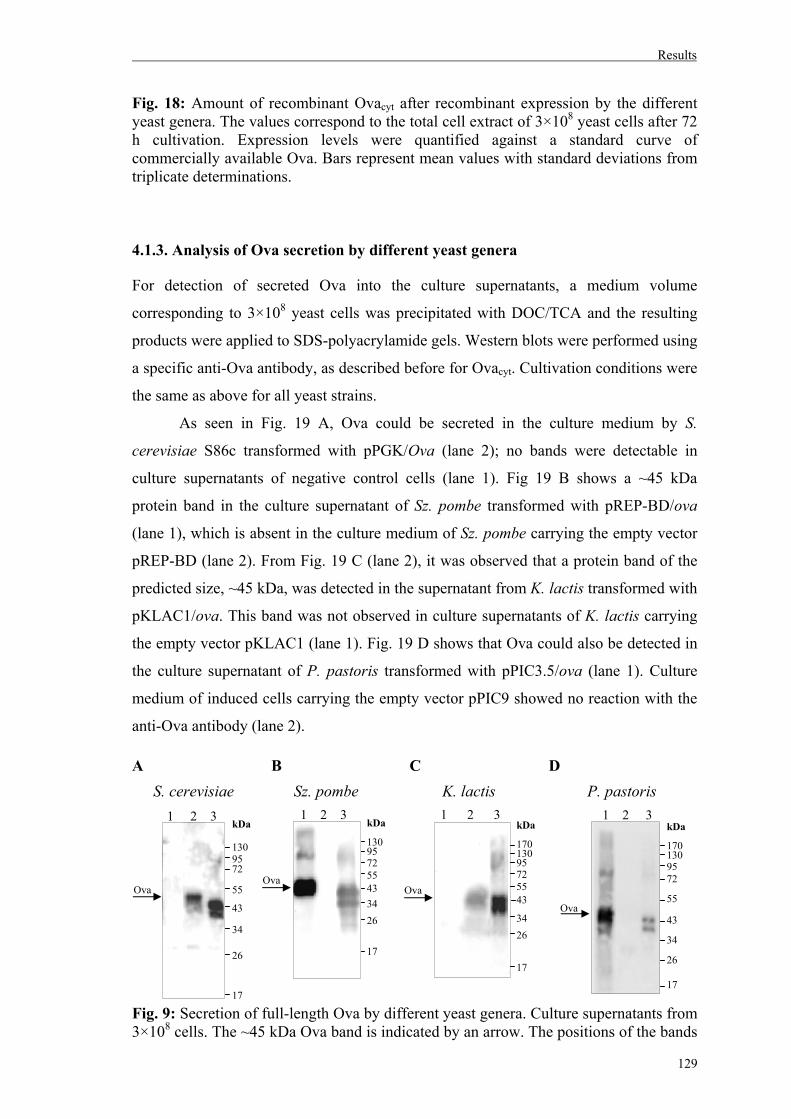
Results
129
Fig. 18: Amount of recombinant Ovacyt after recombinant expression by the different yeast genera. The values correspond to the total cell extract of 3×10⁸ yeast cells after 72 h cultivation. Expression levels were quantified against a standard curve of commercially available Ova. Bars represent mean values with standard deviations from triplicate determinations.
4.1.3. Analysis of Ova secretion by different yeast genera
For detection of secreted Ova into the culture supernatants, a medium volume
corresponding to 3×10⁸ yeast cells was precipitated with DOC/TCA and the resulting
products were applied to SDS-polyacrylamide gels. Western blots were performed using
a specific anti-Ova antibody, as described before for Ovacyt. Cultivation conditions were
the same as above for all yeast strains.
As seen in Fig. 19 A, Ova could be secreted in the culture medium by S.
cerevisiae S86c transformed with pPGK/Ova (lane 2); no bands were detectable in
culture supernatants of negative control cells (lane 1). Fig 19 B shows a ~45 kDa
protein band in the culture supernatant of Sz. pombe transformed with pREP-BD/ova
(lane 1), which is absent in the culture medium of Sz. pombe carrying the empty vector
pREP-BD (lane 2). From Fig. 19 C (lane 2), it was observed that a protein band of the
predicted size, ~45 kDa, was detected in the supernatant from K. lactis transformed with
pKLAC1/ova. This band was not observed in culture supernatants of K. lactis carrying
the empty vector pKLAC1 (lane 1). Fig. 19 D shows that Ova could also be detected in
the culture supernatant of P. pastoris transformed with pPIC3.5/ova (lane 1). Culture
medium of induced cells carrying the empty vector pPIC9 showed no reaction with the
anti-Ova antibody (lane 2). A B C D
Fig. 9: Secretion of full-length Ova by different yeast genera. Culture supernatants from 3×10⁸ cells. The ~45 kDa Ova band is indicated by an arrow. The positions of the bands
Ova
kDa 130 95 72 55
43 34 26 17
1 2 3 1 2 3 kDa 130 95 72 55 43
34
26 17
kDa 170 130 95 72 55 43
34
26
17
1 2 3 kDa 170 130 95 72
55 43
34
26 17
1 2 3
S. cerevisiae Sz. pombe K. lactis P. pastoris
Ova
Ova Ova
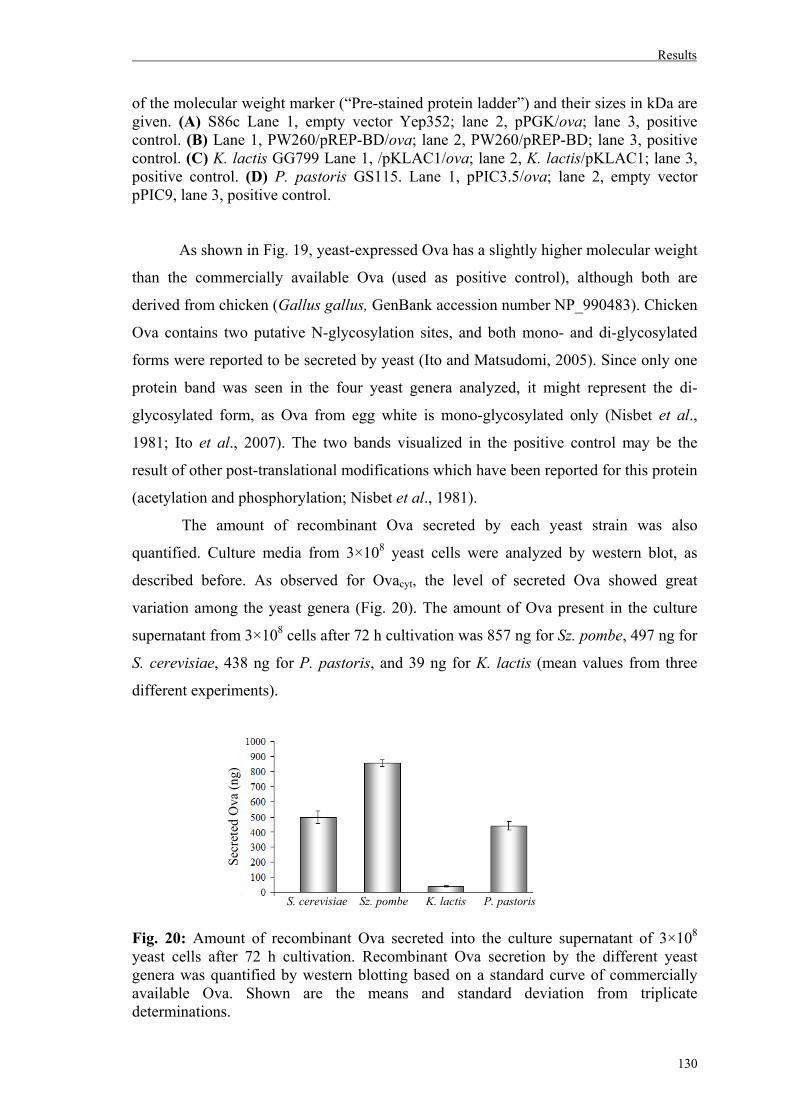
Results
130
of the molecular weight marker (“Pre-stained protein ladder”) and their sizes in kDa are given. (A) S86c Lane 1, empty vector Yep352; lane 2, pPGK/ova; lane 3, positive control. (B) Lane 1, PW260/pREP-BD/ova; lane 2, PW260/pREP-BD; lane 3, positive control. (C) K. lactis GG799 Lane 1, /pKLAC1/ova; lane 2, K. lactis/pKLAC1; lane 3, positive control. (D) P. pastoris GS115. Lane 1, pPIC3.5/ova; lane 2, empty vector pPIC9, lane 3, positive control.
As shown in Fig. 19, yeast-expressed Ova has a slightly higher molecular weight
than the commercially available Ova (used as positive control), although both are
derived from chicken (Gallus gallus, GenBank accession number NP_990483). Chicken
Ova contains two putative N-glycosylation sites, and both mono- and di-glycosylated
forms were reported to be secreted by yeast (Ito and Matsudomi, 2005). Since only one
protein band was seen in the four yeast genera analyzed, it might represent the di-
glycosylated form, as Ova from egg white is mono-glycosylated only (Nisbet et al.,
1981; Ito et al., 2007). The two bands visualized in the positive control may be the
result of other post-translational modifications which have been reported for this protein
(acetylation and phosphorylation; Nisbet et al., 1981).
The amount of recombinant Ova secreted by each yeast strain was also
quantified. Culture media from 3×10⁸ yeast cells were analyzed by western blot, as
described before. As observed for Ovacyt, the level of secreted Ova showed great
variation among the yeast genera (Fig. 20). The amount of Ova present in the culture
supernatant from 3×10⁸ cells after 72 h cultivation was 857 ng for Sz. pombe, 497 ng for
S. cerevisiae, 438 ng for P. pastoris, and 39 ng for K. lactis (mean values from three
different experiments).
Fig. 20: Amount of recombinant Ova secreted into the culture supernatant of 3×10⁸ yeast cells after 72 h cultivation. Recombinant Ova secretion by the different yeast genera was quantified by western blotting based on a standard curve of commercially available Ova. Shown are the means and standard deviation from triplicate determinations.
S. cerevisiae Sz. pombe K. lactis P. pastoris
Secr
eted
Ova
(ng)
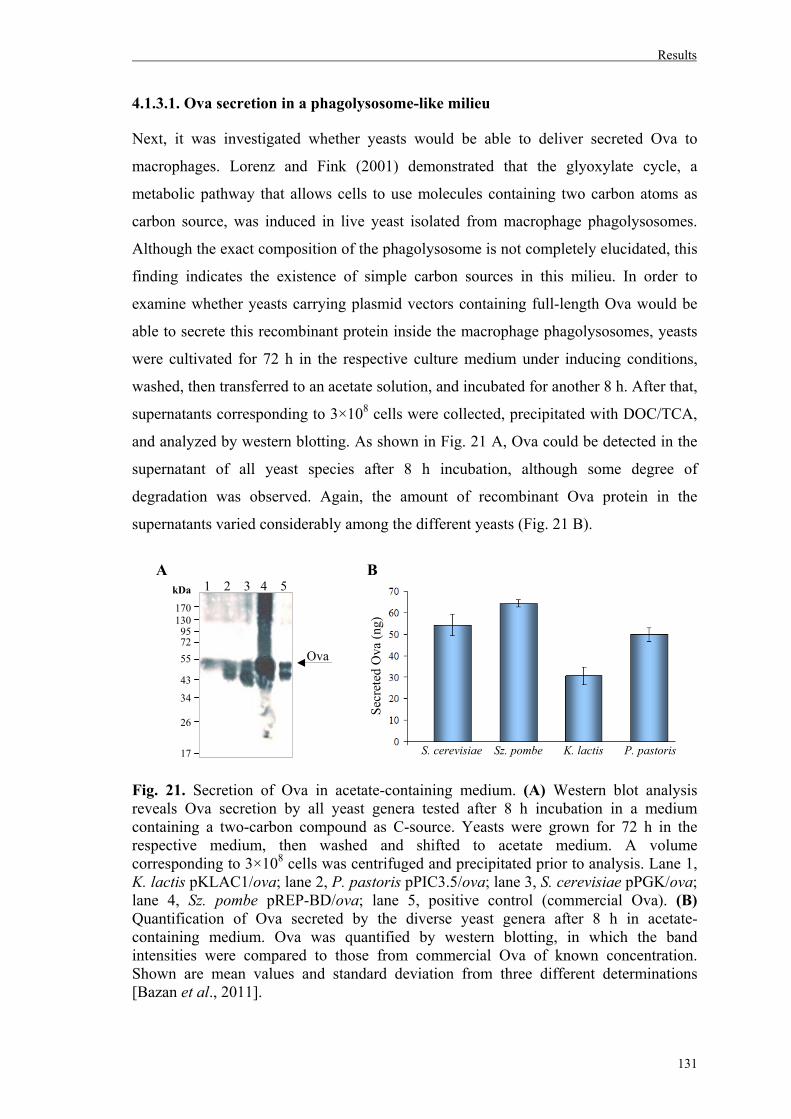
Results
131
4.1.3.1. Ova secretion in a phagolysosome-like milieu
Next, it was investigated whether yeasts would be able to deliver secreted Ova to
macrophages. Lorenz and Fink (2001) demonstrated that the glyoxylate cycle, a
metabolic pathway that allows cells to use molecules containing two carbon atoms as
carbon source, was induced in live yeast isolated from macrophage phagolysosomes.
Although the exact composition of the phagolysosome is not completely elucidated, this
finding indicates the existence of simple carbon sources in this milieu. In order to
examine whether yeasts carrying plasmid vectors containing full-length Ova would be
able to secrete this recombinant protein inside the macrophage phagolysosomes, yeasts
were cultivated for 72 h in the respective culture medium under inducing conditions,
washed, then transferred to an acetate solution, and incubated for another 8 h. After that,
supernatants corresponding to 3×10⁸ cells were collected, precipitated with DOC/TCA,
and analyzed by western blotting. As shown in Fig. 21 A, Ova could be detected in the
supernatant of all yeast species after 8 h incubation, although some degree of
degradation was observed. Again, the amount of recombinant Ova protein in the
supernatants varied considerably among the different yeasts (Fig. 21 B).
A B Fig. 21. Secretion of Ova in acetate-containing medium. (A) Western blot analysis reveals Ova secretion by all yeast genera tested after 8 h incubation in a medium containing a two-carbon compound as C-source. Yeasts were grown for 72 h in the respective medium, then washed and shifted to acetate medium. A volume corresponding to 3×10⁸ cells was centrifuged and precipitated prior to analysis. Lane 1, K. lactis pKLAC1/ova; lane 2, P. pastoris pPIC3.5/ova; lane 3, S. cerevisiae pPGK/ova; lane 4, Sz. pombe pREP-BD/ova; lane 5, positive control (commercial Ova). (B) Quantification of Ova secreted by the diverse yeast genera after 8 h in acetate-containing medium. Ova was quantified by western blotting, in which the band intensities were compared to those from commercial Ova of known concentration. Shown are mean values and standard deviation from three different determinations [Bazan et al., 2011].
Ova
kDa
170 130
95 72
55
43
34
26
17
1 2 3 4 5
S. cerevisiae Sz. pombe K. lactis P. pastoris
Secr
eted
Ova
(ng)
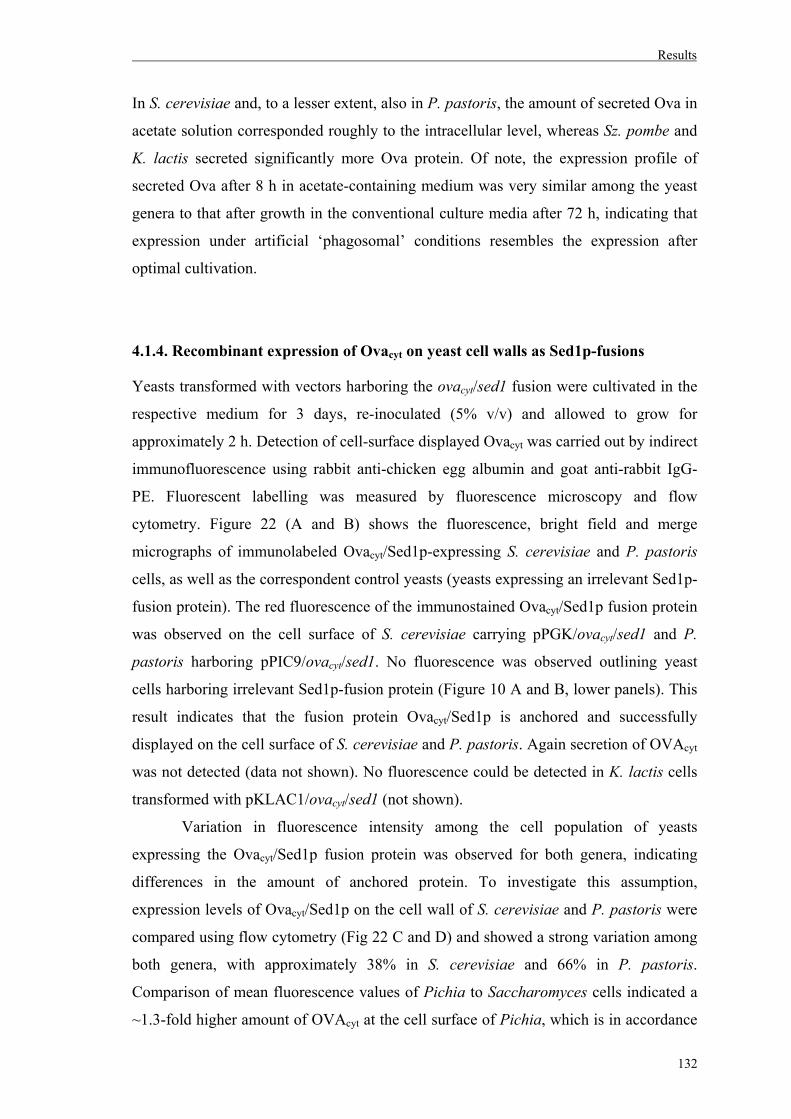
Results
132
In S. cerevisiae and, to a lesser extent, also in P. pastoris, the amount of secreted Ova in
acetate solution corresponded roughly to the intracellular level, whereas Sz. pombe and
K. lactis secreted significantly more Ova protein. Of note, the expression profile of
secreted Ova after 8 h in acetate-containing medium was very similar among the yeast
genera to that after growth in the conventional culture media after 72 h, indicating that
expression under artificial ‘phagosomal’ conditions resembles the expression after
optimal cultivation.
4.1.4. Recombinant expression of Ovacyt on yeast cell walls as Sed1p-fusions
Yeasts transformed with vectors harboring the ovacyt/sed1 fusion were cultivated in the
respective medium for 3 days, re-inoculated (5% v/v) and allowed to grow for
approximately 2 h. Detection of cell-surface displayed Ovacyt was carried out by indirect
immunofluorescence using rabbit anti-chicken egg albumin and goat anti-rabbit IgG-
PE. Fluorescent labelling was measured by fluorescence microscopy and flow
cytometry. Figure 22 (A and B) shows the fluorescence, bright field and merge
micrographs of immunolabeled Ovacyt/Sed1p-expressing S. cerevisiae and P. pastoris
cells, as well as the correspondent control yeasts (yeasts expressing an irrelevant Sed1p-
fusion protein). The red fluorescence of the immunostained Ovacyt/Sed1p fusion protein
was observed on the cell surface of S. cerevisiae carrying pPGK/ovacyt/sed1 and P.
pastoris harboring pPIC9/ovacyt/sed1. No fluorescence was observed outlining yeast
cells harboring irrelevant Sed1p-fusion protein (Figure 10 A and B, lower panels). This
result indicates that the fusion protein Ovacyt/Sed1p is anchored and successfully
displayed on the cell surface of S. cerevisiae and P. pastoris. Again secretion of OVAcyt
was not detected (data not shown). No fluorescence could be detected in K. lactis cells
transformed with pKLAC1/ovacyt/sed1 (not shown).
Variation in fluorescence intensity among the cell population of yeasts
expressing the Ovacyt/Sed1p fusion protein was observed for both genera, indicating
differences in the amount of anchored protein. To investigate this assumption,
expression levels of Ovacyt/Sed1p on the cell wall of S. cerevisiae and P. pastoris were
compared using flow cytometry (Fig 22 C and D) and showed a strong variation among
both genera, with approximately 38% in S. cerevisiae and 66% in P. pastoris.
Comparison of mean fluorescence values of Pichia to Saccharomyces cells indicated a
~1.3-fold higher amount of OVAcyt at the cell surface of Pichia, which is in accordance
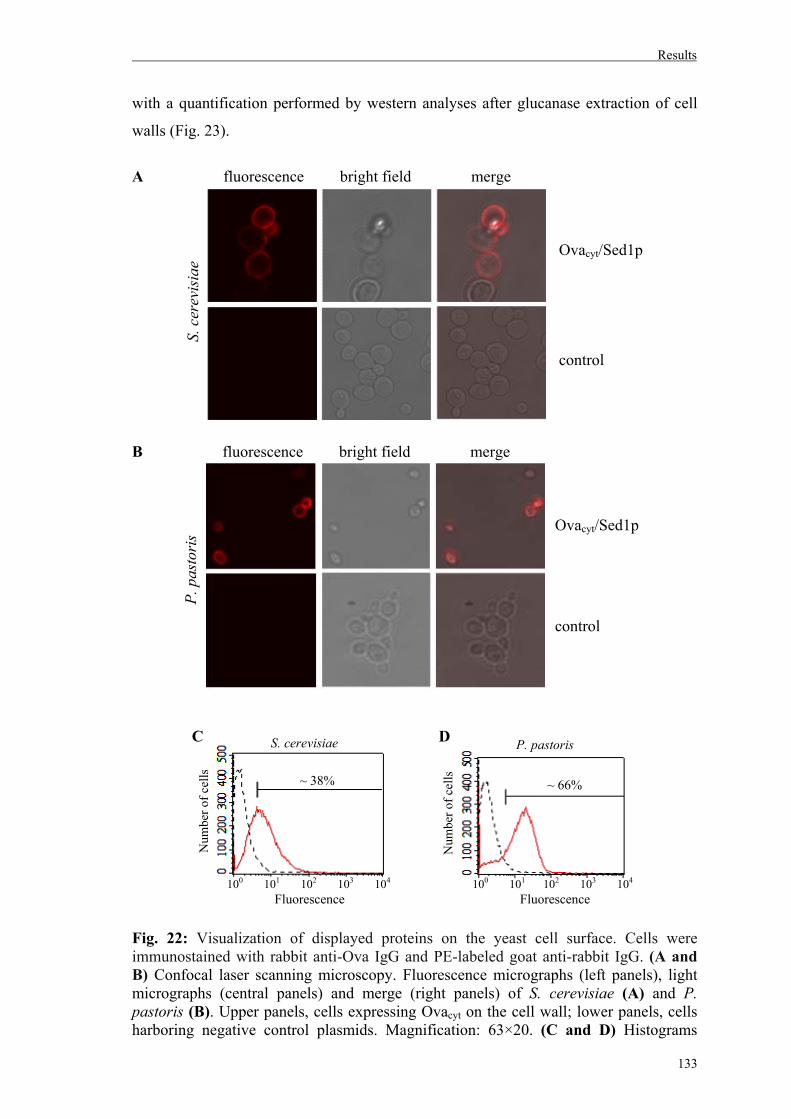
Results
133
with a quantification performed by western analyses after glucanase extraction of cell
walls (Fig. 23).
A fluorescence bright field merge Ovacyt/Sed1p control B fluorescence bright field merge Ovacyt/Sed1p
control C D
Fig. 22: Visualization of displayed proteins on the yeast cell surface. Cells were immunostained with rabbit anti-Ova IgG and PE-labeled goat anti-rabbit IgG. (A and B) Confocal laser scanning microscopy. Fluorescence micrographs (left panels), light micrographs (central panels) and merge (right panels) of S. cerevisiae (A) and P. pastoris (B). Upper panels, cells expressing Ovacyt on the cell wall; lower panels, cells harboring negative control plasmids. Magnification: 63×20. (C and D) Histograms
~ 38% ~ 66%
S. c
erev
isia
eP.
pas
tori
s
P. pastorisS. cerevisiae
Num
bero
f cel
ls
Num
bero
f cel
ls
100 101 102 103 104 Fluorescence
100 101 102 103 104 Fluorescence
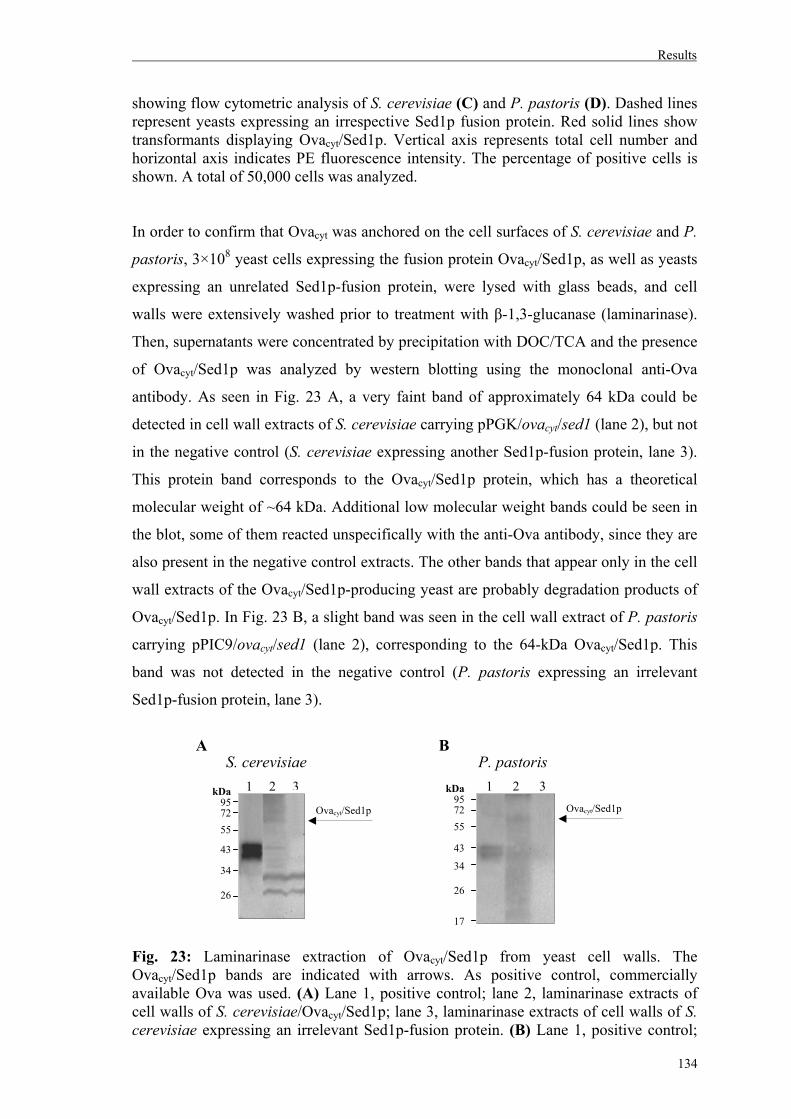
Results
134
showing flow cytometric analysis of S. cerevisiae (C) and P. pastoris (D). Dashed lines represent yeasts expressing an irrespective Sed1p fusion protein. Red solid lines show transformants displaying Ovacyt/Sed1p. Vertical axis represents total cell number and horizontal axis indicates PE fluorescence intensity. The percentage of positive cells is shown. A total of 50,000 cells was analyzed. In order to confirm that Ovacyt was anchored on the cell surfaces of S. cerevisiae and P.
pastoris, 3×10⁸ yeast cells expressing the fusion protein Ovacyt/Sed1p, as well as yeasts
expressing an unrelated Sed1p-fusion protein, were lysed with glass beads, and cell
walls were extensively washed prior to treatment with β-1,3-glucanase (laminarinase).
Then, supernatants were concentrated by precipitation with DOC/TCA and the presence
of Ovacyt/Sed1p was analyzed by western blotting using the monoclonal anti-Ova
antibody. As seen in Fig. 23 A, a very faint band of approximately 64 kDa could be
detected in cell wall extracts of S. cerevisiae carrying pPGK/ovacyt/sed1 (lane 2), but not
in the negative control (S. cerevisiae expressing another Sed1p-fusion protein, lane 3).
This protein band corresponds to the Ovacyt/Sed1p protein, which has a theoretical
molecular weight of ~64 kDa. Additional low molecular weight bands could be seen in
the blot, some of them reacted unspecifically with the anti-Ova antibody, since they are
also present in the negative control extracts. The other bands that appear only in the cell
wall extracts of the Ovacyt/Sed1p-producing yeast are probably degradation products of
Ovacyt/Sed1p. In Fig. 23 B, a slight band was seen in the cell wall extract of P. pastoris
carrying pPIC9/ovacyt/sed1 (lane 2), corresponding to the 64-kDa Ovacyt/Sed1p. This
band was not detected in the negative control (P. pastoris expressing an irrelevant
Sed1p-fusion protein, lane 3).
A B
Fig. 23: Laminarinase extraction of Ovacyt/Sed1p from yeast cell walls. The Ovacyt/Sed1p bands are indicated with arrows. As positive control, commercially available Ova was used. (A) Lane 1, positive control; lane 2, laminarinase extracts of cell walls of S. cerevisiae/Ovacyt/Sed1p; lane 3, laminarinase extracts of cell walls of S. cerevisiae expressing an irrelevant Sed1p-fusion protein. (B) Lane 1, positive control;
Ovacyt/Sed1p
1 2 3 1 2 3 kDa 95 72
55
43
34
26
17
kDa 95 72
55
43
34
26
S. cerevisiae P. pastoris
Ovacyt/Sed1p
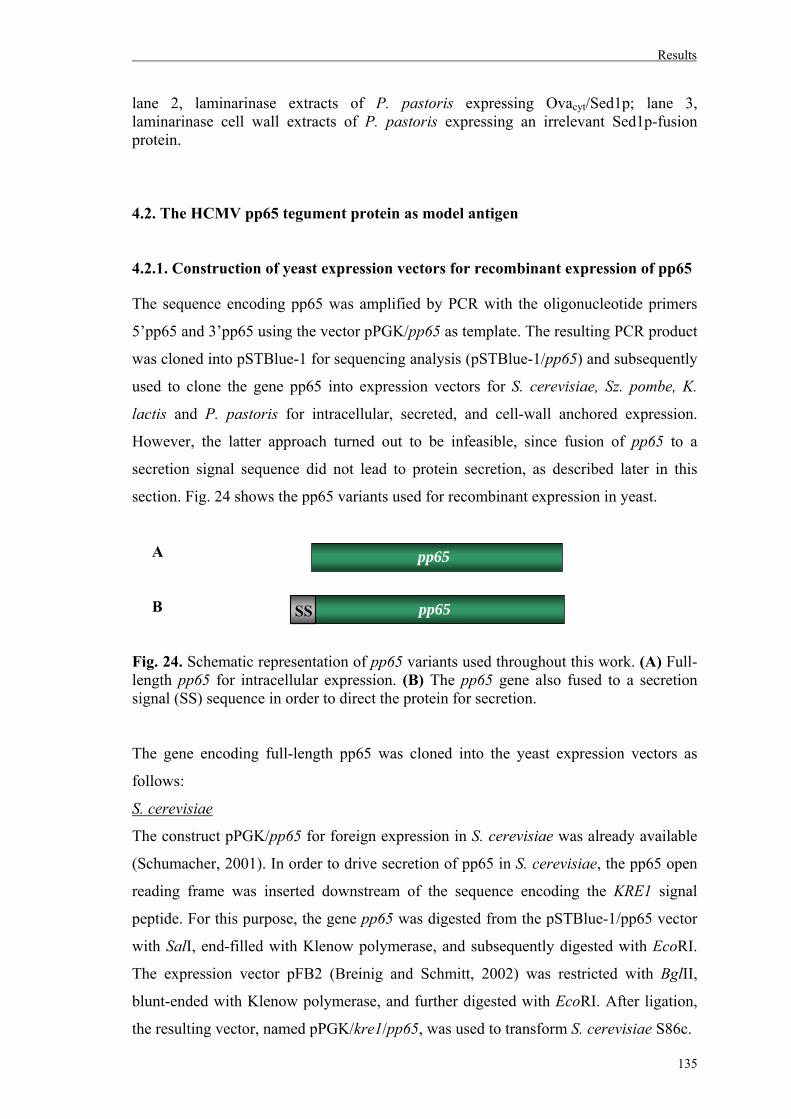
Results
135
lane 2, laminarinase extracts of P. pastoris expressing Ovacyt/Sed1p; lane 3, laminarinase cell wall extracts of P. pastoris expressing an irrelevant Sed1p-fusion protein.
4.2. The HCMV pp65 tegument protein as model antigen
4.2.1. Construction of yeast expression vectors for recombinant expression of pp65
The sequence encoding pp65 was amplified by PCR with the oligonucleotide primers
5’pp65 and 3’pp65 using the vector pPGK/pp65 as template. The resulting PCR product
was cloned into pSTBlue-1 for sequencing analysis (pSTBlue-1/pp65) and subsequently
used to clone the gene pp65 into expression vectors for S. cerevisiae, Sz. pombe, K.
lactis and P. pastoris for intracellular, secreted, and cell-wall anchored expression.
However, the latter approach turned out to be infeasible, since fusion of pp65 to a
secretion signal sequence did not lead to protein secretion, as described later in this
section. Fig. 24 shows the pp65 variants used for recombinant expression in yeast.
A
B
Fig. 24. Schematic representation of pp65 variants used throughout this work. (A) Full-length pp65 for intracellular expression. (B) The pp65 gene also fused to a secretion signal (SS) sequence in order to direct the protein for secretion. The gene encoding full-length pp65 was cloned into the yeast expression vectors as
follows:
S. cerevisiae
The construct pPGK/pp65 for foreign expression in S. cerevisiae was already available
(Schumacher, 2001). In order to drive secretion of pp65 in S. cerevisiae, the pp65 open
reading frame was inserted downstream of the sequence encoding the KRE1 signal
peptide. For this purpose, the gene pp65 was digested from the pSTBlue-1/pp65 vector
with SalI, end-filled with Klenow polymerase, and subsequently digested with EcoRI.
The expression vector pFB2 (Breinig and Schmitt, 2002) was restricted with BglII,
blunt-ended with Klenow polymerase, and further digested with EcoRI. After ligation,
the resulting vector, named pPGK/kre1/pp65, was used to transform S. cerevisiae S86c.
pp65
pp65 SS
Results
136
Sz. pombe
For cloning into the Sz. pombe expression vector pREP1, pp65 was digested from
pSTBlue-1/pp65 with XhoI and BamHI for inserting into the SalI/BamHI-digested
pREP1, generating pREP1/pp65.
The signal peptide of the K28 preprotoxin was used to direct pp65 into the
secretion pathway of Sz. pombe. This secretion signal has been shown to efficiently
drive the secretion of recombinant proteins in this yeast species (Heintel et al., 2001;
Eiden-Plach et al., 2004). Therefore, the K28 signal peptide/pp65 fusion was amplified
by PCR using the oligonucleotide primers 5’K28, 3’Prepropp65, 3’pp65 and
5’Prepropp65, and the plasmids pPGK-M28-I and pPIC9/pp65 as templates. The final
PCR product, named prepropp65, was cloned into pSTBlue-1 for sequence analysis.
Subsequently, the prepropp65 coding sequence was restricted from pSTBlue-
1/prepropp65 with XhoI and BamHI and ligated to the SalI/BamHI-linearized pREP1
vector, giving rise to pREP1/prepropp65.
K. lactis
The K. lactis expression vector pKLAC1 requires linearization prior to transformation
to allow integration into the yeast genome. Linearization can be performed with either
SacII or BstXI restriction enzymes. Since both restriction sites are present in the pp65
sequence, a site-directed mutagenesis was performed in order to eliminate one
recognition sequence, without altering the amino acid composition of the resulting
protein. Given that the SacII regognition sequence appears twice in the pp65 gene, the
BstXI restriction site was chosen for the single nucleotide exchange. Using the primers
5’pp65mutBstXI, 3’pp65XbaISalI, 5’pp65_EcoRIXhoISacI and 3’pp65mutBstXI, and
the plasmid pSTBlue-1/pp65 as template, the pp65 gene was amplified by SOE-PCR as
described in section 1.1 of Methods. After amplification, the final DNA fragment
(pp65mut) was cloned into pSTBlue-1 for sequence analysis, which revealed the desired
mutation (substitution of a cytosine for an adenine at position 540, so that codon ACC
became ACA, but still coding for threonin).
Intracellular protein expression in K. lactis implies digesting the pKLAC1
expression vector with HindIII to remove the α-mating factor signal sequence.
Therefore, for cloning into the K. lactis expression vector, pp65mut was digested from
pSTBlue-1/pp65mut with EcoRI, blunt-ended with Klenow polymerase and then
digested with SalI. The vector pKLAC1 was digested with HindIII, end-filled with
Results
137
Klenow and digested with SalI. For integrative transformation of chemically competent
K. lactis, the construct pKLAC1/pp65mut was linearized with BstXI.
Full-length pp65 was also cloned downstream of the α-mating factor signal
peptide for protein secretion. For this purpose, pp65 was digested from pSTBlue-1 with
XbaI, blunt-ended with Klenow polymerase, and then restricted with XhoI. The vector
pKLAC1 was digested with NotI, blunt-ended with Klenow polymerase, and digested
with SalI. The ligation product, pKLAC1/secpp65mut, was used to transform competent
K. lactis cells.
P. pastoris
Cloning of pp65 into P. pastoris expression vectors pPIC3.5 for intracellular expression
and pPIC9 for protein secretion was performed by digesting the gene encoding pp65
from pSTBlue-1/pp65 with EcoRI and XbaI and ligating to the EcoRI/AvrII sites in
pPIC3.5 and pPIC9 vectors. The resulting plasmids were named pPIC3.5/pp65 and
pPIC9/pp65. Both expression vectors were linearized with SalI before transformation of
competent P. pastoris cells.
4.2.2. Intracellular pp65 expression by different yeast genera
For detection of pp65 in the cytoplasm of the tested yeast genera, lysates from 3×10⁸
yeast cells cultured for 72 h in the respective medium were precipitated with
DOC/TCA, as described before. Western blots of cell extracts were performed using
mouse monoclonal anti-pp65 antibody and goat anti-mouse IgG-peroxidase.
Colonies of S. cerevisiae S86c transformed with pPGK/pp65 and selected based
on uracil prototrophy were cultured in ura d/o medium for recombinant protein
expression. Lysates from yeast cells carrying both pPGK/pp65 and the empty vector
YEp352 were analyzed. As seen in Fig. 25 A, pp65 was detected as a ~65-kDa band in
the total extract of S. cerevisiae carrying the expression vector pPGK/pp65 (lane 3). No
bands were seen in the sample corresponding to S. cerevisiae harboring YEp352 vector
(lane 2).
Sz. pombe PW260 cells harbouring the pREP1/pp65 vector were grown in EMM
leu d/o medium to induce pp65 expression from the nmt1 promoter. Cells of Sz.
pombe/pREP1/pp65 and Sz. pombe/pREP-BD were subjected to expression analysis. As
seen in Fig. 25 B, the corresponding western blot result showed a single 65-kDa protein
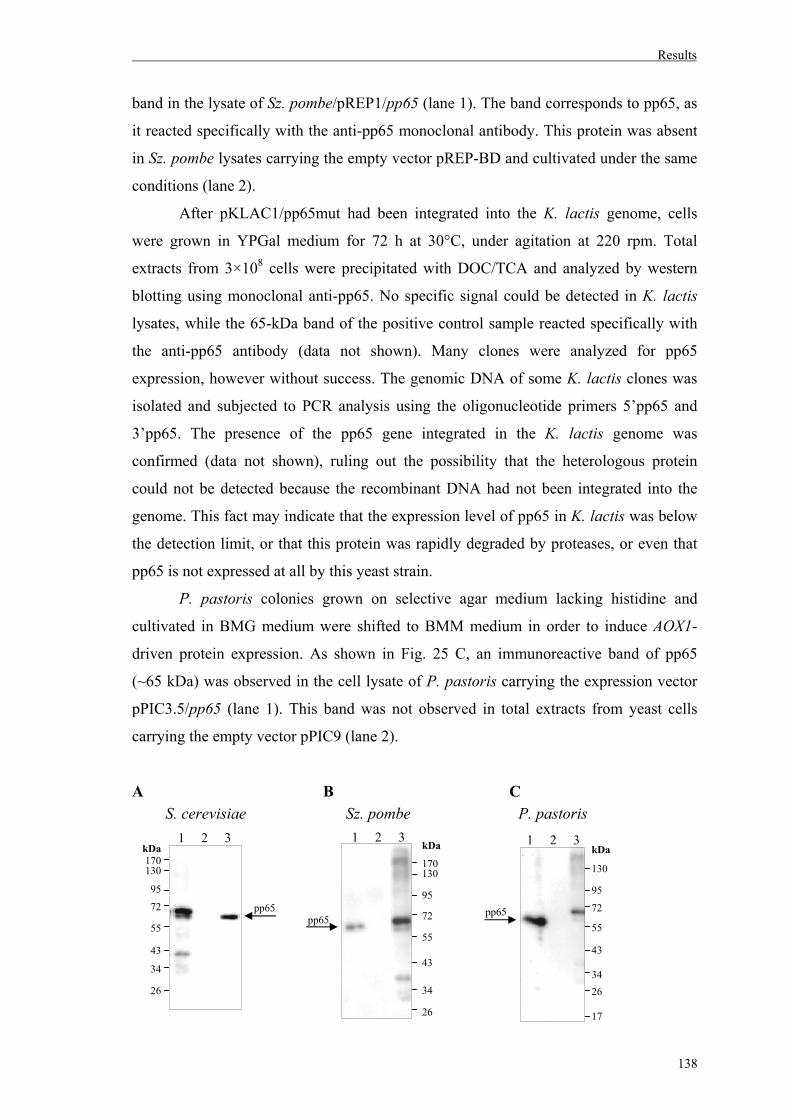
Results
138
band in the lysate of Sz. pombe/pREP1/pp65 (lane 1). The band corresponds to pp65, as
it reacted specifically with the anti-pp65 monoclonal antibody. This protein was absent
in Sz. pombe lysates carrying the empty vector pREP-BD and cultivated under the same
conditions (lane 2).
After pKLAC1/pp65mut had been integrated into the K. lactis genome, cells
were grown in YPGal medium for 72 h at 30°C, under agitation at 220 rpm. Total
extracts from 3×10⁸ cells were precipitated with DOC/TCA and analyzed by western
blotting using monoclonal anti-pp65. No specific signal could be detected in K. lactis
lysates, while the 65-kDa band of the positive control sample reacted specifically with
the anti-pp65 antibody (data not shown). Many clones were analyzed for pp65
expression, however without success. The genomic DNA of some K. lactis clones was
isolated and subjected to PCR analysis using the oligonucleotide primers 5’pp65 and
3’pp65. The presence of the pp65 gene integrated in the K. lactis genome was
confirmed (data not shown), ruling out the possibility that the heterologous protein
could not be detected because the recombinant DNA had not been integrated into the
genome. This fact may indicate that the expression level of pp65 in K. lactis was below
the detection limit, or that this protein was rapidly degraded by proteases, or even that
pp65 is not expressed at all by this yeast strain.
P. pastoris colonies grown on selective agar medium lacking histidine and
cultivated in BMG medium were shifted to BMM medium in order to induce AOX1-
driven protein expression. As shown in Fig. 25 C, an immunoreactive band of pp65
(~65 kDa) was observed in the cell lysate of P. pastoris carrying the expression vector
pPIC3.5/pp65 (lane 1). This band was not observed in total extracts from yeast cells
carrying the empty vector pPIC9 (lane 2).
A B C
pp65
kDa 170 130
95
72
55
43
34
26
1 2 3 kDa
170 130 95 72 55 43
34 26
1 2 3 kDa 130 95
72
55 43
34
26 17
1 2 3
S. cerevisiae Sz. pombe P. pastoris
pp65 pp65
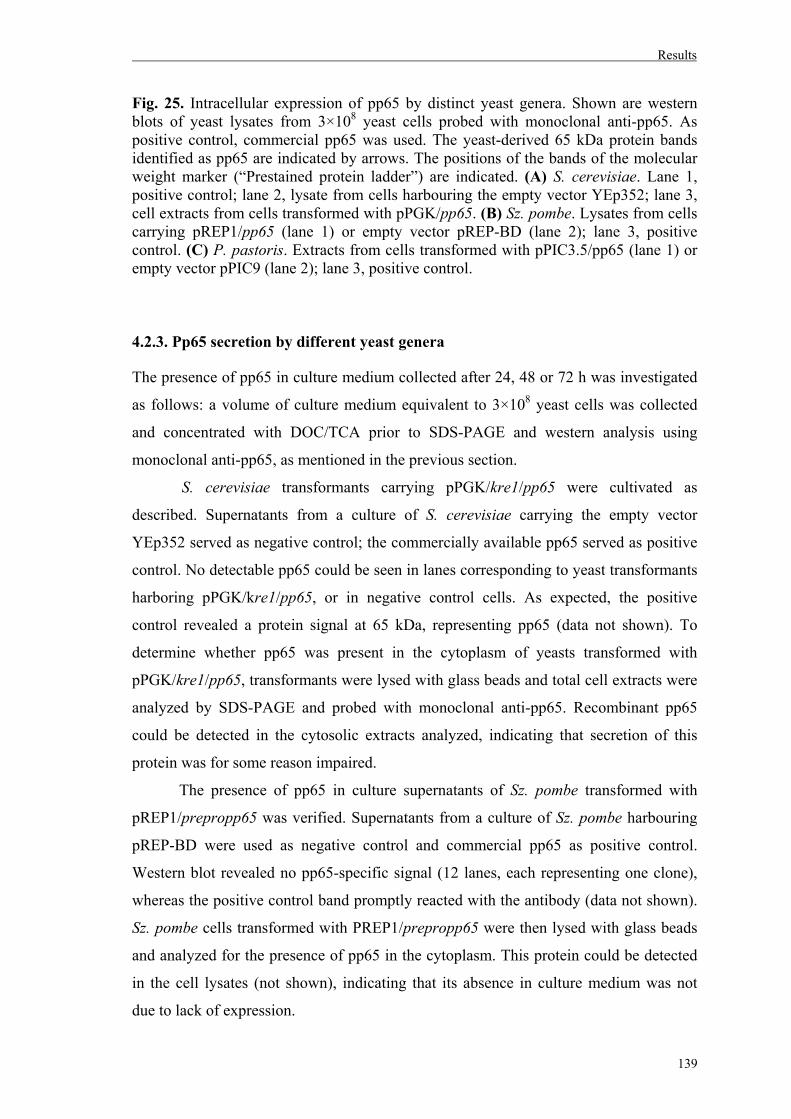
Results
139
Fig. 25. Intracellular expression of pp65 by distinct yeast genera. Shown are western blots of yeast lysates from 3×10⁸ yeast cells probed with monoclonal anti-pp65. As positive control, commercial pp65 was used. The yeast-derived 65 kDa protein bands identified as pp65 are indicated by arrows. The positions of the bands of the molecular weight marker (“Prestained protein ladder”) are indicated. (A) S. cerevisiae. Lane 1, positive control; lane 2, lysate from cells harbouring the empty vector YEp352; lane 3, cell extracts from cells transformed with pPGK/pp65. (B) Sz. pombe. Lysates from cells carrying pREP1/pp65 (lane 1) or empty vector pREP-BD (lane 2); lane 3, positive control. (C) P. pastoris. Extracts from cells transformed with pPIC3.5/pp65 (lane 1) or empty vector pPIC9 (lane 2); lane 3, positive control.
4.2.3. Pp65 secretion by different yeast genera
The presence of pp65 in culture medium collected after 24, 48 or 72 h was investigated
as follows: a volume of culture medium equivalent to 3×10⁸ yeast cells was collected
and concentrated with DOC/TCA prior to SDS-PAGE and western analysis using
monoclonal anti-pp65, as mentioned in the previous section.
S. cerevisiae transformants carrying pPGK/kre1/pp65 were cultivated as
described. Supernatants from a culture of S. cerevisiae carrying the empty vector
YEp352 served as negative control; the commercially available pp65 served as positive
control. No detectable pp65 could be seen in lanes corresponding to yeast transformants
harboring pPGK/kre1/pp65, or in negative control cells. As expected, the positive
control revealed a protein signal at 65 kDa, representing pp65 (data not shown). To
determine whether pp65 was present in the cytoplasm of yeasts transformed with
pPGK/kre1/pp65, transformants were lysed with glass beads and total cell extracts were
analyzed by SDS-PAGE and probed with monoclonal anti-pp65. Recombinant pp65
could be detected in the cytosolic extracts analyzed, indicating that secretion of this
protein was for some reason impaired.
The presence of pp65 in culture supernatants of Sz. pombe transformed with
pREP1/prepropp65 was verified. Supernatants from a culture of Sz. pombe harbouring
pREP-BD were used as negative control and commercial pp65 as positive control.
Western blot revealed no pp65-specific signal (12 lanes, each representing one clone),
whereas the positive control band promptly reacted with the antibody (data not shown).
Sz. pombe cells transformed with PREP1/prepropp65 were then lysed with glass beads
and analyzed for the presence of pp65 in the cytoplasm. This protein could be detected
in the cell lysates (not shown), indicating that its absence in culture medium was not
due to lack of expression.
Results
140
K. lactis transformed with pKLAC1/secpp65 was inoculated in YPGal medium
and supernatants were assessed for the presence of pp65. After western analysis, no
recombinant protein could be detected in the supernatant. Cell pellets (3×10⁸ cells) were
subjected to lysis to check if pp65 was retained in the cytoplasm but, again, no signal
was verified after wester blotting using anti-pp65 (data not shown), as already reported
for K. lactis carrying pKLAC1/pp65.
P. pastoris carrying pPIC9/pp65 induced with methanol were analyzed for pp65
secretion. As for the other yeast strains tested, no pp65 could be detected in the culture
supernatant, whereas the 65-kDa band appeared in the positive control lane (not shown).
Some clones were lysed with glass beads and assessed for the presence of pp65 in the
cytoplasm. Western analysis revealed a pp65-specific signal in all transformants
examined, confirming that this protein was expressed in P. pastoris transformed with
the pPIC9/pp65 vector, but not secreted (data not shown).
In this way it must be concluded that cell-wall anchoring of full-length pp65
would most probably be unsuccessful, since none of the tested yeasts was able to secrete
pp65.
4.3. Cloning and expression of Gag-fusions in S. cerevisiae
Delivery of antigens by virus-like particles has been considered a versatile approach.
Since VLP are inherently highly immunogenic, strategies employing chimeric particles
are considered very promising in immunological applications.
Fusion of L-A Gag with a truncated version of pp65 (Δpp65) has been
demonstrated by Powilleit and colleagues (2007). In that study, Δpp65 was fused to the
3’ end of gag in the [0]-frame position, and the resulting Gag/Δpp65 fusion self-
assembled in vivo into VLP. In addition, purified chimeric Gag/Δpp65 VLP have been
shown to stimulate pp65-specific memory T cells in a whole blood assay (Powilleit et
al., 2007).
In this work, the sequences encoding Ovacyt or full-length pp65 were cloned
downstream of gag in the [0]-frame to prevent gag/ovacyt or gag/pp65 frameshift
occurrence in yeast (Fig. 26). The resulting recombinant proteins were partially purified
and assessed for correct assembly into VLP. Since Ova represents an easy applicable
system for a number of in vitro and in vivo settings, it would be interesting to examine
the delivery of Ovacyt by VLP in comparison to Ovacyt alone. Furthermore, yeast

Results
141
assembled Gag/pp65 VLP were analyzed in terms of activation of pp65-specific
memory T lymphocytes in a whole blood assay and compared to pp65 alone.
A
B
Fig. 26: Schematic representation of gag fusions performed in this work. The sequences coding for ovacyt (A) and pp65 (B) were cloned in frame and downstream of the L-A gag sequence for recombinant expression in the virus-free yeast strain S. cerevisiae S86c.
4.3.1. Cloning and expression of Gag/Ovacyt in S. cerevisiae
To insert the ovacyt gene downstream of gag without causing frameshift formation in
vivo, SacI restriction was used for cloning. However, given that SacI cleaves the ovacyt
sequence at position 56, and that there was no available conventional restriction enzyme
which would leave compatible cohesive ends, site-directed mutagenesis was performed
in order to destroy this site in the ovacyt gene without altering the amino acid
composition of the resulting protein. Using pPIC3.5/ovacyt as template and the
oligonucleotide primers 5’Ovacytmut 3’BglII_NotI_Ova, 3’Ovacytmut, and 5’
XbaISacI_Ovacyt, the ovacytmut sequence was amplified by SOE-PCR, as described
before. The resulting PCR product was cloned into pSTBlue-1 and subjected to
sequence analysis to confirm the correct sequence. A silent single base mutation could
be obtained, in which a cytosine at position 57 was replaced by a thymine. Therefore,
the codon CTC was changed into CTT, but the correspondent amino acid, leucine, was
still the same.
The ovacytmut coding sequence was recovered from pSTBlue-1 by SacI and
BglII restriction and subsequently inserted into the SacI/BamHI-digested S. cerevisiae
pPG[0]G expression vector, yielding pPG[0]G/ovacytmut.
After transformation of S. cerevisiae S86c with pPG[0]G/ovacytmut, some
transformants were inoculated in ura d/o medium and cultured for 72 h for PGK-driven
recombinant protein expression. For detection of Gag/Ovacyt in yeast cell lysates, crude
extracts from 3×10⁸ cells were precipitated with DOC/TCA and applied to SDS-
polyacrylamide gels. Western blots were performed using rabbit anti-Ova antibody and
gag ovacyt
gag pp65
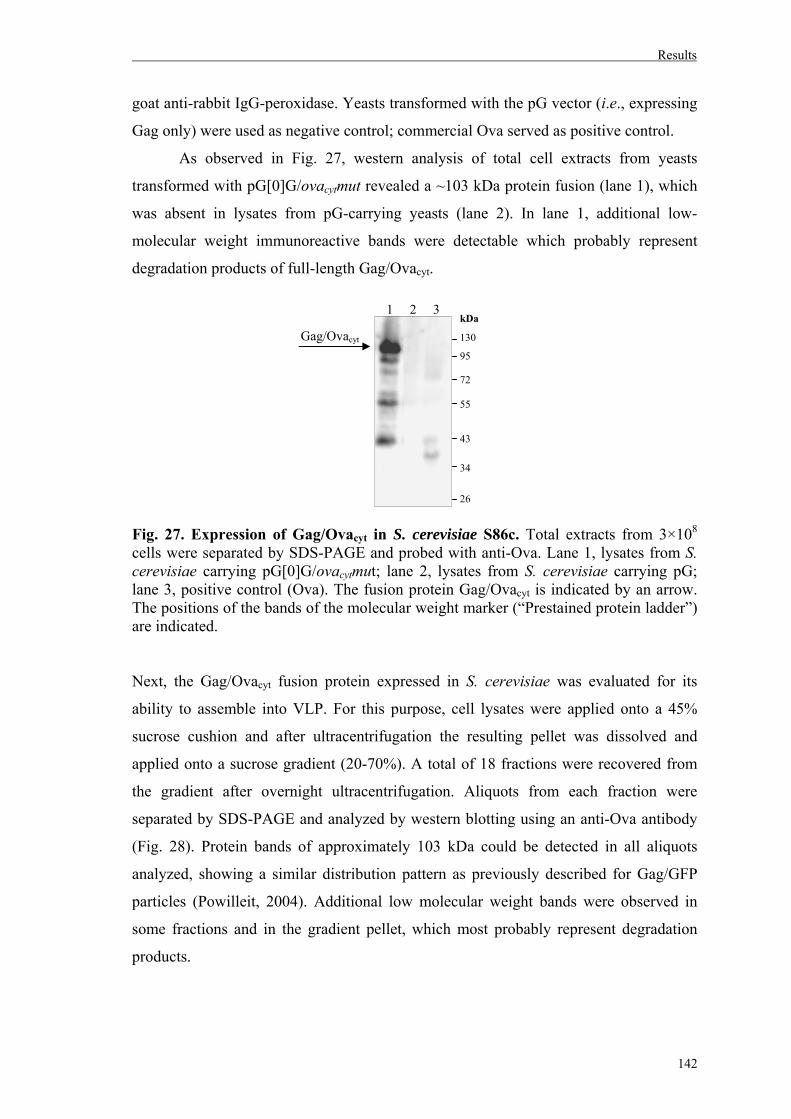
Results
142
goat anti-rabbit IgG-peroxidase. Yeasts transformed with the pG vector (i.e., expressing
Gag only) were used as negative control; commercial Ova served as positive control.
As observed in Fig. 27, western analysis of total cell extracts from yeasts
transformed with pG[0]G/ovacytmut revealed a ~103 kDa protein fusion (lane 1), which
was absent in lysates from pG-carrying yeasts (lane 2). In lane 1, additional low-
molecular weight immunoreactive bands were detectable which probably represent
degradation products of full-length Gag/Ovacyt.
Fig. 27. Expression of Gag/Ovacyt in S. cerevisiae S86c. Total extracts from 3×10⁸ cells were separated by SDS-PAGE and probed with anti-Ova. Lane 1, lysates from S. cerevisiae carrying pG[0]G/ovacytmut; lane 2, lysates from S. cerevisiae carrying pG; lane 3, positive control (Ova). The fusion protein Gag/Ovacyt is indicated by an arrow. The positions of the bands of the molecular weight marker (“Prestained protein ladder”) are indicated. Next, the Gag/Ovacyt fusion protein expressed in S. cerevisiae was evaluated for its
ability to assemble into VLP. For this purpose, cell lysates were applied onto a 45%
sucrose cushion and after ultracentrifugation the resulting pellet was dissolved and
applied onto a sucrose gradient (20-70%). A total of 18 fractions were recovered from
the gradient after overnight ultracentrifugation. Aliquots from each fraction were
separated by SDS-PAGE and analyzed by western blotting using an anti-Ova antibody
(Fig. 28). Protein bands of approximately 103 kDa could be detected in all aliquots
analyzed, showing a similar distribution pattern as previously described for Gag/GFP
particles (Powilleit, 2004). Additional low molecular weight bands were observed in
some fractions and in the gradient pellet, which most probably represent degradation
products.
Gag/Ovacyt
1 2 3 kDa 130 95 72 55 43
34 26
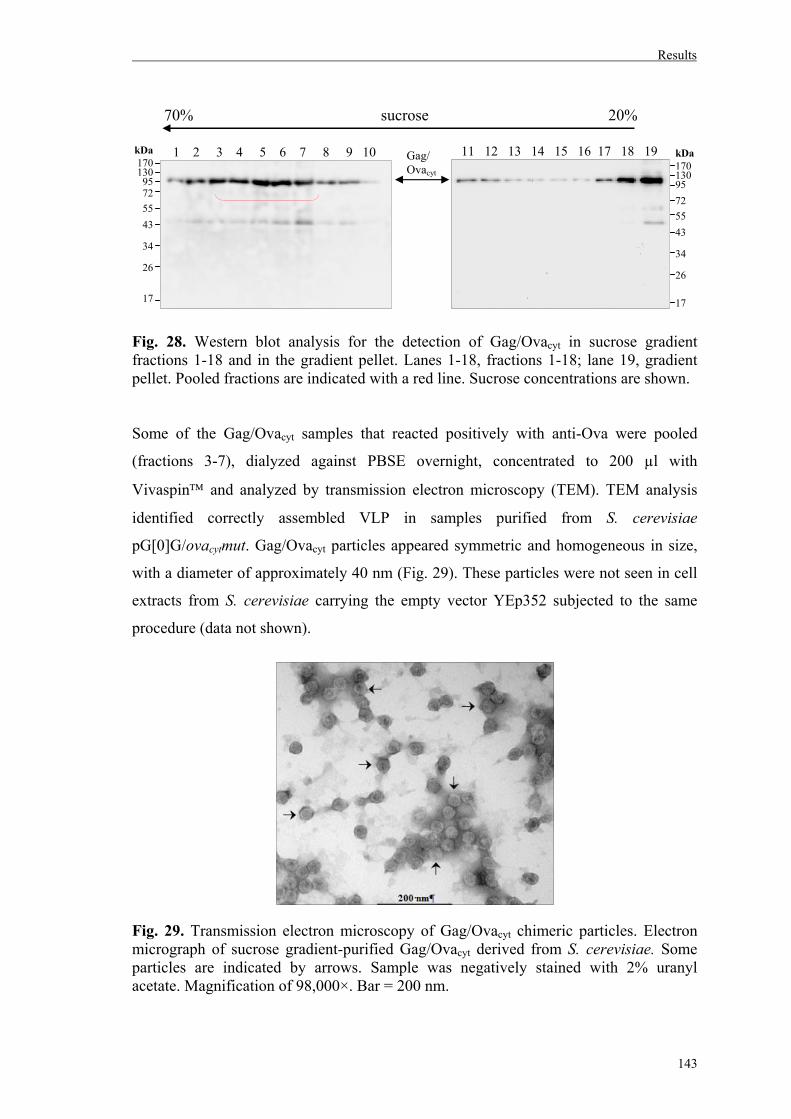
Results
143
Fig. 28. Western blot analysis for the detection of Gag/Ovacyt in sucrose gradient fractions 1-18 and in the gradient pellet. Lanes 1-18, fractions 1-18; lane 19, gradient pellet. Pooled fractions are indicated with a red line. Sucrose concentrations are shown. Some of the Gag/Ovacyt samples that reacted positively with anti-Ova were pooled
(fractions 3-7), dialyzed against PBSE overnight, concentrated to 200 µl with
Vivaspin™ and analyzed by transmission electron microscopy (TEM). TEM analysis
identified correctly assembled VLP in samples purified from S. cerevisiae
pG[0]G/ovacytmut. Gag/Ovacyt particles appeared symmetric and homogeneous in size,
with a diameter of approximately 40 nm (Fig. 29). These particles were not seen in cell
extracts from S. cerevisiae carrying the empty vector YEp352 subjected to the same
procedure (data not shown).
Fig. 29. Transmission electron microscopy of Gag/Ovacyt chimeric particles. Electron micrograph of sucrose gradient-purified Gag/Ovacyt derived from S. cerevisiae. Some particles are indicated by arrows. Sample was negatively stained with 2% uranyl acetate. Magnification of 98,000×. Bar = 200 nm.
70% sucrose 20%
kDa
170 130
95 72
55
43
34
26
17
1 2 3 4 5 6 7 8 9 10 11 12 13 14 15 16 17 18 19 kDa
170 130 95
72
55
43 34 26 17
Gag/ Ovacyt
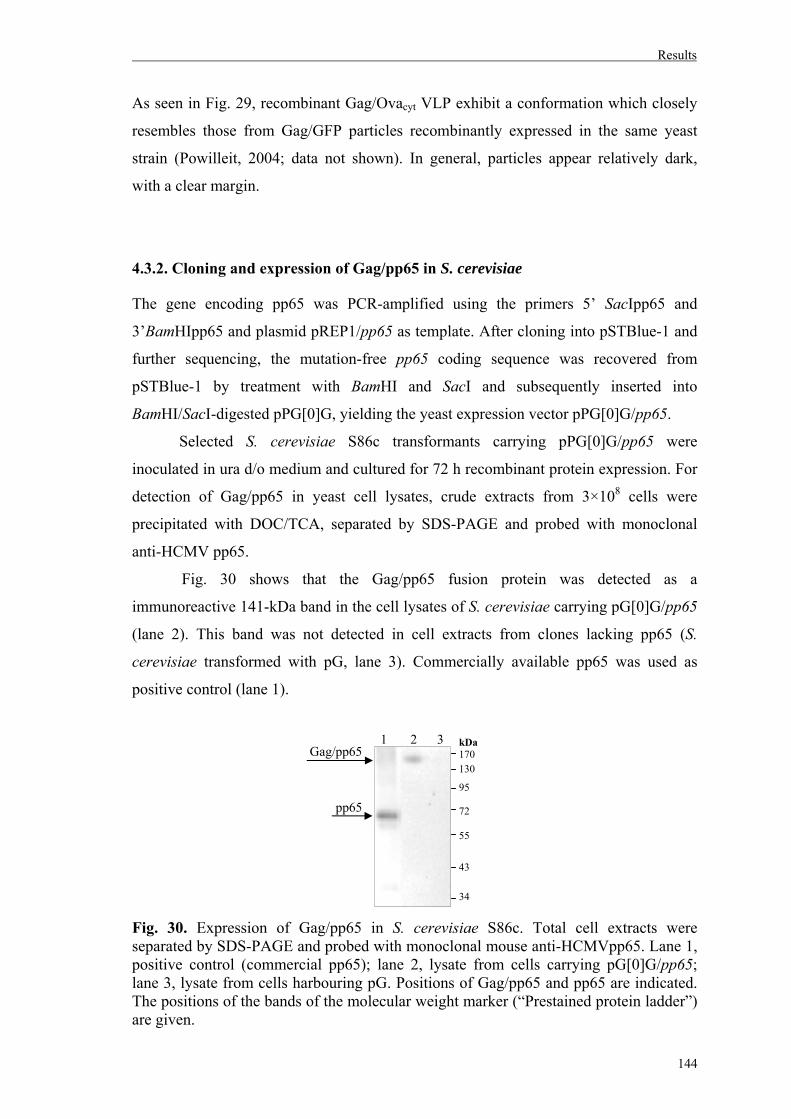
Results
144
As seen in Fig. 29, recombinant Gag/Ovacyt VLP exhibit a conformation which closely
resembles those from Gag/GFP particles recombinantly expressed in the same yeast
strain (Powilleit, 2004; data not shown). In general, particles appear relatively dark,
with a clear margin.
4.3.2. Cloning and expression of Gag/pp65 in S. cerevisiae
The gene encoding pp65 was PCR-amplified using the primers 5’ SacIpp65 and
3’BamHIpp65 and plasmid pREP1/pp65 as template. After cloning into pSTBlue-1 and
further sequencing, the mutation-free pp65 coding sequence was recovered from
pSTBlue-1 by treatment with BamHI and SacI and subsequently inserted into
BamHI/SacI-digested pPG[0]G, yielding the yeast expression vector pPG[0]G/pp65.
Selected S. cerevisiae S86c transformants carrying pPG[0]G/pp65 were
inoculated in ura d/o medium and cultured for 72 h recombinant protein expression. For
detection of Gag/pp65 in yeast cell lysates, crude extracts from 3×10⁸ cells were
precipitated with DOC/TCA, separated by SDS-PAGE and probed with monoclonal
anti-HCMV pp65.
Fig. 30 shows that the Gag/pp65 fusion protein was detected as a
immunoreactive 141-kDa band in the cell lysates of S. cerevisiae carrying pG[0]G/pp65
(lane 2). This band was not detected in cell extracts from clones lacking pp65 (S.
cerevisiae transformed with pG, lane 3). Commercially available pp65 was used as
positive control (lane 1).
Fig. 30. Expression of Gag/pp65 in S. cerevisiae S86c. Total cell extracts were separated by SDS-PAGE and probed with monoclonal mouse anti-HCMVpp65. Lane 1, positive control (commercial pp65); lane 2, lysate from cells carrying pG[0]G/pp65; lane 3, lysate from cells harbouring pG. Positions of Gag/pp65 and pp65 are indicated. The positions of the bands of the molecular weight marker (“Prestained protein ladder”) are given.
Gag/pp65 1 2 3 kDa
170
130 95 72 55 43
34
pp65
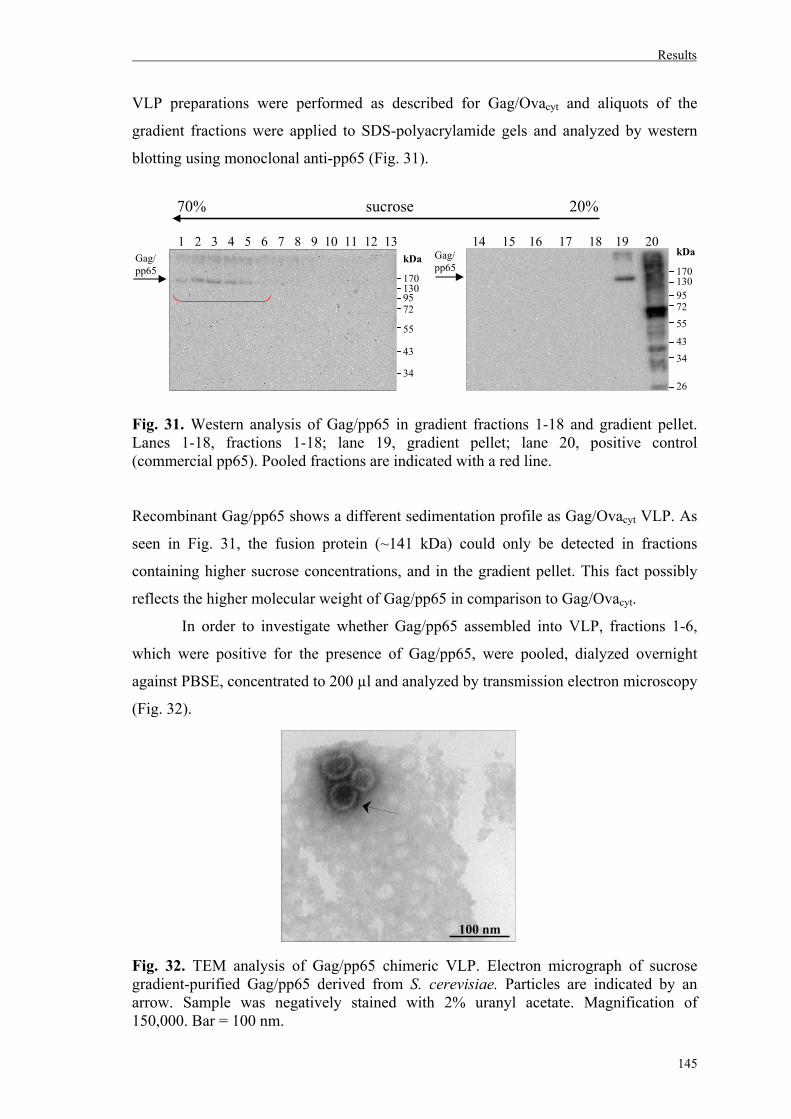
Results
145
VLP preparations were performed as described for Gag/Ovacyt and aliquots of the
gradient fractions were applied to SDS-polyacrylamide gels and analyzed by western
blotting using monoclonal anti-pp65 (Fig. 31).
Fig. 31. Western analysis of Gag/pp65 in gradient fractions 1-18 and gradient pellet. Lanes 1-18, fractions 1-18; lane 19, gradient pellet; lane 20, positive control (commercial pp65). Pooled fractions are indicated with a red line. Recombinant Gag/pp65 shows a different sedimentation profile as Gag/Ovacyt VLP. As
seen in Fig. 31, the fusion protein (~141 kDa) could only be detected in fractions
containing higher sucrose concentrations, and in the gradient pellet. This fact possibly
reflects the higher molecular weight of Gag/pp65 in comparison to Gag/Ovacyt.
In order to investigate whether Gag/pp65 assembled into VLP, fractions 1-6,
which were positive for the presence of Gag/pp65, were pooled, dialyzed overnight
against PBSE, concentrated to 200 µl and analyzed by transmission electron microscopy
(Fig. 32).
Fig. 32. TEM analysis of Gag/pp65 chimeric VLP. Electron micrograph of sucrose gradient-purified Gag/pp65 derived from S. cerevisiae. Particles are indicated by an arrow. Sample was negatively stained with 2% uranyl acetate. Magnification of 150,000. Bar = 100 nm.
100 nm
1 2 3 4 5 6 7 8 9 10 11 12 13kDa
170 130 95 72
55 43 34
kDa
170 130
95 72
55
43
34 26
70% sucrose 20%
14 15 16 17 18 19 20Gag/ pp65
Gag/ pp65
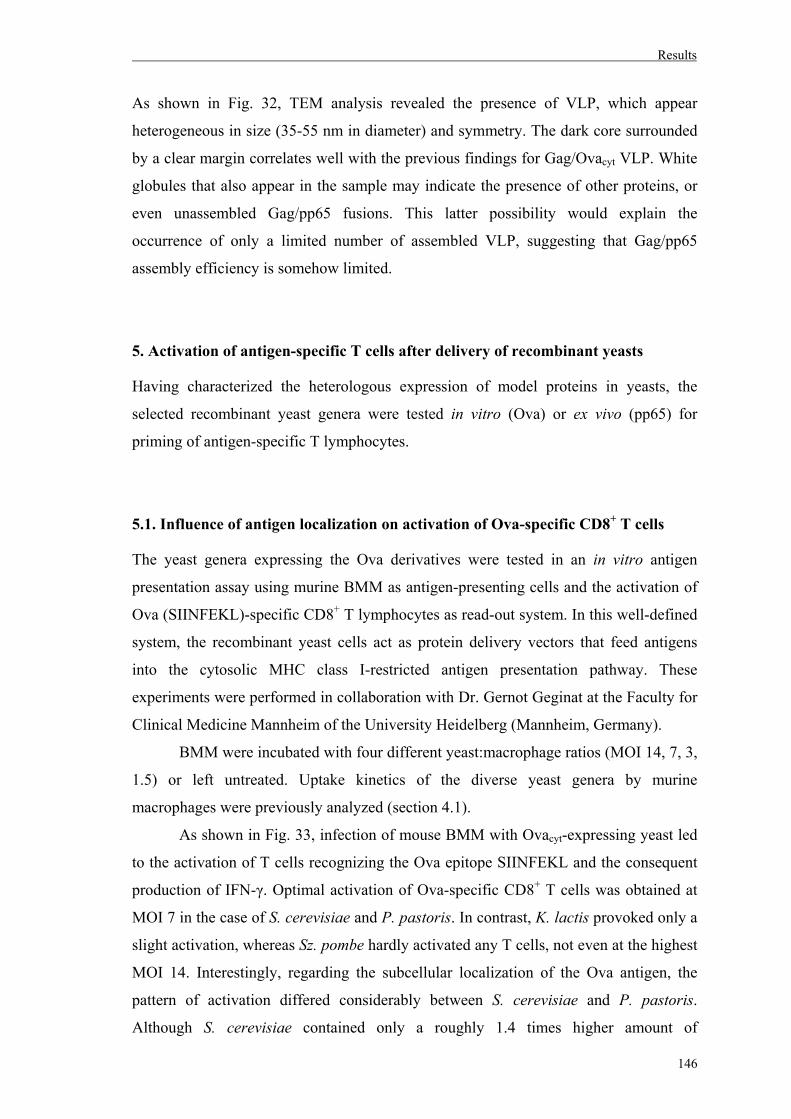
Results
146
As shown in Fig. 32, TEM analysis revealed the presence of VLP, which appear
heterogeneous in size (35-55 nm in diameter) and symmetry. The dark core surrounded
by a clear margin correlates well with the previous findings for Gag/Ovacyt VLP. White
globules that also appear in the sample may indicate the presence of other proteins, or
even unassembled Gag/pp65 fusions. This latter possibility would explain the
occurrence of only a limited number of assembled VLP, suggesting that Gag/pp65
assembly efficiency is somehow limited.
5. Activation of antigen-specific T cells after delivery of recombinant yeasts
Having characterized the heterologous expression of model proteins in yeasts, the
selected recombinant yeast genera were tested in vitro (Ova) or ex vivo (pp65) for
priming of antigen-specific T lymphocytes.
5.1. Influence of antigen localization on activation of Ova-specific CD8+ T cells
The yeast genera expressing the Ova derivatives were tested in an in vitro antigen
presentation assay using murine BMM as antigen-presenting cells and the activation of
Ova (SIINFEKL)-specific CD8+ T lymphocytes as read-out system. In this well-defined
system, the recombinant yeast cells act as protein delivery vectors that feed antigens
into the cytosolic MHC class I-restricted antigen presentation pathway. These
experiments were performed in collaboration with Dr. Gernot Geginat at the Faculty for
Clinical Medicine Mannheim of the University Heidelberg (Mannheim, Germany).
BMM were incubated with four different yeast:macrophage ratios (MOI 14, 7, 3,
1.5) or left untreated. Uptake kinetics of the diverse yeast genera by murine
macrophages were previously analyzed (section 4.1).
As shown in Fig. 33, infection of mouse BMM with Ovacyt-expressing yeast led
to the activation of T cells recognizing the Ova epitope SIINFEKL and the consequent
production of IFN-γ. Optimal activation of Ova-specific CD8+ T cells was obtained at
MOI 7 in the case of S. cerevisiae and P. pastoris. In contrast, K. lactis provoked only a
slight activation, whereas Sz. pombe hardly activated any T cells, not even at the highest
MOI 14. Interestingly, regarding the subcellular localization of the Ova antigen, the
pattern of activation differed considerably between S. cerevisiae and P. pastoris.
Although S. cerevisiae contained only a roughly 1.4 times higher amount of
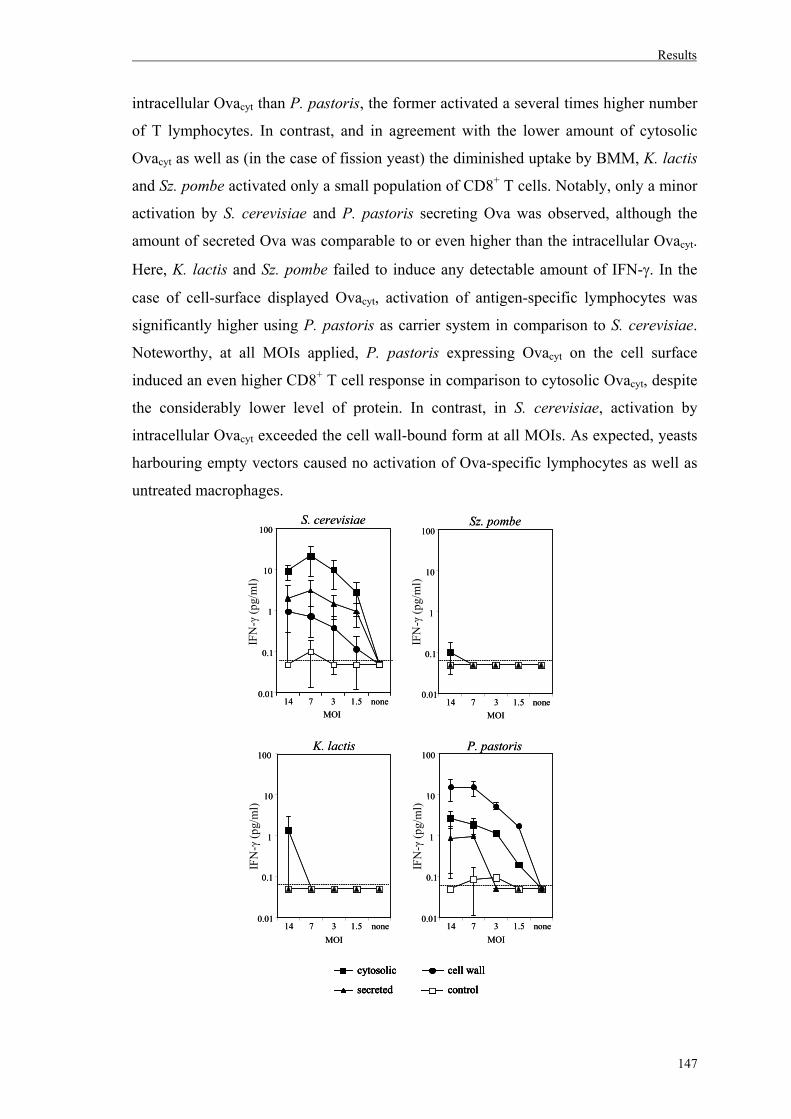
Results
147
intracellular Ovacyt than P. pastoris, the former activated a several times higher number
of T lymphocytes. In contrast, and in agreement with the lower amount of cytosolic
Ovacyt as well as (in the case of fission yeast) the diminished uptake by BMM, K. lactis
and Sz. pombe activated only a small population of CD8+ T cells. Notably, only a minor
activation by S. cerevisiae and P. pastoris secreting Ova was observed, although the
amount of secreted Ova was comparable to or even higher than the intracellular Ovacyt.
Here, K. lactis and Sz. pombe failed to induce any detectable amount of IFN-γ. In the
case of cell-surface displayed Ovacyt, activation of antigen-specific lymphocytes was
significantly higher using P. pastoris as carrier system in comparison to S. cerevisiae.
Noteworthy, at all MOIs applied, P. pastoris expressing Ovacyt on the cell surface
induced an even higher CD8+ T cell response in comparison to cytosolic Ovacyt, despite
the considerably lower level of protein. In contrast, in S. cerevisiae, activation by
intracellular Ovacyt exceeded the cell wall-bound form at all MOIs. As expected, yeasts
harbouring empty vectors caused no activation of Ova-specific lymphocytes as well as
untreated macrophages.
0.01
0.1
1
10
100
14 7 3 1.5 none
IFN
-g (p
g/m
l)
0.01
0.1
1
10
100
14 7 3 1.5 noneMOI
IFN
-g (p
g/m
l)
K. lactis P. pastoris
0.01
0.1
1
10
100
14 7 3 1.5 noneMOI
IFN
-g (p
g/m
l)
0.01
0.1
1
10
100
14 7 3 1.5 noneMOI
IFN
-g (p
g/m
l)
S. cerevisiae Sz. pombe
cytosolic
secreted
cell wall
control
MOI
0.01
0.1
1
10
100
14 7 3 1.5 none
IFN
-g (p
g/m
l)
0.01
0.1
1
10
100
14 7 3 1.5 noneMOI
IFN
-g (p
g/m
l)
K. lactis P. pastoris
0.01
0.1
1
10
100
14 7 3 1.5 noneMOI
IFN
-g (p
g/m
l)
0.01
0.1
1
10
100
14 7 3 1.5 noneMOI
IFN
-g (p
g/m
l)
S. cerevisiae Sz. pombe
cytosolic
secreted
cell wall
control
cytosolic
secreted
cytosolic
secreted
cell wall
control
cell wall
control
MOI
IFN
-γ(p
g/m
l)
IFN
-γ(p
g/m
l)
IFN
-γ(p
g/m
l)
IFN
-γ(p
g/m
l)
Results
148
Fig. 33: Activation of Ova-specific CD8+ T lymphocytes after yeast-mediated delivery of Ova-derivatives by bone marrow-derived macrophages in vitro. Adherent BMM from C57BL/6 mice were loaded with yeast genera expressing the different Ova derivatives. After 16 h, CD8+ T cells specific for the MHC class I-restricted SIINFEKL epitope were added and incubated for another 18 h. Antigen presentation was measured by T cell activation which was assessed by measuring the amount of IFN-γ in culture supernatants by ELISA. Results are expressed as mean and SD values of three independent experiments [Bazan et al., 2011]. This assay could no longer be repeated within this work in order to test antigen delivery
when Ovacyt VLP were recombinantly expressed in S. cerevisiae.
In conclusion, delivery of a protein antigen by different yeast genera was able to
activate antigen-specific CD8+ T lymphocytes. Moreover, lymphocyte activation was
influenced by antigen localization in yeast.
5.2. Activation of pp65-specific memory T lymphocytes from HCMV-positive
donors in an autologous system
To simulate a condition more closely resembling an in vivo situation, the yeast-based
delivery system was also tested using human DCs, the most effective inducers of T cell-
mediated immunity. By means of an ex vivo T cell stimulation assay, human DCs
loaded with distinct yeast genera expressing pp65 were assessed for efficient activation
of antigen-specific CD4+ and CD8+ T lymphocytes. The incubation time of DCs with
yeasts (48 h) is sufficient to induce DC maturation and activation, as previously shown
in section 1 of Results.
Immature DCs derived from monocytes isolated from HCMV-positive donors
were incubated for 48 h with yeasts expressing pp65 or yeasts carrying empty vectors
(MOI 5); as positive and negative controls a lysate from HCMV-infected fibroblasts or
untreated cells were used, respectively. Then, autologous lymphoctes were added at a
ratio of 1:1 (lymphocyte:DC), as well as anti-CD49d and anti-CD28. Cells were co-
cultured for 6 h, during the last 4 h in the presence of Brefeldin A to inhibit protein
secretion. Cells were stained for the surface molecules CD4 or CD8 and CD69 and
intracellular IFN-γ. Activation of pp65-specific CD4+ and CD8+ memory T
lymphocytes was analyzed by flow cytometry.
Fig. 34 shows the frequencies of CD8+ T cells expressing CD69 and IFN-γ in
response to pp65. Responses to yeasts delivering pp65 were higher than those obtained
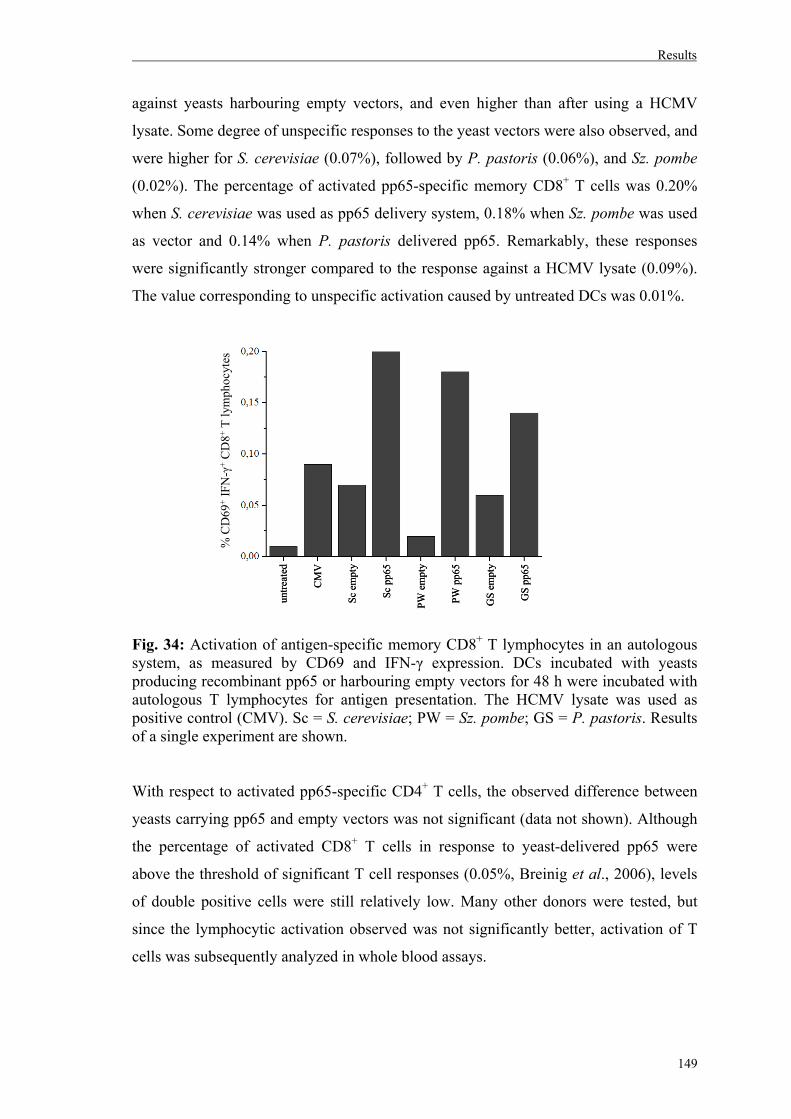
Results
149
against yeasts harbouring empty vectors, and even higher than after using a HCMV
lysate. Some degree of unspecific responses to the yeast vectors were also observed, and
were higher for S. cerevisiae (0.07%), followed by P. pastoris (0.06%), and Sz. pombe
(0.02%). The percentage of activated pp65-specific memory CD8+ T cells was 0.20%
when S. cerevisiae was used as pp65 delivery system, 0.18% when Sz. pombe was used
as vector and 0.14% when P. pastoris delivered pp65. Remarkably, these responses
were significantly stronger compared to the response against a HCMV lysate (0.09%).
The value corresponding to unspecific activation caused by untreated DCs was 0.01%.
Fig. 34: Activation of antigen-specific memory CD8+ T lymphocytes in an autologous system, as measured by CD69 and IFN-γ expression. DCs incubated with yeasts producing recombinant pp65 or harbouring empty vectors for 48 h were incubated with autologous T lymphocytes for antigen presentation. The HCMV lysate was used as positive control (CMV). Sc = S. cerevisiae; PW = Sz. pombe; GS = P. pastoris. Results of a single experiment are shown. With respect to activated pp65-specific CD4+ T cells, the observed difference between
yeasts carrying pp65 and empty vectors was not significant (data not shown). Although
the percentage of activated CD8+ T cells in response to yeast-delivered pp65 were
above the threshold of significant T cell responses (0.05%, Breinig et al., 2006), levels
of double positive cells were still relatively low. Many other donors were tested, but
since the lymphocytic activation observed was not significantly better, activation of T
cells was subsequently analyzed in whole blood assays.
untre
ated
CM
V
Sc e
mpt
y
Sc p
p65
PW e
mpt
y
PW p
p65
GS
empt
y
GS
pp65
untre
ated
CM
V
Sc e
mpt
y
Sc p
p65
PW e
mpt
y
PW p
p65
GS
empt
y
GS
pp65
% C
D69
+IF
N-γ
+C
D8+
T ly
mph
ocyt
es
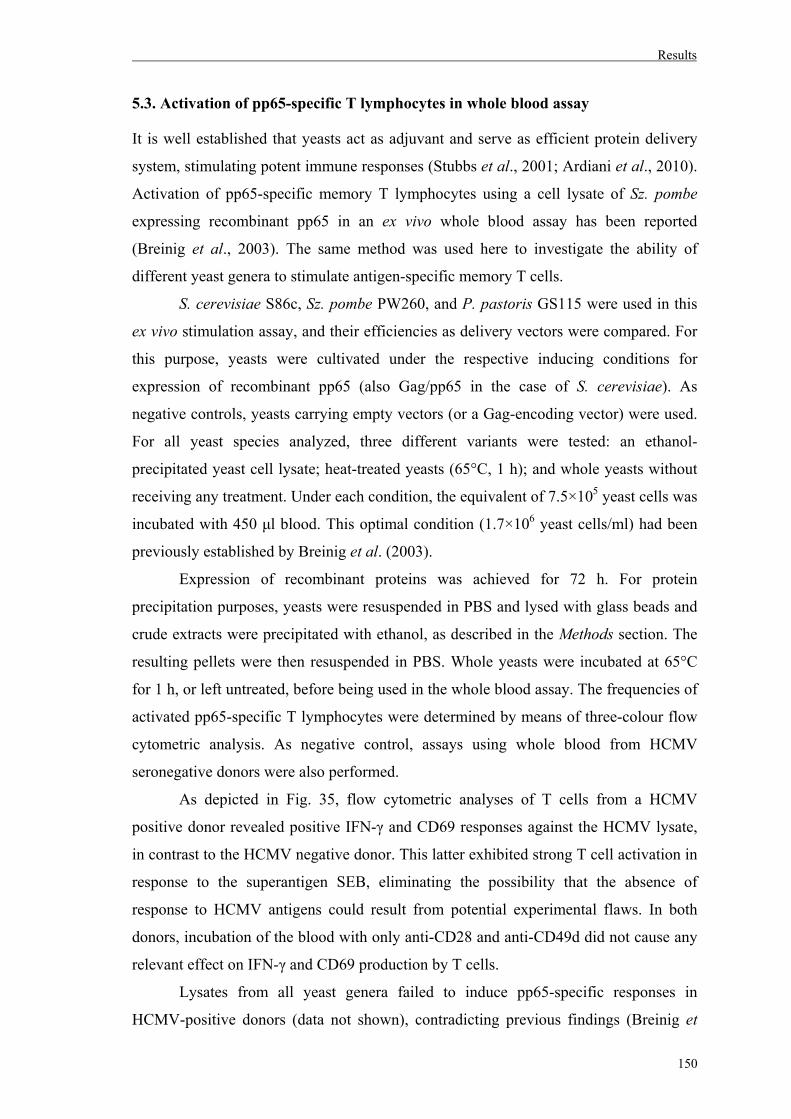
Results
150
5.3. Activation of pp65-specific T lymphocytes in whole blood assay
It is well established that yeasts act as adjuvant and serve as efficient protein delivery
system, stimulating potent immune responses (Stubbs et al., 2001; Ardiani et al., 2010).
Activation of pp65-specific memory T lymphocytes using a cell lysate of Sz. pombe
expressing recombinant pp65 in an ex vivo whole blood assay has been reported
(Breinig et al., 2003). The same method was used here to investigate the ability of
different yeast genera to stimulate antigen-specific memory T cells.
S. cerevisiae S86c, Sz. pombe PW260, and P. pastoris GS115 were used in this
ex vivo stimulation assay, and their efficiencies as delivery vectors were compared. For
this purpose, yeasts were cultivated under the respective inducing conditions for
expression of recombinant pp65 (also Gag/pp65 in the case of S. cerevisiae). As
negative controls, yeasts carrying empty vectors (or a Gag-encoding vector) were used.
For all yeast species analyzed, three different variants were tested: an ethanol-
precipitated yeast cell lysate; heat-treated yeasts (65°C, 1 h); and whole yeasts without
receiving any treatment. Under each condition, the equivalent of 7.5×10⁵ yeast cells was
incubated with 450 μl blood. This optimal condition (1.7×10⁶ yeast cells/ml) had been
previously established by Breinig et al. (2003).
Expression of recombinant proteins was achieved for 72 h. For protein
precipitation purposes, yeasts were resuspended in PBS and lysed with glass beads and
crude extracts were precipitated with ethanol, as described in the Methods section. The
resulting pellets were then resuspended in PBS. Whole yeasts were incubated at 65°C
for 1 h, or left untreated, before being used in the whole blood assay. The frequencies of
activated pp65-specific T lymphocytes were determined by means of three-colour flow
cytometric analysis. As negative control, assays using whole blood from HCMV
seronegative donors were also performed.
As depicted in Fig. 35, flow cytometric analyses of T cells from a HCMV
positive donor revealed positive IFN-γ and CD69 responses against the HCMV lysate,
in contrast to the HCMV negative donor. This latter exhibited strong T cell activation in
response to the superantigen SEB, eliminating the possibility that the absence of
response to HCMV antigens could result from potential experimental flaws. In both
donors, incubation of the blood with only anti-CD28 and anti-CD49d did not cause any
relevant effect on IFN-γ and CD69 production by T cells.
Lysates from all yeast genera failed to induce pp65-specific responses in
HCMV-positive donors (data not shown), contradicting previous findings (Breinig et
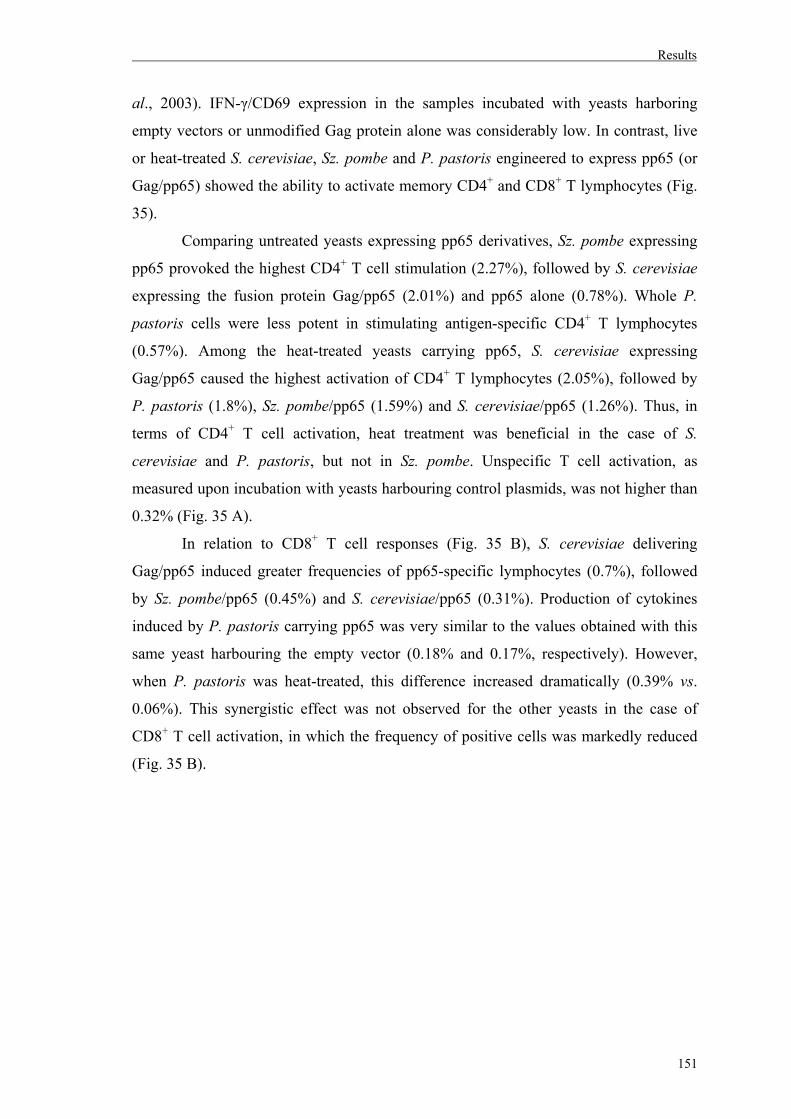
Results
151
al., 2003). IFN-γ/CD69 expression in the samples incubated with yeasts harboring
empty vectors or unmodified Gag protein alone was considerably low. In contrast, live
or heat-treated S. cerevisiae, Sz. pombe and P. pastoris engineered to express pp65 (or
Gag/pp65) showed the ability to activate memory CD4+ and CD8+ T lymphocytes (Fig.
35).
Comparing untreated yeasts expressing pp65 derivatives, Sz. pombe expressing
pp65 provoked the highest CD4+ T cell stimulation (2.27%), followed by S. cerevisiae
expressing the fusion protein Gag/pp65 (2.01%) and pp65 alone (0.78%). Whole P.
pastoris cells were less potent in stimulating antigen-specific CD4+ T lymphocytes
(0.57%). Among the heat-treated yeasts carrying pp65, S. cerevisiae expressing
Gag/pp65 caused the highest activation of CD4+ T lymphocytes (2.05%), followed by
P. pastoris (1.8%), Sz. pombe/pp65 (1.59%) and S. cerevisiae/pp65 (1.26%). Thus, in
terms of CD4+ T cell activation, heat treatment was beneficial in the case of S.
cerevisiae and P. pastoris, but not in Sz. pombe. Unspecific T cell activation, as
measured upon incubation with yeasts harbouring control plasmids, was not higher than
0.32% (Fig. 35 A).
In relation to CD8+ T cell responses (Fig. 35 B), S. cerevisiae delivering
Gag/pp65 induced greater frequencies of pp65-specific lymphocytes (0.7%), followed
by Sz. pombe/pp65 (0.45%) and S. cerevisiae/pp65 (0.31%). Production of cytokines
induced by P. pastoris carrying pp65 was very similar to the values obtained with this
same yeast harbouring the empty vector (0.18% and 0.17%, respectively). However,
when P. pastoris was heat-treated, this difference increased dramatically (0.39% vs.
0.06%). This synergistic effect was not observed for the other yeasts in the case of
CD8+ T cell activation, in which the frequency of positive cells was markedly reduced
(Fig. 35 B).
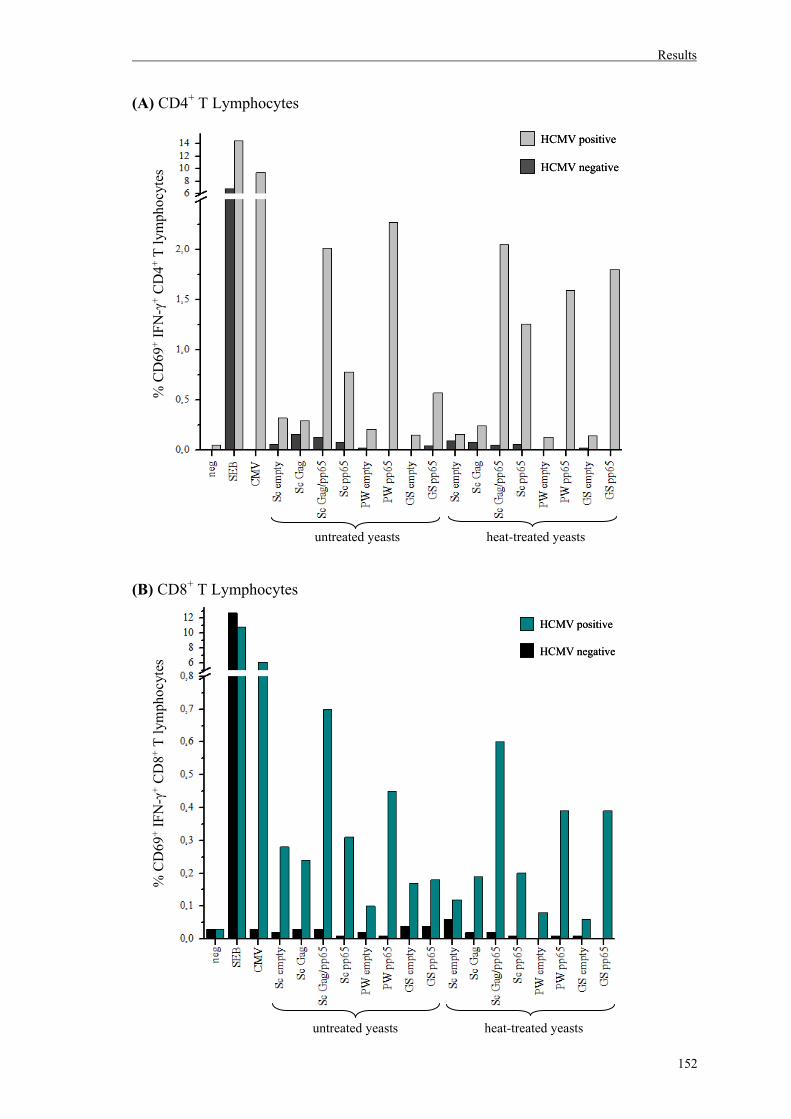
Results
152
(A) CD4+ T Lymphocytes
(B) CD8+ T Lymphocytes
untreated yeasts heat-treated yeasts
untreated yeasts heat-treated yeasts
% C
D69
+IF
N-γ
+C
D8+
T ly
mph
ocyt
es%
CD
69+
IFN
-γ+
CD
4+T
lym
phoc
ytes
HCMV positive
HCMV negative
HCMV positive
HCMV negative
HCMV positive
HCMV negative
HCMV positive
HCMV negative
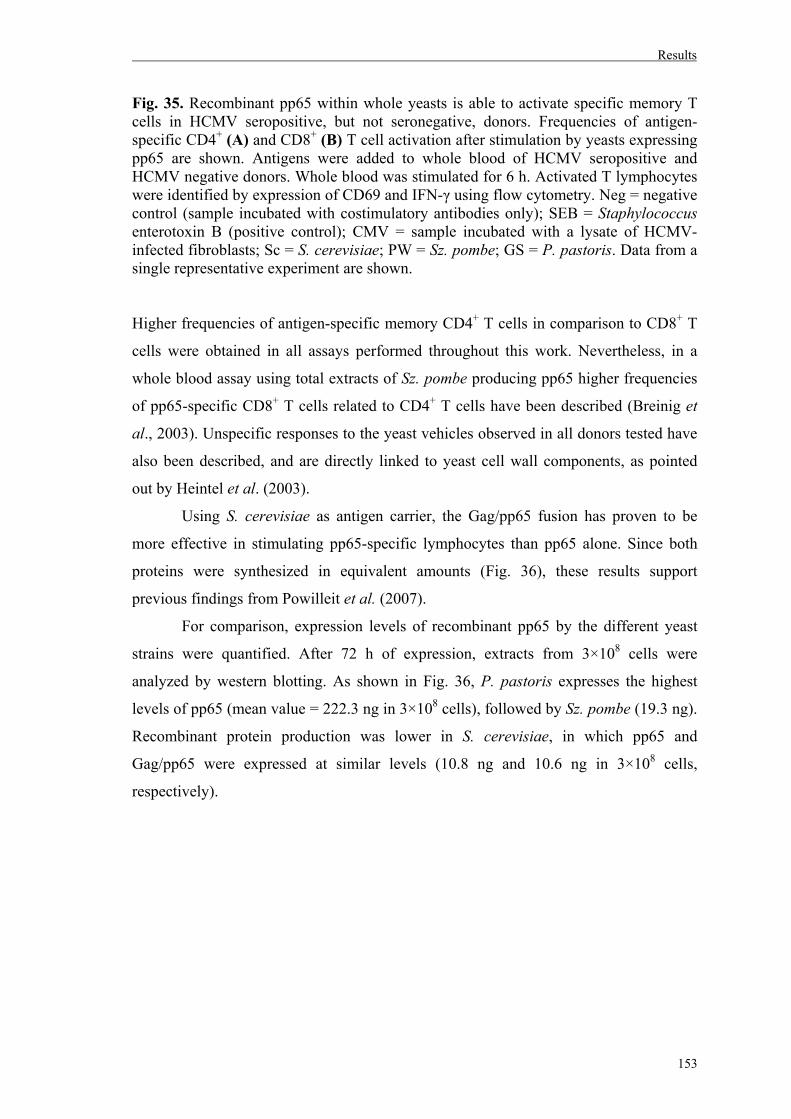
Results
153
Fig. 35. Recombinant pp65 within whole yeasts is able to activate specific memory T cells in HCMV seropositive, but not seronegative, donors. Frequencies of antigen-specific CD4+ (A) and CD8+ (B) T cell activation after stimulation by yeasts expressing pp65 are shown. Antigens were added to whole blood of HCMV seropositive and HCMV negative donors. Whole blood was stimulated for 6 h. Activated T lymphocytes were identified by expression of CD69 and IFN-γ using flow cytometry. Neg = negative control (sample incubated with costimulatory antibodies only); SEB = Staphylococcus enterotoxin B (positive control); CMV = sample incubated with a lysate of HCMV-infected fibroblasts; Sc = S. cerevisiae; PW = Sz. pombe; GS = P. pastoris. Data from a single representative experiment are shown. Higher frequencies of antigen-specific memory CD4+ T cells in comparison to CD8+ T
cells were obtained in all assays performed throughout this work. Nevertheless, in a
whole blood assay using total extracts of Sz. pombe producing pp65 higher frequencies
of pp65-specific CD8+ T cells related to CD4+ T cells have been described (Breinig et
al., 2003). Unspecific responses to the yeast vehicles observed in all donors tested have
also been described, and are directly linked to yeast cell wall components, as pointed
out by Heintel et al. (2003).
Using S. cerevisiae as antigen carrier, the Gag/pp65 fusion has proven to be
more effective in stimulating pp65-specific lymphocytes than pp65 alone. Since both
proteins were synthesized in equivalent amounts (Fig. 36), these results support
previous findings from Powilleit et al. (2007).
For comparison, expression levels of recombinant pp65 by the different yeast
strains were quantified. After 72 h of expression, extracts from 3×10⁸ cells were
analyzed by western blotting. As shown in Fig. 36, P. pastoris expresses the highest
levels of pp65 (mean value = 222.3 ng in 3×10⁸ cells), followed by Sz. pombe (19.3 ng).
Recombinant protein production was lower in S. cerevisiae, in which pp65 and
Gag/pp65 were expressed at similar levels (10.8 ng and 10.6 ng in 3×10⁸ cells,
respectively).
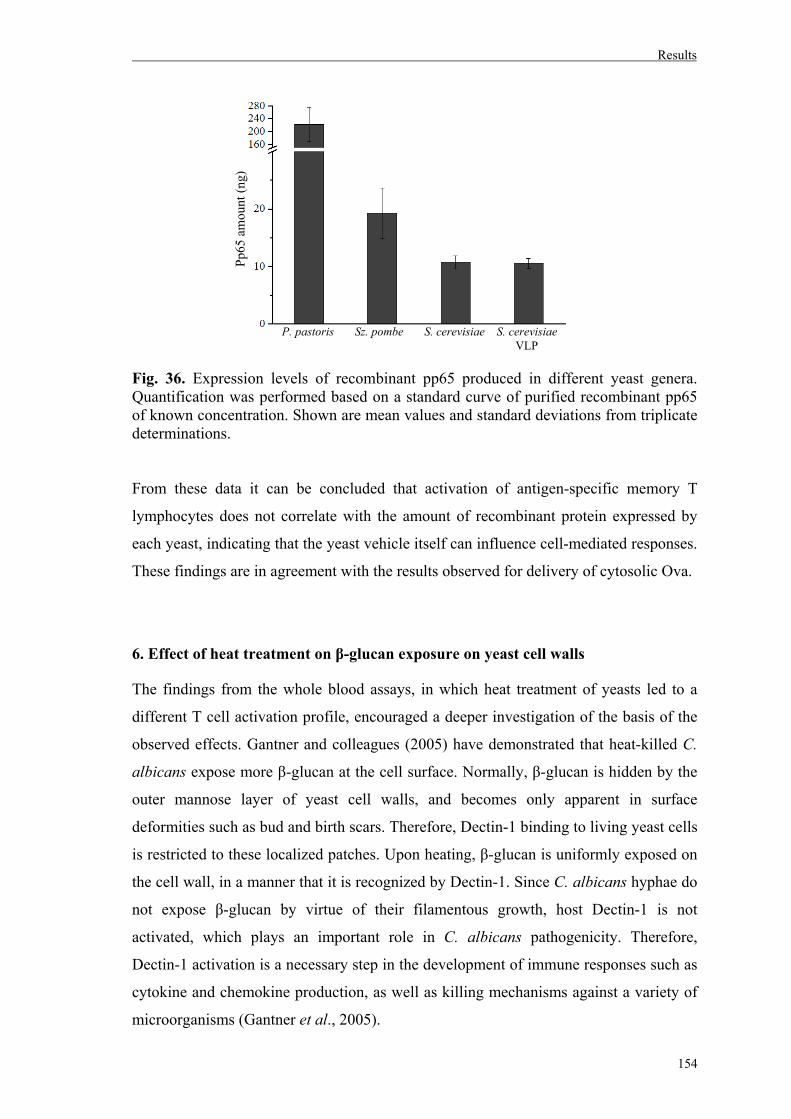
Results
154
Fig. 36. Expression levels of recombinant pp65 produced in different yeast genera. Quantification was performed based on a standard curve of purified recombinant pp65 of known concentration. Shown are mean values and standard deviations from triplicate determinations. From these data it can be concluded that activation of antigen-specific memory T
lymphocytes does not correlate with the amount of recombinant protein expressed by
each yeast, indicating that the yeast vehicle itself can influence cell-mediated responses.
These findings are in agreement with the results observed for delivery of cytosolic Ova.
6. Effect of heat treatment on β-glucan exposure on yeast cell walls
The findings from the whole blood assays, in which heat treatment of yeasts led to a
different T cell activation profile, encouraged a deeper investigation of the basis of the
observed effects. Gantner and colleagues (2005) have demonstrated that heat-killed C.
albicans expose more β-glucan at the cell surface. Normally, β-glucan is hidden by the
outer mannose layer of yeast cell walls, and becomes only apparent in surface
deformities such as bud and birth scars. Therefore, Dectin-1 binding to living yeast cells
is restricted to these localized patches. Upon heating, β-glucan is uniformly exposed on
the cell wall, in a manner that it is recognized by Dectin-1. Since C. albicans hyphae do
not expose β-glucan by virtue of their filamentous growth, host Dectin-1 is not
activated, which plays an important role in C. albicans pathogenicity. Therefore,
Dectin-1 activation is a necessary step in the development of immune responses such as
cytokine and chemokine production, as well as killing mechanisms against a variety of
microorganisms (Gantner et al., 2005).
P. pastoris Sz. pombe S. cerevisiae S. cerevisiae VLP
Pp65
am
ount
(ng)
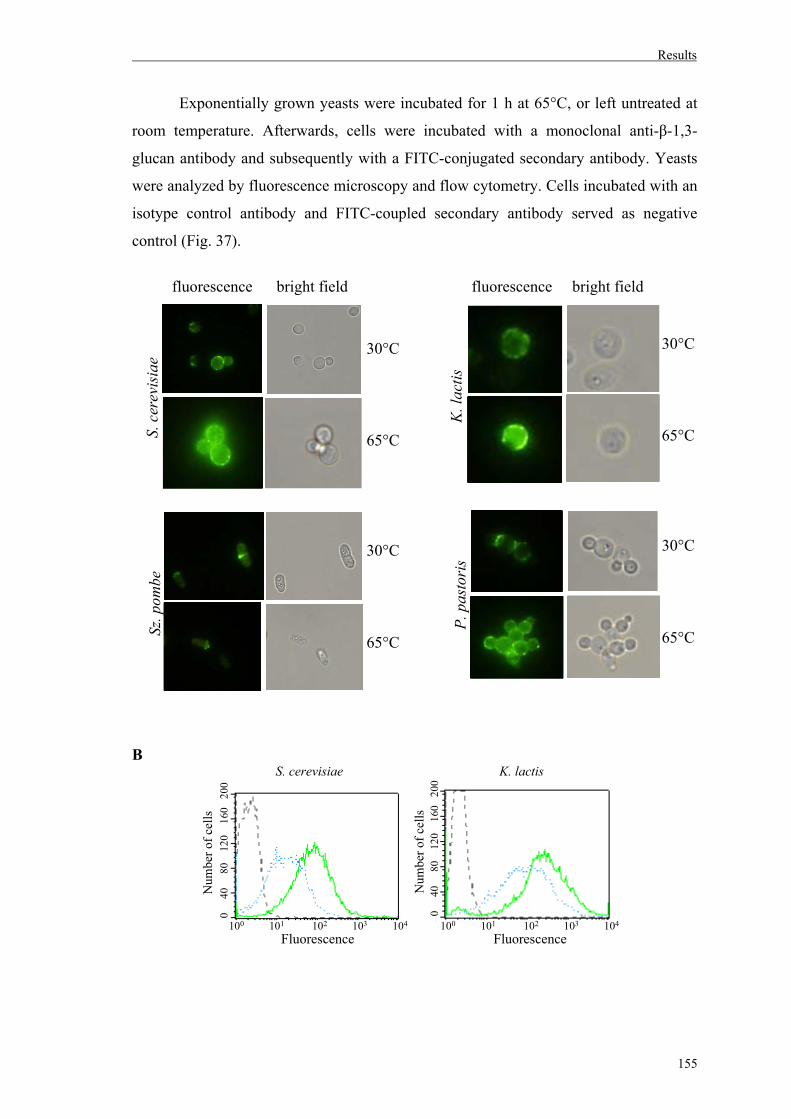
Results
155
Exponentially grown yeasts were incubated for 1 h at 65°C, or left untreated at
room temperature. Afterwards, cells were incubated with a monoclonal anti-β-1,3-
glucan antibody and subsequently with a FITC-conjugated secondary antibody. Yeasts
were analyzed by fluorescence microscopy and flow cytometry. Cells incubated with an
isotype control antibody and FITC-coupled secondary antibody served as negative
control (Fig. 37).
fluorescence bright field fluorescence bright field
B S. cerevisiae K. lactis
30°C 65°C 30°C 65°C
S. c
erev
isia
e
K. l
actis
30°C 65°C 30°C 65°C Sz
. pom
be
P. p
asto
ris
0
40
8
0
120
16
0 2
00
0
40
8
0
120
16
0 2
00
100 101 102 103 104100 101 102 103 104
Num
bero
f cel
ls
Num
bero
f cel
ls
FluorescenceFluorescence
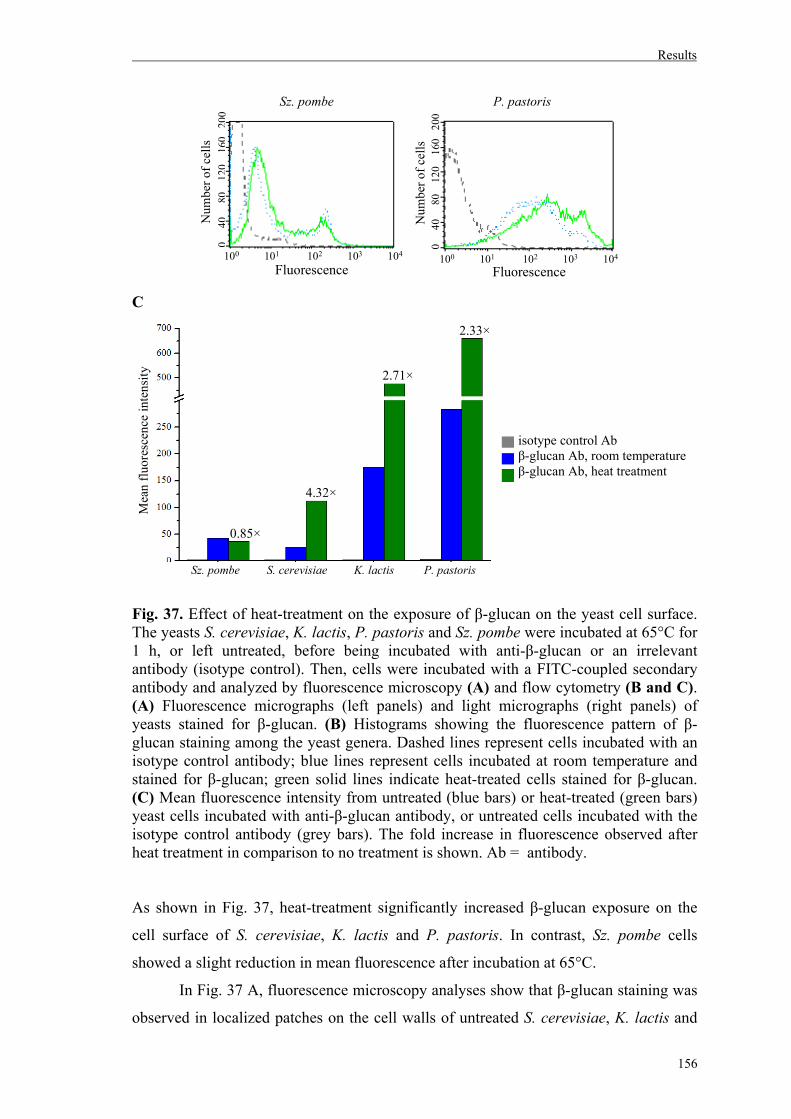
Results
156
Sz. pombe P. pastoris C Fig. 37. Effect of heat-treatment on the exposure of β-glucan on the yeast cell surface. The yeasts S. cerevisiae, K. lactis, P. pastoris and Sz. pombe were incubated at 65°C for 1 h, or left untreated, before being incubated with anti-β-glucan or an irrelevant antibody (isotype control). Then, cells were incubated with a FITC-coupled secondary antibody and analyzed by fluorescence microscopy (A) and flow cytometry (B and C). (A) Fluorescence micrographs (left panels) and light micrographs (right panels) of yeasts stained for β-glucan. (B) Histograms showing the fluorescence pattern of β-glucan staining among the yeast genera. Dashed lines represent cells incubated with an isotype control antibody; blue lines represent cells incubated at room temperature and stained for β-glucan; green solid lines indicate heat-treated cells stained for β-glucan. (C) Mean fluorescence intensity from untreated (blue bars) or heat-treated (green bars) yeast cells incubated with anti-β-glucan antibody, or untreated cells incubated with the isotype control antibody (grey bars). The fold increase in fluorescence observed after heat treatment in comparison to no treatment is shown. Ab = antibody. As shown in Fig. 37, heat-treatment significantly increased β-glucan exposure on the
cell surface of S. cerevisiae, K. lactis and P. pastoris. In contrast, Sz. pombe cells
showed a slight reduction in mean fluorescence after incubation at 65°C.
In Fig. 37 A, fluorescence microscopy analyses show that β-glucan staining was
observed in localized patches on the cell walls of untreated S. cerevisiae, K. lactis and
isotype control Ab β-glucan Ab, room temperature β-glucan Ab, heat treatment
2.33×
2.71×
4.32×
0.85×
Sz. pombe S. cerevisiae K. lactis P. pastoris
Mea
nflu
ores
cenc
ein
tens
ity
0
40
8
0
120
16
0 2
00
0
40
8
0
120
16
0 2
00
100 101 102 103 104100 101 102 103 104
Num
bero
f cel
ls
Num
bero
f cel
ls
Fluorescence Fluorescence
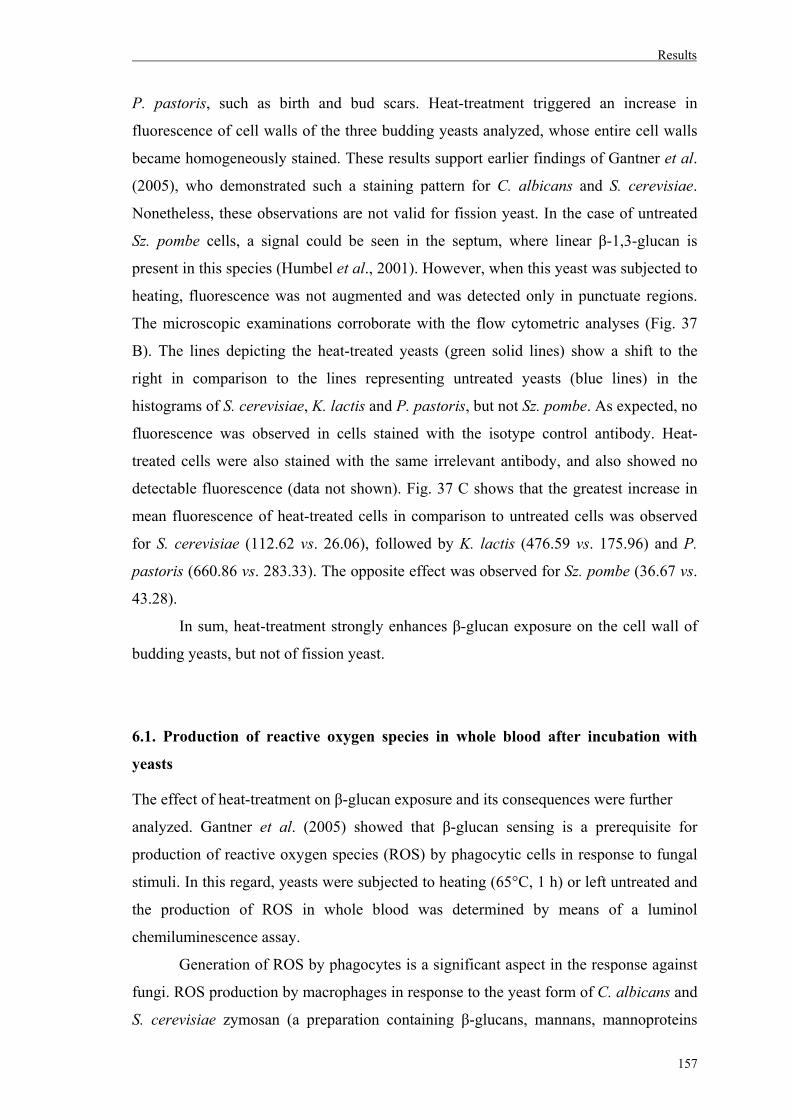
Results
157
P. pastoris, such as birth and bud scars. Heat-treatment triggered an increase in
fluorescence of cell walls of the three budding yeasts analyzed, whose entire cell walls
became homogeneously stained. These results support earlier findings of Gantner et al.
(2005), who demonstrated such a staining pattern for C. albicans and S. cerevisiae.
Nonetheless, these observations are not valid for fission yeast. In the case of untreated
Sz. pombe cells, a signal could be seen in the septum, where linear β-1,3-glucan is
present in this species (Humbel et al., 2001). However, when this yeast was subjected to
heating, fluorescence was not augmented and was detected only in punctuate regions.
The microscopic examinations corroborate with the flow cytometric analyses (Fig. 37
B). The lines depicting the heat-treated yeasts (green solid lines) show a shift to the
right in comparison to the lines representing untreated yeasts (blue lines) in the
histograms of S. cerevisiae, K. lactis and P. pastoris, but not Sz. pombe. As expected, no
fluorescence was observed in cells stained with the isotype control antibody. Heat-
treated cells were also stained with the same irrelevant antibody, and also showed no
detectable fluorescence (data not shown). Fig. 37 C shows that the greatest increase in
mean fluorescence of heat-treated cells in comparison to untreated cells was observed
for S. cerevisiae (112.62 vs. 26.06), followed by K. lactis (476.59 vs. 175.96) and P.
pastoris (660.86 vs. 283.33). The opposite effect was observed for Sz. pombe (36.67 vs.
43.28).
In sum, heat-treatment strongly enhances β-glucan exposure on the cell wall of
budding yeasts, but not of fission yeast.
6.1. Production of reactive oxygen species in whole blood after incubation with
yeasts
The effect of heat-treatment on β-glucan exposure and its consequences were further
analyzed. Gantner et al. (2005) showed that β-glucan sensing is a prerequisite for
production of reactive oxygen species (ROS) by phagocytic cells in response to fungal
stimuli. In this regard, yeasts were subjected to heating (65°C, 1 h) or left untreated and
the production of ROS in whole blood was determined by means of a luminol
chemiluminescence assay.
Generation of ROS by phagocytes is a significant aspect in the response against
fungi. ROS production by macrophages in response to the yeast form of C. albicans and
S. cerevisiae zymosan (a preparation containing β-glucans, mannans, mannoproteins
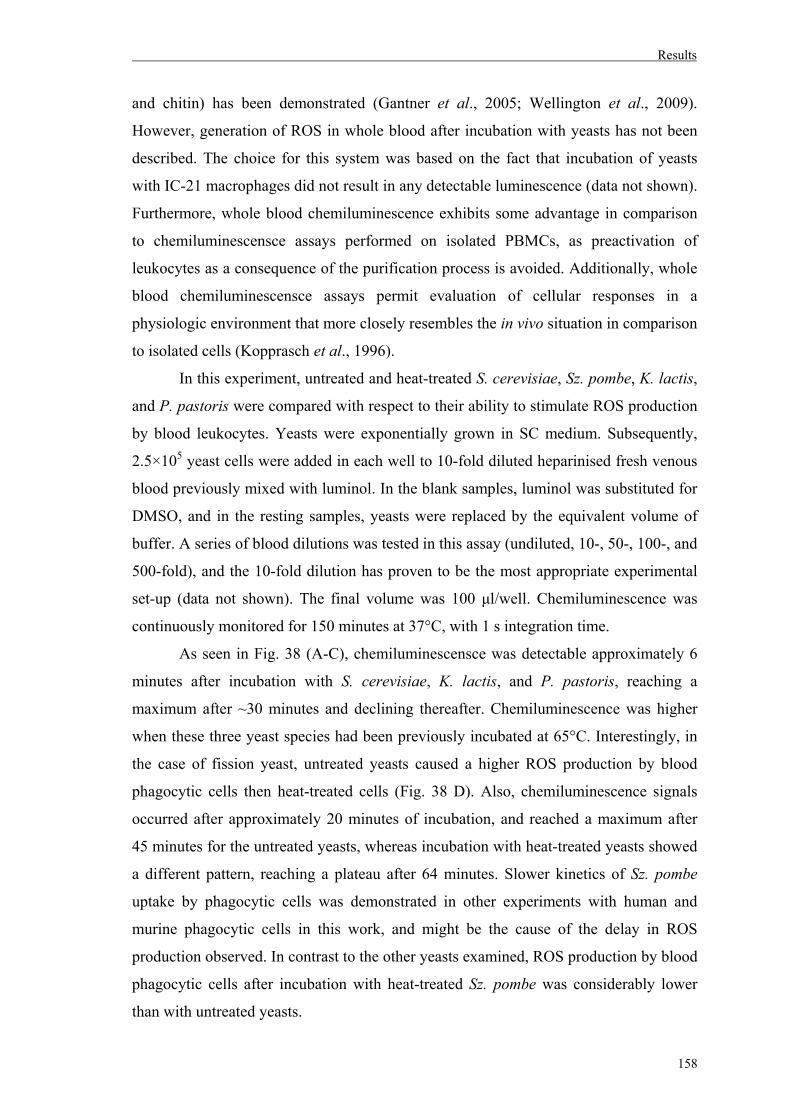
Results
158
and chitin) has been demonstrated (Gantner et al., 2005; Wellington et al., 2009).
However, generation of ROS in whole blood after incubation with yeasts has not been
described. The choice for this system was based on the fact that incubation of yeasts
with IC-21 macrophages did not result in any detectable luminescence (data not shown).
Furthermore, whole blood chemiluminescence exhibits some advantage in comparison
to chemiluminescensce assays performed on isolated PBMCs, as preactivation of
leukocytes as a consequence of the purification process is avoided. Additionally, whole
blood chemiluminescensce assays permit evaluation of cellular responses in a
physiologic environment that more closely resembles the in vivo situation in comparison
to isolated cells (Kopprasch et al., 1996).
In this experiment, untreated and heat-treated S. cerevisiae, Sz. pombe, K. lactis,
and P. pastoris were compared with respect to their ability to stimulate ROS production
by blood leukocytes. Yeasts were exponentially grown in SC medium. Subsequently,
2.5×10⁵ yeast cells were added in each well to 10-fold diluted heparinised fresh venous
blood previously mixed with luminol. In the blank samples, luminol was substituted for
DMSO, and in the resting samples, yeasts were replaced by the equivalent volume of
buffer. A series of blood dilutions was tested in this assay (undiluted, 10-, 50-, 100-, and
500-fold), and the 10-fold dilution has proven to be the most appropriate experimental
set-up (data not shown). The final volume was 100 μl/well. Chemiluminescence was
continuously monitored for 150 minutes at 37°C, with 1 s integration time.
As seen in Fig. 38 (A-C), chemiluminescensce was detectable approximately 6
minutes after incubation with S. cerevisiae, K. lactis, and P. pastoris, reaching a
maximum after ~30 minutes and declining thereafter. Chemiluminescence was higher
when these three yeast species had been previously incubated at 65°C. Interestingly, in
the case of fission yeast, untreated yeasts caused a higher ROS production by blood
phagocytic cells then heat-treated cells (Fig. 38 D). Also, chemiluminescence signals
occurred after approximately 20 minutes of incubation, and reached a maximum after
45 minutes for the untreated yeasts, whereas incubation with heat-treated yeasts showed
a different pattern, reaching a plateau after 64 minutes. Slower kinetics of Sz. pombe
uptake by phagocytic cells was demonstrated in other experiments with human and
murine phagocytic cells in this work, and might be the cause of the delay in ROS
production observed. In contrast to the other yeasts examined, ROS production by blood
phagocytic cells after incubation with heat-treated Sz. pombe was considerably lower
than with untreated yeasts.
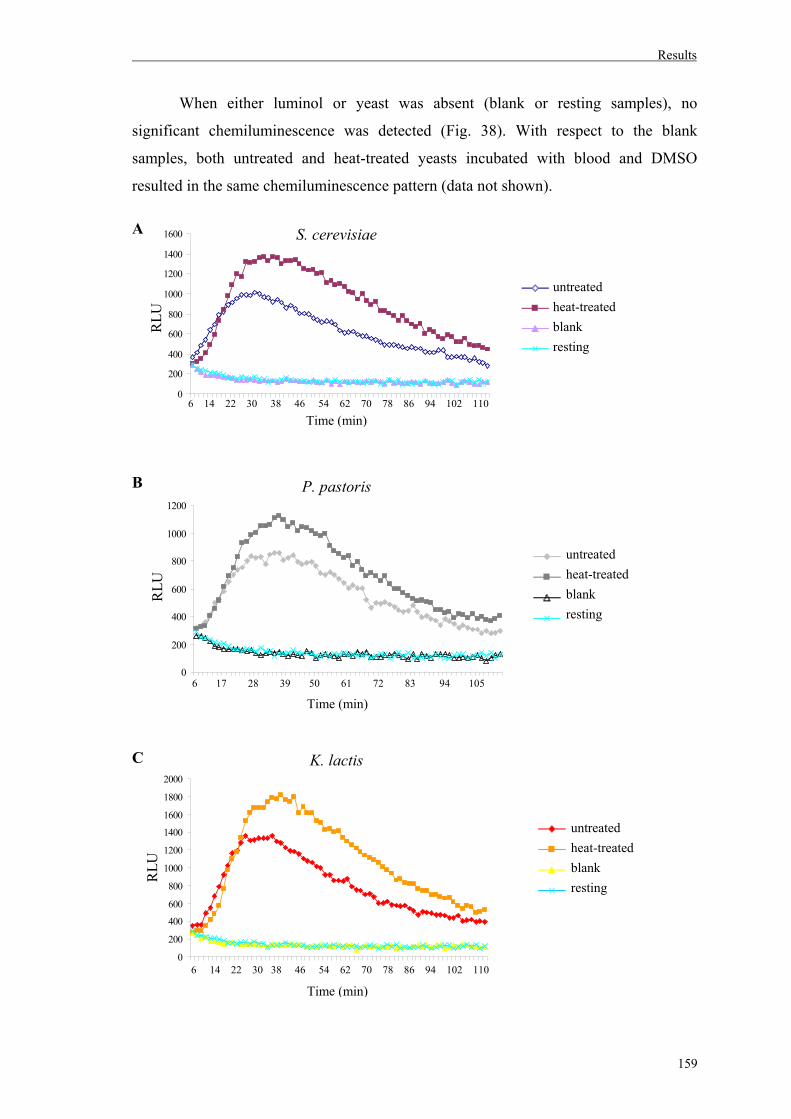
Results
159
When either luminol or yeast was absent (blank or resting samples), no
significant chemiluminescence was detected (Fig. 38). With respect to the blank
samples, both untreated and heat-treated yeasts incubated with blood and DMSO
resulted in the same chemiluminescence pattern (data not shown). A B C
0
200
400
600
800
1000
1200
1400
1600
1800
2000
0
200
400
600
800
1000
1200
1400
1600
0
200
400
600
800
1000
1200
Time (min)
Time (min)
Time (min)
S. cerevisiae
P. pastoris
K. lactis
untreated heat-treated blank resting
untreated heat-treated blank resting
untreated heat-treated blank resting
RLU
RLU
RLU
6 14 22 30 38 46 54 62 70 78 86 94 102 110
6 17 28 39 50 61 72 83 94 105
6 14 22 30 38 46 54 62 70 78 86 94 102 110
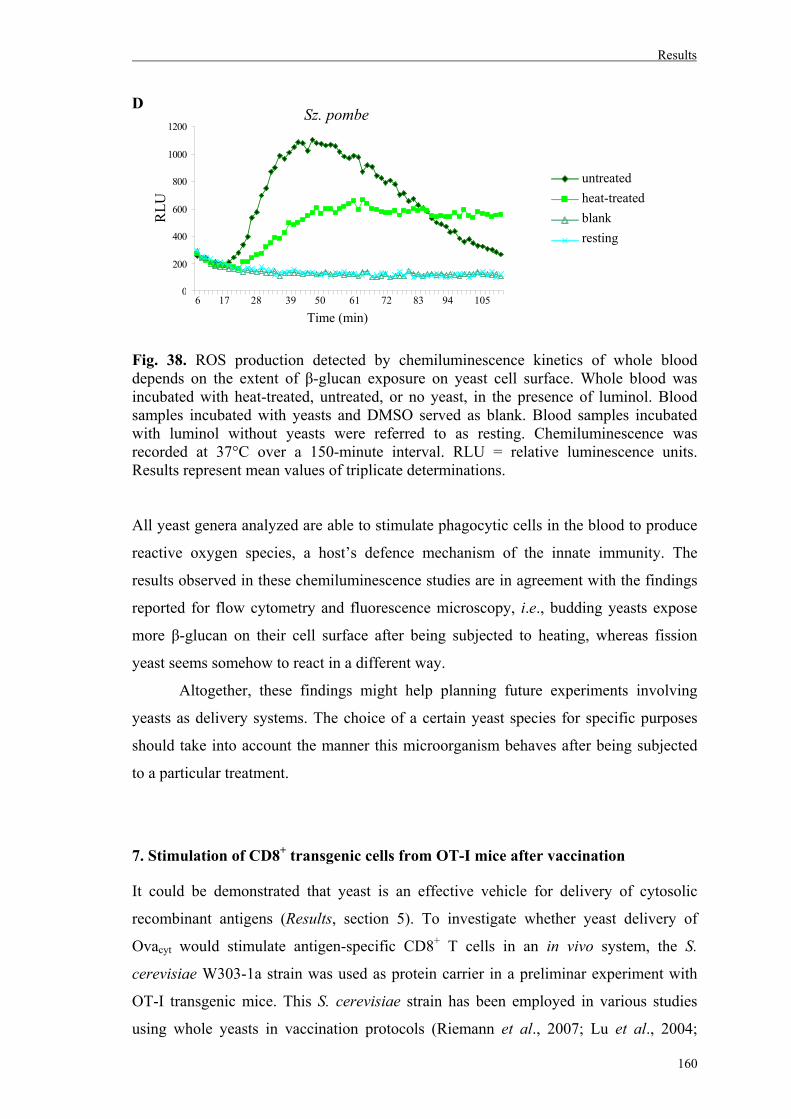
Results
160
D Fig. 38. ROS production detected by chemiluminescence kinetics of whole blood depends on the extent of β-glucan exposure on yeast cell surface. Whole blood was incubated with heat-treated, untreated, or no yeast, in the presence of luminol. Blood samples incubated with yeasts and DMSO served as blank. Blood samples incubated with luminol without yeasts were referred to as resting. Chemiluminescence was recorded at 37°C over a 150-minute interval. RLU = relative luminescence units. Results represent mean values of triplicate determinations. All yeast genera analyzed are able to stimulate phagocytic cells in the blood to produce
reactive oxygen species, a host’s defence mechanism of the innate immunity. The
results observed in these chemiluminescence studies are in agreement with the findings
reported for flow cytometry and fluorescence microscopy, i.e., budding yeasts expose
more β-glucan on their cell surface after being subjected to heating, whereas fission
yeast seems somehow to react in a different way.
Altogether, these findings might help planning future experiments involving
yeasts as delivery systems. The choice of a certain yeast species for specific purposes
should take into account the manner this microorganism behaves after being subjected
to a particular treatment.
7. Stimulation of CD8+ transgenic cells from OT-I mice after vaccination
It could be demonstrated that yeast is an effective vehicle for delivery of cytosolic
recombinant antigens (Results, section 5). To investigate whether yeast delivery of
Ovacyt would stimulate antigen-specific CD8+ T cells in an in vivo system, the S.
cerevisiae W303-1a strain was used as protein carrier in a preliminar experiment with
OT-I transgenic mice. This S. cerevisiae strain has been employed in various studies
using whole yeasts in vaccination protocols (Riemann et al., 2007; Lu et al., 2004;
0
200
400
600
800
1000
1200
Time (min)
RLU
untreated heat-treated blank resting
Sz. pombe
6 17 28 39 50 61 72 83 94 105
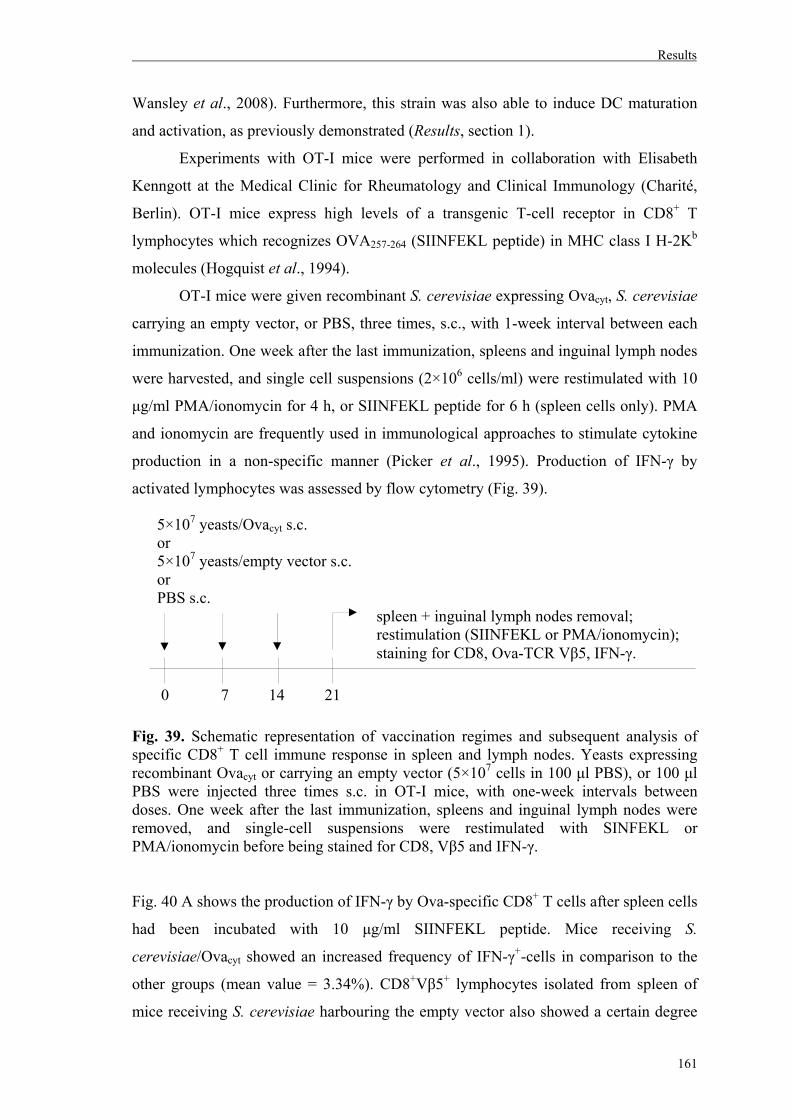
Results
161
Wansley et al., 2008). Furthermore, this strain was also able to induce DC maturation
and activation, as previously demonstrated (Results, section 1).
Experiments with OT-I mice were performed in collaboration with Elisabeth
Kenngott at the Medical Clinic for Rheumatology and Clinical Immunology (Charité,
Berlin). OT-I mice express high levels of a transgenic T-cell receptor in CD8+ T
lymphocytes which recognizes OVA257-264 (SIINFEKL peptide) in MHC class I H-2Kb
molecules (Hogquist et al., 1994).
OT-I mice were given recombinant S. cerevisiae expressing Ovacyt, S. cerevisiae
carrying an empty vector, or PBS, three times, s.c., with 1-week interval between each
immunization. One week after the last immunization, spleens and inguinal lymph nodes
were harvested, and single cell suspensions (2×10⁶ cells/ml) were restimulated with 10
μg/ml PMA/ionomycin for 4 h, or SIINFEKL peptide for 6 h (spleen cells only). PMA
and ionomycin are frequently used in immunological approaches to stimulate cytokine
production in a non-specific manner (Picker et al., 1995). Production of IFN-γ by
activated lymphocytes was assessed by flow cytometry (Fig. 39).
Fig. 39. Schematic representation of vaccination regimes and subsequent analysis of specific CD8+ T cell immune response in spleen and lymph nodes. Yeasts expressing recombinant Ovacyt or carrying an empty vector (5×10⁷ cells in 100 μl PBS), or 100 μl PBS were injected three times s.c. in OT-I mice, with one-week intervals between doses. One week after the last immunization, spleens and inguinal lymph nodes were removed, and single-cell suspensions were restimulated with SINFEKL or PMA/ionomycin before being stained for CD8, Vβ5 and IFN-γ. Fig. 40 A shows the production of IFN-γ by Ova-specific CD8+ T cells after spleen cells
had been incubated with 10 μg/ml SIINFEKL peptide. Mice receiving S.
cerevisiae/Ovacyt showed an increased frequency of IFN-γ+-cells in comparison to the
other groups (mean value = 3.34%). CD8+Vβ5+ lymphocytes isolated from spleen of
mice receiving S. cerevisiae harbouring the empty vector also showed a certain degree
5×10⁷ yeasts/Ovacyt s.c. or 5×10⁷ yeasts/empty vector s.c. or PBS s.c. spleen + inguinal lymph nodes removal; restimulation (SIINFEKL or PMA/ionomycin); staining for CD8, Ova-TCR Vβ5, IFN-γ.
0 7 14 21
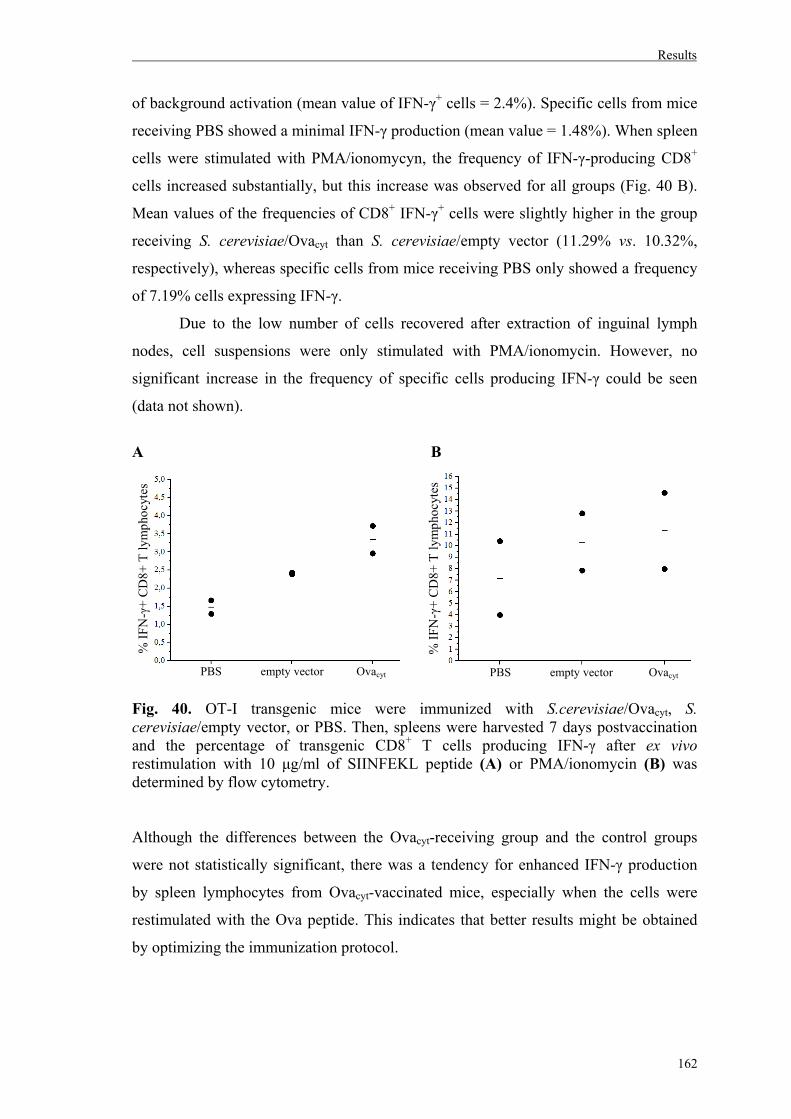
Results
162
of background activation (mean value of IFN-γ+ cells = 2.4%). Specific cells from mice
receiving PBS showed a minimal IFN-γ production (mean value = 1.48%). When spleen
cells were stimulated with PMA/ionomycyn, the frequency of IFN-γ-producing CD8+
cells increased substantially, but this increase was observed for all groups (Fig. 40 B).
Mean values of the frequencies of CD8+ IFN-γ+ cells were slightly higher in the group
receiving S. cerevisiae/Ovacyt than S. cerevisiae/empty vector (11.29% vs. 10.32%,
respectively), whereas specific cells from mice receiving PBS only showed a frequency
of 7.19% cells expressing IFN-γ.
Due to the low number of cells recovered after extraction of inguinal lymph
nodes, cell suspensions were only stimulated with PMA/ionomycin. However, no
significant increase in the frequency of specific cells producing IFN-γ could be seen
(data not shown).
A B
Fig. 40. OT-I transgenic mice were immunized with S.cerevisiae/Ovacyt, S. cerevisiae/empty vector, or PBS. Then, spleens were harvested 7 days postvaccination and the percentage of transgenic CD8+ T cells producing IFN-γ after ex vivo restimulation with 10 μg/ml of SIINFEKL peptide (A) or PMA/ionomycin (B) was determined by flow cytometry. Although the differences between the Ovacyt-receiving group and the control groups
were not statistically significant, there was a tendency for enhanced IFN-γ production
by spleen lymphocytes from Ovacyt-vaccinated mice, especially when the cells were
restimulated with the Ova peptide. This indicates that better results might be obtained
by optimizing the immunization protocol.
PBS empty vector Ovacyt PBS empty vector Ovacyt
% IF
N-γ
+ C
D8+
T ly
mph
ocyt
es
% IF
N-γ
+ C
D8+
T ly
mph
ocyt
es
Discussion
163
V. DISCUSSION
Vaccination approaches aiming at inducing robust cell-mediated immune responses
have been the focus of intense research. Strategies employing yeast as antigen carrier
have been established in the past decade. A number of in vitro studies, as well as
preclinical and clinical trials attest the intrinsic adjuvant properties of yeasts (Franzusoff
et al., 2005; Ardiani et al., 2010). However so far, the overwhelming majority of these
studies are restricted to the conventional yeast S. cerevisiae.
Hitherto, there is no study comparing the effectiveness of different yeast genera
as vaccine vehicles. Although such comparison is sometimes difficult due to the
difference in expression levels of the recombinant protein among the yeasts examined,
testing the applicability of yeasts species alternative to S. cerevisiae in the development
of novel antigen delivery systems could be of relevance.
The use of yeasts as antigen delivery system provides the following benefits: (i)
yeasts can be engineered to express one or more recombinant proteins, and correctly
perform post-translational modifications; (ii) cost-effectivenes of the system, also in
large-scale productions; (iii) yeast cell wall components per se activate dendritic cells
and amplify signals required for T cell activation; (iv) antigen presentation occurs via
both MHC class I and MHC class II pathways, eliciting antigen-specific T cell
responses; (v) absence of yeast-induced neutralizing immune responses, enabling
repeated administration; and (vi) heat-killed and live yeasts trigger similar protective
immunity, reducing the risks associated with the injection of live yeasts in
immunocompromised individuals (Ardiani et al., 2010).
A set of “non-conventional”, biotechnologically relevant yeast genera has been
utilized in the past decades as alternative expression host to S. cerevisiae. Yeast species
such as K. lactis, P. pastoris, and Sz. pombe have proven to be efficient cell factories
and have offered some advantages over baker’s yeast, for instance with respect to
protein glycosylation. Hyperglycosylation and addition of allergenic α-1,3-linked
mannose residues to N-glycans have been repeatedly reported in S. cerevisiae (Porro et
al., 2005; Varki et al., 2009). This drawback, together with other limitations, such as
plasmid instability, can be overcome in the majority of cases with the use of the
previously mentioned alternative yeasts.
Discussion
164
Yeast has been shown to be taken up by phagocytic cells through recognition of
PAMPs, such as mannan and β-glucan, by pattern recognition receptors, such as Dectin-
1 and the mannose receptor (Netea et al, 2006; Brown, 2011; Romani, 2011). After
receptor-mediated phagocytosis, yeasts are killed and processed for antigen presentation
(Gildea et al., 2001; Newman and Holly, 2001; Syme et al., 2002; Heintel et al., 2003).
Besides, yeasts cause dendritic cells to undergo maturation (Buentke et al., 2001;
Stubbs et al., 2001). For all these reasons, yeasts are appropriate vectors for delivering
vaccine antigens.
The aim of this work was to compare four yeast strains – S. cerevisiae, Sz.
pombe, K. lactis, and P. pastoris – as antigen delivery vector for activating T
lymphocytes, as well as the influence of the subcellular localization of the recombinant
protein on this activation. For this purpose, the interaction of different yeast strains with
phagocytes was analyzed, as well as yeast-induced DC maturation. Subsequently, the
genes coding for the model antigen Ovalbumin or the clinically relevant HCMV protein
pp65 were cloned in expression plasmids specific for each yeast species and
recombinantly expressed. In the case of full-length pp65, only intracellular expression
was achieved (except for K. lactis), whereas Ova could be secreted, intracellularly
expressed (Ovacyt), or cell-wall anchored (Ovacyt/Sed1p). This latter variant was only
observed in S. cerevisiae and P. pastoris. Pp65-harboring yeasts, as well as S. cerevisiae
assembling chimeric pp65 VLP, were analyzed in an ex vivo whole blood assay for their
ability to stimulate pp65-specific CD4+ and CD8+ T lymphocytes from HCMV-
seropositive donors. Yeasts carrying the plasmid-encoded Ova variants were analyzed
in vitro by means of antigen-presentation assays using Ova-specific T lymphocytes.
Finally, a preliminary in vivo experiment was performed in order to confirm the
feasibility of the system.
1. Yeasts induce DC maturation and cytokine secretion
In order to efficiently stimulate T cells, DCs have to be in a mature state. Mature DCs in
lymphoid tissues are the most powerful stimulators of naïve T cells. Maturation implies
both functional and phenotypic changes. After antigen uptake and exposure to
inflammatory stimuli, immature DCs in peripheral tissues are induced to migrate into
the regional lymph nodes where, as mature cells, they express surface molecules that
further activate T cells (Janeway et al., 2001; Lechmann et al., 2002).
Discussion
165
DC maturation and activation can be elicited by diverse stimuli, such as
microbial components, cytokines and costimulatory molecules. Maturation is
accompanied by increased expression of adhesion, costimulatory and MHC molecules,
altered expression of chemokine receptors (such as CCR7), production of some specific
cytokines, such as IL-lβ and IL-12, and decreased capability of antigen uptake. In the
lymph nodes, mature DCs present antigens to naïve T cells and activate these
lymphocytes, thus connecting innate and adaptive immunity (Verhasselt et al., 1997;
Akira et al., 2001; Abbas et al., 2007).
DCs are able to ingest a wide variety of antigens and efficiently process them in
context of MHC class I and II molecules for presentation to T cells. Additionally, DCs
express a set of costimulatory molecules that stimulate naïve T cells, and dictate the
differentiation of naive lymphocytes into distinct classes of effectors, controlling the
quality of the T cell response. These antigen-specific, adaptive responses play a critical
role in combating infections and tumors (Mellman et al., 2001; Heath and Carbone,
2001). DCs can also efficiently process and present internalized, exogenous antigens via
MHC class I, in a process known as “cross-presentation”. Due to this remarkable
ability, many efforts have been made in the vaccination field to target and activate DCs,
thus providing the potential to generate both CD4+ and CD8+ immune responses.
In this work, it could be shown that incubation of monocyte-derived human DCs
with different yeast genera resulted in increased expression of the DC surface markers
CD83, CD80, CD86, CD54, CD58, CD40, MHC classes I and II, and led to secretion
of GM-CSF, IFN-α, IFN-β, IFN-γ, IL-1α2, IL-1β, IL-6, IL-8, IL-10, IL-12p70, IL-15,
IL-23, IL-27, and TNF-α. These observations indicate that all yeasts examined are able
to induce DC maturation and activation. Importantly, these data demonstrate that the
yeast vehicle per se is able to augment all three signals required for T cell activation,
since increased expression of MHC molecules (involved in signal 1), costimulatory
molecules (which provide signal 2) and cytokines (which deliver signal 3) were
observed.
With respect to DC maturation, upregulation of the expression of CD83, MHC
class I, MHC class II, CD80, CD86, CD40, CD54, and CD58 was observed after
incubation of DCs with all yeast genera and the HCMV lysate, as well LPS, which was
used as positive control since its effects on DC maturation have been repeatedly
demonstrated (Bernstein et al., 2008; Huang et al., 2009). However, expression of
CCR7 after contact with yeasts or HCMV lysate, as well as with the classical stimulator
Discussion
166
LPS, did not significantly increase, in contrast to all other surface markers analyzed. A
possible explanation for this finding might be the presence of IFN-β and IFN-γ (which
were released into the culture medium by DCs), as they have been shown to inhibit the
expression of this homing receptor (Yen et al., 2010).
LPS, a component of Gram-negative bacterial outer membranes, is detected by
TLR4 (Pålsson-McDermott and O'Neill, 2004). Maturation and cytokine production by
DCs in response to LPS has been described. For instance, high-level secretion of IL-6,
IL-8, IL-12 and TNF-α, and upregulation of MHC classes I and II, CD40, CD80, CD86,
CD54 and CD58 have been shown (Sallusto et al., 1995; Verhasselt et al., 1997). In the
present work, LPS induced higher expression levels of all surface markers and eight out
of fourteen cytokines analyzed compared to yeast genera and the viral stimulus.
Nevertheless, it has to be considered that yeasts and LPS, as well as viruses, stimulate
and mature DCs through different mechanisms, i.e. different pathways are activated by
distinct stimuli, leading to modulation of a particular set of genes (Huang et al., 2001).
With respect to immune response against viruses, DCs generally become
activated after antigen uptake and synthesize a number of cytokines, such as IFN-α, IL-
12 and IL-15 (Lambotin et al., 2010). However, viral infections can either stimulate or
repress the maturation and functional activation of DCs (Moutaftsi et al., 2002).
Responses to HCMV seem to depend on the DC subset. For example, in one study,
HCMV did not lead to maturation of monocyte-derived DCs, as the expression of MHC
class I, CD40 and CD80 diminished after HCMV infection (Moutaftsi et al., 2002). In
contrast, another DC type (blood CD11c+ DC) showed an elevated expression of MHC
molecules and CD83, as well as IL-6, IL-10 and type I IFN secretion following HCMV
exposure (Kvale et al., 2006). In the present study, upregulation of maturation markers
and cytokine secretion could be detected following incubation of monocyte-derived
DCs with the viral stimulus. However, since the stimulus used here consisted of a lysate
of HCMV-infected fibroblasts, viral protein aggregates, instead of intact viral particles,
might have contributed to the maturation and activation profile observed.
Yeast-dependent upregulation of surface molecules indicative of DC maturation
has been described for both non-pathogenic and opportunistic yeast species, such as S.
cerevisiae, C. albicans and M. furfur. Cytokine secretion by DCs in response to fungi
has been shown to be a more complex task, varying from one fungal stimulus to another
(d’Ostiani et al., 2000; Buentke et al., 2001; Remondo et al., 2009). In the present
study, upregulation of DC surface markers and cytokine secretion were, as expected,
Discussion
167
variable among yeast genera. This observation might result from the particular
composition of the cell wall of each yeast. This variability in DC responses might
explain why some yeast species have been shown to induce TH1-biased responses, such
as S. cerevisiae, whereas others, such as M. furfur, have been reported to favour the
production of TH2-type cytokines (Buentke et al., 2001; Remondo et al, 2009). Also,
murine DCs incubated with C. albicans yeasts have been shown to secrete IL-12 and
prime TH1 cells, whereas C. albicans hyphae inhibited TH1 priming and led to a TH2
response through induction of IL-4 production (d’Ostiani et al., 2000). One important
finding of the present work was that all yeast genera analyzed led to release of IFN-γ
and IL-12 by DCs, cytokines that drive TH1 differentiation. Such outcome is desirable
when considering the use of yeasts as vehicles to induce CTL responses. Nonetheless, it
is not possible to affirm whether this scenario would also occur in vivo, since the
microenvironment or cytokine milieu in the initial DC location in peripheral tissues may
affect the antigen presentation in secondary lymphoid organs and T cell differentiation
into the distinct TH phenotypes (Liu et al., 1998).
The production of many pro-inflammatory cytokines has been linked to the
NFκB signaling pathway. Recognition of β-glucans by Dectin-1 results in signaling
through Syk kinase and Raf-1 pathways, inducing activation of NFκB and subsequently
production of cytokines including IL-10, IL-1β, IL-6, IL-23, and GM-CSF (Rogers et
al., 2005; Brown, 2011). TLRs detect several mannose-containing structures and also
other components of the yeast cell wall yet to be determined. Nonetheless, the role of
each TLR in immunity against fungi still remains to be determined, due to the large
amount of contradictory literature for almost every TLR and fungus (Brown, 2011).
Stimulation of TLRs also triggers the activation of signaling pathways and leads, for
example, to the production of TNF-α, IL-8 and IL-12 (as a result from NFκB activation
via MyD88-Mal) and type I IFNs (Netea et al., 2008; Romani, 2011). Dectin-1 has been
shown to augment specific TLR-mediated signaling. As a consequence, production of
TNF-α is enhanced due to a synergistic effect between Dectin-1 and TLR2 (Gantner et
al., 2003). In contrast, these collaborative responses mediated by Dectin-1 and TLR2
lead to down-regulation of IL-12 expression in comparison to the levels obtained only
by TLR ligation (Dennehy et al., 2009).
The signaling pathway activated by MR has not been completely elucidated
since no classical signaling motifs are present in the cytoplasmic tail of this receptor
(Willment and Brown, 2007). However, MR has also been demonstrated to elicit NFκB
Discussion
168
activation and consequent cytokine production, including IL-12, IL-1β, IL-6, IL-10,
GM-CSF, and TNF (Pietrella et al., 2005; Brown, 2011).
The recognition pathway of chitin has not been intensively studied, as well as its
function in fungal infection (Netea et al., 2008). No study showing the specific role of
chitin in DC maturation caused by entire yeasts or hyphae could be found. Nevertheless,
it has been suggested that the signalling pathways involved after chitin recognition
includes NF-κB (via TLR2 and Dectin-1) for TNF production as well as Syk and MR
for IL-10 production (via Dectin-1-dependent and TLR2-dependent and -independent
pathways; Da Silva et al., 2009).
The set of cytokines expressed by human DCs is based on the condition of
activation and the cell subset (de Saint-Vis et al., 1998). Distinct DC subsets influence
the initiation of adaptive antifungal responses. TH17 and TH2 cell responses towards
fungi are initiated by inflammatory DCs, while tolerogenic DCs stimulate TH1 and
regulatory T cell responses. Prevailing TH1 cell responses are associated with protective
antifungal immunity and efficient vaccines against fungal infections. TH1 cell activation
can result from DC responses to a combination of signals provided by fungi via CLRs
and TLRs (Romani, 2011).
Some studies analyzing the immune response against isolated yeast components
have been conducted. Huang et al. (2009) showed that both particulate and soluble S.
cerevisiae-derived β-glucans led to the production of high levels of TNF-α by DCs,
while IL-12p70 levels were undetectable. Sheng et al. (2006) could demonstrate that
mannan from S. cerevisiae induced maturation of murine DCs and cytokine production
(including IL-6, IL-1β, GM-CSF and TNF-α). Production of IL-12, TNF-α and IFN-γ
by murine spleen cells in response to chitin has been demonstrated (Shibata et al.,
1997). Another investigation reported IL-10 and TNF-α secretion by murine
macrophages after treatment with chitin particles (Da Silva et al., 2009). Moreover, this
latter study showed that the effects observed depend on chitin size, since distinct
combinations of receptors (such as TLR2, Dectin-1, and MR) and, consequently,
different signaling pathways, were activated by different-sized chitin particles.
However, it is complicated to draw conclusions about the role of each cell wall
component in DC stimulation since, for a given cytokine, additive, antagonistic, and
irrelevant effects can be observed when the combination of all yeast PAMPs is
compared to the contribution of each individual PAMP (Huang et al., 2009). Moreover,
it is tempting to speculate that the extent of DC activation caused by each stimulus is
Discussion
169
strongly linked to the DC receptors involved in recognition of the referred antigen. In
this way, since the composition of the yeast cell wall greatly varies among the yeast
genera, the participation of a given receptor may also differ from one case to another.
The findings reported in this work indicate that all the yeast genera analyzed
induce DC activation responses that in vivo would most probably lead to migration to
secondary lymphoid organs and interaction with T lymphocytes for antigen
presentation. Moreover, in an in vivo situation, a large spectrum of fungal PAMPs
would be displayed in variable concentrations, leading to stimulation of several host
PRRs. In this way, combinations of diverse ligands would result in complex patterns of
inflammatory responses. The type of receptors stimulated in response to fungi and the
extent of this stimulation strongly influence the nature of the immune responses (Levitz,
2010). In sum, the results of this work support the usage of yeasts as promising delivery
system and suggest that different yeasts might lead to distinct responses. Furthermore,
although each PRR alone stimulates the production of a particular pattern of cytokines
(among other responses), the mechanisms by which all this is integrated remain to be
determined (Brown, 2011).
2. Staining of yeast cell wall components
Stimulation of T lymphocytes in response to fungi is credited to fungal cell wall
components (Heintel et al., 2003). Moreover, several studies have demonstrated the
immunomodulatory effects of mannan and β-glucan (Suzuki et al., 1989; Toda et al.,
1997). Particulate yeast β-glucan has been successfully used to stimulate robust CTL
responses for combating tumors in animal models (Li et al., 2010; Qi et al., 2011). Li et
al. (2010) demonstrated that yeast-derived, particulate whole glucan particles led to
production of IL-12 and IFN-γ in the tumor environment and elicited antitumor TH1
responses. Clinical trials combining β-glucan with antitumor therapy have also been
conducted (ClinicalTrials.gov ID: NCT005455459). Alternatively, purified glucan
particles from S. cerevisiae were used as vaccine delivery system, eliciting T cell
responses, production of IFN-γ and IL-17 and secretion of antigen-specific antibodies
(Huang et al., 2010).
Strategies exploiting yeast mannosylation of antigens for augmented
immunogenicity have been aimed (Lam et al., 2005; Luong et al., 2007). Antigen
mannosylation by yeast promoted increased antigen-specific CD4+ and CD8+ T cell-
Discussion
170
mediated immune responses (Lam et al., 2005). Alternatively, mannan coating of a
liposome preparation containing a DNA vaccine led to the activation of TH1 cells (Toda
et al., 1997).
Little has been investigated about the adjuvant effects of chitin. This component
of the yeast cell wall has not been a focus of intense research, maybe due to the fact that
it is a minor constituent of the fungal cell wall and has been, in some cases, not clearly
identified in the cell wall of some yeast species (Arellano et al., 2000). However, chitin
has been demonstrated to enhance antigen-specific T cell proliferation and to possess
adjuvant properties in TH1, TH2 and TH17 immune responses, as well as in IgE
production (Da Silva et al., 2010).
Recently, S. cerevisiae has been employed as a complex antigen vaccine to
induce cross-protection against systemic aspergillosis and coccidioidomycosis (Capilla
et al., 2009; Stevens et al., 2011; Liu et al., 2011). Subcutaneous administration of heat-
killed yeast protected mice against lethal systemic coccidioidomycosis challenge
(Capilla et al., 2009). This protection was conferred by adaptive immune responses,
which were mainly mediated by CD8+ T cells and also involved production of IFN-γ,
IL-6 and IL-17 (Liu et al., 2011).
Secretion and glycosylation of proteins, as well as the cell wall composition,
differ among yeast genera. The Golgi apparatus of S. cerevisiae diverges significantly
from those of Sz. pombe and P. pastoris, which resemble more closely the ones of
higher eukaryotes. For instance, many S. cerevisiae glycans bear terminal α-1,3-
mannose, whereas some mannose structures contain terminal α-galactose in Sz. pombe,
α-1,2-linked mannose in P. pastoris and N-acetylglucosamine in K. lactis (Glick, 1996;
Varki et al., 2009). Treatment of various fungal particles with Con A-FITC followed by
flow cytometry or microscopic analyses does not allow distinction of these diverse
structures.
Luong et al. (2007) showed that immunogenicity of an antigen recombinantly
expressed by P. pastoris was enhanced by O-linked mannosylation and decreased by N-
linked mannosylation, but the mechanisms by which this occurs are still unclear. An
interesting aspect is that N-linked glycans in Pichia have a high-mannose configuration,
whereas O-linked glycans are short (generally 2-3 mannose residues; Trimble et al.,
2004; Luong et al., 2007). This fact might explain the observation that the S. cerevisiae
BY4742 cell-wall mutants caused, in general, higher upregulation of DC surface
markers and cytokine secretion in comparison to their wild-type counterpart. Since
Discussion
171
Mnn11p is thought to function in outer chain elongation by adding α-1,6-mannose, the
Δmnn11 mutant produces proteins with shortened, truncated mannan backbones (Dean,
1999). Yeasts lacking functional OST3 gene have been described to underglycosylate
soluble and membrane bound glycoproteins (Karaoglu et al., 1995). In this way, not
only the type, but also the length of glycans seems to influence the host’s immune
responses.
Different β-glucan compositions also lead to distinct biological effects, as seen
for zymosan, which contains 12-14% β-glucan, and purified whole glucan particles,
composed of > 85% β-glucan (Li et al., 2010). Yeasts exposing more β-glucan should
lead to increased Dectin-1-driven signaling. Mannan and α-1,3-glucan prevent or
decrease β-glucan recognition via Dectin-1 (Rappleye et al., 2007; Netea et al., 2008).
Therefore, it would be expected that yeasts bearing mutations in genes that result in
reduction of mannan would promote different responses than yeasts containing, for
instance, a dense mannan layer and α-1,3-glucan, such as Sz. pombe. With respect to
chitin, it has been shown that this polymer associates with bud necks at the end of yeast
cell division and become component of bud scars (Rodrigues et al., 2008). This fact
might explain why chitin was poorly detected in fission yeast. The much higher
percentage of cells positive for chitin in S. cerevisiae cell wall mutants compared to the
parental strain might result from a compensatory mechanism to maintain cell wall
stability, as hypothesized by Uccelletti et al. (2006). They observed increased chitin
amounts in K. lactis mutants with reduced mannoprotein contents compared to wild-
type.
It has to be pointed out that the yeast cell wall is a highly dynamic structure and,
therefore, antigenically inconstant. Factors such as strain, age of cultured cells and type
of growth medium have been described to exert influence on yeast antigenicity, i.e. on
the display of epitopes on the cell suface (reviewed by Nelson et al., 1991). Thus,
fluorescence detection of mannan and glucan as performed in this work may diverge
from one experiment to another, also when attempts to keep the same experimental
conditions are made. The different patterns of cell wall staining observed here are in
accordance with literature data, which show that massive differences can be observed
when the cell walls of different fungal species and also strains within a species are
compared (Levitz et al., 2010).
To date, distinct molecules have been identified as receptors for mannose or β-
glucans on APCs, but information about how each receptor discriminates its ligands is
Discussion
172
still missing (Qi et al., 2011). Additionally, and as stated before, glycan structures vary
from one yeast strain to another and the simultaneous presence of several yeast PAMPs
as in whole yeasts may lead to different responses than those observed against each
particular PAMP separately (Huang et al., 2009). In this work, staining of yeast cell
wall components was performed in an attempt to determine if there was a causal
relation between the yeast cell wall and DC maturation or activation. The results
suggest that no direct correlation could be established between the mannan, β-1,3-
glucan and chitin contents on the surface of yeast cells and the degree of stimulation of
human DCs. This fact was not surprising by virtue of the dynamic nature of yeast cell
walls and the consequent fluctuation in glycan contents.
3. Interaction patterns between yeasts and mammalian phagocytic cells
Immune recognition of fungal particles takes part mostly at the cell wall level. While
the yeast cell wall consists of an interconnected structure of polysaccharides,
glycoproteins and some glycolipids, mainly carbohydrate structures are involved in the
interaction between yeast and mammalian host cells.
The findings reported in this study show that the interactions between human
DCs and the biotechnologically relevant yeasts S. cerevisiae, Sz. pombe, K. lactis and P.
pastoris are mediated by both mannan and glucan. Specific blocking of MR and Dectin-
1 in DCs was able to impair, to a greater or a lesser extent, host cell binding of all yeast
species tested. In general, yeast cell wall consists of an outer layer of mannosylated
proteins and an inner layer of β-glucans and chitin. However, β-glucans may be
permanently exposed at the surface in specific regions like bud and birth scars, which is
sufficient for Dectin-1 sensing (Gantner et al., 2005). Specific blockage of Dectin-1 led
to a greater reduction in yeast binding compared to MR blockage in three out of four
species tested (S. cerevisiae, Sz. pombe, and P. pastoris). Interestingly, and in
agreement with its low phylogenetic relationship to other yeast genera and its notable
difference in cell wall architecture (Russell and Nurse, 1986), uptake of Sz. pombe by
DCs was almost completely abrogated after anti-Dectin-1 treatment. The fission yeast
β-D-glucan repertoire is basically composed of β-1,6-branched β-1,3- and β-1,6-
glucans, while linear β-1,3-glucan is absent in the cell wall and exclusively found in the
primary septum (Humbel et al., 2001). However, since Dectin-1 recognizes both β-1,3-
and β-1,6-glucans (Brown and Gordon, 2001), the lack of linear β-1,3-glucan structures
Discussion
173
in Sz. pombe does obviously not confer any advantage for this microorganism in terms
of being less recognizable by Dectin-1. With respect to MR, blocking of this receptor
does not mean that yeast mannan is no longer recognized, since alternative mannose
receptors are present on the surface of DCs, such as DC-SIGN (Cambi et al., 2003).
As observed for human DCs, the kinetic pattern of Sz. pombe internalization was
different from the other three yeast species analyzed. S. cerevisiae, K. lactis and P.
pastoris are round-shaped yeasts, in contrast to the rod-like shape of fission yeast. It has
been demonstrated that phagocytosis depends on both particle size and shape, and
particles requiring only gradual actin ring expansion are more efficiently phagocytosed
(Champion and Mitragotri, 2006). Since Sz. pombe was taken up more slowly, possibly
the morphology of fission yeast does not favour internalization in such a rapid manner
as for the other three yeast species analyzed.
Since IC-21 mouse macrophages do not express the mannose receptor, only the
effect of Dectin-1 on yeast uptake was analyzed in this work. Lack of MR in some
murine macrophage cell lines, such as J774 and RAW264.7, as well as resident
peritoneal mouse macrophages has been described (Taylor et al., 2002; Martinez-
Pomares et al., 2003; Lin et al., 2010). Incubation of IC-21 macrophages with anti-
Dectin-1 diminished yeast uptake, indicating that recognition of yeasts by IC-21 cells
involves Dectin-1. This interaction was specific, since addition of an isotype control
antibody to the cells led to similar results than those for untreated cells. The differences
among yeast genera observed after Dectin-1 blocking might reflect the amount of
exposed β-glucan on cell walls of each genus.
Uptake of S. cerevisiae and Sz. pombe in whole blood has been analyzed
(Breinig et al., 2003), with no significant differences among both yeasts. However,
yeasts are avidly internalized in whole blood by a great sort of phagocytic cells,
including neutrophils and monocytes, so that the different systems cannot be directly
compared.
An important characteristic of the mannose receptor is that it recycles to the cell
surface after having released its ligand. Thus, ligands can be delivered in much larger
amounts than the number of receptors, which provides an unlimited antigen
accumulation capacity (Stahl et al., 1980; Sallusto et al., 1995). Antigens internalized
by MR might, after receptor dissociation, be trafficked to lysosomes rich in MHC class
II molecules (Tan et al., 1997; Keler et al., 2004). Moreover, it has been demonstrated
that mannosylated peptides are more efficiently presented to antigen-specific T cells
Discussion
174
than non-mannosylated proteins (Engering et al., 1997; Tan et al., 1997). In this way,
MR targeting has become an attractive approach to increase vaccine efficacy (Keler et
al., 2004).
Dectin-1-mediated uptake has also been demonstrated to enhance antigen
presentation via MHC class II and increase antigen-specific T cell activation, as well as
cross-presentation (Xie et al., 2010; Weck et al., 2008). Other C-type lectin receptors on
DCs, such as DC-SIGN, have also been targeted in order to improve antigen
presentation (Adams et al., 2008) and consequently augment vaccine efficiency.
Therefore, and according to the findings of this work, yeasts naturally target
CLRs on phagocytes, including macrophages and DCs, so that vaccination approaches
using whole yeasts are of significant potential.
4. Expression and delivery of different Ova variants by yeasts
One line of investigation in this work was to study the efficiency of different yeast
genera as protein delivery vector, and to analyze the influence of subcellular antigen
(Ova) localization on its processing and presentation in context of MHC class I to
specific CD8+ T lymphocytes. An interesting question was to evaluate the antigen
presentation efficiency of SIINFEKL epitope when Ova was located in different yeast
compartments. In order to get basic information which system would be more
advantageous in terms of vaccination approaches, recombinant S. cerevisiae, P.
pastoris, Sz. pombe, and K. lactis expressing either full-length Ova, which is destined
for secretion, and a truncated version of this protein, Ovacyt, which lacks the internal
secretion signal and remains intracellular, were used. Given that yeast cell-surface
display is an attractive tool in vaccine approaches, as surface-anchored epitopes are
stably maintained due to the rigid, thick cell wall architecture (Kim et al., 2010), a cell-
wall anchoring system, in which Ovacyt is exposed on the yeast cell surface of S.
cerevisiae and P. pastoris as Sed1p fusions was also tested. The presence of Ovacyt in
the cell wall of K. lactis and Sz. pombe could not be detected (data not shown). No data
was found in the literature showing the functionality of Sed1p from S. cerevisiae in K.
lactis, and this type of anchoring system is likely to be inefficient in Sz. pombe due to its
particular cell wall composition. K. lactis was transformed with another Sed1p-
containing fusion protein, but the presence of the recombinant protein on cell surface
was again undetectable (data not shown), indicating that the foreign protein was not the
Discussion
175
cause of the anchoring failure. Cell-surface display of a recombinant protein (α-
galactosidase) as α-agglutinin fusion has been described for K. lactis (Schreuder et al.,
1996b), but to date no other GPI-anchoring system has been reported for this species.
Expression levels of cytosolic, secreted, and cell wall-anchored Ova varied
drastically among the yeast genera tested in the present study. However, it is difficult to
directly compare productivity between different yeast genera, since each expression
system has its particularities and variations in plasmid copy number and stability, as
well as codon bias index, influence recombinant protein levels (Buckholz and Gleeson,
1991).
In relation to the surface-display of Ova in S. cerevisiae and P. pastoris, it was
observed that, although cell-surface expression could be detected by
immunofluorescence and flow cytometric analyses, it was heterogeneously distributed
over the cell population. This observation has been repeatedly reported for S. cerevisiae
(Schreuder et al., 1993; Schreuder et al., 1996a; Breinig and Schmitt, 2002; Feldhaus et
al., 2003, Kim et al., 2010). In one study, it was hypothesized that this staining pattern
could be attributed to variations in plasmid copy number and expression levels among
individual cells, or even to differences in cell physiology (Kim et al., 2010). Another
reason for the observed uneven distribution of cell surface expressed proteins could be
the polarized growth and varying morphology in yeast, so that mother cells do not
express the fusion on their cell walls (Feldhaus et al., 2003).
Fusion of Ovacyt to Gag led to the formation of abundant VLP which were
homogeneous in size and shape, as confirmed by electron microscopy. Unfortunately, S.
cerevisiae expressing Gag/Ovacyt VLP could not be analyzed in the T-cell activation
assay so far. However, this very promising approach can be useful in future
applications. Crisci et al. (2009) reported that VLP from rabbit hemorrhagic disease
virus delivering the Ova SIINFEKL epitope led to the induction of specific cytotoxic
and memory T cells responses. Moreover, mice immunized with these chimeric VLP
could resolve infection caused by a recombinant vaccinia virus expressing Ova (Crisci
et al. 2009). These findings reaffirm the potential of VLP in vaccination approaches.
Activation of Ova-specific CD8+ T lymphocytes, determined by the amount of
released IFN-γ in supernatants, was also very variable among the yeast genera used. The
data from this work suggest that the most efficient antigen loading strategy by S.
cerevisiae and P. pastoris is cytosolic and cell surface bound antigen delivery,
respectively. In contrast, secreted Ova caused only a weak activation of lymphocytes in
Discussion
176
S. cerevisiae and hardly any in P. pastoris. This latter finding was unanticipated,
because in vitro activation of antigen-specific T cells after delivery of proteins secreted
by gram-positive bacteria has been demonstrated (Ikonomidis et al., 1994; Pan et al.,
1995; Soussi et al., 2000; Loeffler et al., 2006). Furthermore, protein secretion most
likely still occurs in macrophage phagolysosomes (as shown by western blotting after
cultivating yeasts for 8 h in acetate-containing medium), indicating that the lack of
lymphocyte activation observed in this case was not related to the absence of Ova in
macrophages. A significant amount of protein, however, might be subsequently
degraded in phagolysosomes and thus become unavailable for subsequent cytoplasmatic
antigen processing steps. In contrast, antigen bound to the cell wall or antigen residing
in the cytoplasm of the yeast cell might be more efficiently protected from degradation
and thus be more efficiently cross-presented.
Cell-surface displayed Ova caused lymphocyte activation only when P. pastoris
cells were used in the assay, and it proved to be better than cytosolic Ova at the highest
MOI tested in this species. This observation confirms data from Howland and Wittrup
(2008), who compared the cross-presentation of an antigen derived from the human
cytomegalovirus phosphoprotein pp65 displayed on the cell-surface (as Aga2-fusion) or
intracellularly expressed in S. cerevisiae. They concluded that antigen exposed on the
yeast external surface, more accessible to proteases, is more efficiently cross-presented
than antigen trapped inside the yeast cell wall, after observing that cross-presentation of
the epitope expressed in the yeast cytoplasm by DCs was half of that from surface-
anchored antigen, although the expression level of the recombinant peptide was much
higher in the cytosol than on the cell surface. Thus, this seems also true for Pichia
pastoris. However, the very weak T cell activation after cell-surface expression in S.
cerevisiae, in particular compared to the intracellular derivative, is somehow surprising
and is not consistent with the hypothesis of Howland and Wittrup. In this respect, both
the slightly higher antigen amount in the cell wall of Pichia and the higher number of
Ova-expressing cells within the population in comparison to S. cerevisiae could play a
role. Alternatively, this observation may be explained by differences in the type of cell
wall protein used for cell wall targeting. Whereas the Ovacyt/Sed1p fusion used in our
study is covalently linked to and embedded in the cell wall, Howland and Wittrup
anchored their antigen via disulfide bonds to the yeast cell surface allowing the antigen
to be released under reducing conditions.
Discussion
177
The differences in T cell activation seen in this study can be attributed to many
distinct factors. For example, it might be related to the levels of recombinant protein
expressed by each yeast clone. However, it is not clear whether higher levels of antigen
in a specific compartment necessarily lead to an increase in antigen-specific
lymphocytic activation. For example, S. cerevisiae expressed 1.4 fold more Ovacyt than
P. pastoris, but the level of IFN-γ in the culture supernatant after lymphocytic activation
was about 12.5 fold greater at MOI 7 in the case of the budding yeast, which suggests
that other factors, like the particular composition of the yeast cell wall, might also be
involved. MHC I-presentation of a certain CTL epitope in infected cells is affected,
among other factors, by the degradation rate of the antigen in the cytoplasm and the
efficiency with which the peptide is processed from the antigen by cellular proteases
(Sijts et al., 1996). Ovalbumin contains a single disulphide bridge between Cys73 and
Cys 120 (Nisbet et al., 1981), whose lack results in a less stable and more fluctuating
protein conformation in comparison to intact Ova (Ishimaru et al., 2011). Given that in
the Ovacyt coding sequence the fragment encoding amino acids 20-145 is missing,
degradation of Ovacyt might be somehow easier, contributing to better antigen
processing and presentation, which is in agreement with the results observed so far. This
diminished stability of Ovacyt could also explain the lower levels quantified for this
protein in comparison to secreted Ova after the same expression period. Lower Ovacyt
levels in comparison to secreted Ova have been reported as being the result of its greater
proteolysis and consequently shorter half-life (Shen and Rock, 2004; Rowe et al.,
2006).
A multitude of studies showing the use of whole yeast as vaccine vehicles
expressing recombinant proteins intracellularly (Stubbs et al., 2001; Lu et al., 2004;
Barron et al., 2006; Haller et al., 2007; Riemann et al., 2007; Wansley et al., 2008;
Remondo et al., 2009; Tanaka et al., 2011) or on the cell surface (Schreuder et al.,
1996a; Wadle et al., 2006; Zhu et al., 2006; Kim et al., 2010) have been reported.
Nevertheless, almost all of them employ the conventional yeast S. cerevisiae as carrier
system. In this study, all species tested proved to be appropriate for delivering
intracellularly expressed Ova, although the efficiency of antigen presentation varied.
Delivery of cell surface-anchored Ova was more effective in P. pastoris than in S.
cerevisiae, and none of these yeasts showed to be efficient at delivering secreted Ova.
Bacterial delivery has also been used in immunologic approaches. The
microorganisms used for such strategies, including Listeria, Salmonella and Yersinia,
Discussion
178
are generally attenuated or contain a suicide gene that promotes bacterial destruction
(Husseiny and Hensel, 2005; Wiedig et al., 2005; Loeffler et al., 2006). However,
application of bacteria into a mammal usually implies unpredictable side effects that can
only be seriously examined in large clinical trials (Pálffy et al., 2006). The use of non-
pathogenic yeasts is therefore safer, and the benefits of using eukaryotic microbes,
which can express a recombinant polypeptide in a manner that closely resembles the
native protein, should also be taken into consideration.
Until now there is no study comparing the efficiencies of different yeast genera
routinely used in biotechnology as protein delivery vectors on the activation of antigen-
specific lymphocytes. Data from this work show that, besides S. cerevisiae, three
additional yeast genera with biotechnological importance are able to deliver a protein
antigen to mammalian antigen-presenting cells and to subsequently activate specific T
cells, providing usefull basic knowledge for the design of superior yeast-based
vaccination vectors. However, since peptide sequence per se has been described to exert
influence on the efficiency of antigen presentation (Sijts et al., 1996), the most
convenient approach for a specific therapeutic purpose has to be evaluated individually.
5. Expression of pp65 by different yeast strains and activation of pp65-specific
memory T lymphocytes in HCMV-seropositive donors
Some advantages in choosing HCMV as model virus are that host specificity can be
simply verified, validating the experiment (Suni et al., 1998) and that pp65-specific T
cells are highly prevalent among HCMV-seropositive induviduals (Kern et al., 2002).
The decision to use the entire pp65 protein instead of single CD4+ and CD8+ epitopes
was based on the fact that some HCMV-seropositive individuals do not respond to some
dominant epitopes, and response to subdominant or unpredicted epitopes might also
occur (Solache et al., 1999, Kondo et al., 2004). Furthermore, immunodominant
epitopes from viral proteins frequently undergo mutations in vivo, reducing their
efficacy as therapeutic target (Bertoletti et al., 1994; Solache et al., 1999). Therefore,
use of an entire polypeptide may provide a wide spectrum of epitopes deriving from the
referred protein, increasing the odds that epitopes relevant for the MHC repertoire from
a certain individual will be presented (Bui et al., 2010). The HCMV pp65 tegument
protein is a good vaccine candidate, since it resembles an immunodominant antigen for
T cells, and 70-90% of all CTL which are able to recognize HCMV-infected cells are
Discussion
179
specific for pp65 (McLaughlin-Taylor et al., 1994; Beninga et al., 1995; Wills et al.,
1996; Kern et al., 2002).
Thus, full-length pp65 was used for recombinant expression in different yeast
genera, which were subsequently tested for their ability to deliver pp65 in an ex vivo
assay. Recombinant pp65 could be detected in cell lysates of Sz. pombe, P. pastoris and
S. cerevisiae, but not in K. lactis. A number of K. lactis transformants grown in
selective medium and positive for the presence of integrated pp65 was tested under
varying inducing conditions, however with no success. Some protease-deficient strains
of K. lactis were also analyzed (YCT 389, YCT390, YCT569, YCT598, New England
Biolabs), but the presence of pp65 in cell lysates could not be detected, indicating that
the protein was either expressed under the detection level, or rapidly degraded or not
expressed at all (data not shown).
The fact that pp65 could not be secreted into the culture medium by Sz. pombe,
P. pastoris and S. cerevisiae might suggest that this protein is somehow not properly
processed in the secretory pathway. Cytoplasmic retention of recombinant proteins that
were engineered to be secreted has been reported (Emr et al., 1984; Chaudhuri and
Stephan, 1995). As a consequence to this problem, cell wall-anchoring of whole pp65
also turned out inviable. Recombinant full-length pp65 expression in yeast has only
been demonstrated in Sz. pombe (Breinig et al., 2003). In contrast, successful expression
of pp65 epitopes in the cytoplasm or even on the cell surface S. cerevisiae as Aga2-
fusion has recently been reported (Powilleit et al., 2007; Howland and Wittrup, 2008).
Whole recombinant yeasts expressing the HCMV pp65 matrix protein in the
cytosol were assessed for protein delivery efficiency in a whole blood assay. It has been
shown that full-length pp65 expressed in fission yeast or a fragment containing the
major pp65 epitopes alone or in combination with Gag expressed in S. cerevisiae could
elicit specific cellular immune responses, with higher frequencies of CD8+ than CD4+ T
cells (Breinig et al., 2003; Powilleit et al., 2007).
It has also been reported that yeasts are rapidly internalized by blood phagocytes
and efficiently processed for presentation to CD4+ and CD8+ T lymphocytes (Breinig et
al., 2003; Heintel et al., 2003). In relation to pp65, antigen-specific memory CD4+ T
cells were stimulated by untreated and heat-treated pp65-expressing cells of S.
cerevisiae, Sz. pombe, and P. pastoris. Significant IFN-γ expression by pp65-specific
CD8+ T lymphocytes was detected after incubation with untreated and heat-treated Sz.
Discussion
180
pombe and heat-treated P. pastoris, whereas in S. cerevisiae neither untreated nor heat-
treated cells caused any significant activation.
Heat treatment was particular advantageous for P. pastoris, in terms of both
CD4+ and CD8+ T cell responses. In the case of S. cerevisiae, pp65-specific CD4+
responses were more pronounced after heat treatment, whereas CD8+ responses were
lower for heat-treated yeasts, but the relation pp65/empty plasmid was higher in
comparison to untreated cells of S. cerevisiae. For Sz. pombe, lower frequencies of
activated lymphocytes were observed when cells expressing pp65were heat-treated,
however the ratio pp65/empty vector was higher after heat treatment. This means that
lower responses to the yeast vehicle were detected after heat treatment. Since T cell
responses to yeasts is uniquely based on the recognition of epitopes derived from cell
wall proteins (Heintel et al., 2003), mannosyl rather than glucosyl residues should play
the most important role. Upon heat treatment, the β-glucan layer turns out to be densely
and homogeneously exposed on yeast cell surface, possibly masking mannoproteins
from being promptly processed and presented by APCs after yeast uptake. T cell
activation caused by C. albicans supports this hypothesis. Heintel et al. (2003) showed
that T cell responses to the unicellular form of C. albicans were poor, in contrast to the
robust responses directed against the hyphal form. Since β-glucan is not functionally
accessible on Candida filaments (Gantner et al., 2005), it is tempting to speculate that
mannoproteins dictate the activation of memory T cells. For this reason, yeasts alone
subjected to incubation at 65°C caused a lesser extent of lymphocyte activation than
untreated yeasts.
When S. cerevisiae-delivered Gag/pp65 was analyzed, significant activation of
both CD4+ and CD8+ T lymphocytes was observed, and IFN-γ levels were much higher
than those caused by pp65 expression in the same yeast strain, although the amount of
delivered protein was practically the same. This observation is in agreement with other
reports, in that particulate antigens are highly efficient in inducing robust immune
responses (Powilleit et al., 2007; Crisci et al., 2009). This fact can be attributed to the
repetitive occurrence of epitopes and the particulate structure of VLP, which favour
uptake by phagocytic cells (Fifis et al., 2004; Grgacic and Anderson, 2006). It has been
shown that internalization of yeast-derived VLP by DCs occurs via macropinocytosis
and receptor-mediated endocytosis involving mannose-recognizing receptors, though
not the mannose receptor (Tsunetsugu-Yokota et al., 2003).
Discussion
181
Although electron microscopy of pp65 N-terminally fused to Gag revealed the
presence of only a few particles, which were heterogeneous in size and shape (maybe
due to the large size of pp65), the fusion protein nevertheless was more efficient in
stimulating pp65-specific memory T lymphocytes than pp65 alone. Heat treatment was
slightly beneficial for CD4+ responses, and exactly as observed for S. cerevisiae
carrying unfused pp65, CD8+ responses were a little lower for the heat-treated yeasts,
but the relation Gagpp65/Gag was higher in the heat-treated yeasts. VLP have
repeatedly proven their potential as vector for vaccination and demonstrated to be
powerful CTL inducers compared to adjuvants and/or live recombinant vectors (Allsopp
et al., 1996; Crisci et al., 2009). For this reason, strategies combining whole yeasts and
VLP as antigen carrier should be an prospective attempt.
Responses to the HCMV lysate were notedly higher than any condition using
yeast. However, this lysate contains all HCMV proteins and, consequently, a large
variety of CD4+ and CD8+ T cell epitopes available for antigen presentation.
Frequencies of specifically activated memory T lymphocytes were higher for
CD4+ cells than for CD8+ cells in all samples analyzed, which is consistent with
previous observations (Suni et al., 1998; Sester et al., 2001). In the case of HCMV, the
frequency of CD8+ T cells fluctuates significantly, whereas the frequency of the CD4+ T
cell population is more stable. In addition, CD4+ T cells are considered more important
than CD8+ T cells in terms of disease prediction (Sester et al., 2001).
The lower frequencies of CD8+ T lymphocytes observed in this work may also
result from the presence of Brefeldin A, which has been described to inhibit MHC class
I-restricted presentation of some protein antigens (Yewdell et al., 1989; Brossart and
Bevan, 1997). Although contradictory effects have been observed, the pathway through
which antigens are presented in the context of MHC class I seems to play a critical role
in Brefeldin A sensitivity. Antigens processed by the phagosome-to-cytosol pathway are
loaded onto newly synthesized class I MHC molecules prior to their egress from the
trans-Golgi complex. Brefeldin A hinders vesicular exit from the ER and Golgi,
blocking the presentation of peptide-MHC I complexes (Yewdell et al., 1989;
Kovacsovics-Bankowski and Rock, 1995; Brossart and Bevan, 1997). The vacuolar
pathway seems to be Brefeldin A-insensitive (Harding and Song, 1994; Pfeifer et al.,
1993), since peptides associate with recycling class I molecules in phagocytic vacuoles
or after “regurgitation” and recapture of processed antigens (Harding and Song, 1994;
Norbury et al., 1995). Tabi et al. (2001) showed that DCs cocultured with HCMV-
Discussion
182
infected fibroblasts led to CD8+ T cell responses to pp65, but CD8+ T cell stimulation
was inhibited if DCs were pretreated with Brefeldin A, indicating a phagosome-to-
cytosol pathway. However, since the characteristics of the antigen might influence the
pathway involved (Norbury et al., 1995), it is not possible to state whether Brefeldin A
affected to any extent the results observed in the present work.
Low-level responses towards the yeast vehicle alone were sometimes observed,
with varying extents among the donors and the yeast genera, but in all cases frequencies
of activated lymphocytes were below 0.4%. In a study performed by Heintel et al.
(2003), frequencies of yeast-specific memory T cells were determined using whole
blood from five individuals. Activation of T lymphocytes was verified for most yeast
genera, with frequencies up to 0.5% for CD4+ T cells and up to 6.4% for CD8+ T cells,
depending on both the donor and the yeast species (Heintel et al., 2003). Despite some
detectable response to the yeast carrier, frequencies of activated CD4+ and CD8+ cells
were always higher for pp65-containing yeasts in the HCMV-seropositive donors,
indicating host specificity.
Surprisingly, and in contrast to reports of Breinig et al. (2003), ethanol-
precipitated total yeast extracts from cells expressing pp65, including Sz. pombe, were
not able to sufficiently activate pp65-specific memory T lymphocytes. However, since
pp65-specific memory T cell activation shows great variability among individuals (Kern
et al., 2002; Breinig et al., 2003; Powilleit et al., 2007), and giving that the donors
analyzed in that study were different from those examined in this work, a direct
comparison is not possible.
In this work, delivery of pp65 by yeasts was also analyzed by means of an
autologous system, i.e., a method in which DCs from HCMV-seropositive individuals
are isolated, incubated for 48 h with yeasts and then given autologous lymphocytes.
However, despite many attempts, only poor CD4+ and CD8+ T cell activation could be
observed, and this method proved to be less effective than the whole blood assay. Suni
et al. (1998) compared frequencies of antigen-specific activated T cells in whole blood
samples and isolated PBMC in autologous plasma. Since whole blood preparations
resulted in higher responses, they hypothesized that, within the 6 h incubation time,
whole blood cultures form an upper band of PBMC over a layer of red cells, probably
promoting a more physiological millieu to respond to stimuli. This sedimentation
pattern might also provide improved cell-cell interactions within the PBMC population,
not influenced by the lower layer of red blood cells (Suni et al., 1998).
Discussion
183
Significant activation of pp65-specific memory T lymphocytes after incubation
with pp65-expressing yeasts, determined by means of both whole blood assay and
autologous system, could not be detected for some HCMV-seropositive individuals.
One possible explanation for this fact is that some HCMV-seropositive persons lack
pp65-specific memory lymphocytes, as it has been reported by others (McLaughlin-
Taylor et al., 1994; Kern et al., 2002). According to Kern et al. (2002), this lack of
pp65-specific T lymphocytes in peripheral blood alone does not mean absence of
protection from HCMV disease. In that study, they analyzed 40 healthy HCMV-
exposed donors and 12.5% of them had no T cell response to peptides derived from
pp65. These individuals were not sick, and HCMV reactivation presumably occured as
often as in other healthy individuals (Kern et al., 2002).
In sum, all three yeast species (S. cerevisiae, Sz. pombe, and P. pastoris)
carrying pp65 were able to deliver the antigen, and the activation of pp65-specific
memory lymphocytes observed indicates that recombinant pp65 probably mimics the
native antigen in terms of recognition by the host.
6. Effect of heat treatment of yeast on β-glucan exposure and ROS production in
whole blood
“ROS” include several oxygen species, such as singlet oxygen, hydroxyl radical,
superoxide and hydrogen peroxide. In most cell types, ROS influence signaling
pathways in different manners (Fialkow et al., 2007). Production of ROS (respiratory
burst) by phagocytes, a process mediated through the NADPH oxidase, is considered a
major mechanism of defense against fungi. A number of PRRs can elicit the respiratory
burst, such as Dectin-1, TLRs and Fcγ receptors (Brown, 2011).
According to previous studies, heat-treated C. albicans and S. cerevisiae expose
more β-glucan at the cell surface than untreated cells (Fradin et al., 1996; Gantner et al.,
2005). Gantner et al. (2005) observed that most β-glucan in the yeast cell wall is
inaccessible to Dectin-1 and that β-glucan is exposed only in certain subdomains such
as birth and bud scars. Upon heat treatment, matricial cell wall components are released
(Fradin et al., 1996), bringing β-glucan uniformly to the outer layer and consequently
increasing the chance of phagocyte sensing through β-glucan receptors.
The effect of heat treatment on β-glucan exposure in S. cerevisiae, K. lactis, Sz.
pombe, and P. pastoris was analyzed by flow cytometry. All three budding yeasts
Discussion
184
examined showed more than a two-fold increase in mean fluorescence after incubation
at 65°C, indicating that heat treatment indeed enhances the amount of cell-wall exposed
β-glucan. In contrast, this could not be observed in fission yeast, which showed even a
slight reduction in mean fluorescence intensity. This observation was surprising,
because although linear β-1,3-glucan is not found on the cell wall, it can be found in the
primary septum of Sz. pombe (Humbel et al., 2001), so that at least a discrete increase in
fluorescence would have been expected. However, the architecture of the cell wall in
fission yeast might, for some reason, not allow significant β-glucan exposure upon heat
treatment.
Untreated and heat-treated yeasts were then incubated with whole blood for
determination of ROS production. Since recognition of β-glucan by Dectin-1 leads to
the generation of ROS (Gantner et al., 2003), it was reasonable to suppose that yeasts
subjected to heat would be more effective in eliciting ROS production due to augmented
ligand availability. In fact, this was true for S. cerevisiae, K. lactis and P. pastoris.
Noteworthy, the amount of ROS was lower when blood phagocytes were incubated with
heat-treated Sz. pombe cells in comparison to untreated cells. Again, this result was
unexpected, since the cell surface of this yeast contains β-1,6-branched β-1,3-glucan,
which is also a target for Dectin-1 (Humbel et al., 2001; Adams et al., 2008; this work),
so that at least a similar kinetic pattern of ROS production would have been expected
for untreated and heat-treated fission yeast cells. These observations indicate that heat
treatment may alter the distribution of cell wall components in Sz. pombe in a different
fashion than in budding yeasts.
A series of pre-clinical and clinical studies has resorted to the use of heat-
inactivated yeasts as protein delivery vectors, thus reducing the possible risks involved
in using live cells, particularly in immunocompromised individuals (Lu et al., 2004;
Franzusoff et al., 2005; Ardiani et al., 2010). Experiments employing either untreated or
heat-treated yeasts have proven to be effective in terms of protective immunity (Stubbs
et al., 2001; Franzusoff et al., 2005). Results from the whole blood assays performed in
this work showed that heat treatment was beneficial in some cases, such as when P.
pastoris was used as vector, but not always, as when Sz. pombe cells delivered the
antigen. This fact indicates that the choice for such treatment should take into
consideration the cell wall features of the yeast species being used in the specific
approach. Nonetheless, a higher number of assays would have to be performed in order
to confirm this hypothesis.
Discussion
185
7. Immunization of OT-I transgenic mice with whole recombinant yeasts
Initiation of immune responses after vaccination depends on several factors, such as
antigen dose, form of administration, antigen access to processing pathways, co-
stimulation and cytokine milieu at the moment of antigen capture and presentation
(Rush et al., 2002).
OT-I mice constitute an important model system for in vivo approaches.
Analyses with mice bearing TCR-transgenic T cells eliminate the problem of low
frequency of antigen-specific T cells and allow the isolation and quantitation of T cells
as well as the determination of in vitro and in vivo antigen-specific responses
(Miyagawa et al., 2010). In an attempt to examine CD8+ T cell responses after
administration of yeast expressing Ovacyt to mice, an immunization protocol was
established based on literature data, especially on Riemann et al. (2007). However, and
in contrast to other works, yeasts were not heat-treated or frozen, but lyophilized to
facilitate shipment. Since the majority of the studies published so far describing
immunization approaches using yeast employ S. cerevisiae W303, this strain was also
used for this experiment. Protocoll optimization and utilization of other yeast genera, as
well as of a higher number of mice could no longer be performed in this work.
Splenic CD8+ T lymphoctes from mice vaccinated with S. cerevisiae carrying
Ovacyt restimulated with OVA257-264 peptide were able to produce IFN-γ. Yeasts alone
also stimulated OVA-specific CD8+ T lymphocytes, although to a lesser extent, still the
difference between both conditions was not significant. Spleen CD8+ T lymphoctes
restimulated with PMA/ionomycin showed the highest levels of IFN-γ, but the
difference among the groups was even more discrete. Since PMA and ionomycin are
potent inducers of cytokine production (Picker et al., 1995), lymphocytes were strongly
and non-specifically activated, so that eventual subtle differences among experimental
groups could have been masked. Inguinal lymph node cells were stimulated only with
PMA/ionomycin due to the low number of recovered cells, and activation of CD8+ T
lymphocytes from mice immunized with yeasts carrying Ovacyt was even lower than in
the PBS control group. This latter result was unexpected, since most of the
subcutaneously administered yeasts are taken up by monocyte-derived inflammatory
DCs (or, to a lesser extent, by skin-derived DCs) and then transported to draining lymph
nodes (Ersland et al., 2010). However, Wang et al. (2003) demonstrated that non-self
peptides, including SIINFEKL, led to the generation of higher responses in the spleen
Discussion
186
than in draining lymph nodes after s.c. immunization of mice with antigens mixed with
adjuvant or pulsed on DCs.
Particulate antigens are efficiently cross-presented in vivo and are likely to
stimulate robust CTL responses. Particles larger than 1 µm are taken up by
phagocytosis. The higher efficiency with which particulate antigens are cross-presented
in comparison to soluble antigen arises from the fact that (i) the amount of antigen
internalized by phagocytosis is much greater than when soluble proteins enter APCs by
fluid-phase pinocytosis, and (ii) antigens internalized by phagocytosis are thought to
access the cross-presentation pathway more efficiently (reviewed by Rock and Shen,
2005). Since yeast carrying Ovacyt is also a form of particulate antigen, cross-
presentation would be expected to occur, also when the antigen amount was not very
high.
Despite the existence of several studies showing yeast as antigen carrier in
immunization experiments, there is no data about IFN-γ production by antigen-specific
CD8+ T lymphocytes, which might reflect the complexity of this type of analysis.
However, the results obtained after incubation of spleen cells with Ova(257-264) peptide
indicate that yeasts were internalized and Ovacyt-derived SIINFEKL could be processed
for cross-presentation to CD8+ T lymphocytes. The low lymphocyte activation observed
after restimulation of splenocytes with Ova(257-264) peptide was most probably not due to
the presence of Brefeldin A, since it has been shown that DC treatment with this
substance had no influence on presentation of exogenously added SIINFEKL (Brossart
and Bevan, 1997). Western blot analysis of the yeasts used in this immunization
protocol revealed low expression of Ovacyt (approximately 17 ng in 5×10⁷ cells, data not
shown), which might have difficulted the detection of more significant responses.
Nevertheless, proliferation of CD8+ T lymphocytes in response to Ova has been
demonstrated with as little as 0.2 ng antigen when delivered in a cell-associated form
(Li et al., 2001). Maybe determination of the frequency of IFN-γ-producing cells is not
a very sensitive method to detect CD8+ T cell responses when the antigen amount is
low, so that analysis of T cell proliferation would, for example, represent an alternative
method for such immunization experiments.
Nevertheless, these experiments clearly show the potential of whole, live yeast
as antigen carrier and suggest that protocol optimization would most probably result in
more convincing results. Moreover, the use of other yeast genera as examined
Discussion
187
throughout this work could lead to the establishment of novel whole yeast-based
vaccines.
8. Perspectives
Approaches using yeasts as vaccine vehicle exhibit a vast number of advantages over
other carrier systems, and this field of research has made significant progress in the past
decade. However, many issues remain to be explored or more profoundly investigated.
In this work, the potential of different yeast genera as antigen carrier could be
successfully demonstrated, as well as their ability to activate antigen-specific T cells.
However, additional experiments, in particular involving in vivo models, are required in
order to enable the establishment of more effective yeast-based antigen delivery
systems.
With respect to the cytokines secreted by stimulated DCs, the T cell-biasing
profile could probably be more clearly identified by analyzing a higher number of
donors. Furthermore, the presence of IL-4 in the culture medium to induce
differentiation of monocytes into DCs made it difficult to determine the amount of IL-4
secreted by DCs. Consequently, it was not possible to ascertain if DC activation by
some of the stimuli tested would result in the priming of TH2 cells. Repeated cell
washings and resuspension in fresh medium depleted of cytokines would likely allow a
more reliable IL-4 determination.
Recombinant protein expression in yeast could be optimized by altering distinct
parameters. For example, gene optimization taking into account the codon usage bias of
each yeast species and use of expression vectors that enable multi-copy integration into
the yeast genome would most probably lead to higher protein yields. Additionally,
different anchors for cell-surface expression could be tested in an attempt to identify the
most effective anchoring system for a particular yeast species.
The shortcomings in the delivery of secreted Ova might have been a result of
the extremely high stability of this protein. To test this hypothesis, ovacyt could be
cloned downstream of a proper signal sequence for recombinant secretion in yeast. If
antigen presentation was detected after delivery of secreted Ovacyt, a rather unstable
Ova derivative, it would be in agreement with the assumption that highly stable proteins
are lesser available for processing and presentation by virtue of their diminished
degradation. In an immediate future, this finding could be helpful in terms of choosing
Discussion
188
the most adequate protein variant to be delivered. However, the limited availability of T
cell lines specific for a particular epitope restrains the applicability of such in vitro
antigen presentation assays.
In relation to in vivo approaches involving recombinant yeasts, immunization
schedules for the different yeast genera delivering all Ova derivatives (including Ova
VLP) should be established. In this context, a higher number of yeast cells per injection
and a higher number of mice per group, as previously suggested, should be employed.
Furthermore, assessment of T cell proliferation would probably be a more appropriate
method to verify T cell responses. Resorting to this technique, in which CFSE-labeled
transgenic OT-I T cells were injected in mice which were then primed 1 day later with
Ova, Li et al. (2001) could detect proliferation of OT-I cells in response to cell-
associated Ova even when the antigen amount was as low as 0.2 ng/mouse. Moreover, a
number of immunization strategies should be evaluated, such as the use of different
yeast genera, distinct subcellular antigen localizations and antigen-loaded VLP. Also,
the results from the whole blood assays performed in this work support the use of heat-
treated yeasts in immunization approaches. One drawback is that, in the case of antigens
designed to combating viral infections in humans, suitable animal models are frequently
scarce, hampering the onset of several vaccination studies.
An ideal therapeutic vaccine should also stimulate the generation of CD4+ T
helper responses, since TH cells can further promote the generation and proliferation of
potent CTL responses via release of immunomodulatory cytokines (Ardiani et al.,
2010). Since different yeast species can trigger the secretion of a different set of
modulatory cytokines, analyses of both CD4+ and CD8+ T cell responses should be
considered in yeast-based immunization approaches.
Summary
189
VI. SUMMARY
Yeasts represent promising vaccine vehicles and have been demonstrated to elicit robust
innate and adaptive immune responses. Nonetheless, the vast majority of studies
employing yeast as delivery system has so far been restricted to S. cerevisiae.
Nowadays however, an additional set of yeast genera of biotechnological relevance is
available which could be tested as potential antigen carrier. Therefore, in the present
study, different yeast genera were assessed for APC activation and antigen delivery
aiming at the stimulation of antigen-specific T cells.
Distinct yeast genera, species, strains and mutants were able to induce maturation of
human DCs, as analyzed by the upregulation of various cell-surface markers, including
costimulatory, adhesion and MHC molecules, as well as a major chemokine receptor. In
general, the diverse fungal stimuli differently triggered DC maturation, and to different
extents than bacterial and viral stimuli. Yeasts also promoted cytokine secretion by
human DCs, and cytokine levels differed among genera in most situations. As observed
for the cell-surface molecules, the nature of the stimulus (bacterial, fungal, viral) led to
DC activation in different ways. Importantly, all yeasts tested promoted release of TH1-
type cytokines such as IL-12 and IFN-γ, demonstrating that different yeast genera bear
the potential to function as efficient carrier for activation of naïve T cells in antigen
delivery approaches.
Four biotechnologically relevant yeast genera (S. cerevisiae, P. pastoris, Sz. pombe and
K. lactis) were assessed for interaction with mammalian phagocytic cells, such as
human DCs and murine macrophages. Yeast phagocytosis was MR- and Dectin-1-
dependent in human DCs, and Dectin-1-dependent in IC-21 mouse macrophages.
Furthermore, kinetic patterns of yeast internalization differed among budding and
fission yeasts.
In order to address the suitability of yeast as carrier for protein antigens, delivery of
heterologously expressed Ova was investigated in a comparative study. Expression of
recombinant Ova derivatives exhibited, in general, a great variation among yeast
genera. S. cerevisiae, P. pastoris, Sz. pombe and K. lactis expressing full-length Ova
(targeted to secretion) or Ovacyt (intracellular), as well as S. cerevisiae and P. pastoris
expressing Ovacyt/Sed1p (cell-wall anchored) were assessed for antigen delivery by
Summary
190
means of an in vitro presentation assay. It could be shown that all yeasts tested varied in
their ability to deliver protein antigens and, furthermore, that subcellular protein
localization influenced the activation of antigen-specific CD8+ T cells. Cytosolic and
cell-surface displayed Ovacyt were delivered by all yeast genera, albeit to different
degrees, whereas secreted Ova led to slight lymphocyte activation in S. cerevisiae and
P. pastoris.
Yeasts were also genetically modified in order to express the clinically relevant
tegument antigen pp65 from HCMV. Again, foreign protein expression was highly
variable among yeast genera, and failed in K. lactis. Pp65 VLP were also recombinantly
expressed in S. cerevisiae. Specific activation of pp65-specific memory CD4+ and CD8+
T cells from HCMV-seropositive individuals could be observed when heat-treated and
untreated whole yeasts served as antigen vehicle in an ex vivo whole blood assay. T cell
stimulation was specific, since no activation was detected in blood from HCMV-
seronegative donors and much lower responses against the yeast vectors were observed
compared to yeasts carrying pp65. The extent of pp65-specific T-cell activation varied
among yeast genera, and pp65 VLP were more effective than unmodified pp65 in S.
cerevisiae. Further, heat-treatment of yeasts differently affected stimulation of T
lymphocytes but showed, in general, a beneficial effect. The CD4+ T cell population
exhibited a higher percentage of CD69+ IFN-γ+ cells in comparison to the population of
CD8+ T cells in all cases analyzed. Also, detection of T cell activation by means of
whole blood assay proved to be more advantageous than the method of T cell
stimulation in an autologous system.
Heat treatment affected the response of blood phagocytes towards S. cerevisiae, P.
pastoris, Sz. pombe and K. lactis, as measured by the production of ROS. In the case of
the budding yeasts, ROS production in response to heat-treated yeasts was higher than
for untreated yeasts, but the opposite effect was observed in fission yeast.
Finally, Ova-specific CD8+ T lymphocytes from OT-I transgenic mice immunized with
S. cerevisiae carrying Ovacyt showed higher production of IFN-γ upon restimulation
with an SIINFEKL peptide epitope than lymphocytes from mice receiving S. cerevisiae
harbouring an empty vector or PBS only. This experimental procedure requires,
however, further optimization.
References
191
VII. REFERENCES
Aaij, C., Borst, P. The gel electrophoresis of DNA. 1972. Biochimica et Biophysica
Acta 269 (2): 192-200.
Abbas, A.K., Lichtman, A.H., Pillai, S. 2007. Cellular and molecular immunology. 6th
edition. Saunders Elsevier, Philadelphia.
Ackerman, A.L., Cresswell, P. 2004. Cellular mechanisms governing cross-
presentation of exogenous antigens. Nature Immunology 5 (7): 678-684.
Ackerman, A.L., Kyritsis, C., Tampé, R., Cresswell, P. 2005. Access of soluble
antigens to the endoplasmic reticulum can explain cross-presentation by dendritic cells.
Nature Immunology 6 (1): 107-113.
Adams, E.W., Ratner, D.M., Seeberger, P.H., Hacohen, N. 2008. Carbohydrate-
mediated targeting of antigen to dendritic cells leads to enhanced presentation of
antigen to T cells. Chembiochem 9 (2): 294-303.
Aderem, A., Underhill, D.M. 1999. Mechanisms of phagocytosis in macrophages.
Annual Review of Immunology 17: 593–623.
Akira S., Takeda, K., Kaisho, T. 2001. Toll-like receptors: critical proteins linking
innate and acquired immunity. Nature Immunology 2 (8): 675-680.
Akramiene, D., Kondrotas, A., Didziapetriene, J., Kevelaitis, E. 2007. Effects of β-
glucans on the immune system. Medicina (Kaunas) 43 (8): 597-606.
Alegre, M-L., Frauwirth, K.A., Thompson, C.B. 2001. T-cell regulation by CD28
and CTLA-4. Nature Reviews Immunology 1 (3): 220-228.
Allsopp, C.E., Plebanski, M., Gilbert, S., Sinden, R.E., Harris, S., Frankel., G,
Dougan, G., Hioe, C., et al. 1996. Comparison of numerous delivery systems for the
induction of cytotoxic T lymphocytes by immunization. European Journal of
Immunology 26 (8): 1951-1959.
Ardiani, A., Higgins, J.P., Hodge, J.W. 2010. Vaccines based on whole recombinant
cells. FEMS Yeast Research 10 (8):1060-1069.
References
192
Arellano, M., Cartagena-Lirola, H., Nasser Hajibagheri, M.A., Durán, A., Henar
Valdivieso, M. 2000. Proper ascospore maturation requires the chs1+ chitin synthase
gene in Schizosaccharomyces pombe. Molecular Microbiology 35 (1): 79-89.
Ariizumi, K., Shen, G.L., Shikano, S., Xu, S., Ritter, R. 3rd, Kumamoto, T.,
Edelbaum, D., Morita, A., et al. 2000. Identification of a novel, dendritic cell-
associated molecule, dectin-1, by subtractive cDNA cloning. The Journal of Biological
Chemistry 275 (26): 20157-20167.
Avraméas, A., McIlroy, D., Hosmalin, A., Autran, B., Debré, P., Monsigny, M.,
Roche, A.C., Midoux, P. 1996. Expression of a mannose/fucose membrane lectin on
human dendritic cells. European Journal of Immunology 26 (2): 394-400.
Barr, E., Tamms, G. 2007. Quadrivalent human papillomavirus vaccine. Clinical
Infectious Diseases 45 (5): 609-617.
Barron, M.A., Blyveis, N., Pan, S.C., Wilson, C.C. 2006. Human dendritic cell
interactions with whole recombinant yeast: implications for HIV-1 vaccine
development. Journal of Clinical Immunology 26 (3): 251-264.
Batten, M., Li, J., Yi, S., Kljavin, N.M., Danilenko, D.M., Lucas, S., Lee, J., de
Sauvage, F.J., Ghilardi, N. 2006. Interleukin 27 limits autoimmune encephalomyelitis
by suppressing the development of interleukin 17–producing T cells. Nature
Immunology 7 (9): 929-936.
Bazan, S.B., Geginat, G., Breinig, T., Schmitt, M.J., Breinig, F. 2011. Uptake of
various yeast genera by antigen-presenting cells and influence of subcellular antigen
localization on the activation of ovalbumin-specific CD8 T lymphocytes. Vaccine
(doi:10.1016/j.vaccine.2011.07.141).
Beninga, J., Kropff, B. Mach, M. 1995. Comparative analysis of fourteen individual
human cytomegalovirus proteins for helper T cell response. Journal of General
Virology 76 (Pt 1): 153-160.
Bensadoun, A., Weinstein, D. 1976. Assay of proteins in the presence of interfering
materials. Analytical Biochemistry 70 (1): 241-250.
Bernardy, G. 2006. Herstellung von Polyepitopkassetten zur Etablierung einer Hefe-
basierten Impfstrategie. Diplomarbeit. Molecular and Cell Biology, Saarland
University.
References
193
Bernstein, D.I., Reap, E.A., Katen, K., Watson, A., Smith, K., Norberg, P.,
Olmsted, R.A., Hoeper, A., et al. 2010. Randomized, double-blind, Phase 1 trial of an
alphavirus replicon vaccine for cytomegalovirus in CMV seronegative adult volunteers.
Vaccine 28: 484–493.
Bernstein, M.B., Chakraborty, M., Wansley, E.K., Guo, Z., Franzusoff, A.,
Mostböck, S., Sabzevari, H., Schlom, J., Hodge, J.W. 2008. Recombinant
Saccharomyces cerevisiae (yeast-CEA) as a potent activator of murine dendritic cells.
Vaccine 26 (4): 509-521.
Bertoletti, A., Sette, A., Chisari, F.V., Penna, A., Levrero, M., De Carli, M.,
Fiaccadori, F., Ferrari, C. 1994. Natural variants of cytotoxic epitopes are T-cell
receptor antagonists for antiviral cytotoxic T cells. Nature 369 (6479): 407-410.
Bettelli, E., Carrier, Y., Gao, W., Korn, T., Strom, T.B., Oukka, M., Weiner, H.L.,
Kuchroo, V.K. 2006. Reciprocal developmental pathways for the generation of
pathogenic effector TH17 and regulatory T cells. Nature 441 (7090): 235-238.
Bian, G., Cheng, Y., Wang, Z., Hu, Y., Zhang, X., Wu, M., Chen, Z., Shi, B., et al.
2010. Whole recombinant Hansenula polymorpha expressing hepatitis B virus surface
antigen (yeast-HBsAg) induces potent HBsAg-specific Th1 and Th2 immune responses.
Vaccine 28 (1): 187-194.
Bigger, C.H., Murray, K., Murray, N.E. 1973. Recognition sequence of a restriction
enzyme. Nature New Biology 244 (131): 7-10.
Birnboim, H.C., Doly, J. 1979. A rapid alkaline extraction procedure for screening
recombinant plasmid DNA. Nucleic Acids Research 7 (6): 1513–1523.
Bjorkman, P.J., Saper, M.A., Samraoui, B., Bennett, W.S., Strominger, J.L.,
Wiley, D.C. 1987. Structure of the human class I histocompatibility antigen, HLA-A2.
Nature 329 (6139): 506-512.
Brachmann, C.B., Davies, A., Cost, G.J., Caputo, E., Li, J., Hieter, P., Boeke, J.D.
1998. Designer deletion strains derived from Saccharomyces cerevisiae S288C: a useful
set of strains and plasmids for PCR-mediated gene disruption and other applications.
Yeast 14 (2): 115-132.
Breinig, F. 2002. Untersuchungen zum Einsatz rekombinanter Hefen als neuartige
Lebendvakzine. Dissertation. Molecular and Cell Biology, Saarland University.
References
194
Breinig F, Heintel T, Schumacher A, Meyerhans A, Schmitt MJ. 2003. Specific
activation of CMV-primed human T lymphocytes by cytomegalovirus pp65 expressed
in fission yeast. FEMS Immunology and Medical Microbiology 38 (3): 231-239.
Breinig, F., Schmitt, M.J. 2002. Spacer-elongated cell wall fusion proteins improve
cell surface expression in the yeast Saccharomyces cerevisiae. Applied Microbiology
and Biotechnology 58 (5): 637-644.
Breinig, T., Sester, M., Sester, U., Meyerhans, A. 2006. Antigen-specific T cell
responses: Determination of their frequencies, homing properties, and effector functions
in human whole blood. Methods 38: 77–83.
Brossart, P., Bevan, M.J. 1997. Presentation of exogenous protein antigens on major
histocompatability complex class I molecules by dendritic cells: pathway of
presentation and regulation by cytokines. Blood 90 (4): 1594-1599.
Brown, G.D. 2006. Dectin-1: a signalling non-TLR pattern-recognition receptor.
Nature Reviews Immunology 6 (1): 33-43.
Brown, G.D. 2011. Innate antifungal immunity: the key role of phagocytes. Annual
Review of Immunology 29: 1-21.
Brown, G.D., Gordon, S. 2001. Immune recognition. A new receptor for β-glucans.
Nature 413: 36-37.
Brown, G.D., Herre, J., Williams, D.L., Willment, J.A., Marshall, A.S., Gordon, S.
Dectin-1 mediates the biological effects of β-glucans. 2003. The Journal of
Experimental Medicine 197 (9): 1119–1124.
Bucarey, S.A., Noriega, J., Reyes, P., Tapia, C., Sáenz, L., Zuñiga, A., Tobar, J.A.
2009. The optimized capsid gene of porcine circovirus type 2 expressed in yeast forms
virus-like particles and elicits antibody responses in mice fed with recombinant yeast
extracts. Vaccine 27 (42): 5781-5790.
Buck, J.W., Andrews, J.H. 1999. Attachment of the yeast Rhodosporidium toruloides
is mediated by adhesives localized at sites of bud cell development. Applied and
Environmental Microbiology 65 (2): 465-471.
Buckholz, R.G., Gleeson, M.A.G. 1991. Yeast systems fort the commercial production
of heterologous proteins. Bio/technology 9: 1067-1072.
References
195
Buentke, E., Zargari, A., Heffler, L.C., Avila-Cariño, J., Savolainen, J., Scheynius,
A. 2000. Uptake of the yeast Malassezia furfur and its allergenic components by human
immature CD1a+ dendritic cells. Clinical and Experimental Allergy 30 (12): 1759-1770.
Buentke, E., Heffler, L.C., Wallin, R.P., Löfman, C., Ljunggren, H.G., Scheynius,
A. 2001. The allergenic yeast Malassezia furfur induces maturation of human dendritic
cells. Clinical and Experimental Allergy 31(10): 1583-1593.
Bui, M.R., Hodson, V., King, T., Leopold, D., Dai, S., Fiolkoski, V., Oakes, S.,
Duke, R., et al. 2010. Mutation-specific control of BCR-ABL T315I positive leukemia
with a recombinant yeast-based therapeutic vaccine in a murine model. Vaccine 28 (37)
6028–6035.
Cáceres, V.M., Sutter, R.W. 2001. Sabin monovalent oral polio vaccines: review of
past experiences and their potential use after polio eradication. Clinical Infectious
Diseases 33 (4): 531-541.
Calvin, N.M., Hanawalt, P.C. 1988. High-efficiency transformation of bacterial cells
by electroporation. Journal of Bacteriology 170 (6) : 2796-2801.
Cambi, A., Gijzen, K., de Vries, J.M., Torensma, R., Joosten, B., Adema, G.J.,
Netea, M.G., Kullberg, B.J., et al. 2003. The C-type lectin DC-SIGN (CD209) is an
antigen-uptake receptor for Candida albicans on dendritic cells. European Journal of
Immunology 33 (2): 532-538.
Capilla, J., Clemons, K.V., Liu, M., Levine, H.B., Stevens, D.A. 2009.
Saccharomyces cerevisiae as a vaccine against coccidioidomycosis. Vaccine 27 (27):
3662-3668.
Champion, J.A. and Mitragotri, S. 2006. Role of target geometry in phagocytosis.
Proceedings of the National Academy of Sciences of the USA 103 (13): 4930–4934.
Chan, G.C., Chan, W.K., Sze, D.M. 2009. The effects of β-glucan on human immune
and cancer cells. Journal of Hematology & Oncology 2:25.
Chaudhuri B., Stephan, C. 1995. A C-terminal domain, which prevents secretion of
the neuroendocrine protein 7B2 in Saccharomyces cerevisiae, inhibits Kex2 yet is
processed by the Yap3 protease. FEBS Letters 364: 91-97.
Clarke, S.R.M. 2000. The critical role of CD40/CD40L in the CD4-dependent
generation of CD8+ T cell immunity. Journal of Leukocyte Biology 67 (5): 607-614.
References
196
Colussi, P.A., Taron, C.H. 2005. Kluyveromyces lactis LAC4 promoter variants that
lack function in bacteria but retain full function in K. lactis. Applied and Environmental
Microbiology 71 (11): 7092-7098.
Coyle, A.J., Gutierrez-Ramos, J-C. 2001. The expanding B7 superfamily: Increasing
complexity in costimulatory signals regulating T cell function. Nature Immunology 2
(3): 203-209.
Cresswell, P., Ackerman, A.L., Giodini, A., Peaper, D.R., Wearsch, P.A. 2005.
Mechanisms of MHC class I-restricted antigen processing and cross-presentation.
Immunological Reviews 207: 145-57.
Crisci, E., Almanza, H., Mena, I., Córdoba, L., Gómez-Casado, E., Castón, J.R.,
Fraile, L., Bárcena, J., Montoya, M. 2009. Chimeric calicivirus-like particles elicit
protective anti-viral cytotoxic responses without adjuvant. Virology 387 (2): 303-312.
d'Ostiani, C.F., Del Sero, G., Bacci, A., Montagnoli, C., Spreca, A., Mencacci, A.,
Ricciardi-Castagnoli, P., Romani, L. 2000. Dendritic cells discriminate between
yeasts and hyphae of the fungus Candida albicans: implications for initiation of T
helper cell immunity in vitro and in vivo. The Journal of Experimental Medicine 191
(10): 1661-1674.
Da Silva, C.A., Chalouni, C., Williams, A., Hartl, D., Lee, C.G., Elias, J.A. 2009.
Chitin is a size-dependent regulator of macrophage TNF and IL-10 production. The
Journal of Immunology 182 (6): 3573-3582.
Da Silva, C.A., Pochard, P., Lee, C.G., Elias, J.A. 2010. Chitin particles are
multifaceted immune adjuvants. American Journal of Respiratory and Critical Care
Medicine 182: 1482–1491.
Dalod, M., Salazar-Mather, T.P., Malmgaard, L., Lewis, C., Asselin-Paturel, C.,
Brière, F., Trinchieri, G., Biron, C.A. 2002. Interferon α/β and interleukin 12
responses to viral infections: pathways regulating dendritic cell cytokine expression in
vivo. The Journal of Experimental Medicine 195 (4): 517-528.
Das, S., Hollenberg, C.P. 1982. A high-frequency transformation system for the yeast
Kluyveromyces lactis. Current Genetics 6: 123-128.
De Saint-Vis, B., Fugier-Vivier, I., Massacrier, C., Gaillard, C., Vanbervliet, B.,
Aït-Yahia, S., Banchereau, J., Liu, Y.J. 1998. The cytokine profile expressed by
References
197
human dendritic cells is dependent on cell subtype and mode of activation. The Journal
of Immunology 160 (4): 1666-1676.
De Schutter, K., Lin, Y.C., Tiels, P., Van Hecke, A., Glinka, S., Weber-Lehmann,
J., Rouzé, P., Van de Peer, Y., Callewaert, N. 2009. Genome sequence of the
recombinant protein production host Pichia pastoris. Nature Biotechnology 27 (6): 561-
566.
Dean, N. 1999. Asparagine-linked glycosylation in the yeast Golgi. Biochimica et
Biophysica Acta 1426 (2): 309-322.
DelVecchio, M., Bajetta, E. Canova, S., Lotze, M.T., Wesa, A., Parmiani, G.,
Anichini, A. 2007. Interleukin-12: Biological properties and clinical application.
Clinical Cancer Research 13(16): 4677-4685.
Dennehy, K.M., Willment, J.A., Williams, D.L., Brown, G.D. 2009. Reciprocal
regulation of IL-23 and IL-12 following co-activation of Dectin-1 and TLR signaling
pathways. European Journal of Immunology 39 (5): 1379–1386.
Diebold, S. 2009. Activation of dendritic cells by toll-like receptors and C-type lectins.
Handbook of Experimental Pharmacology 188: 3-30.
Diehl, B. 2008. MMPACE – ein hefezellbasierter Bioassay zur Hochdurchsatz-Testung
spezifischer Inhibitoren gegen humane Matrix-Metalloproteasen. Dissertation.
Molecular and Cell Biology, Saarland University.
Domínguez, A., Fermiñán, E., Sánchez, M., González, F.J., Pérez-Campo F.M.,
García S., Herrero, A.B., San Vicente, A., et al. 1998. Non-conventional yeasts as
hosts for heterologous protein production. International Microbiology 1 (2): 131-142.
Dong, C. 2006. Diversification of T-helper-cell lineages: finding the family root of IL-
17-producing cells. Nature Reviews Immunology 6 (4): 329-333.
Dower, W.J., Miller, J.F., Ragsdale, C.W. 1988. High efficiency transformation of
E.coli by high voltage electroporation. Nucleic Acids Research 16 (13): 6127-6145.
Dujon, B., Sherman, D., Fischer, G., Durrens, P., Casaregola, S., Lafontaine, I., De
Montigny, J., Marck, C., et al. 2004. Genome evolution in yeasts. Nature 430 (6995):
35-44.
Eiden-Plach, A., Zagorc, T., Heintel,T., Carius, Y., Breinig, F.,Schmitt, M.J. 2004.
Viral preprotoxin signal sequence allows efficient secretion of green fluorescent protein
References
198
by Candida glabrata, Pichia pastoris, Saccharomyces cerevisiae, and
Schizosaccharomyces pombe. Applied and Environmental Microbiology 70 (2): 961-
966.
Ellis, S.B., Brust, P.F., Koutz, P.J., Waters, A.F., Harpold, M.M., Gingeras, T.R.
1985. Isolation of alcohol oxidase and two other methanol regulatable genes from the
yeast Pichia pastoris. Molecular and Cellular Biology 5 (5): 1111-1121.
Embry, A., Meng, X., Cantwell, A., Dube, P.H., Xiang, Y. 2011. Enhancement of
immune response to an antigen delivered by vaccinia virus by displaying the antigen on
the surface of intracellular mature virion. Vaccine 29 (33): 5331-5339.
Emr, S.D., Schauer, I., Hansen, W., Esmon, P., Schekman, R. 1984. Invertase 3-
galactosidase hybrid proteins fail to be transported from the endoplasmic reticulum in
Saccharomyces cerevisiae. Molecular and Cellular Biology 4 (1): 2347-2355.
Engering, A.J., Cella, M., Fluitsma, D., Brockhaus, M., Hoefsmit, E.C.,
Lanzavecchia, A., Pieters, J. 1997. The mannose receptor functions as a high capacity
and broad specificity antigen receptor in human dendritic cells. European Journal of
Immunology 27 (9): 2417-2425.
Ersland, K., Wüthrich, M., Klein, B.S. 2010. Dynamic interplay among monocyte-
derived, dermal, and resident lymph node dendritic cells during the generation of
vaccine immunity to fungi. Cell Host & Microbe 7 (6): 474–487.
Eschenburg, G., Stermann, A., Preissner, R., Meyer, H-A., Lode, H.N. 2010. DNA
vaccination: using the patient’s immune system to overcome cancer. Clinical and
Developmental Immunology 2010: 1-14.
Esser, M.T., Marchesea, R.D., Kierstead, L.S., Tusseyb, L.G., Wanga, F.,
Chirmulea, N., Washabaugh, M.W. 2003. Memory T cells and vaccines. Vaccine 21
(5-6): 419-430.
Ezekowitz, R.A., Sastry, K., Bailly, P., Warner, A. 1990. Molecular characterization
of the human macrophage mannose receptor: demonstration of multiple carbohydrate
recognition-like domains and phagocytosis of yeasts in Cos-1 cells. The Journal of
Experimental Medicine 172 (6): 1785-1794.
Ezekowitz, R.A., Williams, D.J., Koziel, H., Armstrong, M.Y., Warner, A.,
Richards, F.F., Rose, R.M. 1991. Uptake of Pneumocystis carinii mediated by the
macrophage mannose receptor. Nature 351 (6322): 155-158.
References
199
Farrar, J.D., Asnagli, H., Murphy, K.M. 2002. T helper subset development: roles of
instruction, selection, and transcription. The Journal of Clinical Investigation 109 (4):
431-435.
Feldhaus, M.J., Siegel, R.W., Opresko, L.K., Coleman, J.R., Feldhaus, J.M.,
Yeung, Y.A., Cochran, J.R., Heinzelman, P., et al. 2003. Flow-cytometric isolation of
human antibodies from a nonimmune Saccharomyces cerevisiae surface display library.
Nature Biotechnology 21 (2): 163-170.
Fialkow, L., Wang, Y., Downey, G.P. 2007. Reactive oxygen and nitrogen species as
signaling molecules regulating neutrophil function. Free Radical Biology and Medicine
42 (2): 153-164.
Fifis, T., Gamvrellis, A., Crimeen-Irwin, B., Pietersz, G.A., Li, J., Mottram, P.L.,
McKenzie, I.F., Plebanski, M. 2004. Size-dependent immunogenicity: therapeutic and
protective properties of nano-vaccines against tumors. The Journal of Immunology 173
(5): 3148-3154.
Figdor, C.G., van Kooyk, Y., Adema, G.J. 2002. C-type lectin receptors on dendritic
cells and Langerhans cells. Nature Reviews Immunology 2 (2): 77-84.
Forsburg, S.L., Rhind, N. 2006. Basic methods for fission yeast. Yeast 23: 173-183.
Forsyth, C.B., Plow, E.F., Zhang, L. 1998. Interaction of the fungal pathogen Candida
albicans with integrin CD11b/CD18: recognition by the I domain is modulated by the
lectin-like domain and the CD18 subunit. The Journal of Immunology 161 (11): 6198-
6205.
Fradin, C., Jouault, T., Mallet, A., Mallet, J.M., Camus, D., Sinaÿ, P., Poulain, D.
1996. Beta-1,2-linked oligomannosides inhibit Candida albicans binding to murine
macrophage. Journal of Leukocyte Biology 60 (1): 81-87.
Franzusoff, A., Duke, R.C., King, T.H., Lu, Y., Rodell, T.C. 2005. Yeasts encoding
tumour antigens in cancer immunotherapy. Expert Opinion on Biological Therapy 5 (4):
565-575.
Fujimura, T., Ribas, J.C., Makhov, A.M., Wickner, R.B. 1992. Pol of gag-pol fusion
protein required for encapsidation of viral RNA of yeast L-A virus. Nature 359
(6397):746-749.
References
200
Gantner, B.N., Simmons, R.M., Canavera, S.J., Akira, S., Underhill, D.M. 2003.
Collaborative induction of inflammatory responses by dectin-1 and Toll-like receptor 2.
The Journal of Experimental Medicine 197 (9): 1107-1117.
Gantner, B.N., Simmons, R.M., Underhill, D.M. 2005. Dectin-1 mediates
macrophage recognition of Candida albicans yeast but not filaments. The EMBO
Journal 24: 1277–1286.
Gellissen, G., Hollenberg, C.P. 1997. Application of yeasts in gene expression studies:
a comparison of Saccharomyces cerevisiae, Hansenula polymorpha and Kluyveromyces
lactis -- a review. Gene 190 (1): 87-97.
Gerlach, C., van Heijst, J.W.J., Schumacher, T.N.M. 2011. The descent of memory
T cells. Annals of the New York Academy of Sciences 1217: 139-153.
Germain, R.N., Margulies, D.H. 1993. The biochemistry and cell biology of antigen
processing and presentation. Annual Review of Immunology 11: 403-450.
Giaimis, J., Lombard, Y., Fonteneau, P., Muller, C.D., Levy, R., Makaya-Kumba,
M., Lazdins, J., Poindron, P. 1993. Both mannose and beta-glucan receptors are
involved in phagocytosis of unopsonized, heat-killed Saccharomyces cerevisiae by
murine macrophages. Journal of Leukocyte Biology 54 (6): 564-571.
Giga-Hama, Y., Tohda, H., Okada, H., Owada, M.K., Okayama, H., Kumagai, H.
1994. High-level expression of human lipocortin I in the fission yeast
Schizosaccharomyces pombe using a novel expression vector. Bio/technology 12 (4):
400-404.
Gildea, L.A., Morris, R.E., Newman, S.L. 2001. Histoplasma capsulatum yeasts are
phagocytosed via very late antigen-5, killed, and processed for antigen presentation by
human dendritic cells. The Journal of Immunology 166 (2): 1049-1056.
Glick, B.S. 1996. Cell biology: Alternatives to baker’s yeast. Current Biology 6 (12):
1570-1572.
Goffeau, A., Barrell B.G., Bussey H., Davis R.W., Dujon B., Feldmann H., Galibert
F., Hoheisel J.D., et al. 1996. Science 274(5287): 546, 563-567.
Goldstein, I.J., So, L.L. 1965. Protein-carbohydrate interaction. III. Agar gel-diffusion
studies on the interaction of Concanavalin A, a lectin isolated from jack bean, with
polysaccharides. Archives of Biochemistry and Biophysics 111 (2): 407-414.
References
201
Grefte, J.M., van der Gun, B.T., Schmolke, S., van der Giessen, M., van Son, W.J.,
Plachter, B., Jahn, G., The, T.H. 1992. The lower matrix protein pp65 is the principal
viral antigen present in peripheral blood leukocytes during an active cytomegalovirus
infection. Journal of General Virology 73 (Pt 11): 2923-2932.
Grgacic, E.V.L., Anderson, D.A. 2006. Virus-like particles: Passport to immune
recognition. Methods 40 (1): 60-65.
Guermonprez, P., Valladeau, J., Zitvogel, L., Théry, C., Amigorena, S. 2002.
Antigen presentation and T cell stimulation by dendritic cells. Annual Review of
Immunology 20: 621-667.
Haller, A.A., Lauer, G.M., King, T.H., Kemmler, C., Fiolkoski, V., Lu, Y.,
Bellgrau, D., Rodell, T.C., et al. 2007. Whole recombinant yeast-based
immunotherapy induces potent T cell responses targeting HCV NS3 and Core proteins.
Vaccine 25 (8): 1452-1463.
Hanahan, D. 1983. Studies on transformation of Escherichia coli with plasmids.
Journal of Molecular Biology 166: 557-580.
Hanna, C., Volker, S., Fred, Z., Susanna, E., Martine, D., Paul, W. 2009. A
combined measles, mumps, rubella and varicella vaccine (Priorix-TetraTM):
Immunogenicity and safety profile. Vaccine 27 (47): 6504–6511.
Harada, A., Sekido, N., Akahoshi, T., Wada, T., Mukaida, N., Matsushima, K.
1994. Essential involvement of interleukin-8 (IL-8) in acute inflammation. Journal of
Leukocyte Biology 56: 559-564.
Harding, C.V, Geuze, H.J. 1992. Class II MHC molecules are present in macrophage
lysosomes and phagolysosomes that function in the phagocytic processing of Listeria
monocytogenes for presentation to T cells. The Journal of Cell Biology 119 (3): 531-
542.
Harding, C.V., Song, R. 1994. Phagocytic processing of exogenous particulate
antigens by macrophages for presentation by class I MHC molecules. The Journal of
Immunology 153 (11): 4925-4933.
Heath, W.R., Carbone, F.R. 2001. Cross-presentation in viral immunity and self-
tolerance. Nature Reviews Immunology 1 (2): 126-134.
References
202
Heintel, T., Zagorc, T., Schmitt, M. J. 2001. Expression, processing and high level
secretion of a virus toxin in fission yeast. Applied Microbiology and Biotechnology 56
(1-2): 165–172.
Heintel, T., Breinig, F., Schmitt, M.J., Meyerhans, A. 2003. Extensive MHC class I-
restricted CD8 T lymphocyte responses against various yeast genera in humans. FEMS
Immunology and Medical Microbiology 39: 279-286.
Hellman, P., Eriksson, H. 2007. Early activation markers of human peripheral
dendritic cells. Human Immunology 68 (5): 324-333.
Hercus, T.R., Thomas, D., Guthridge, M.A., Ekert, P.G., King-Scott, J., Parker,
M.W., Lopez, A.F. 2009. The granulocyte-macrophage colony-stimulating factor
receptor: linking its structure to cell signaling and its role in disease. Blood 114 (7):
1289-1298.
Hill, J.E., Myers, A.M, Koernery, T. J., Tzagoloff, A. 1986. Yeast/E. coli shuttle
vectors with multiple unique restriction sites. Yeast 2: 163-167.
Hilleman MR. 2000. Vaccines in historic evolution and perspective: a narrative of
vaccine discoveries. Vaccine 18 (15): 1436-1447.
Ho, S.N., Hunt, H.D., Horton, R.M., Pullen, J.K., Pease, L.R. 1989. Site-directed
mutagenesis by overlap extension using the polymerase chain reaction. Gene 77: 51-59.
Hodge, J.W., Rad, A.N., Grosenbach, D.W., Sabzevari, H., Yafal, A.G., Gritz, L.,
Schlom, J. 2000. Enhanced activation of T cells by dendritic cells engineered to
hyperexpress a triad of costimulatory molecules. Journal of the National Cancer
Institute 92 (15): 1228-1239.
Hoffman, C.S., Winston, F. 1987. A ten-minute DNA preparation from yeast
efficiently releases autonomous plasmids for transformation of Escherichia coli. Gene
57 (2-3): 267-272.
Hogquist, K.A., Jameson, S.C., Heath, W.R., Howard, J.L., Bevan, M.J., Carbone,
F.R. 1994. T Cell Receptor Antagonist Peptides Induce Positive Selection. Cell 76: 17-
27.
Hollmig, ST., Ariizumi, K., Cruz Jr, P.D. 2009. Recognition of non-self-
polysaccharides by C-type lectin receptors dectin-1 and dectin-2. Glycobiology 19 (6):
568–575.
References
203
Horai, R., Asano, M., Sudo, K., Kanuka, H., Suzuki, M., Nishihara, M., Takahashi,
M., Iwakura, Y. 1998. Production of mice deficient in genes for interleukin (IL)-
1alpha, IL-1beta, IL-1alpha/beta, and IL-1 receptor antagonist shows that IL-1beta is
crucial in turpentine-induced fever development and glucocorticoid secretion. The
Journal of Experimental Medicine 187 (9): 1463-1475.
Horisberger, M., Vonlanthen, M., Rosset, J. 1978. Localization of α-galactomannan
and of wheat germ agglutinin receptors in Schizosaccharomyces pombe. Archives of
Microbiology 119 (2): 107-111.
Horton, R.M., Hunt, H.D., Ho, S.N., Pullen, J.K., Pease, L.R. 1989. Engineering
hybrid genes without the use of restriction enzymes: gene splicing by overlap extension.
Gene 77: 61-68.
Howland S.W., Wittrup K.D. 2008. Antigen release kinetics in the phagosome are
critical to cross-presentation efficiency. The Journal of Immunology 180 (3): 1576-83.
Huang, H., Ostroff, G.R., Lee, C.K., Wang, J.P., Specht, C.A., Levitz, S.M. 2009.
Distinct patterns of dendritic cell cytokine release stimulated by fungal β-glucans and
toll-like receptor agonists. Infection and Immunity 77 (5): 1774–1781.
Huang, H., Ostroff, G.R., Lee, C.K., Specht, C.A., Levitz, S.M. 2010. Robust
stimulation of humoral and cellular immune responses following vaccination with
antigen-loaded-glucan particles. MBio 1 (3): e00164-10.
Huang, Q., Liu, D., Majewski, P., Schulte, L.C., Korn, J.M., Young, R.A., Lander,
E.S., Hacohen, N. 2001. The plasticity of dendritic cell responses to pathogens and
their components. Science 294 (5543): 870-875.
Huber, J.P., Farrar, J.D. 2011. Regulation of effector and memory T-cell functions by
type I interferon. Immunology 132 (4): 466-474.
Humbel, B.M., Konomi, M., Takagi T., Kamasawa, N., Ishijima, S.A., Osumi, M.
2001. In situ localization of β-glucans in the cell wall of Schizosaccharomyces pombe.
Yeast 18: 433-444.
Hunt, L.T., Dayhoff, M.O. 1980. A surprising new protein superfamily containing
ovalbumin, antithrombin-III, and alpha 1-proteinase inhibitor. Biochemical and
Biophysical Research Communications 95 (2): 864-871.
References
204
Huntington, J.A, Stein, P.E. 2001. Structure and properties of ovalbumin. Journal of
Chromatography B 756: 189–198.
Husseiny, M.I., Hensel., M. 2005. Evaluation of an intracellular-activated promoter for
the generation of live Salmonella recombinant vaccines. Vaccine 23 (20): 2580–2590.
Ikonomidis, G., Paterson, Y., Kos, F.J., Portnoy, D.A. 1994. Delivery of a viral
antigen to the class I processing and presentation pathway by Listeria monocytogenes.
The Journal of Experimental Medicine 180 (6): 2209-2218.
Ishimaru, T., Ito, K., Tanaka, M., Tanaka, S., Matsudomi, N. 2011. The role of the
disulfide bridge in the stability and structural integrity of ovalbumin evaluated by site-
directed mutagenesis. Bioscience, Biotechnology, and Biochemistry 75 (3): 544-549.
Ito, H., Fukuda, Y., Murata, K., Kimura, A. 1983. Transformation of intact yeast
cells treated with alkali cations. Journal of Bacteriology 153 (1): 163-168.
Ito, K., Matsudomi, N. 2005. Structural characteristics of hen egg ovalbumin
expressed in yeast Pichia pastoris. Bioscience, Biotechnology, and Biochemistry 69 (4):
755-761.
Ito, K., Seri, A., Kimura, F., Matsudomi, N. 2007. Site-specific glycosylation at Asn-
292 in Ovalbumin is essential to efficient secretion in yeast. Journal of Biochemistry
141 (2): 193-199.
Jacob, M. C., Favre, M., Bensa, J. C. 1991. Membrane cell permeabilization with
saponin and multiparametric analysis by flow cytometry. Cytometry 12 (6): 550-558.
Janeway Jr, C.A, Travers, P., Walport, M., Shlomchik, M.J. 2001. Immunobiology.
The immune system in health and disease. 5th edition. Garland Science, New York.
Janikashvili, N., Larmonier, N., Katsanis, E. 2010. Personalized dendritic cell-based
tumor immunotherapy. Immunotherapy 2 (1): 57-68.
Jones, G.H., Ballou , C.E. 1969. Studies on the structure of yeast mannan. I.
Purification and some properties of an α-mannosidase from an arthrobacter species.
The Journal of Biological Chemistry 244 (3): 1043-1051.
Jungmann, J., Munro, S. 1998. Multi-protein complexes in the cis Golgi of
Saccharomyces cerevisiae with α-1,6-mannosyltransferase activity. The EMBO Journal
17 (2): 423-434.
References
205
Just, M., Berger, R. 1992. Reactogenicity and immunogenicity of inactivated hepatitis
A vaccines. Vaccine 10 (S1): S110-S113.
Kaech, S.M., Wherry, E. J., Ahmed, R. 2002. Effector and memory T-cell
differentiation: implications for vaccine development. Nature Reviews Immunology 2
(4): 251-262.
Kalejta, R.F. 2008. Tegument Proteins of Human Cytomegalovirus, Microbiology and
Molecular Biology Reviews, 72 (2): 249–265.
Kang, Y-S., Kane, J., Kurjan, J., Stadel, J.M., Tipper, D.J. 1990. Effects of
expression of mammalian Gα and hybrid mammalian-yeast Gα proteins on the yeast
pheromone response signal transduction pathway. Molecular and Cellular Biology 10
(6): 2582-2590.
Kanter-Smoler, G., Dahlkvist, A., Sunnerhagen, P. 1994. Improved method for rapid
transformation of intact Schizosaccharomyces pombe cells. Biotechniques 16(5): 798-
800.
Karaoglu, D., Kelleher, D.J., Gilmore, R. 1995. Functional characterization of Ost3p.
Loss of the 34-kD subunit of the Saccharomyces cerevisiae oligosaccharyltransferase
results in biased underglycosylation of acceptor substrates. The Journal of Cell Biology,
130 (3): 567-577.
Kawai, S., Hashimoto, W., Murata, K. 2010. Transformation of Saccharomyces
cerevisiae and other fungi. Methods and possible underlying mechanism. Bioengineered
Bugs 1 (6): 395-403.
Keler, T., Ramakrishna, V., Fanger, M.W. 2004. Mannose receptor-targeted
vaccines. Expert Opinion on Biological Therapy 4 (12): 1953-1962.
Kelly, E.K., Wang, L., Ivashkiv, L.B. 2010. Calcium-activated pathways and
oxidative burst mediate zymosan-induced signaling and IL-10 production in human
macrophages. The Journal of Immunology 184 (10): 5545-5552.
Kern, F., Bunde, T., Faulhaber, N., Kiecker, F., Khatamzas, E., Rudawski, I.M.,
Pruss, A., Gratama, J.W., et al. 2002. Cytomegalovirus (CMV) phosphoprotein 65
makes a large contribution to shaping the T cell repertoire in CMV-exposed individuals.
The Journal of Infectious Diseases 185 (12): 1709-1716.
References
206
Khanna, R. Diamond, D.J. 2006. Human cytomegalovirus vaccine: time to look for
alternative options. TRENDS in Molecular Medicine 12 (1): 26-33.
Kim, J-M., Jung, D-I., Eom, Y.J., Park, S-M., Yoo, H-S., Jang, Y-S., Yang, M-S.,
Kim, D-H. 2010. Surface-displayed expression of a neutralizing epitope of ApxIIA
exotoxin in Saccharomyces cerevisiae and oral administration of it for protective
immune responses against challenge by Actinobacillus pleuropneumoniae. Bioscience,
Biotechnology, and Biochemistry 74 (7): 1362–1367.
Klein, J., Sato, A. 2000. The HLA system. First of two parts. The New England
Journal of Medicine 343 (10): 702-709.
Klenow, H., Henningsen, I. 1970. Selective elimination of the exonuclease activity of
the deoxyribonucleic acid polymerase from Escherichia coli B by limited proteolysis.
Proceedings of the National Academy of Sciences of the USA 65 (1): 168-175.
Kondo, E., Akatsuka, Y., Kuzushima, K., Tsujimura, K., Asakura, S., Tajima, K.,
Kagami, Y., Kodera, Y., et al. 2004. Identification of novel CTL epitopes of CMV-
pp65 presented by a variety of HLA alleles. Blood 103 (2): 630-638.
Kopecká, M., Fleet, G.H., Phaff, H.J. 1995. Ultrastructure of the cell wall of
Schizosaccharomyces pombe following treatment with various glucanases. Journal of
Structural Biology 114 (2): 140-152.
Kopprasch, S., Graessler, J., Kohl, M., Bergmann, S., Schröder, H.-E. 1996.
Comparison of circulating phagocyte oxidative activity measured by
chemiluminescence in whole blood and isolated polymorphonuclear leukocytes. Clinica
Chimica Acta 253 (1-2): 145-157.
Koutz, P., Davis, G.R., Stillman, C., Barringer, K., Cregg J., Thill, G. 1989.
Structural comparison of the Pichia pastoris alcohol oxidase genes. Yeast 5(3): 167-
177.
Kovacsovics-Bankowski, M., Rock, K.L. 1995. A phagosome-to-cytosol pathway for
exogenous antigens presented on MHC class I molecules. Science 267 (5195): 243-246.
Kvale, E.Ø., Dalgaard, J., Lund-Johansen, F., Rollag, H., Farkas, L., Midtvedt, K.,
Jahnsen, F.L., Brinchmann, J.E., Olweus, J. 2006. CD11c+ dendritic cells and
plasmacytoid DCs are activated by human cytomegalovirus and retain efficient T cell-
stimulatory capability upon infection. Blood 107 (5): 2022-2029.
References
207
Küberl, A., Schneider, J., Thallinger, G.G., Anderl, I., Wibberg, D., Hajek, T.,
Jaenicke, S., Brinkrolf, K., et al. 2011. High-quality genome sequence of Pichia
pastoris CBS7435. Journal of Biotechnology 154 (4): 312-320.
Lam, J.S., Mansour, M.K., Specht, C.A., Levitz, S.M. 2005. A model vaccine
exploiting fungal mannosylation to increase antigen immunogenicity. The Journal of
Immunology 175 (11): 7496-7503.
Lam, J.S., Huang, H., Levitz, S.M. 2007. Effect of differential N-linked and O-linked
mannosylation on recognition of fungal antigens by dendritic cells. PloS One 10: 1-7.
Lambotin, M., Raghuraman, S., Stoll-Keller, F., Baumert, T.F., Barth, H. 2010. A
look behind closed doors: interaction of persistent viruses with dendritic cells. Nature
Reviews Microbiology 8(5): 350-360.
Lechmann, M., Berchtold, S., Hauber, J., Steinkasserer, A. 2002. CD83 on dendritic
cells: more than just a marker for maturation. Trends in Immunology 23 (6): 273-275.
Leibundgut-Landmann, S., Gross, O., Robinson, M.J., Osorio, F., Slack, E.C.,
Tsoni, S.V., Schweighoffer, E., Tybulewicz, V., et al. 2007. Syk- and CARD9-
dependent coupling of innate immunity to the induction of T helper cells that produce
interleukin 17. Nature Immunology 8 (6): 630-638.
Levitz, S.M. 2010. Innate recognition of fungal cell walls. PLoS Pathogens 6 (4):
e1000758.
Li, B., Cai, Y., Qi, C., Hansen, R., Ding, C., Mitchell, T.C., Yan, J. 2010. Orally
administered particulate β-Glucan modulates tumor-capturing dendritic cells and
improves antitumor T-cell responses in cancer. Clinical Cancer Research 16 (21):
5153-5164.
Li, M., Davey, G.M., Sutherland, R.M., Kurts, C., Lew, A.M., Hirst, C., Carbone,
F.R., Heath, W.R. 2001. Cell-associated ovalbumin is cross-presented much more
efficiently than soluble ovalbumin in vivo. The Journal of Immunology 166 (10): 6099-
6103.
Lin, J-S., Huang, J-H., Hung, L-Y., Wu, S-Y., Wu-Hsieh, B.A. 2010. Distinct roles
of complement receptor 3, Dectin-1, and sialic acids in murine macrophage interaction
with Histoplasma yeast. Journal of Leukocyte Biology 88 (1): 95-106.
References
208
Liu, L., Rich, B.E., Inobe, J.-I., Chen, W., Weiner, H.L. 1998. Induction of Th2 cell
differentiation in the primary immune response: dendritic cells isolated from adherent
cell culture treated with IL-10 prime naive CD4+ T cells to secrete IL-4. International
Immunology 10 (8): 1017–1026.
Liu, M., Clemons, K.V., Bigos, M., Medovarska, I., Brummer, E., Stevens, D.A.
2011. Immune responses induced by heat killed Saccharomyces cerevisiae: a vaccine
against fungal infection. Vaccine 29 (9): 1745-1753.
Liu, Y-J., Kanzler, H., Soumelis, V., Gilliet, M. 2001. Dendritic cell lineage,
plasticity and cross-regulation. Nature Immunology 2 (7): 585-589.
Loeffler, D.I.M., Schoen, C.U., Goebel, W., Pilgrim, S. 2006. Comparison of
different live vaccine strategies in vivo for delivery of protein antigen or antigen-
encoding DNA and mRNA by virulence-attenuated Listeria monocytogenes. Infection
and Immunity 74 (7): 3946-3957.
Lorenz, M.C., Fink, G.R. 2001. The glyoxylate cycle is required for fungal virulence.
Nature 412 (6842): 83-86.
Lu, Y., Bellgrau, D., Dwyer-Nield, L.D., Malkinson, A.M., Duke, R.C., Rodell,
T.C., Franzusoff, A. 2004. Mutation-selective tumor remission with Ras-targeted,
whole yeast-based immunotherapy. Cancer Research 64 (15): 5084-5088.
Luong, M., Lam, J.S., Chen, J., Levitz, S.M. 2007. Effects of fungal N- and O-linked
mannosylation on the immunogenicity of model vaccines. Vaccine 25 (22): 4340-4344.
Macauley-Patrick, S., Fazenda, M.L., McNeil, B., Harvey, L.M. 2005. Heterologous
protein production using the Pichia pastoris expression system. Yeast 22 (4): 249-270.
Madden, D.R. 1995. The three-dimensional structure of peptide-MHC complexes.
Annual Review of Immunology 13: 587-622.
Maecker HT, Ghanekar, S.A., Suni, M.A., He, X.S., Picker, L.J., Maino, V.C. 2001.
Factors affecting the efficiency of CD8+ T cell cross-priming with exogenous antigens.
The Journal of Immunology 166 (12): 7268-7275.
Mansour, M.K., Schlesinger, L.S., Levitz, S.M. 2002. Optimal T cell responses to
Cryptococcus neoformans mannoprotein are dependent on recognition of conjugated
carbohydrates by mannose. The Journal of Immunology 168 (6): 2872-2879.
References
209
Marquette, C.A., Blum, L.J. 2006. Applications of the luminol chemiluminescent
reaction in analytical chemistry. Analytical and Bioanalytical Chemistry 385: 546–554.
Martinez-Pomares, L., Reid, D.M., Stillion, R.J., Linehan, S.A., Zamze, S., Wong,
S.Y.C. 2003. Analysis of mannose receptor regulation by IL-4, IL-10, and proteolytic
processing using novel monoclonal antibodies. Journal of Leukocyte Biology 73 (5):
604-613.
Mattanovich, D., Graf, A., Stadlmann, J., Dragosits, M., Redl, A., Maurer, M.,
Kleinheinz, M., Sauer, M., et al. 2009. Genome, secretome and glucose transport
highlight unique features of the protein production host Pichia pastoris. Microbial Cell
Factories 8 (29): 1-13.
Maundrell, K. 1993. Thiamine-repressible expression vectors pREP and pRIP for
fission yeast. Gene 123 (1):127-130.
Mays, L.E., Wilson, J.M. 2011. The complex and evolving story of T cell activation to
AAV vector-encoded transgene products. Molecular Therapy 19 (1): 16-27.
McGeachy, M.J. 2011. GM-CSF: the secret weapon in the TH17 arsenal. Nature
Immunology 12 (6): 521-522.
McLaughlin-Taylor, E., Pande, H., Forman, S.J., Tanamachi, B., Li, C.R., Zaia,
J.A., Greenberg, P.D., Riddell, S.R. 1994. Identification of the major late human
cytomegalovirus matrix protein pp65 as a target antigen for CD8+ virus-specific
cytotoxic T lymphocytes. Journal of Medical Virology 43 (1): 103-110.
Mellman, I., Steinman, R.M. 2001. Dendritic cells: specialized and regulated antigen
processing machines. Cell 106: 255–258.
Metcalf, D. 2008. Hematopoietic cytokines. Blood 111 (2): 485-491.
Miller, C.H.T., Maher, S.G., Young, H.A. 2009. Clinical use of interferon-γ. Annals
of the New York Academy of Sciences 1182: 69–79.
Miller, E.M., Nickoloff, J.A. 1995. Escherichia coli electrotransformation. Methods in
Molecular Biology 47: 105-113.
Miyagawa, F., Gutermuth, J., Zhang, H., Katz, S.I. 2010. The use of mouse models
to better understand mechanisms of autoimmunity and tolerance. Journal of
Autoimmunity 35 (3): 192-198.
References
210
Mocarski Jr, E.S., Courcelle, C.T. 2007. Cytomegaloviruses and their replication. In:
Fields, B.N., Knipe, D.M. Fields Virology. 5th edition. Lippincott Williams & Wilkins,
Philadelphia.
Mora-Montes, H.M., Netea, M.G., Ferwerda, G., Lenardon, M.D., Brown, G.D.,
Mistry, A.R., Kullberg, B.J., O'Callaghan, C.A., et al. 2011. Recognition and
blocking of innate immunity cells by Candida albicans chitin. Infection and Immunity
79 (5): 1961-1970.
Morrissette, N.S., Gold, E.S., Guo, J., Hamerman, J.A., Ozinsky, A., Bedian, V.
Aderem, A.A. 1999. Isolation and characterization of monoclonal antibodies directed
against novel components of macrophage phagosomes. Journal of Cell Science 112:
4705-4713.
Moser, M., Murphy, K.M. 2000. Dendritic cell regulation of TH1-TH2 development.
Nature Immunology 1 (3): 199-205.
Moutaftsi, M., Mehl, A.M., Borysiewicz, L.K., Tabi, Z. 2002. Human
cytomegalovirus inhibits maturation and impairs function of monocyte-derived
dendritic cell. Blood 99 (8): 2913-2921.
Müller, N.C. 2008. Analyse und Optimierung der Zellwandverankerung heterologer
Proteine in der Hefe Pichia pastoris. Diplom Arbeit. Molecular and Cell Biology,
Saarland University.
Müller, S., Sandal, T., Kamp-Hansen, P., Dalbøge, H. 1998. Comparison of
expression systems in the yeasts Saccharomyces cerevisiae, Hansenula polymorpha,
Kluyveromyces lactis, Schizosaccharomyces pombe and Yarrowia lipolytica. Cloning of
two novel promoters from Yarrowia lipolytica. Yeast 14 (14): 1267-1283.
Nakae, S., Asano, M., Horai, R., Iwakura, Y. 2001a. Interleukin-1 beta, but not
interleukin-1 alpha, is required for T-cell-dependent antibody production. Immunology
104 (4): 402-409.
Nakae, S., Naruse-Nakajima, C., Sudo, K., Horai, R., Asano, M., Iwakura, Y.
2001b. IL-1 alpha, but not IL-1 beta, is required for contact-allergen-specific T cell
activation during the sensitization phase in contact hypersensitivity. International
Immunology 13 (12): 1471-1478.
Nakamura, K., Miyazato, A., Xiao, G., Hatta, M., Inden, K., Aoyagi, T., Shiratori,
K., Takeda, K., et al. 2008. Deoxynucleic acids from Cryptococcus neoformans
References
211
activate myeloid dendritic cells via a TLR9-dependent pathway. The Journal of
Immunology 180 (6): 4067-4074.
Nelson, D.L., Cox, M.M. 2005. Principles of biochemistry. 4th edition. W.H. Freeman
and Company, New York.
Nelson, R.D., Shibata, N., Podzorski, R.P., Herron, M.J. 1991. Candida mannan:
chemistry, suppression of cell-mediated immunity, and possible mechanisms of action.
Clinical Microbiology Reviews 4 (1): 1-19.
Netea, M.G., Gow, N.A., Munro, C.A., Bates, S., Collins, C., Ferwerda, G., Hobson,
R.P., Bertram, G., et al. 2006. Immune sensing of Candida albicans requires
cooperative recognition of mannans and glucans by lectin and Toll-like receptors. The
Journal of Clinical Investigation 116 (6): 1642-1650.
Netea, M.G., Brown, G.D., Kullberg, B.J., Gow, N.A. 2008. An integrated model of
the recognition of Candida albicans by the innate immune system. Nature Reviews
Microbiology 6 (1): 67-78.
Newman, S.L., Bucher, C., Rhodes, J., Bullock, W.E. 1990. Phagocytosis of
Histoplasma capsulatum yeasts and microconidia by human cultured macrophages and
alveolar macrophages. Cellular cytoskeleton requirement for attachment and ingestion.
The Journal of Clinical Investigation 85 (1): 223-230.
Newman, S.L., Holly, A. 2001. Candida albicans is phagocytosed, killed, and
processed for antigen presentation by human dendritic cells. Infection and Immunity 69
(11): 6813-6822.
Nisbet, A.D., Saundry, R.H., Moir, A.J., Fothergill, L.A., Fothergill, J.E. 1981. The
complete amino-acid sequence of hen ovalbumin. European Journal of Biochemistry
115 (2): 335-345.
Norbury, C.C., Hewlett, L.J., Prescott, A.R., Shastri, N., Watts, C. 1995. Class I
MHC presentation of exogenous soluble antigen via macropinocytosis in bone marrow
macrophages. Immunity 3 (6): 793-791.
References
212
Ojo, L.R., O'Loughlin, R.E., Cohen, A.L., Loo, J.D., Edmond, K.M., Shetty, S.S.,
Bear, A.P., Privor-Dumm, L., et al. 2010. Global use of Haemophilus influenzae type
b conjugate vaccine. Vaccine 28 (43): 7117-7122.
Orlean, P., Menon, A.K. 2007. GPI anchoring of protein in yeast and mammalian
cells, or: how we learned to stop worrying and love glycophospholipids. Journal of
Lipid Research 48: 993-1011.
Ouyang, W., Rutz, S., Crellin, N.K., Valdez, P.A., Hymowitz, S.G. 2011. Regulation
and functions of the IL-10 family of cytokines in inflammation and disease. Annual
Review of Immunology 29: 71-109.
Pálffy, R., Gardlík, R., Hodosy, J., Behuliak, M., Reško, P, Radvánský, J., Celec, P.
2006. Bacteria in gene therapy: bactofection versus alternative gene therapy. Gene
Therapy 13 (2): 101–105.
Pålsson-McDermott, E.M., O'Neill, L.A. 2004. Signal transduction by the
lipopolysaccharide receptor, Toll-like receptor-4. Immunology 113 (2): 153-162.
Pan, Z.K., Ikonomidis, G., Lazenby, A., Pardoll, D., Paterson, Y. 1995. A
recombinant Listeria monocytogenes vaccine expressing a model tumour antigen
protects mice against lethal tumour cell challenge and causes regression of established
tumours. Nature Medicine 1 (5): 471-477.
Parlati, F., Dominguez, M., Bergeron, J.J., Thomas, D.Y. 1995. Saccharomyces
cerevisiae CNE1 encodes an endoplasmic reticulum (ER) membrane protein with
sequence similarity to calnexin and calreticulin and functions as a constituent of the ER
quality control apparatus. The Journal of Biological Chemistry 270 (1): 244-253.
Petrovsky, N., Aguilar, J.C. 2004. Vaccine adjuvants: Current state and future trends.
Immunology and Cell Biology 82 (5): 488-496.
Pfeifer, J.D., Wick, M.J., Roberts, R.L., Findlay, K., Normark, S.J., Harding, C.V.
1993. Phagocytic processing of bacterial antigens for class I MHC presentation to T
cells. Nature 361 (6410): 359-362.
Phelan, M.C. 2007. Techniques for mammalian cell tissue culture. In: Costa, L.G,
Davila, J.C., Lawrence, D.A., Reed, D.J., ed. Current Protocols in Toxicology, John
Wiley & Sons, Inc., New York.
References
213
Picker, L.J., Singh, M.K., Zdraveski, Z., Treer, J.R., Waldrop, S.L., Bergstresser,
P.R., Maino, V.C. 1995. Direct demonstration of cytokine synthesis heterogeneity
among human memory/effector T cells by flow cytometry. Blood 86 (4): 1408-1419.
Pietrella, D., Corbucci, C., Perito, S., Bistoni, G., Vecchiarelli, A. 2005.
Mannoproteins from Cryptococcus neoformans promote dendritic cell maturation and
activation. Infection and Immunity 73 (2): 820–827.
Poland G.A., Jacobson R.M. 2004. Clinical practice: prevention of hepatitis B with the
hepatitis B vaccine. The New England Jounal of Medicine 351 (27): 2832-2838.
Powilleit, F. 2004. Entwicklung viraler Expressiossysteme und deren
Anwendungsmöglichkeiten in Hefe. Dissertation. Molecular and Cell Biology, Saarland
University.
Powilleit, F., Breinig, T., Schmitt, M.J. 2007. Exploiting the yeast L-A viral capsid for
the in vivo assembly of chimeric VLPs as platform in vaccine development and foreign
protein expression. PLoS One 2 (5): e415.
Porro, D., Sauer, M., Branduardi, P., Mattanovich, D. 2005. Recombinant protein
production in yeasts. Molecular Biotechnology 31 (3): 245-259.
Qi, C., Cai, Y., Gunn, L., Ding, C., Li, B., Kloecker, G., Qian, K., Vasilakos, J., et
al. 2011. Differential pathways regulating innate and adaptive anti-tumor immune
responses by particulate and soluble yeast-derived β-glucans. Blood 117 (25): 6825-
6836.
Rajalingam, D., Loftis, C., Xu, J.J., Kumar, T.K. 2009. Trichloroacetic acid-induced
protein precipitation involves the reversible association of a stable partially structured
intermediate. Protein Science 18 (5): 980-993.
Ramakrishna, V., Treml, J.F., Vitale, L., Connolly, J.E., O'Neill, T., Smith, P.A.,
Jones, C.L., He, L.Z., Goldstein, J., et al. 2004. Mannose receptor targeting of tumor
antigen pmel17 to human dendritic cells directs anti-melanoma T cell responses via
multiple HLA molecules. The Journal of Immunology 172 (5): 2845-2852.
Rani, P.G., Bachhawat, K., Misquith, S., Surolia, A. 1999. Thermodynamic Studies
of Saccharide Binding to Artocarpin, a B-Cell Mitogen, Reveals the Extended Nature of
Its Interaction with Mannotriose [3,6-Di-O-(a-D-mannopyranosyl)-D-mannose]. The
Journal of Biological Chemistry 274 (42): 29694–29698.
References
214
Rappleye, C.A., Eissenberg, L.G., Goldman, W.E. 2007. Histoplasma capsulatum
alpha-(1,3)-glucan blocks innate immune recognition by the beta-glucan receptor.
Proceedings of the National Academy of Sciences of the USA 104 (4): 1366-1370.
Reis e Sousa, C. 2006. Dendritic cells in a mature age. Nature Reviews Immunology 6
(6): 476-483.
Remondo, C., Cereda, V., Mostböck, S., Sabzevari, H., Franzusoff, A., Schlom, J.,
Tsang, K.Y. 2009. Human dendritic cell maturation and activation by a heat-killed
recombinant yeast (Saccharomyces cerevisiae) vector encoding carcinoembryonic
antigen. Vaccine 27 (7): 987-994.
Rescigno, M., Citterio, S., Thèry, C., Rittig, M., Medaglini, D., Pozzi, G.,
Amigorena, S., Ricciardi-Castagnoli, P. 1998. Bacteria-induced neo-biosynthesis,
stabilization, and surface expression of functional class I molecules in mouse dendritic
cells. Proceedings of the National Academy of Sciences of the USA 95 (9): 5229-5234.
Riddell, S.R., Rabin, M., Geballe, A.P., Britt, W.J., Greenberg, P.D. 1991. Class I
MHC-restricted cytotoxic T lymphocyte recognition of cells infected with human
cytomegalovirus does not require endogenous viral gene expression. The Journal of
Immunology 46 (8): 2795-2804.
Riemann, H., Takao, J., Shellman, Y.G., Hines, W.A., Edwards, C.K. 3rd,
Franzusoff, A., Norris, D.A., Fujita, M. 2007. Generation of a prophylactic melanoma
vaccine using whole recombinant yeast expressing MART-1. Experimental
Dermatology 16 (10): 814-822.
Rizza, P., Moretti, F., Belardelli, F. 2010. Recent advances on the immunomodulatory
effects of IFN-α: implications for cancer immunotherapy and autoimmunity.
Autoimmunity 43 (3): 204-209.
Rocha, N., Neefjes, J. 2008. MHC class II molecules on the move for successful
antigen presentation. The EMBO Journal 27 (1): 1–5.
Rocha, B., Tanchot, C. 2004. Towards a cellular definition of CD8+ T-cell memory:
the role of CD4+ T-cell help in CD8+ T-cell responses. Current Opinion in Immunology
16 (3): 259-263.
Rock, K.L. 2003. The ins and outs of cross-presentation. Nature Immunology 4 (10):
941-943.
References
215
Rock, K.L., Shen, L. 2005. Cross-presentation: underlying mechanisms and role in
immune surveillance. Immunological Reviews 207: 166-183.
Rodrigues, M.L., Alvarez, M., Fonseca, F.L., Casadevall, A. 2008. Binding of the
wheat germ lectin to Cryptococcus neoformans suggests an association of chitinlike
structures with yeast budding and capsular glucuronoxylomannan. Eukaryotic Cell 7
(4): 602-609.
Rodriguez, A., Regnault, A., Kleijmeer, M., Ricciardi-Castagnoli, P., Amigorena,
S. 1999. Selective transport of internalized antigens to the cytosol for MHC class I
presentation in dendritic cells. Nature Cell Biology 1 (6): 362-368.
Rogers, N.C., Slack, E.C., Edwards, A.D., Nolte, M.A., Schulz, O., Schweighoffer,
E., Williams, D.L., Gordon, S., et al. 2005. Syk-dependent cytokine induction by
Dectin-1 reveals a novel pattern recognition pathway for C-type lectins. Immunity 22
(4): 507–517.
Romani, L. 2004. Immunity to fungal infections. Nature Reviews Immunology 4 (1): 1-
23.
Romani, L. 2011. Immunity to fungal infections. Nature Reviews Immunology 11 (4):
275-288.
Ross, G.D., Cain, J.A., Lachmann, P.J. 1985. Membrane complement receptor type
three (CR3) has lectin-like properties analogous to bovine conglutinin as functions as a
receptor for zymosan and rabbit erythrocytes as well as a receptor for iC3b. The Journal
of Immunology 134 (5): 3307-3315.
Rötzschke, O., Falk, K., Stevanović, S., Jung, G., Walden, P., Rammensee, H.G.
1991. Exact prediction of a natural T cell epitope. European Journal of Immunology 21
(11): 2891-2894.
Rowe, H.M., Lopes, L., Ikeda Y., Bailey R., Barde, I., Zenke, M., Chain, B.M.,
Collins, M.K. 2006. Immunization with a lentiviral vector stimulates both CD4 and
CD8 T cell responses to an ovalbumin transgene. Molecular Therapy 13 (2): 310-319.
Rudolf, M.P., Fausch, S.C., Da Silva, D.M., Kast, W.M. 2001. Human dendritic cells
are activated by chimeric human papillomavirus type-16 virus-like particles and induce
epitope-specific human T cell responses in vitro. The Journal of Immunology 166 (10):
5917-5924.
References
216
Rush, C., Mitchell, T., Garside, P. 2002. Efficient priming of CD4+ and CD8+ T cells
by DNA vaccination depends on appropriate targeting of sufficient levels of
immunologically relevant antigen to appropriate processing pathways. The Journal of
Immunology 169: 4951-4960.
Russell, P., Nurse, P. 1986. Schizosaccharomyces pombe and Saccharomyces
cerevisiae: a look at yeasts divided. Cell 45: 781-782.
Sabat, R., Grütz, G., Warszawska, K., Kirsch, S., Witte, E., Wolk, K., Geginat, J.
2010. Biology of interleukin-10. Cytokine & Growth Factor Reviews 21 (5): 331-344.
Saiki, M., Sakai, K., Saiki, S., Kitagawa, Y., Nakanishi, M., Hirose, G. 2005.
Induction of humoral responses specific for paraneoplastic cerebellar degeneration-
associated antigen by whole recombinant yeast immunization. Journal of Autoimmunity
24 (3): 203-208.
Saiki, R.K., Scharf, S., Faloona, F., Mullis, K.B., Horn, G.T., Erlich, H.A.,
Arnheim, N. 1985. Enzymatic amplification of β-globin genomic sequences and
restriction site analysis for diagnosis of sickle cell anemia. Science 230 (4732): 1350-
1354.
Sallusto, F., Cella, M., Danieli, C., Lanzavecchia, A. 1995. Dendritic cells use
macropinocytosis and the mannose receptor to concentrate macromolecules in the major
histocompatibility complex class II compartment: downregulation by cytokines and
bacterial products. The Journal of Experimental Medicine 182: 389-400.
Sallusto, F., Lanzavecchia, A. 1994. Efficient presentation of soluble antigen by
cultured human dendritic cells is maintained by granulocyte/macrophage colony-
stimulating factor plus interleukin 4 and downregulated by tumor necrosis factor α. The
Journal of Experimental Medicine 179: 1109-1118.
Sambrook, J., Fritsch, E.F., Maniatis, T. 1989. Molecular cloning: A laboratory
manual. 2nd edition. Cold Spring Harbor, New York.
Sanger, F., Nicklen, S., Coulson, A.R. 1977. DNA sequencing with chain-terminating
inhibitors. Proceedings of the National Academy of Sciences of the USA 74 (12): 5463-
5467.
Scheller, N., Furtwangler, R., Sester, U., Maier, R., Breinig, T., Meyerhans, A.
2008. Human cytomegalovirus protein pp65: an efficient protein carrier system into
human dendritic cells. Gene Therapy 15: 318-325.
References
217
Schiestl R.H., Gietz R.D. 1989. High efficiency transformation of intact yeast cells
using single stranded nucleic acids as a carrier. Current Genetics 16 (5-6): 339-346.
Schleiss, M. 2005. Progress in Cytomegalovirus Vaccine Development. Herpes 12 (3):
66-75.
Schmitt, M.J. 1995. Cloning and expression of a cDNA copy of the viral K28 killer
toxin gene in yeast. Molecular & General Genetics 246 (2): 236-246.
Schmitt, M.J., Tipper, D.J. 1995. Sequence of the M28 dsRNA: preprotoxin is
processed to an α/β heterodimeric protein toxin. Virology 213 (2): 341–351.
Schreuder, M.P., Brekelmans, S., Van Den Ende, H., Klis, F.M. 1993. Targeting of a
heterologous protein to the cell wall of Saccharomyces cerevisiae. Yeast 9 (4): 399-409.
Schreuder, M.P., Deent, C., Boersma, W.J.A., Pouwels, P.H., Klis, F.M. 1996a.
Yeast expressing hepatitis B virus surface antigen determinants on its surface:
implications for a possible oral vaccine. Vaccine 14 (5): 383-388.
Schreuder, M.P., Mooren, A.T.A., Toschka, H.Y., Verrips, C.T., Klis, F.M. 1996b.
Immobilizing proteins on the surface of yeast cells. Trends in Biotechnology 14 (4):
115-120.
Schumacher, A. 2001. Herstellung und Einsatz von pp65 (HCMV)-exprimierenden
Hefen zur antigenspezifischen T-Zellaktivierung. Diplomarbeit. Molecular and Cell
Biology, Saarland University.
Schumacher, T., Ruehland, C., Roedel, F., Reiser, C.O.A, Hess, J., Schultheiss, C.,
Brinkman, M., Reichel, C. 2007. Advanced antigen delivery of murine survivin:
chimeric virus-like particles in cancer vaccine research. International Journal of
Biomedical Science 3 (3): 199-205.
Sendzik, T. 2006. Identifizierung essentieller Komponenten des intrazellulären
Transports eines viralen A/B-Toxins der Hefe. Dissertation. Molecular and Cell
Biology, Saarland University.
Sester, M., Sester, U., Gärtner, B., Heine, G., Girndt, M., Mueller-Lantzsch, N.,
Meyerhans, A., Köhler, H. 2001. Levels of virus-specific CD4 T cells correlate with
cytomegalovirus control and predict virus-induced disease after renal transplantation.
Transplantation 71 (9): 1287-1294.
References
218
Shen, L., Rock, K.L. 2004. Cellular protein is the source of cross-priming antigen in
vivo. Proceedings of the National Academy of Sciences of the USA 101 (9): 3035-3040.
Sheng, K.C., Pouniotis, D.S., Wright, M.D., Tang, C.K., Lazoura, E., Pietersz,
G.A., Apostolopoulos, V. 2006. Mannan derivatives induce phenotypic and functional
maturation of mouse dendritic cells. Immunology 118 (3): 372-383.
Shibata, Y., Metzger, W.J., Myrvik, Q.N. 1997. Chitin particle-induced cell-mediated
immunity is inhibited by soluble mannan: mannose receptor-mediated phagocytosis
initiates IL-12 production. The Journal of Immunology 159 (5): 2462-2467.
Sicard, D., Legras, J.L. 2011. Bread, beer and wine: yeast domestication in the
Saccharomyces sensu stricto complex. Comptes Rendus Biologies 334 (3): 229-236.
Sietsma, J.H., Wessels, J.G. 1990. The occurrence of glucosaminoglycan in the wall of
Schizosaccharomyces pombe. Journal of General Microbiology 136 (11): 2261-2265.
Sijts, A.J., Neisig, A., Neefjes, J., Pamer, E.G. 1996. Two Listeria monocytogenes
CTL epitopes are processed from the same antigen with different efficiencies. The
Journal of Immunology 156 (2): 683-692.
Simizu, B., Abe, S., Yamamoto, H., Tano, Y., Ota, Y., Miyazawa, M., Horie, H.,
Satoh, K., Wakabayashi K. 2006. Development of inactivated poliovirus vaccine
derived from Sabin strains. Biologicals 34 (2): 151-154.
Smith, J.W.G. 1969. Diphtheria and tetanus toxoids. British Medical Bulletin 25 (2):
177-182.
Smith, R.A., Duncan, M.J., Moir, D.T. 1985. Heterologous protein secretion from
yeast. Science 229 (4719): 1219-1224.
So, L.L., Goldstein, I.J. 1968. Protein-carbohydrate interaction. 13. The interaction of
concanavalin A with α-mannans from a variety of microorganisms. Journal of
Biological Chemistry 243 (8): 2003-2007.
Solache, A., Morgan, C.L., Dodi, A.I., Morte, C., Scott, I., Baboonian, C., Zal, B.,
Goldman, J., et al. 1999. Identification of three HLA-A*0201-restricted cytotoxic T
cell epitopes in the cytomegalovirus protein pp65 that are conserved between eight
strains of the virus. The Journal of Immunology 163 (10): 5512- 5518.
Soussi, N., Milon, G., Colle, J.H., Mougneau, E., Glaichenhaus, N., Goossens, P.L.
2000. Listeria monocytogenes as a short-lived delivery system for the induction of type
References
219
1 cell-mediated immunity against the p36/LACK antigen of Leishmania major.
Infection and Immunity 68 (3): 1498-1506.
Sreekrishna, K., Nelles, L., Potenz, R., Cruze, J., Mazzaferro, P., Fish, W., Fuke,
M., Holden, K., et al. 1989. High-level expression, purification, and characterization of
recombinant human tumor necrosis factor synthesized in the methylotrophic yeast
Pichia pastoris. Biochemistry 28 (9): 4117-4125.
Stahl, P., Schlesinger, P.H., Sigardson, E., Rodman, J.S., Lee, Y.C. 1980. Receptor-
mediated pinocytosis of mannose glycoconjugates by macrophages: characterization
and evidence for receptor recycling. Cell 19 (1): 207-215.
Steele, C., Marrero, L., Swain, S., Harmsen, A.G., Zheng, M., Brown, G.D.,
Gordon, S., Shellito, J.E., Kolls, J.K. 2003. Alveolar macrophage-mediated killing of
Pneumocystis carinii f. sp. muris involves molecular recognition by the Dectin-1 beta-
glucan receptor. The Journal of Experimental Medicine 198 (11): 1677-1688.
Steinman, R.M, Swanson, J. 1995. The Endocytic Activity of Dendritic Cells. The
Journal of Experimental Medicine 182: 283-288.
Stevens, D.A., Clemons, K.V., Liu, M. 2011. Developing a vaccine against
aspergillosis. Medical Mycology 49 (1): S170-176.
Stewart, T.S., Mendershausen, P.B., Ballou, CE. 1968. Preparation of a
mannopentaose, mannohexaose, and mannoheptaose from Saccharomyces cerevisiae
mannan. Biochemistry 7 (5): 1843-1854.
Stubbs, A.C., Martin, K.S., Coeshott, C., Skaates, S.V., Kuritzkes, D.R., Bellgrau,
D., Franzusoff, A., Duke, R.C., Wilson, C.C. 2001. Whole recombinant yeast vaccine
activates dendritic cells and elicits protective cell-mediated immunity. Nature Medicine
7 (5): 625-629.
Suni, M.A., Picker, L.J., Maino, V.C. 1998. Detection of antigen-specific T cell
cytokine expression in whole blood by flow cytometry. Journal of Immunological
Methods 212: 89-98.
Suzuki, I., Hashimoto, K., Ohno, N., Tanaka, H., Yadomae, T. 1989.
Immunomodulation by orally administered beta-glucan in mice. International Journal
of Immunopharmacology 11 (7): 761-769.
References
220
Suzuki, T., Ohno, N., Ohshima, Y., Yadomae, T. 1998. Soluble mannan and beta-
glucan inhibit the uptake of Malassezia furfur by human monocytic cell line, THP-1.
FEMS Immunology and Medical Microbiology 21 (3): 223-230.
Syme, R.M., Spurrell, J.C.L., Amankwah, E.K., Green, F.H.Y., Mody, C.H. 2002.
Primary dendritic cells phagocytose Cryptococcus neoformans via mannose receptors
and Fcγ receptor II for presentation to T lymphocytes. Infection and Immunity, 70 (11):
5972–5981.
Szabo, S.J., Kim, S.T., Costa, G.L., Zhang, X., Fathman, C.G., Glimcher, L.H.
2000. A novel transcription factor, T-bet, directs Th1 lineage commitment. Cell 100 (6):
655-669.
Tabi, Z., Moutaftsi, M., Borysiewicz, L.K. 2001. Human cytomegalovirus pp65- and
immediate early 1 antigen-specific HLA class I-restricted cytotoxic T cell responses
induced by cross-presentation of viral antigens. The Journal of Immunology 166 (9):
5695-5703.
Tan M.C., Mommaas A.M., Drijfhout J.W., Jordens R., Onderwater J.J.,
Verwoerd D., Mulder A.A., van der Heiden A.N., et al. 1997. Mannose receptor-
mediated uptake of antigens strongly enhances HLA class II-restricted antigen
presentation by cultured dendritic cells. European Journal of Immunology 27 (9): 2426-
2435.
Tanaka, A., Jensen, J.D., Prado, R., Riemann, H., Shellman, Y.G., Norris, D.A.,
Chin, L., Yee, C., Fujita, M. 2011. Whole recombinant yeast vaccine induces
antitumor immunity and improves survival in a genetically engineered mouse model of
melanoma. Gene Therapy 18 (8): 827–834.
Taylor, P.R., Brown, G.D., Reid, D.M., Willment, J.A., Martinez-Pomares, L.,
Gordon, S., Wong, S.Y.C. 2002. The β-glucan receptor, Dectin-1, is predominantly
expressed on the surface of cells of the monocyte/macrophage and neutrophil lineages.
The Journal of immunology 169 (7): 3876-3882.
Tercero, J.C., Wickner, R.B. 1992. MAK3 encodes an N-acetyltransferase whose
modification of the L-A gag NH2 terminus is necessary for virus particle assembly. The
Journal of Biological Chemistry 267 (28): 20277-20281.
References
221
Tkacz, J.S., Cybulska, E.B., Lampen, J.O. 1971. Specific staining of wall mannan in
yeast cells with fluorescein-conjugated concanavalin A. Journal of Bacteriology 105
(1): 1-5.
Toda, S., Ishii, N., Okada, E., Kusakabe, K-I., Arai, H., Hamajima, K., Gorai, I.,
Nishioka, K., Okuda, K. 1997. HIV-1-specific cell-mediated immune responses
induced by DNA vaccination were enhanced by mannan-coated liposomes and inhibited
by anti-interferon-y antibody. Immunology 92: 111-117.
Tohda, H., Okada, H., Giga-Hama, Y., Okayama, Kumagai, H. 1994. A copy-
number-controlled expression vector for the fission yeast Schizosaccharomyces pombe.
Gene 150: 275-280.
Thornton, B.P., Vĕtvicka, V., Pitman, M., Goldman, R.C., Ross, G.D. 1996.
Analysis of the sugar specificity and molecular location of the beta-glucan-binding
lectin site of complement receptor type 3 (CD11b/CD18). The Journal of Immunology
156 (3): 1235-1246.
Towbin, H., Staehelin, T., Gordon, J. 1979. Electrophoretic transfer of proteins from
polyacrylamide gels to nitrocellulose sheets: procedure and some applications.
Proceedings of the National Academy of Sciences of the USA. 76 (9): 4350-4354.
Trapani, J.A., Smyth, M.J. 2002. Functional significance of the perforin/granzyme
cell death pathway. Nature Reviews Immunology 2 (10): 735-747.
Trimble, R.B., Lubowski, C., Hauer, C.R. 3rd, Stack, R., McNaughton, L.,
Gemmill, T.R., Kumar, S.A. 2004. Characterization of N- and O-linked glycosylation
of recombinant human bile salt-stimulated lipase secreted by Pichia pastoris.
Glycobiology 14 (3): 265-274.
Tschopp, J.F., Brust, P.F., Cregg, J.M., Stillman, C.A., Gingeras, T.R. 1987
.Expression of the lacZ gene from two methanol-regulated promoters in Pichia pastoris.
Nucleic Acids Research 15 (9): 3859-3876.
Tsoni, S.V., Brown, G.D. 2008. β-Glucans and Dectin-1. Annals of the New York
Academy of Sciences 1143: 45-60.
Tsunetsugu-Yokota, Y., Morikawa, Y., Isogai, M., Kawana-Tachikawa, A.,
Odawara, T., Nakamura, T., Grassi, F., Autran, B., Iwamoto, A. 2003. Yeast-
derived human immunodeficiency virus type 1 p55(gag) virus-like particles activate
References
222
dendritic cells (DCs) and induce perforin expression in Gag-specific CD8(+) T cells by
cross-presentation of DCs. Journal of Virology 77 (19): 10250-10259.
Uccelletti, D., Farina, F., Rufini, S., Magnelli, P., Abeijon, C., Palleschi, C. 2006.
The Kluyveromyces lactis alpha1,6-mannosyltransferase KlOch1p is required for cell-
wall organization and proper functioning of the secretory pathway. FEMS Yeast
Research 6 (3): 449-457.
Underhill, D.M., Rossnagle, E., Lowell, C.A., Simmons, R.M. 2005. Dectin-1
activates Syk tyrosine kinase in a dynamic subset of macrophages for reactive oxygen
production. Blood 106 (7): 2543-2550.
Upadhyaya, B., Manjunath, R. 2009. Baker’s yeast expressing the Japanese
encephalitis virus envelope protein on its cell surface: induction of an antigen-specific
but non-neutralizing antibody response. Yeast 26: 383–397.
Valenzuela, P., Medina, A., Rutter, W.J. 1982. Synthesis and assembly of hepatitis B
virus surface antigen particles in yeast. Nature 298: 347-350.
van Bruggen, R., Drewniak, A., Jansen, M., van Houdt, M., Roos, D., Chapel, H.,
Verhoeven A.J., Kuijpers, T.W. 2009. Complement receptor 3, not Dectin-1, is the
major receptor on human neutrophils for beta-glucan-bearing particles. Molecular
Immunology 47 (2-3): 575-581.
van Ooyen, A.J., Dekker, P., Huang, M., Olsthoorn, M.M., Jacobs, D.I., Colussi,
P.A., Taron, C.H. 2006. Heterologous protein production in the yeast Kluyveromyces
lactis. FEMS Yeast Research 6 (3): 381-392.
van Oss, C.J. 1989. On the mechanism of the cold ethanol precipitation method of
plasma protein fractionation. Journal of Protein Chemistry 8 (5): 661-668.
Varki, A., Cummings R.D., Esko J.D., Freeze, H.H., Stanley, P., Bertozzi, C.R.,
Hart, G.W., Etzler, M.E. 2009. Essentials of glycobiology. 2nd edition. Cold Spring
Harbor, New York.
Vaz-Santiago, J., Lulé, J., Rohrlich, P., Jacquier, C., Gibert, N., Le Roy, E.,
Betbeder, D., Davignon, J.L., Davrinche, C. 2001. Ex vivo stimulation and expansion
of both CD4+ and CD8+ T cells from peripheral blood mononuclear cells of human
cytomegalovirus-seropositive blood donors by using a soluble recombinant chimeric
protein, IE1-pp65. Journal of Virology 75 (17): 7840-7847.
References
223
Verhasselt, V., Buelens, C., Willems, F., De Groote, D., Haeffner-Cavaillon, N.,
Goldman, M. 1997. Bacterial lipopolysaccharide stimulates the production of cytokines
and the expression of costimulatory molecules by human peripheral blood dendritic
cells: evidence for a soluble CD14-dependent pathway. The Journal of Immunology 158
(6): 2919-2925.
Vlahopoulos, S., Boldogh, I., Casola, A., Brasier, A.R. 1999. Nuclear factor-κB–
dependent induction of interleukin-8 gene expression by tumor necrosis factor α:
evidence for an antioxidant sensitive activating pathway distinct from nuclear
translocation. Blood 94 (6): 1878-1889.
Voet, D., Voet, J., Pratt, C.W. 2010. Lehrbuch der Biochemie. 2., aktualisierte und
erweiterte Auflage. Wiley-VCH Verlag GmbH & Co. KGaA, Weinheim.
Wadle A., Held G., Neumann F, Kleber S., Wuellner B., Asemissen A.M.,
Kubuschok B., Scheibenbogen C., et al. 2006. Cross-presentation of HLA class I
epitopes from influenza matrix protein produced in Saccharomyces cerevisiae. Vaccine
24 (37-39): 6272-6281.
Walch, B. 2009. „ Delivery “ funktioneller Nukleinsäuren in Antigen-präsentierende
Säugerzellen mittels rekombinanter Hefen. Dissertation. Molecular and Cell Biology,
Saarland University.
Walch, B., Breinig, T., Schmitt, M.J., Breinig, F. 2011. Delivery of functional DNA
and messenger RNA to mammalian phagocytic cells by recombinant yeast. Gene
Therapy (Epub ahead of print 2011 Aug 25).
Walker, W.S., Gandour, D.M. 1980. Detection and functional assessment of
complement receptors on two murine macrophage-like cell lines. Experimental Cell
Research 129 (1): 15-21.
Wang, M.J., Nissen, M.H., Buus, S., Röpke, C., Claësson, M.H. 2003. Comparison
of CTL reactivity in the spleen and draining lymph nodes after immunization with
peptides pulsed on dendritic cells or mixed with Freund's incomplete adjuvant.
Immunology Letters 90 (1): 13-18.
Wansley, E.K., Chakraborty, M., Hance, K.W., Bernstein, M.B., Boehm, A.L.,
Guo, Z., Quick, D., Franzusoff, A., et al. 2008. Vaccination with a recombinant
Saccharomyces cerevisiae expressing a tumor antigen breaks immune tolerance and
elicits therapeutic antitumor responses. Clinical Cancer Research 14 (13): 4316-4325.
References
224
Weck, M.M., Appel, S., Werth, D., Sinzger, C., Bringmann, A., Grünebach, F.,
Brossart, P. 2008. hDectin-1 is involved in uptake and cross-presentation of cellular
antigens. Blood 111 (8): 4264-4272.
Wellington, M., Dolan, K., Krysan, D.J. 2009. Live Candida albicans suppresses
production of reactive oxygen species in phagocytes. Infection and Immunity 77 (1):
405-413.
Wheeler, R.T., Fink, G.R. 2006. A drug-sensitive genetic network masks fungi from
the immune system. PLoS Pathogens 2(4): e35.
Wickner, R.B. 1996. Double-stranded RNA viruses of Saccharomyces cerevisiae.
Microbiological Reviews 60 (1): 250–265.
Wiedig, C.A., Kramera, U., Garbomb, S., Wolf-Watz H., Autenrieth, I.B. 2005.
Induction of CD8+ T cell responses by Yersinia vaccine carrier strains. Vaccine 23 (42):
4984–4998.
Williams, D.L., Pretus, H.A., McNamee, R.B., Jones, E.L., Ensley, H.E., Browder,
I.W. 1992. Development of a water-soluble, sulfated (1→3)-β-D-glucan biological
response modifier derived from Saccharomyces cerevisiae. Carbohydrate Research
235: 247–257.
Willment, J.A., Brown, G.D. 2007. C-type lectin receptors in antifungal immunity.
Trends in Microbiology 16 (1): 27-32.
Willment, J.A., Gordon, S., Brown, G.D. 2001. Characterization of the human β-
glucan receptor and its alternatively spliced isoforms. The Journal of Biological
Chemistry 276 (47): 43818–43823.
Wills, M.R., Carmichael, A.J., Mynard, K., Jin, X., Weekes, M.P., Placter, B.,
Sissons, J.G.P. 1996. The human cytotoxic T-lymphocyte (CTL) response to
cytomegalovirus is dominated by structural protein pp65: frequency, specificity, and T-
cell receptor usage of pp65-specific CTL. Journal of Virology 70 (11): 7569-7579.
Wixon, J. 2002. Featured organism: Schizosaccharomyces pombe, the fission yeast.
Comparative and Functional Genomics 3(2): 194-204.
References
225
Wood, V., Gwilliam, R., Rajandream, M.A., Lyne, M., Lyne, R., Stewart, A.,
Sgouros, J., Peat, N., et al. 2002. The genome sequence of Schizosaccharomyces
pombe. Nature 415 (6874): 871-880.
Xie, J., Guo, L., Ruan, Y., Zhu, H., Wang, L., Zhou, L., Yun, X., Gu, J. 2010.
Laminarin-mediated targeting to Dectin-1 enhances antigen-specific immune responses.
Biochemical and Biophysical Research Communications 391: 958–962.
Yen, J-H., Kong, W., Ganea, D. 2010. IFN-beta inhibits dendritic cell migration
through STAT-1-mediated transcriptional suppression of CCR7 and matrix
metalloproteinase 9. The Journal of immunology 184 (7): 3478-3486.
Yewdell, J.W., Bennink, J.R. 1989. Brefeldin A specifically inhibits presentation of
protein antigens to cytotoxic T lymphocytes. Science 244 (4908): 1072-1075.
Yokota, K., Takashima, A., Bergstresser, P.R., Ariizumi, K. 2001. Identification of a
human homologue of the dendritic cell-associated C-type lectin-1, dectin-1. Gene 272:
51-60.
Yoshimoto, T., Yoshimoto, T., Yasuda, K., Mizuguchi, J., Nakanishi, K. 2007. IL-
27 suppresses Th2 cell development and Th2 cytokines production from polarized Th2
cells: a novel therapeutic way for Th2-mediated allergic inflammation. The Journal of
Immunology 179 (7): 4415-4423.
Zhang, X., Sun, S., Hwang, I., Tough, D.F., Sprent, J. 1998. Potent and selective
stimulation of memory-phenotype CD8+ in vivo by IL-15. Immunity 8 (5): 591–599.
Zhu, K., Chi, Z., Li, J., Zhang, F., Li, M., Yasoda, H.N., Wu, L. 2006. The surface
display of haemolysin from Vibrio harveyi on yeast cells and their potential applications
as live vaccine in marine fish. Vaccine 24: 6046–6052.
Zimmerman, S.B., Pheiffer, B.H. 1983. Macromolecular crowding allows blunt-end
ligation by DNA ligases from rat liver or Escherichia coli. Proceedings of the National
Academy of Sciences of the USA 80 (19): 5852-5856.
226
VIII. ACKNOWLEDGEMENTS
First of all, I would like to thank Prof. Dr. Manfred Schmitt for giving me the
opportunity to perform this study at his laboratory and to research into a very interesting
topic. I gratefully acknowledge the continuous support, encouragement, guidance and
understanding.
I thank Prof. Dr. Martina Sester for kindly consenting to provide the second expert
report.
I would like to sincerely thank Dr. Frank Breinig for providing the topic of this study,
for the scientific input, valuable suggestions and discussions, for his time and patience.
I am deeply grateful to Nicole Jundel for all the help since the very beginning of my
stay in Germany.
I would like to acknowledge the whole “AG Schmitt” (including former members) for
the friendly working atmosphere and for helping me many times (not only in the lab),
especially Dr. Tina Schöder, Dr. Julia Dausend and Roswitha Schepp.
I am indebted to all blood donors, especially Veronika Witte. Moreover, I thank the
Winterbergklinik (Saarbrücken, Germany) and the Sports Medicine (Saarland
University) for providing blood samples.
Many thanks go to Elisabeth Kenngott and Tobias Bubel for the help with cloning and
expression of pp65 as well as Gag-fusions, respectively. To Elisabeth Kenngott I owe
my sincere gratitude for the opportunity to perform the in vivo experiments at Charité
(Berlin, Germany) and for the help with the Con A-staining.
I would like to thank all members at the Department of Virology (Saarland University
Hospital, Homburg, Germany), especially Dr. Tanja Breinig for exceptional scientific
support, and Utte Gräßer and Tanja Tänzer for the help with the whole blood assays.
I kindly acknowledge Dr. Gernot Geginat for the opportunity to perform the in vitro
antigen presentation assays at the Faculty for Clinical Medicine Mannheim of the
University Heidelberg (Mannheim, Germany), as well as Simone Schenk for excellent
technical assistance.
I would like to express my gratitude to Leon Muijs for the help with confocal laser
scanning microscopy and flow cytometry.

References
227
I am thankful to Birgit Leis and Norbert Pütz (Department of Anatomy, Saarland
University Hospital, Homburg, Germany) for the help with transmission electron
microscopy.
I acknowledge CAPES (Brasília, Brazil) and DAAD for financial support. I extend my
thanks to Maria José Salgado Martinez (DAAD) and Anita Romina (International
Office, Saarland University) for the help with administrative issues.
I also thank my friends for their readinnes to help me and for always giving me
motivation. You know who you are!
Special thanks go to Schwarzenberger family and Marcelo for the never-ending support,
patience, encouragement and for making my stay in Germany extremely enjoyable.
Finally, I would like to thank my family for their support all the time. I cannot express
with words my eternal gratitude.