Collective Oscillations and the Linear and Two-Dimensional Infrared Spectra of Inhomogeneous...
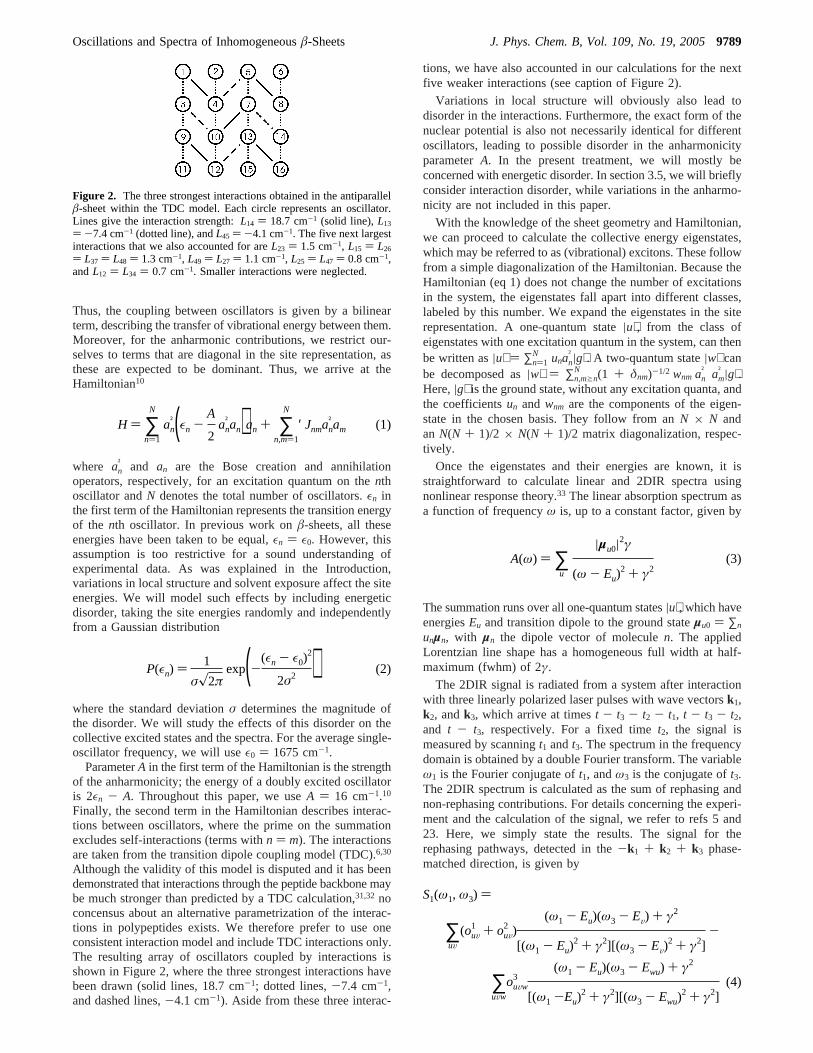
12
Collective Oscillations and the Linear and Two-Dimensional Infrared Spectra of Inhomogeneous -Sheets Arend G. Dijkstra and Jasper Knoester* Institute for Theoretical Physics and Materials Science Centre, UniVersity of Groningen, Nijenborgh 4, 9747 AG Groningen, The Netherlands ReceiVed: December 23, 2004; In Final Form: February 28, 2005 We numerically calculate the collective amide I oscillations and the associated linear and two-dimensional infrared (2DIR) spectra for model antiparallel -sheets and study the effect of inhomogeneity. To visualize the collective vibrational exciton states, a new method is introduced, which proves very useful in classifying the optically dominant states with respect to their symmetry properties and phase relations, even in the absence of exact symmetries. We find that energy (diagonal) and interaction (off-diagonal) disorder may have profoundly different effects on the main peaks in the linear spectrum. We also show that in the 2DIR spectra energy disorder leads to diagonal stretching of the diagonal peaks, while the cross-peaks are typically stretched more horizontally. This offers an explanation for the recently observed overall Z-shape in experimental spectra. Finally, we find that the anharmonic splitting between associated positive and negative features in the 2DIR spectra scales inversely proportionally with the exciton delocalization size imposed by the disorder, thus offering a spectroscopic ruler for this size. 1. Introduction The study of the structure and dynamics of proteins, in relation to their function, is a problem of central importance for our understanding of elementary processes in living organ- isms. X-ray crystallography offers a powerful means to study the structure of complex molecules, 1 but is limited to proteins that can be crystallized and, by its very nature, cannot be applied to proteins in their natural environment. Nuclear magnetic resonance (NMR), in particular, its two-dimensional version, does not rely on crystallization and offers an alternative that has been applied with much success. 2 Drawbacks of NMR are its limited time resolution (millisecond) and its reliance on motional narrowing of the NMR lines due to fast reorientational motion. During the past decade, sparked by the rapidly growing possibilities to control optical and IR pulse sequences at the picosecond and femtosecond time scales, two-dimensional IR (2DIR) and Raman spectroscopies have received increasing attention for the study of molecular structure and dynamics. 3-5 These techniques rely on the structural information contained in (collective) vibrations. In linear (one-dimensional) IR spectra of proteins, this information is often hidden under broad line shapes, resulting from inhomogeneity and the congestion of many vibrational states in a rather narrow spectral region. 6,7 This problem may to some extent be circumvented by performing nonlinear (multipulse) experiments, in which the spectral information is spread along two independent frequency axes, revealing correlations and anharmonic couplings between vari- ous vibrational modes. Moreover, these experiments allow for the observation of relatively weak transitions as cross-peaks with strong transitions and for the detection of relative polarization angles between transitions. 5 Also, these multidimensional techniques facilitate the distinction between homogeneous and inhomogeneous relaxation. 8,9 Over recent years, 2DIR spectroscopy has successfully been applied to a series of small molecules, such as water and small peptides, confirming the potential of the technique to determine structure and dynamics at the molecular level. 10-18 Most recently, several groups have taken up the challenge to study proteins using 2DIR spectroscopy. The most interesting and challenging question is whether this technique may be used to probe the structure of these complex systems and to follow structural changes in real time. To this end, the existence of clear 2DIR markers for structural elements should be investi- gated. The current focus is on searching for markers of secondary structural elements, especially in the amide I region of the spectrum (around 1650 cm -1 ). In this context, theoretical and experimental model studies have been performed of R- and 3 10 -helical structures, 19-22 as well as -sheets and hairpins. 23,24 The theoretical study by Cheatum, Tokmakoff, and Knoester, 23 based on an idealized exciton model for the collective amide I oscillations, suggested that the 2DIR spectrum indeed offers markers for -sheet structure. In particular, it was found that the cross-peaks in this spectrum may be useful to distinguish antiparallel -sheets from parallel ones as well as -hairpins. Recent experiments by Demirdo ¨ven et al., 24 in which poly-L- lysine and proteins with different -sheet content were studied, confirmed the existence of structural markers and the potential of 2DIR spectroscopy to assess the relative -sheet content. Further experimental studies have even demonstrated the first application of 2DIR spectroscopy to detecting the kinetics of thermal denaturing of a protein. 25 Of course, the experimentally observed linear and 2DIR spectra of proteins are considerably more complicated and harder to interpret than the ones obtained in idealized model studies. One reason is that in experiment one probes the entire protein, and not an isolated secondary structural element. Moreover, in * Corresponding author. Fax: 31-50-3634947. E-mail: [email protected]. 9787 J. Phys. Chem. B 2005, 109, 9787-9798 10.1021/jp044141p CCC: $30.25 © 2005 American Chemical Society Published on Web 04/23/2005
Transcript of Collective Oscillations and the Linear and Two-Dimensional Infrared Spectra of Inhomogeneous...
Collective Oscillations and the Linear and Two-Dimensional Infrared Spectra ofInhomogeneousâ-Sheets
Arend G. Dijkstra and Jasper Knoester*Institute for Theoretical Physics and Materials Science Centre, UniVersity of Groningen,Nijenborgh 4, 9747 AG Groningen, The Netherlands
ReceiVed: December 23, 2004; In Final Form: February 28, 2005
We numerically calculate the collective amide I oscillations and the associated linear and two-dimensionalinfrared (2DIR) spectra for model antiparallelâ-sheets and study the effect of inhomogeneity. To visualizethe collective vibrational exciton states, a new method is introduced, which proves very useful in classifyingthe optically dominant states with respect to their symmetry properties and phase relations, even in the absenceof exact symmetries. We find that energy (diagonal) and interaction (off-diagonal) disorder may have profoundlydifferent effects on the main peaks in the linear spectrum. We also show that in the 2DIR spectra energydisorder leads to diagonal stretching of the diagonal peaks, while the cross-peaks are typically stretched morehorizontally. This offers an explanation for the recently observed overall Z-shape in experimental spectra.Finally, we find that the anharmonic splitting between associated positive and negative features in the 2DIRspectra scales inversely proportionally with the exciton delocalization size imposed by the disorder, thusoffering a spectroscopic ruler for this size.
1. Introduction
The study of the structure and dynamics of proteins, inrelation to their function, is a problem of central importancefor our understanding of elementary processes in living organ-isms. X-ray crystallography offers a powerful means to studythe structure of complex molecules,1 but is limited to proteinsthat can be crystallized and, by its very nature, cannot be appliedto proteins in their natural environment. Nuclear magneticresonance (NMR), in particular, its two-dimensional version,does not rely on crystallization and offers an alternative thathas been applied with much success.2 Drawbacks of NMR areits limited time resolution (millisecond) and its reliance onmotional narrowing of the NMR lines due to fast reorientationalmotion.
During the past decade, sparked by the rapidly growingpossibilities to control optical and IR pulse sequences at thepicosecond and femtosecond time scales, two-dimensional IR(2DIR) and Raman spectroscopies have received increasingattention for the study of molecular structure and dynamics.3-5
These techniques rely on the structural information containedin (collective) vibrations. In linear (one-dimensional) IR spectraof proteins, this information is often hidden under broad lineshapes, resulting from inhomogeneity and the congestion ofmany vibrational states in a rather narrow spectral region.6,7 Thisproblem may to some extent be circumvented by performingnonlinear (multipulse) experiments, in which the spectralinformation is spread along two independent frequency axes,revealing correlations and anharmonic couplings between vari-ous vibrational modes. Moreover, these experiments allow forthe observation of relatively weak transitions as cross-peaks withstrong transitions and for the detection of relative polarizationangles between transitions.5 Also, these multidimensional
techniques facilitate the distinction between homogeneous andinhomogeneous relaxation.8,9
Over recent years, 2DIR spectroscopy has successfully beenapplied to a series of small molecules, such as water and smallpeptides, confirming the potential of the technique to determinestructure and dynamics at the molecular level.10-18 Mostrecently, several groups have taken up the challenge to studyproteins using 2DIR spectroscopy. The most interesting andchallenging question is whether this technique may be used toprobe the structure of these complex systems and to followstructural changes in real time. To this end, the existence ofclear 2DIR markers for structural elements should be investi-gated. The current focus is on searching for markers ofsecondary structural elements, especially in the amide I regionof the spectrum (around 1650 cm-1). In this context, theoreticaland experimental model studies have been performed ofR- and310-helical structures,19-22 as well asâ-sheets and hairpins.23,24
The theoretical study by Cheatum, Tokmakoff, and Knoester,23
based on an idealized exciton model for the collective amide Ioscillations, suggested that the 2DIR spectrum indeed offersmarkers forâ-sheet structure. In particular, it was found thatthe cross-peaks in this spectrum may be useful to distinguishantiparallelâ-sheets from parallel ones as well asâ-hairpins.Recent experiments by Demirdo¨ven et al.,24 in which poly-L-lysine and proteins with differentâ-sheet content were studied,confirmed the existence of structural markers and the potentialof 2DIR spectroscopy to assess the relativeâ-sheet content.Further experimental studies have even demonstrated the firstapplication of 2DIR spectroscopy to detecting the kinetics ofthermal denaturing of a protein.25
Of course, the experimentally observed linear and 2DIRspectra of proteins are considerably more complicated and harderto interpret than the ones obtained in idealized model studies.One reason is that in experiment one probes the entire protein,and not an isolated secondary structural element. Moreover, in* Corresponding author. Fax: 31-50-3634947. E-mail: [email protected].
9787J. Phys. Chem. B2005,109,9787-9798
10.1021/jp044141p CCC: $30.25 © 2005 American Chemical SocietyPublished on Web 04/23/2005
a real protein, those elements are never ideal. Reproducible aswell as random inhomogeneity occurs in the eigenenergies ofthe individual amide I oscillators (diagonal disorder) and thetransfer interactions between them (off-diagonal disorder) as aresult of conformational irregularity (for instance, twisting ofthe sheet) and random solvent shifts. An important source ofdiagonal disorder (on the order of tens of reciprocal centimeters)is the effect of hydrogen bonding with surrounding proticmolecules in the solvent.10,26-28 The effects of random diagonaldisorder on the linear29 and 2DIR10 spectra of globular proteinshave been considered, while in addition, the effects of confor-mational disorder on the linear spectra ofâ-sheets have beenmodeled.24
It is the goal of this paper to perform a systematic study ofthe effect of random disorder on the linear and 2DIR spectra ofmodel antiparallelâ-sheets. Deliberately, we focus on a simplemodel, in which we still treat the sheet as an idealized plane(finite) lattice and incorporate the disorder in a phenomenologi-cal way, instead of taking coordinates for specific proteins fromNMR experiments and generating disorder distributions frommolecular dynamics simulations. We believe our approach ismost useful to investigate the existence of generic spectroscopicmarkers forâ-sheet content, which should not depend too muchon the details of the model.
In addition to investigating the one- and two-dimensionalspectra, we also pay considerable attention to the nature of theunderlying collective vibrational states. In ref 23, it was shownthat for homogeneous antiparallelâ-hairpins the opticallydominant states can be related in a simple way to the (basic)collective oscillations of a single unit cell, consisting of fouroscillators. These four basic states are distinguished by therelative phases of the four oscillators. For extendedâ-sheets,such an identification was argued to be harder, but still wastentatively made for two optically important states (the|a-⟩ and the |a+⟩ states). Hard evidence for this was notgiven, however. The question concerning the nature of thestates gained interest with the clear detection of two dominantspectral peaks in experiment (named the|R-⟩ and|R+⟩ states).24
In this paper, we introduce a new visualization method ofcollective states that facilitates and clarifies their proper as-signment.
This paper is organized as follows. In section 2, we introducethe model and give the expressions for the spectra in terms ofone- and two-quantum eigenstates. Section 3 presents our resultsand discussion concerning the nature of the one-quantumeigenstates and the linear spectrum. Homogeneous systems areconsidered in sections 3.1-3.3, while the effects of disorderare the subject of sections 3.4 (diagonal disorder) and 3.5 (off-diagonal disorder). We then switch to a discussion of simulated2DIR spectra in the presence of disorder (section 4) anddemonstrate that this spectrum may be used as an experimentalruler for the exciton delocalization size. Finally, we concludein section 5.
2. Model and Expressions for the Spectra
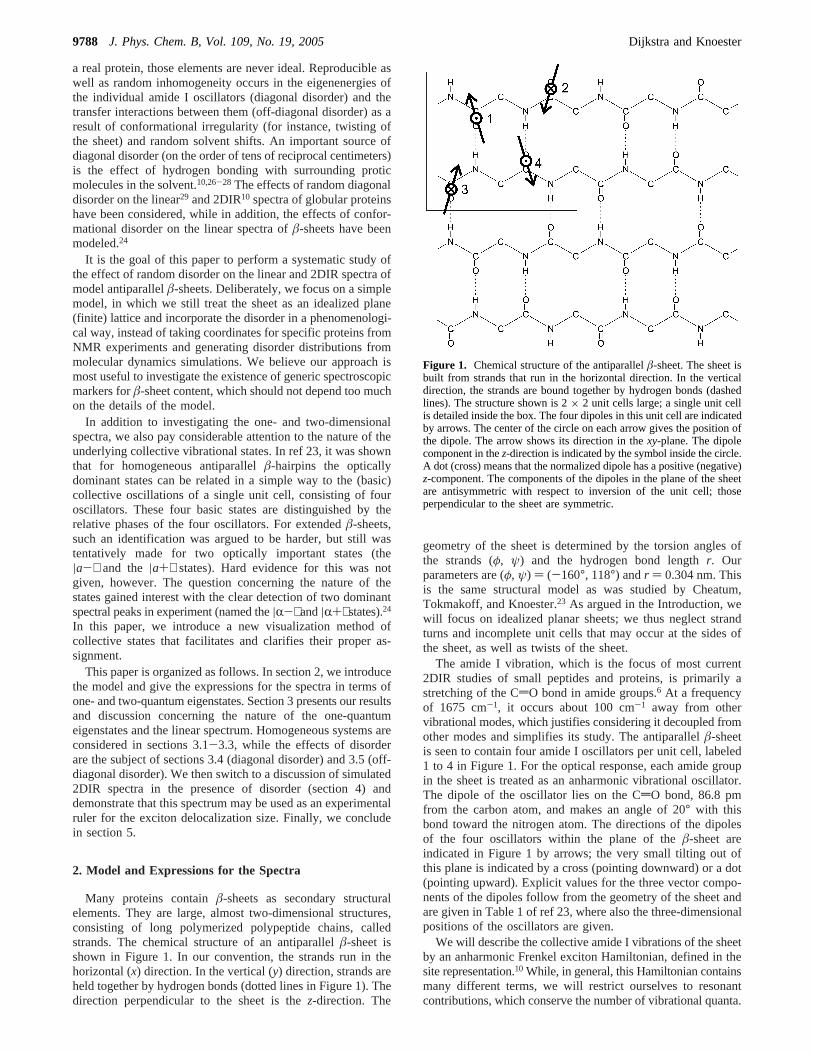
Many proteins containâ-sheets as secondary structuralelements. They are large, almost two-dimensional structures,consisting of long polymerized polypeptide chains, calledstrands. The chemical structure of an antiparallelâ-sheet isshown in Figure 1. In our convention, the strands run in thehorizontal (x) direction. In the vertical (y) direction, strands areheld together by hydrogen bonds (dotted lines in Figure 1). Thedirection perpendicular to the sheet is thez-direction. The
geometry of the sheet is determined by the torsion angles ofthe strands (φ, ψ) and the hydrogen bond lengthr. Ourparameters are (φ, ψ) ) (-160°, 118°) andr ) 0.304 nm. Thisis the same structural model as was studied by Cheatum,Tokmakoff, and Knoester.23 As argued in the Introduction, wewill focus on idealized planar sheets; we thus neglect strandturns and incomplete unit cells that may occur at the sides ofthe sheet, as well as twists of the sheet.
The amide I vibration, which is the focus of most current2DIR studies of small peptides and proteins, is primarily astretching of the CdO bond in amide groups.6 At a frequencyof 1675 cm-1, it occurs about 100 cm-1 away from othervibrational modes, which justifies considering it decoupled fromother modes and simplifies its study. The antiparallelâ-sheetis seen to contain four amide I oscillators per unit cell, labeled1 to 4 in Figure 1. For the optical response, each amide groupin the sheet is treated as an anharmonic vibrational oscillator.The dipole of the oscillator lies on the CdO bond, 86.8 pmfrom the carbon atom, and makes an angle of 20° with thisbond toward the nitrogen atom. The directions of the dipolesof the four oscillators within the plane of theâ-sheet areindicated in Figure 1 by arrows; the very small tilting out ofthis plane is indicated by a cross (pointing downward) or a dot(pointing upward). Explicit values for the three vector compo-nents of the dipoles follow from the geometry of the sheet andare given in Table 1 of ref 23, where also the three-dimensionalpositions of the oscillators are given.
We will describe the collective amide I vibrations of the sheetby an anharmonic Frenkel exciton Hamiltonian, defined in thesite representation.10 While, in general, this Hamiltonian containsmany different terms, we will restrict ourselves to resonantcontributions, which conserve the number of vibrational quanta.
Figure 1. Chemical structure of the antiparallelâ-sheet. The sheet isbuilt from strands that run in the horizontal direction. In the verticaldirection, the strands are bound together by hydrogen bonds (dashedlines). The structure shown is 2× 2 unit cells large; a single unit cellis detailed inside the box. The four dipoles in this unit cell are indicatedby arrows. The center of the circle on each arrow gives the position ofthe dipole. The arrow shows its direction in thexy-plane. The dipolecomponent in thez-direction is indicated by the symbol inside the circle.A dot (cross) means that the normalized dipole has a positive (negative)z-component. The components of the dipoles in the plane of the sheetare antisymmetric with respect to inversion of the unit cell; thoseperpendicular to the sheet are symmetric.
9788 J. Phys. Chem. B, Vol. 109, No. 19, 2005 Dijkstra and Knoester
Thus, the coupling between oscillators is given by a bilinearterm, describing the transfer of vibrational energy between them.Moreover, for the anharmonic contributions, we restrict our-selves to terms that are diagonal in the site representation, asthese are expected to be dominant. Thus, we arrive at theHamiltonian10
where an† and an are the Bose creation and annihilation
operators, respectively, for an excitation quantum on thenthoscillator andN denotes the total number of oscillators.εn inthe first term of the Hamiltonian represents the transition energyof the nth oscillator. In previous work onâ-sheets, all theseenergies have been taken to be equal,εn ) ε0. However, thisassumption is too restrictive for a sound understanding ofexperimental data. As was explained in the Introduction,variations in local structure and solvent exposure affect the siteenergies. We will model such effects by including energeticdisorder, taking the site energies randomly and independentlyfrom a Gaussian distribution
where the standard deviationσ determines the magnitude ofthe disorder. We will study the effects of this disorder on thecollective excited states and the spectra. For the average single-oscillator frequency, we will useε0 ) 1675 cm-1.
ParameterA in the first term of the Hamiltonian is the strengthof the anharmonicity; the energy of a doubly excited oscillatoris 2εn - A. Throughout this paper, we useA ) 16 cm-1.10
Finally, the second term in the Hamiltonian describes interac-tions between oscillators, where the prime on the summationexcludes self-interactions (terms withn ) m). The interactionsare taken from the transition dipole coupling model (TDC).6,30
Although the validity of this model is disputed and it has beendemonstrated that interactions through the peptide backbone maybe much stronger than predicted by a TDC calculation,31,32 noconcensus about an alternative parametrization of the interac-tions in polypeptides exists. We therefore prefer to use oneconsistent interaction model and include TDC interactions only.The resulting array of oscillators coupled by interactions isshown in Figure 2, where the three strongest interactions havebeen drawn (solid lines, 18.7 cm-1; dotted lines,-7.4 cm-1,and dashed lines,-4.1 cm-1). Aside from these three interac-
tions, we have also accounted in our calculations for the nextfive weaker interactions (see caption of Figure 2).
Variations in local structure will obviously also lead todisorder in the interactions. Furthermore, the exact form of thenuclear potential is also not necessarily identical for differentoscillators, leading to possible disorder in the anharmonicityparameterA. In the present treatment, we will mostly beconcerned with energetic disorder. In section 3.5, we will brieflyconsider interaction disorder, while variations in the anharmo-nicity are not included in this paper.
With the knowledge of the sheet geometry and Hamiltonian,we can proceed to calculate the collective energy eigenstates,which may be referred to as (vibrational) excitons. These followfrom a simple diagonalization of the Hamiltonian. Because theHamiltonian (eq 1) does not change the number of excitationsin the system, the eigenstates fall apart into different classes,labeled by this number. We expand the eigenstates in the siterepresentation. A one-quantum state|u⟩, from the class ofeigenstates with one excitation quantum in the system, can thenbe written as|u⟩ ) ∑n)1
N unan†|g⟩. A two-quantum state|w⟩ can
be decomposed as|w⟩ ) ∑n,mgnN (1 + δnm)-1/2 wnm an
† am† |g⟩.
Here,|g⟩ is the ground state, without any excitation quanta, andthe coefficientsun and wnm are the components of the eigen-state in the chosen basis. They follow from anN × N andan N(N + 1)/2 × N(N + 1)/2 matrix diagonalization, respec-tively.
Once the eigenstates and their energies are known, it isstraightforward to calculate linear and 2DIR spectra usingnonlinear response theory.33 The linear absorption spectrum asa function of frequencyω is, up to a constant factor, given by
The summation runs over all one-quantum states|u⟩, which haveenergiesEu and transition dipole to the ground stateµu0 ) ∑n
unµn, with µn the dipole vector of moleculen. The appliedLorentzian line shape has a homogeneous full width at half-maximum (fwhm) of 2γ.
The 2DIR signal is radiated from a system after interactionwith three linearly polarized laser pulses with wave vectorsk1,k2, andk3, which arrive at timest - t3 - t2 - t1, t - t3 - t2,and t - t3, respectively. For a fixed timet2, the signal ismeasured by scanningt1 andt3. The spectrum in the frequencydomain is obtained by a double Fourier transform. The variableω1 is the Fourier conjugate oft1, andω3 is the conjugate oft3.The 2DIR spectrum is calculated as the sum of rephasing andnon-rephasing contributions. For details concerning the experi-ment and the calculation of the signal, we refer to refs 5 and23. Here, we simply state the results. The signal for therephasing pathways, detected in the-k1 + k2 + k3 phase-matched direction, is given by
Figure 2. The three strongest interactions obtained in the antiparallelâ-sheet within the TDC model. Each circle represents an oscillator.Lines give the interaction strength:L14 ) 18.7 cm-1 (solid line), L13
) -7.4 cm-1 (dotted line), andL45 ) -4.1 cm-1. The five next largestinteractions that we also accounted for areL23 ) 1.5 cm-1, L15 ) L26
) L37 ) L48 ) 1.3 cm-1, L49 ) L27 ) 1.1 cm-1, L25 ) L47 ) 0.8 cm-1,andL12 ) L34 ) 0.7 cm-1. Smaller interactions were neglected.
A(ω) ) ∑u
|µu0|2γ
(ω - Eu)2 + γ2
(3)
S1(ω1, ω3) )
∑uV
(ouV1 + ouV
2 )(ω1 - Eu)(ω3 - EV) + γ2
[(ω1 - Eu)2 + γ2][(ω3 - EV)
2 + γ2]-
∑uVw
ouVw3
(ω1 - Eu)(ω3 - Ewu) + γ2
[(ω1 -Eu)2 + γ2][(ω3 - Ewu)
2 + γ2](4)
H ) ∑n)1
N
an†(εn -
A
2an
†an)an + ∑n,m)1
N
′ Jnman†am (1)
P(εn) ) 1
σx2πexp(-
(εn - ε0)2
2σ2 ) (2)
Oscillations and Spectra of Inhomogeneousâ-Sheets J. Phys. Chem. B, Vol. 109, No. 19, 20059789
The non-rephasing diagrams, radiated in the+k1 - k2 + k3
direction, yield
In these expressions, the summations overu andV run over allone-quantum states, the summation overw extends over all two-quantum states, and Eab ≡ Ea - Eb. The above expressions werederived under the assumption thatt2 ) 0, which experimentallymeans that the second and third pulses overlap in time. Thesignals from rephasing and non-rephasing diagrams are addedto obtain the 2DIR correlation spectrum:S(ω1, ω3) ) S1(ω1,ω3) + S2(ω1, ω3).5
The factorsoi in the above expressions forS1 andS2 are theorientational parts of the response functions, which account forthe specific combination of pulse polarizations, transition dipoleorientations, orientational averaging, and orientational relaxationduring the experiment. As in ref 23, we will neglect orientationalrelaxation. As pointed out by Woutersen and Hamm,11 evenfor small peptides, molecular rotation is much slower than thetime scale of the experiment. Calculating the orientational factorsis then a straightforward, albeit tedious, algebraic exercise. Theresponse functions contain four inner products between anelectric field vector and a transition dipole. The first three ofthese derive from the interaction between the polarized inputfields and theâ-sheet, while the fourth one accounts for theinteraction with the polarized heterodyne detection field. Weaveraged this product of four inner products over an iso-tropic distribution of orientations of theâ-sheet, neglecting, asstated, the possible effects of reorientation during the experi-ment.
To be specific, we have calculated spectra in theZZYY-polarization for which the third pulse (polarized in the labora-tory’s Y-direction) is perpendicular to the first and second pulses(polarized in theZ-direction), while theY-component of thesignal is detected. The results for the orientational functions inthe ZZYY-polarization are
Here,µu andµV are the transition dipoles between the groundstate and the one-quantum states|u⟩ and|V⟩, as introduced beloweq 3, whileµwu is the transition dipole between|u⟩ and the two-quantum state|w⟩ (analogous forµwV). The latter dipole is easilyexpressed in terms of the eigenvectorsun andwnm. In the aboveexpressions, we have normalized the electric field vectors tounity.
3. Results and Discussion: Linear Spectra andOne-Quantum Eigenstates
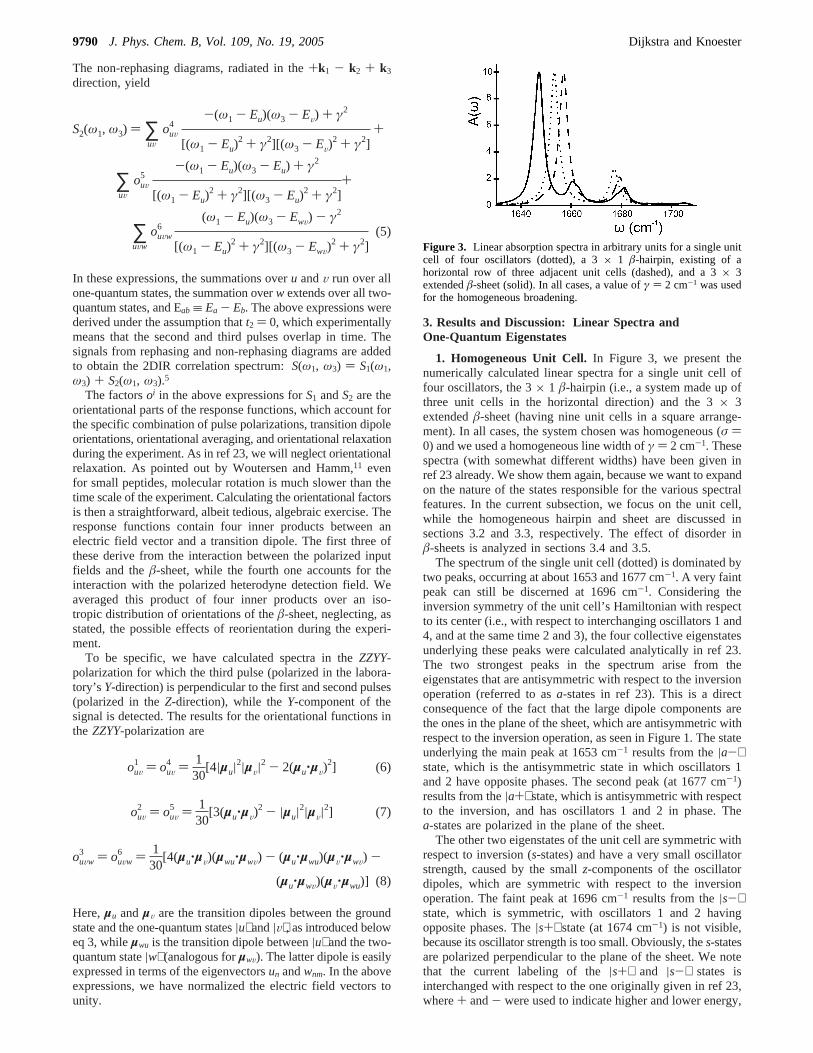
1. Homogeneous Unit Cell.In Figure 3, we present thenumerically calculated linear spectra for a single unit cell offour oscillators, the 3× 1 â-hairpin (i.e., a system made up ofthree unit cells in the horizontal direction) and the 3× 3extendedâ-sheet (having nine unit cells in a square arrange-ment). In all cases, the system chosen was homogeneous (σ )0) and we used a homogeneous line width ofγ ) 2 cm-1. Thesespectra (with somewhat different widths) have been given inref 23 already. We show them again, because we want to expandon the nature of the states responsible for the various spectralfeatures. In the current subsection, we focus on the unit cell,while the homogeneous hairpin and sheet are discussed insections 3.2 and 3.3, respectively. The effect of disorder inâ-sheets is analyzed in sections 3.4 and 3.5.
The spectrum of the single unit cell (dotted) is dominated bytwo peaks, occurring at about 1653 and 1677 cm-1. A very faintpeak can still be discerned at 1696 cm-1. Considering theinversion symmetry of the unit cell’s Hamiltonian with respectto its center (i.e., with respect to interchanging oscillators 1 and4, and at the same time 2 and 3), the four collective eigenstatesunderlying these peaks were calculated analytically in ref 23.The two strongest peaks in the spectrum arise from theeigenstates that are antisymmetric with respect to the inversionoperation (referred to asa-states in ref 23). This is a directconsequence of the fact that the large dipole components arethe ones in the plane of the sheet, which are antisymmetric withrespect to the inversion operation, as seen in Figure 1. The stateunderlying the main peak at 1653 cm-1 results from the|a-⟩state, which is the antisymmetric state in which oscillators 1and 2 have opposite phases. The second peak (at 1677 cm-1)results from the|a+⟩ state, which is antisymmetric with respectto the inversion, and has oscillators 1 and 2 in phase. Thea-states are polarized in the plane of the sheet.
The other two eigenstates of the unit cell are symmetric withrespect to inversion (s-states) and have a very small oscillatorstrength, caused by the smallz-components of the oscillatordipoles, which are symmetric with respect to the inversionoperation. The faint peak at 1696 cm-1 results from the|s-⟩state, which is symmetric, with oscillators 1 and 2 havingopposite phases. The|s+⟩ state (at 1674 cm-1) is not visible,because its oscillator strength is too small. Obviously, thes-statesare polarized perpendicular to the plane of the sheet. We notethat the current labeling of the|s+⟩ and |s-⟩ states isinterchanged with respect to the one originally given in ref 23,where+ and- were used to indicate higher and lower energy,
S2(ω1, ω3) ) ∑uV
ouV4
-(ω1 - Eu)(ω3 - EV) + γ2
[(ω1 - Eu)2 + γ2][(ω3 - EV)
2 + γ2]+
∑uV
ouV5
-(ω1 - Eu)(ω3 - Eu) + γ2
[(ω1 - Eu)2 + γ2][(ω3 - Eu)
2 + γ2]+
∑uVw
ouVw6
(ω1 - Eu)(ω3 - EwV) - γ2
[(ω1 - Eu)2 + γ2][(ω3 - EwV)
2 + γ2](5)
ouV1 ) ouV
4 ) 130
[4|µu|2|µV|2 - 2(µu‚µV)2] (6)
ouV2 ) ouV
5 ) 130
[3(µu‚µV)2 - |µu|2|µV|2] (7)
ouVw3 ) ouVw
6 ) 130
[4(µu‚µV)(µwu‚µwV) - (µu‚µwu)(µV‚µwV) -
(µu‚µwV)(µV‚µwu)] (8)
Figure 3. Linear absorption spectra in arbitrary units for a single unitcell of four oscillators (dotted), a 3× 1 â-hairpin, existing of ahorizontal row of three adjacent unit cells (dashed), and a 3× 3extendedâ-sheet (solid). In all cases, a value ofγ ) 2 cm-1 was usedfor the homogeneous broadening.
9790 J. Phys. Chem. B, Vol. 109, No. 19, 2005 Dijkstra and Knoester
respectively. For the optically dominanta-states, this does notaffect the labels.
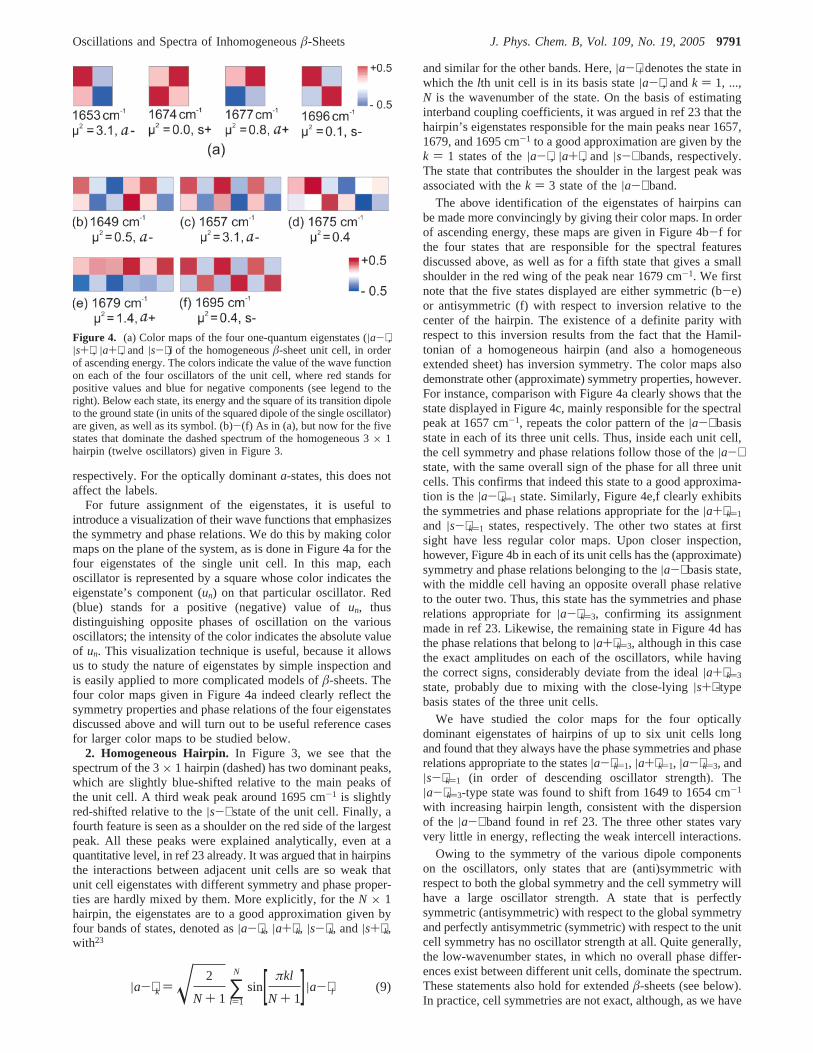
For future assignment of the eigenstates, it is useful tointroduce a visualization of their wave functions that emphasizesthe symmetry and phase relations. We do this by making colormaps on the plane of the system, as is done in Figure 4a for thefour eigenstates of the single unit cell. In this map, eachoscillator is represented by a square whose color indicates theeigenstate’s component (un) on that particular oscillator. Red(blue) stands for a positive (negative) value ofun, thusdistinguishing opposite phases of oscillation on the variousoscillators; the intensity of the color indicates the absolute valueof un. This visualization technique is useful, because it allowsus to study the nature of eigenstates by simple inspection andis easily applied to more complicated models ofâ-sheets. Thefour color maps given in Figure 4a indeed clearly reflect thesymmetry properties and phase relations of the four eigenstatesdiscussed above and will turn out to be useful reference casesfor larger color maps to be studied below.
2. Homogeneous Hairpin. In Figure 3, we see that thespectrum of the 3× 1 hairpin (dashed) has two dominant peaks,which are slightly blue-shifted relative to the main peaks ofthe unit cell. A third weak peak around 1695 cm-1 is slightlyred-shifted relative to the|s-⟩ state of the unit cell. Finally, afourth feature is seen as a shoulder on the red side of the largestpeak. All these peaks were explained analytically, even at aquantitative level, in ref 23 already. It was argued that in hairpinsthe interactions between adjacent unit cells are so weak thatunit cell eigenstates with different symmetry and phase proper-ties are hardly mixed by them. More explicitly, for theN × 1hairpin, the eigenstates are to a good approximation given byfour bands of states, denoted as|a-⟩k, |a+⟩k, |s-⟩k, and|s+⟩k,with23
and similar for the other bands. Here,|a-⟩l denotes the state inwhich thelth unit cell is in its basis state|a-⟩, andk ) 1, ...,N is the wavenumber of the state. On the basis of estimatinginterband coupling coefficients, it was argued in ref 23 that thehairpin’s eigenstates responsible for the main peaks near 1657,1679, and 1695 cm-1 to a good approximation are given by thek ) 1 states of the|a-⟩, |a+⟩, and |s-⟩ bands, respectively.The state that contributes the shoulder in the largest peak wasassociated with thek ) 3 state of the|a-⟩ band.
The above identification of the eigenstates of hairpins canbe made more convincingly by giving their color maps. In orderof ascending energy, these maps are given in Figure 4b-f forthe four states that are responsible for the spectral featuresdiscussed above, as well as for a fifth state that gives a smallshoulder in the red wing of the peak near 1679 cm-1. We firstnote that the five states displayed are either symmetric (b-e)or antisymmetric (f) with respect to inversion relative to thecenter of the hairpin. The existence of a definite parity withrespect to this inversion results from the fact that the Hamil-tonian of a homogeneous hairpin (and also a homogeneousextended sheet) has inversion symmetry. The color maps alsodemonstrate other (approximate) symmetry properties, however.For instance, comparison with Figure 4a clearly shows that thestate displayed in Figure 4c, mainly responsible for the spectralpeak at 1657 cm-1, repeats the color pattern of the|a-⟩ basisstate in each of its three unit cells. Thus, inside each unit cell,the cell symmetry and phase relations follow those of the|a-⟩state, with the same overall sign of the phase for all three unitcells. This confirms that indeed this state to a good approxima-tion is the|a-⟩k)1 state. Similarly, Figure 4e,f clearly exhibitsthe symmetries and phase relations appropriate for the|a+⟩k)1
and |s-⟩k)1 states, respectively. The other two states at firstsight have less regular color maps. Upon closer inspection,however, Figure 4b in each of its unit cells has the (approximate)symmetry and phase relations belonging to the|a-⟩ basis state,with the middle cell having an opposite overall phase relativeto the outer two. Thus, this state has the symmetries and phaserelations appropriate for|a-⟩k)3, confirming its assignmentmade in ref 23. Likewise, the remaining state in Figure 4d hasthe phase relations that belong to|a+⟩k)3, although in this casethe exact amplitudes on each of the oscillators, while havingthe correct signs, considerably deviate from the ideal|a+⟩k)3
state, probably due to mixing with the close-lying|s+⟩-typebasis states of the three unit cells.
We have studied the color maps for the four opticallydominant eigenstates of hairpins of up to six unit cells longand found that they always have the phase symmetries and phaserelations appropriate to the states|a-⟩k)1, |a+⟩k)1, |a-⟩k)3, and|s-⟩k)1 (in order of descending oscillator strength). The|a-⟩k)3-type state was found to shift from 1649 to 1654 cm-1
with increasing hairpin length, consistent with the dispersionof the |a-⟩ band found in ref 23. The three other states varyvery little in energy, reflecting the weak intercell interactions.
Owing to the symmetry of the various dipole componentson the oscillators, only states that are (anti)symmetric withrespect to both the global symmetry and the cell symmetry willhave a large oscillator strength. A state that is perfectlysymmetric (antisymmetric) with respect to the global symmetryand perfectly antisymmetric (symmetric) with respect to the unitcell symmetry has no oscillator strength at all. Quite generally,the low-wavenumber states, in which no overall phase differ-ences exist between different unit cells, dominate the spectrum.These statements also hold for extendedâ-sheets (see below).In practice, cell symmetries are not exact, although, as we have
Figure 4. (a) Color maps of the four one-quantum eigenstates (|a-⟩,|s+⟩, |a+⟩, and |s-⟩) of the homogeneousâ-sheet unit cell, in orderof ascending energy. The colors indicate the value of the wave functionon each of the four oscillators of the unit cell, where red stands forpositive values and blue for negative components (see legend to theright). Below each state, its energy and the square of its transition dipoleto the ground state (in units of the squared dipole of the single oscillator)are given, as well as its symbol. (b)-(f) As in (a), but now for the fivestates that dominate the dashed spectrum of the homogeneous 3× 1hairpin (twelve oscillators) given in Figure 3.
|a-⟩k ) x 2
N + 1∑l)1
N
sin[ πkl
N + 1]|a-⟩l (9)
Oscillations and Spectra of Inhomogeneousâ-Sheets J. Phys. Chem. B, Vol. 109, No. 19, 20059791
seen above, for hairpins they survive the intercell interactionsto a very good approximation. Finally, the polarization of thestates is governed entirely by the global symmetry. States thatare antisymmetric (symmetric) with respect to global inversionhave a transition dipole to the ground state that is orientedparallel to (perpendicular to) the plane of the hairpin. In practice,this means that, as for the isolated unit cell, alla-type (s-type)states are polarized parallel (perpendicular) to the plane of thesystem.
3. Homogeneous Sheet.The spectrum of the 3× 3 sheet(solid line in Figure 3) shows more structure than the one forhairpins. The main peak is now red-shifted relative to the|a-⟩state of the unit cell and the feature around 1680 cm-1 appearsto consist of two closely spaced peaks, while a new feature (withsubstructure) has emerged just above 1660 cm-1. The weak peaknear 1700 cm-1 is shifted to the blue relative to the unit celland the hairpin spectrum. As was noted in ref 23, assigning thespectral peaks for extended sheets is more complicated thanfor hairpins. The reason is that in extended sheets stronginteractions exist between unit cells (for instance, the interactionbetween oscillators 7 and 10 in Figure 2 and the interactionsbetween 3 and 9 and between 4 and 10).
First, these stronger interactions lead to wider exciton bandsthan in the case of hairpins, as is clear from the separationbetween highest and lowest peaks in Figure 3. Second, and moreimportantly, as these interactions are not weak relative to theenergy differences between the four eigenstates of the isolatedunit cell, these states will be mixed in extended sheets. Thus,one expects that in extended sheets the intracell parity and phaseproperties are mixed, making it more difficult to associate thespectral peaks with unit cell eigenstates, such as|a(⟩. Despitethis, in ref 23, the dominant state at about 1645 cm-1 wastentatively labeled as an|a-⟩-type state,34 while the one near1680 cm-1 was associated with|a+⟩.
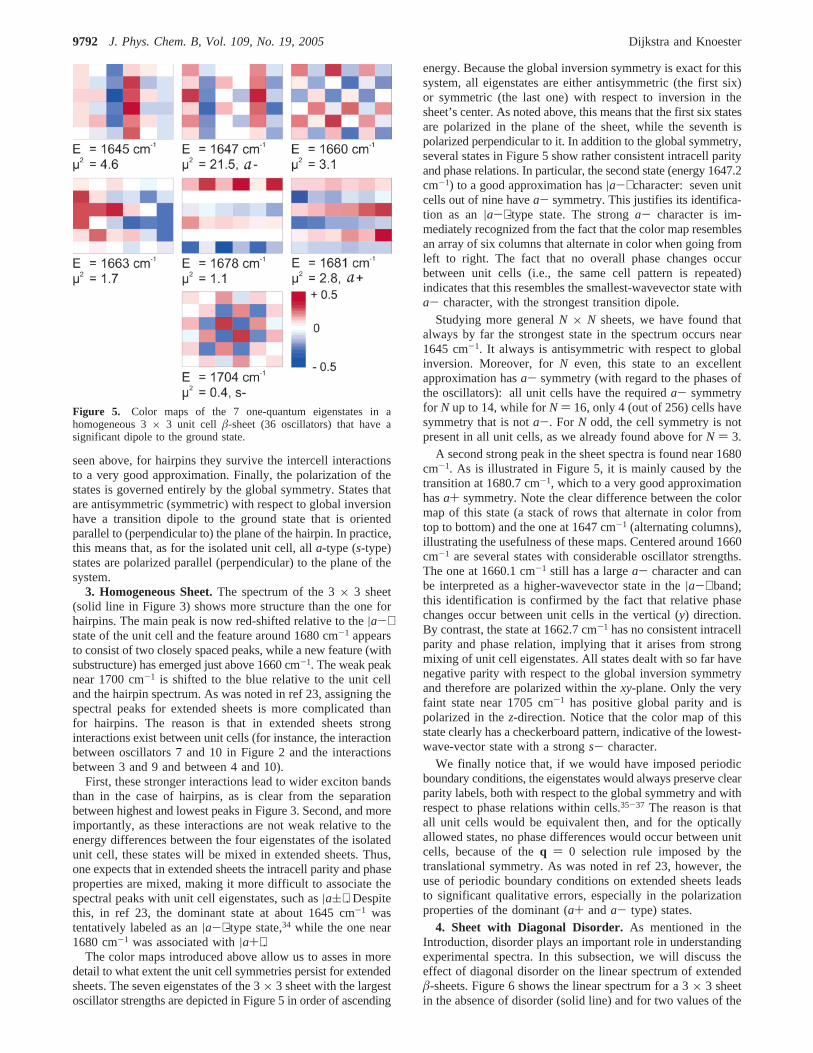
The color maps introduced above allow us to asses in moredetail to what extent the unit cell symmetries persist for extendedsheets. The seven eigenstates of the 3× 3 sheet with the largestoscillator strengths are depicted in Figure 5 in order of ascending
energy. Because the global inversion symmetry is exact for thissystem, all eigenstates are either antisymmetric (the first six)or symmetric (the last one) with respect to inversion in thesheet’s center. As noted above, this means that the first six statesare polarized in the plane of the sheet, while the seventh ispolarized perpendicular to it. In addition to the global symmetry,several states in Figure 5 show rather consistent intracell parityand phase relations. In particular, the second state (energy 1647.2cm-1) to a good approximation has|a-⟩ character: seven unitcells out of nine havea- symmetry. This justifies its identifica-tion as an|a-⟩-type state. The stronga- character is im-mediately recognized from the fact that the color map resemblesan array of six columns that alternate in color when going fromleft to right. The fact that no overall phase changes occurbetween unit cells (i.e., the same cell pattern is repeated)indicates that this resembles the smallest-wavevector state witha- character, with the strongest transition dipole.
Studying more generalN × N sheets, we have found thatalways by far the strongest state in the spectrum occurs near1645 cm-1. It always is antisymmetric with respect to globalinversion. Moreover, forN even, this state to an excellentapproximation hasa- symmetry (with regard to the phases ofthe oscillators): all unit cells have the requireda- symmetryfor N up to 14, while forN ) 16, only 4 (out of 256) cells havesymmetry that is nota-. For N odd, the cell symmetry is notpresent in all unit cells, as we already found above forN ) 3.
A second strong peak in the sheet spectra is found near 1680cm-1. As is illustrated in Figure 5, it is mainly caused by thetransition at 1680.7 cm-1, which to a very good approximationhasa+ symmetry. Note the clear difference between the colormap of this state (a stack of rows that alternate in color fromtop to bottom) and the one at 1647 cm-1 (alternating columns),illustrating the usefulness of these maps. Centered around 1660cm-1 are several states with considerable oscillator strengths.The one at 1660.1 cm-1 still has a largea- character and canbe interpreted as a higher-wavevector state in the|a-⟩ band;this identification is confirmed by the fact that relative phasechanges occur between unit cells in the vertical (y) direction.By contrast, the state at 1662.7 cm-1 has no consistent intracellparity and phase relation, implying that it arises from strongmixing of unit cell eigenstates. All states dealt with so far havenegative parity with respect to the global inversion symmetryand therefore are polarized within thexy-plane. Only the veryfaint state near 1705 cm-1 has positive global parity and ispolarized in thez-direction. Notice that the color map of thisstate clearly has a checkerboard pattern, indicative of the lowest-wave-vector state with a strongs- character.
We finally notice that, if we would have imposed periodicboundary conditions, the eigenstates would always preserve clearparity labels, both with respect to the global symmetry and withrespect to phase relations within cells.35-37 The reason is thatall unit cells would be equivalent then, and for the opticallyallowed states, no phase differences would occur between unitcells, because of theq ) 0 selection rule imposed by thetranslational symmetry. As was noted in ref 23, however, theuse of periodic boundary conditions on extended sheets leadsto significant qualitative errors, especially in the polarizationproperties of the dominant (a+ anda- type) states.
4. Sheet with Diagonal Disorder.As mentioned in theIntroduction, disorder plays an important role in understandingexperimental spectra. In this subsection, we will discuss theeffect of diagonal disorder on the linear spectrum of extendedâ-sheets. Figure 6 shows the linear spectrum for a 3× 3 sheetin the absence of disorder (solid line) and for two values of the
Figure 5. Color maps of the 7 one-quantum eigenstates in ahomogeneous 3× 3 unit cell â-sheet (36 oscillators) that have asignificant dipole to the ground state.
9792 J. Phys. Chem. B, Vol. 109, No. 19, 2005 Dijkstra and Knoester
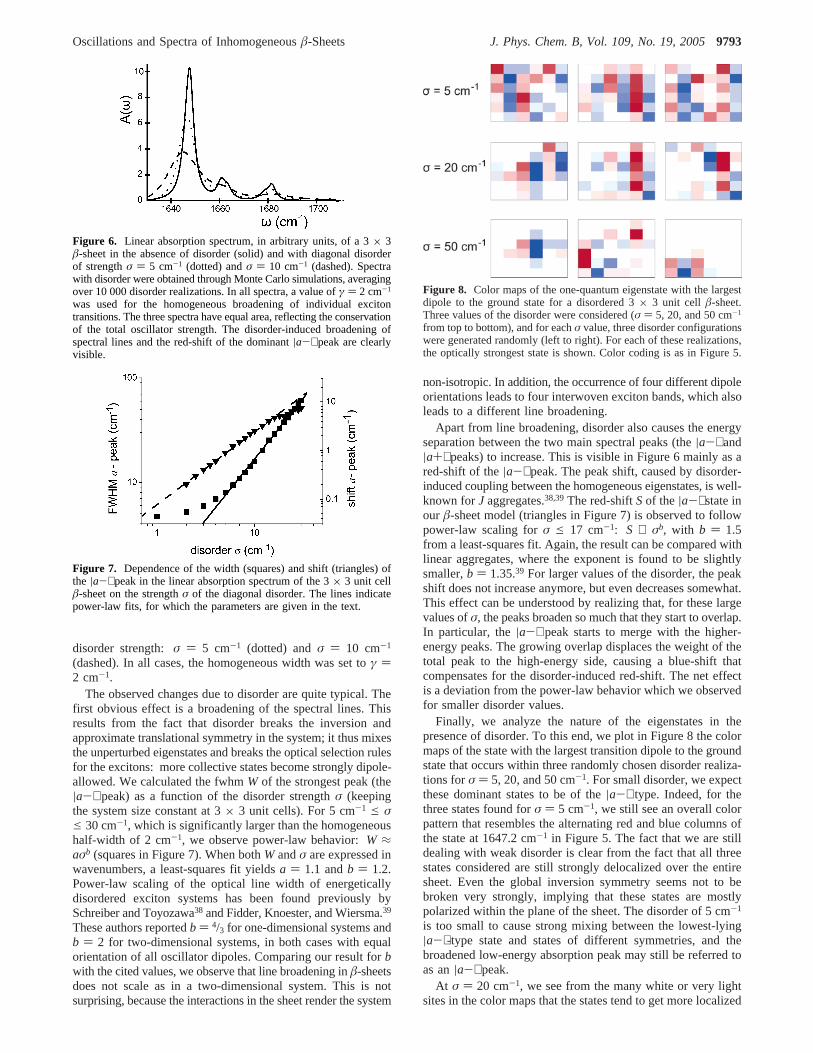
disorder strength:σ ) 5 cm-1 (dotted) andσ ) 10 cm-1
(dashed). In all cases, the homogeneous width was set toγ )2 cm-1.
The observed changes due to disorder are quite typical. Thefirst obvious effect is a broadening of the spectral lines. Thisresults from the fact that disorder breaks the inversion andapproximate translational symmetry in the system; it thus mixesthe unperturbed eigenstates and breaks the optical selection rulesfor the excitons: more collective states become strongly dipole-allowed. We calculated the fwhmW of the strongest peak (the|a-⟩ peak) as a function of the disorder strengthσ (keepingthe system size constant at 3× 3 unit cells). For 5 cm-1 e σe 30 cm-1, which is significantly larger than the homogeneoushalf-width of 2 cm-1, we observe power-law behavior:W ≈aσb (squares in Figure 7). When bothW andσ are expressed inwavenumbers, a least-squares fit yieldsa ) 1.1 andb ) 1.2.Power-law scaling of the optical line width of energeticallydisordered exciton systems has been found previously bySchreiber and Toyozawa38 and Fidder, Knoester, and Wiersma.39
These authors reportedb ) 4/3 for one-dimensional systems andb ) 2 for two-dimensional systems, in both cases with equalorientation of all oscillator dipoles. Comparing our result forbwith the cited values, we observe that line broadening inâ-sheetsdoes not scale as in a two-dimensional system. This is notsurprising, because the interactions in the sheet render the system
non-isotropic. In addition, the occurrence of four different dipoleorientations leads to four interwoven exciton bands, which alsoleads to a different line broadening.
Apart from line broadening, disorder also causes the energyseparation between the two main spectral peaks (the|a-⟩ and|a+⟩ peaks) to increase. This is visible in Figure 6 mainly as ared-shift of the|a-⟩ peak. The peak shift, caused by disorder-induced coupling between the homogeneous eigenstates, is well-known forJ aggregates.38,39The red-shiftSof the |a-⟩ state inour â-sheet model (triangles in Figure 7) is observed to followpower-law scaling forσ e 17 cm-1: S ∝ σb, with b ) 1.5from a least-squares fit. Again, the result can be compared withlinear aggregates, where the exponent is found to be slightlysmaller,b ) 1.35.39 For larger values of the disorder, the peakshift does not increase anymore, but even decreases somewhat.This effect can be understood by realizing that, for these largevalues ofσ, the peaks broaden so much that they start to overlap.In particular, the|a-⟩ peak starts to merge with the higher-energy peaks. The growing overlap displaces the weight of thetotal peak to the high-energy side, causing a blue-shift thatcompensates for the disorder-induced red-shift. The net effectis a deviation from the power-law behavior which we observedfor smaller disorder values.
Finally, we analyze the nature of the eigenstates in thepresence of disorder. To this end, we plot in Figure 8 the colormaps of the state with the largest transition dipole to the groundstate that occurs within three randomly chosen disorder realiza-tions forσ ) 5, 20, and 50 cm-1. For small disorder, we expectthese dominant states to be of the|a-⟩ type. Indeed, for thethree states found forσ ) 5 cm-1, we still see an overall colorpattern that resembles the alternating red and blue columns ofthe state at 1647.2 cm-1 in Figure 5. The fact that we are stilldealing with weak disorder is clear from the fact that all threestates considered are still strongly delocalized over the entiresheet. Even the global inversion symmetry seems not to bebroken very strongly, implying that these states are mostlypolarized within the plane of the sheet. The disorder of 5 cm-1
is too small to cause strong mixing between the lowest-lying|a-⟩-type state and states of different symmetries, and thebroadened low-energy absorption peak may still be referred toas an|a-⟩ peak.
At σ ) 20 cm-1, we see from the many white or very lightsites in the color maps that the states tend to get more localized
Figure 6. Linear absorption spectrum, in arbitrary units, of a 3× 3â-sheet in the absence of disorder (solid) and with diagonal disorderof strengthσ ) 5 cm-1 (dotted) andσ ) 10 cm-1 (dashed). Spectrawith disorder were obtained through Monte Carlo simulations, averagingover 10 000 disorder realizations. In all spectra, a value ofγ ) 2 cm-1
was used for the homogeneous broadening of individual excitontransitions. The three spectra have equal area, reflecting the conservationof the total oscillator strength. The disorder-induced broadening ofspectral lines and the red-shift of the dominant|a-⟩ peak are clearlyvisible.
Figure 7. Dependence of the width (squares) and shift (triangles) ofthe |a-⟩ peak in the linear absorption spectrum of the 3× 3 unit cellâ-sheet on the strengthσ of the diagonal disorder. The lines indicatepower-law fits, for which the parameters are given in the text.
Figure 8. Color maps of the one-quantum eigenstate with the largestdipole to the ground state for a disordered 3× 3 unit cell â-sheet.Three values of the disorder were considered (σ ) 5, 20, and 50 cm-1
from top to bottom), and for eachσ value, three disorder configurationswere generated randomly (left to right). For each of these realizations,the optically strongest state is shown. Color coding is as in Figure 5.
Oscillations and Spectra of Inhomogeneousâ-Sheets J. Phys. Chem. B, Vol. 109, No. 19, 20059793
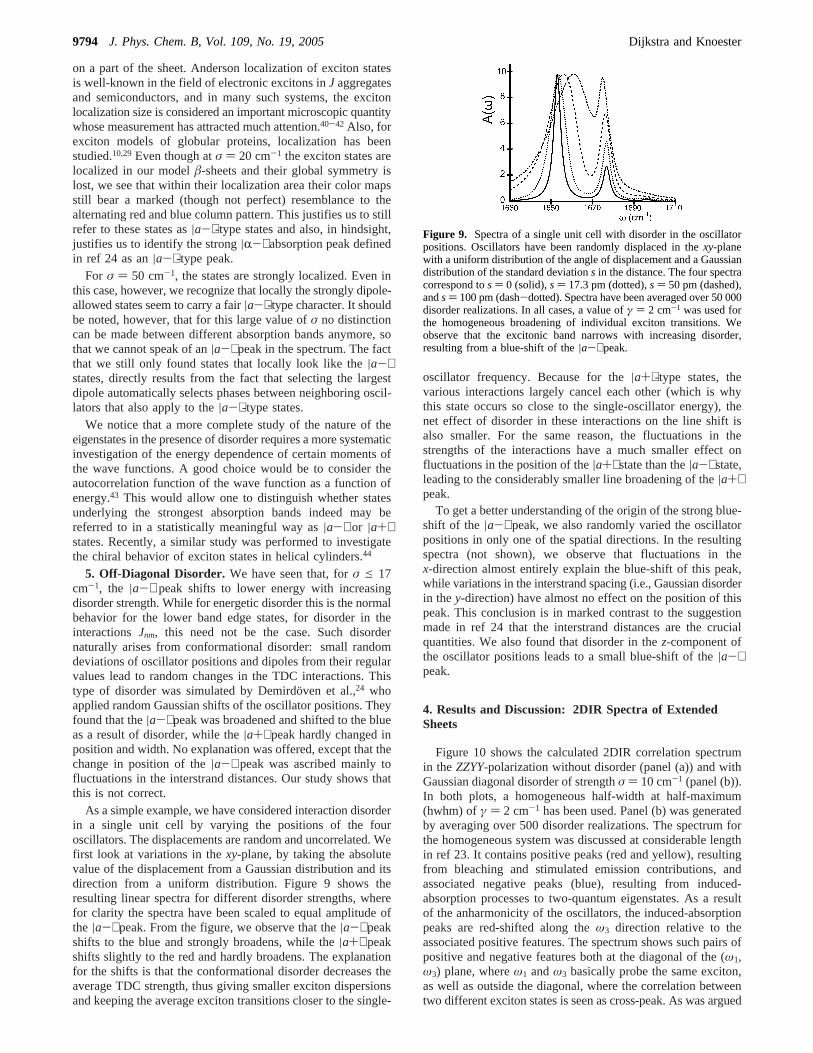
on a part of the sheet. Anderson localization of exciton statesis well-known in the field of electronic excitons inJ aggregatesand semiconductors, and in many such systems, the excitonlocalization size is considered an important microscopic quantitywhose measurement has attracted much attention.40-42 Also, forexciton models of globular proteins, localization has beenstudied.10,29Even though atσ ) 20 cm-1 the exciton states arelocalized in our modelâ-sheets and their global symmetry islost, we see that within their localization area their color mapsstill bear a marked (though not perfect) resemblance to thealternating red and blue column pattern. This justifies us to stillrefer to these states as|a-⟩-type states and also, in hindsight,justifies us to identify the strong|R-⟩ absorption peak definedin ref 24 as an|a-⟩-type peak.
For σ ) 50 cm-1, the states are strongly localized. Even inthis case, however, we recognize that locally the strongly dipole-allowed states seem to carry a fair|a-⟩-type character. It shouldbe noted, however, that for this large value ofσ no distinctioncan be made between different absorption bands anymore, sothat we cannot speak of an|a-⟩ peak in the spectrum. The factthat we still only found states that locally look like the|a-⟩states, directly results from the fact that selecting the largestdipole automatically selects phases between neighboring oscil-lators that also apply to the|a-⟩-type states.
We notice that a more complete study of the nature of theeigenstates in the presence of disorder requires a more systematicinvestigation of the energy dependence of certain moments ofthe wave functions. A good choice would be to consider theautocorrelation function of the wave function as a function ofenergy.43 This would allow one to distinguish whether statesunderlying the strongest absorption bands indeed may bereferred to in a statistically meaningful way as|a-⟩ or |a+⟩states. Recently, a similar study was performed to investigatethe chiral behavior of exciton states in helical cylinders.44
5. Off-Diagonal Disorder. We have seen that, forσ e 17cm-1, the |a-⟩ peak shifts to lower energy with increasingdisorder strength. While for energetic disorder this is the normalbehavior for the lower band edge states, for disorder in theinteractionsJnm, this need not be the case. Such disordernaturally arises from conformational disorder: small randomdeviations of oscillator positions and dipoles from their regularvalues lead to random changes in the TDC interactions. Thistype of disorder was simulated by Demirdo¨ven et al.,24 whoapplied random Gaussian shifts of the oscillator positions. Theyfound that the|a-⟩ peak was broadened and shifted to the blueas a result of disorder, while the|a+⟩ peak hardly changed inposition and width. No explanation was offered, except that thechange in position of the|a-⟩ peak was ascribed mainly tofluctuations in the interstrand distances. Our study shows thatthis is not correct.
As a simple example, we have considered interaction disorderin a single unit cell by varying the positions of the fouroscillators. The displacements are random and uncorrelated. Wefirst look at variations in thexy-plane, by taking the absolutevalue of the displacement from a Gaussian distribution and itsdirection from a uniform distribution. Figure 9 shows theresulting linear spectra for different disorder strengths, wherefor clarity the spectra have been scaled to equal amplitude ofthe |a-⟩ peak. From the figure, we observe that the|a-⟩ peakshifts to the blue and strongly broadens, while the|a+⟩ peakshifts slightly to the red and hardly broadens. The explanationfor the shifts is that the conformational disorder decreases theaverage TDC strength, thus giving smaller exciton dispersionsand keeping the average exciton transitions closer to the single-
oscillator frequency. Because for the|a+⟩-type states, thevarious interactions largely cancel each other (which is whythis state occurs so close to the single-oscillator energy), thenet effect of disorder in these interactions on the line shift isalso smaller. For the same reason, the fluctuations in thestrengths of the interactions have a much smaller effect onfluctuations in the position of the|a+⟩ state than the|a-⟩ state,leading to the considerably smaller line broadening of the|a+⟩peak.
To get a better understanding of the origin of the strong blue-shift of the |a-⟩ peak, we also randomly varied the oscillatorpositions in only one of the spatial directions. In the resultingspectra (not shown), we observe that fluctuations in thex-direction almost entirely explain the blue-shift of this peak,while variations in the interstrand spacing (i.e., Gaussian disorderin they-direction) have almost no effect on the position of thispeak. This conclusion is in marked contrast to the suggestionmade in ref 24 that the interstrand distances are the crucialquantities. We also found that disorder in thez-component ofthe oscillator positions leads to a small blue-shift of the|a-⟩peak.
4. Results and Discussion: 2DIR Spectra of ExtendedSheets
Figure 10 shows the calculated 2DIR correlation spectrumin theZZYY-polarization without disorder (panel (a)) and withGaussian diagonal disorder of strengthσ ) 10 cm-1 (panel (b)).In both plots, a homogeneous half-width at half-maximum(hwhm) ofγ ) 2 cm-1 has been used. Panel (b) was generatedby averaging over 500 disorder realizations. The spectrum forthe homogeneous system was discussed at considerable lengthin ref 23. It contains positive peaks (red and yellow), resultingfrom bleaching and stimulated emission contributions, andassociated negative peaks (blue), resulting from induced-absorption processes to two-quantum eigenstates. As a resultof the anharmonicity of the oscillators, the induced-absorptionpeaks are red-shifted along theω3 direction relative to theassociated positive features. The spectrum shows such pairs ofpositive and negative features both at the diagonal of the (ω1,ω3) plane, whereω1 andω3 basically probe the same exciton,as well as outside the diagonal, where the correlation betweentwo different exciton states is seen as cross-peak. As was argued
Figure 9. Spectra of a single unit cell with disorder in the oscillatorpositions. Oscillators have been randomly displaced in thexy-planewith a uniform distribution of the angle of displacement and a Gaussiandistribution of the standard deviations in the distance. The four spectracorrespond tos ) 0 (solid),s ) 17.3 pm (dotted),s ) 50 pm (dashed),ands) 100 pm (dash-dotted). Spectra have been averaged over 50 000disorder realizations. In all cases, a value ofγ ) 2 cm-1 was used forthe homogeneous broadening of individual exciton transitions. Weobserve that the excitonic band narrows with increasing disorder,resulting from a blue-shift of the|a-⟩ peak.
9794 J. Phys. Chem. B, Vol. 109, No. 19, 2005 Dijkstra and Knoester
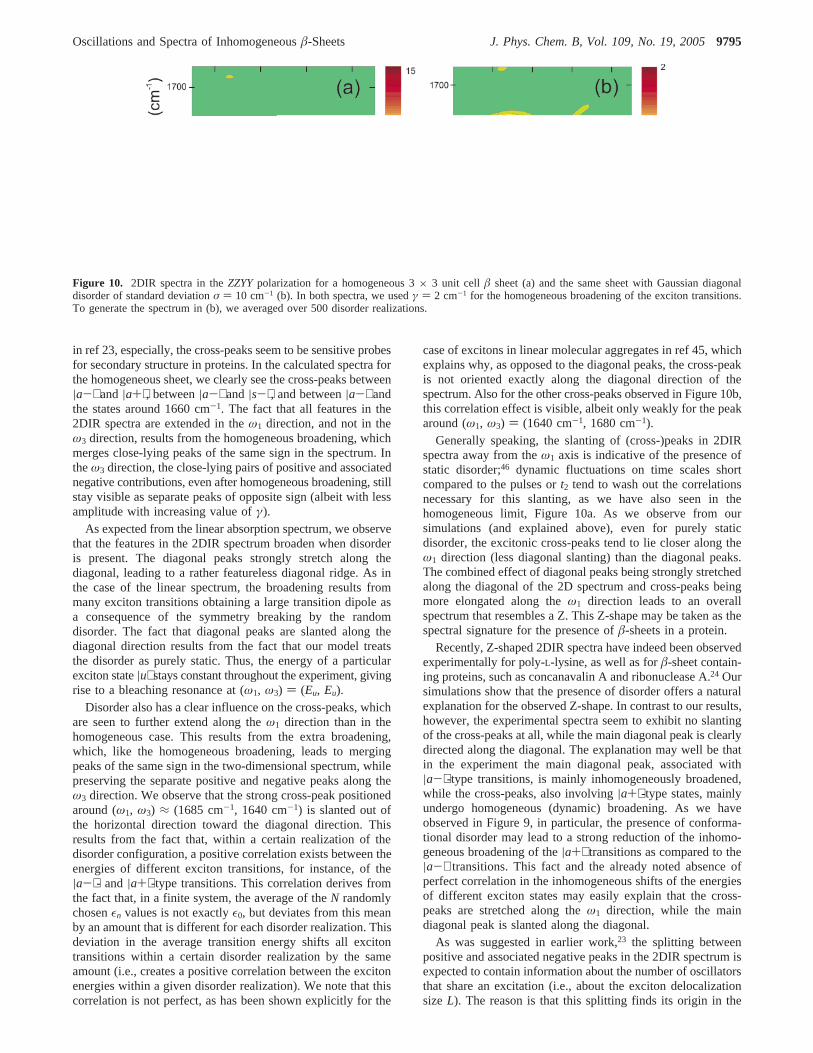
in ref 23, especially, the cross-peaks seem to be sensitive probesfor secondary structure in proteins. In the calculated spectra forthe homogeneous sheet, we clearly see the cross-peaks between|a-⟩ and|a+⟩, between|a-⟩ and|s-⟩, and between|a-⟩ andthe states around 1660 cm-1. The fact that all features in the2DIR spectra are extended in theω1 direction, and not in theω3 direction, results from the homogeneous broadening, whichmerges close-lying peaks of the same sign in the spectrum. Intheω3 direction, the close-lying pairs of positive and associatednegative contributions, even after homogeneous broadening, stillstay visible as separate peaks of opposite sign (albeit with lessamplitude with increasing value ofγ).
As expected from the linear absorption spectrum, we observethat the features in the 2DIR spectrum broaden when disorderis present. The diagonal peaks strongly stretch along thediagonal, leading to a rather featureless diagonal ridge. As inthe case of the linear spectrum, the broadening results frommany exciton transitions obtaining a large transition dipole asa consequence of the symmetry breaking by the randomdisorder. The fact that diagonal peaks are slanted along thediagonal direction results from the fact that our model treatsthe disorder as purely static. Thus, the energy of a particularexciton state|u⟩ stays constant throughout the experiment, givingrise to a bleaching resonance at (ω1, ω3) ) (Eu, Eu).
Disorder also has a clear influence on the cross-peaks, whichare seen to further extend along theω1 direction than in thehomogeneous case. This results from the extra broadening,which, like the homogeneous broadening, leads to mergingpeaks of the same sign in the two-dimensional spectrum, whilepreserving the separate positive and negative peaks along theω3 direction. We observe that the strong cross-peak positionedaround (ω1, ω3) ≈ (1685 cm-1, 1640 cm-1) is slanted out ofthe horizontal direction toward the diagonal direction. Thisresults from the fact that, within a certain realization of thedisorder configuration, a positive correlation exists between theenergies of different exciton transitions, for instance, of the|a-⟩- and |a+⟩-type transitions. This correlation derives fromthe fact that, in a finite system, the average of theN randomlychosenεn values is not exactlyε0, but deviates from this meanby an amount that is different for each disorder realization. Thisdeviation in the average transition energy shifts all excitontransitions within a certain disorder realization by the sameamount (i.e., creates a positive correlation between the excitonenergies within a given disorder realization). We note that thiscorrelation is not perfect, as has been shown explicitly for the
case of excitons in linear molecular aggregates in ref 45, whichexplains why, as opposed to the diagonal peaks, the cross-peakis not oriented exactly along the diagonal direction of thespectrum. Also for the other cross-peaks observed in Figure 10b,this correlation effect is visible, albeit only weakly for the peakaround (ω1, ω3) ) (1640 cm-1, 1680 cm-1).
Generally speaking, the slanting of (cross-)peaks in 2DIRspectra away from theω1 axis is indicative of the presence ofstatic disorder;46 dynamic fluctuations on time scales shortcompared to the pulses ort2 tend to wash out the correlationsnecessary for this slanting, as we have also seen in thehomogeneous limit, Figure 10a. As we observe from oursimulations (and explained above), even for purely staticdisorder, the excitonic cross-peaks tend to lie closer along theω1 direction (less diagonal slanting) than the diagonal peaks.The combined effect of diagonal peaks being strongly stretchedalong the diagonal of the 2D spectrum and cross-peaks beingmore elongated along theω1 direction leads to an overallspectrum that resembles a Z. This Z-shape may be taken as thespectral signature for the presence ofâ-sheets in a protein.
Recently, Z-shaped 2DIR spectra have indeed been observedexperimentally for poly-L-lysine, as well as forâ-sheet contain-ing proteins, such as concanavalin A and ribonuclease A.24 Oursimulations show that the presence of disorder offers a naturalexplanation for the observed Z-shape. In contrast to our results,however, the experimental spectra seem to exhibit no slantingof the cross-peaks at all, while the main diagonal peak is clearlydirected along the diagonal. The explanation may well be thatin the experiment the main diagonal peak, associated with|a-⟩-type transitions, is mainly inhomogeneously broadened,while the cross-peaks, also involving|a+⟩-type states, mainlyundergo homogeneous (dynamic) broadening. As we haveobserved in Figure 9, in particular, the presence of conforma-tional disorder may lead to a strong reduction of the inhomo-geneous broadening of the|a+⟩ transitions as compared to the|a-⟩ transitions. This fact and the already noted absence ofperfect correlation in the inhomogeneous shifts of the energiesof different exciton states may easily explain that the cross-peaks are stretched along theω1 direction, while the maindiagonal peak is slanted along the diagonal.
As was suggested in earlier work,23 the splitting betweenpositive and associated negative peaks in the 2DIR spectrum isexpected to contain information about the number of oscillatorsthat share an excitation (i.e., about the exciton delocalizationsizeL). The reason is that this splitting finds its origin in the
Figure 10. 2DIR spectra in theZZYYpolarization for a homogeneous 3× 3 unit cell â sheet (a) and the same sheet with Gaussian diagonaldisorder of standard deviationσ ) 10 cm-1 (b). In both spectra, we usedγ ) 2 cm-1 for the homogeneous broadening of the exciton transitions.To generate the spectrum in (b), we averaged over 500 disorder realizations.
Oscillations and Spectra of Inhomogeneousâ-Sheets J. Phys. Chem. B, Vol. 109, No. 19, 20059795
anharmonic term of the Hamiltonian,Hanh ) -(A/2)∑n)1N
an† an
†anan, which roughly stated adds the fourth powers of theamplitudes of the exciton states on all oscillators. For a stateshared byL oscillators, this amplitude scales as 1/xL, leadingto an expected anharmonic splitting∆ ≈ A/L between thenegative induced-absorption peak and the associated positivebleaching peak (the latter one being higher in energy). Similarly,using simple statistical arguments, Hochstrasser and co-workersarrived at∆ ) 2A/(L + 1) for L-coupled oscillators.10
It is useful to derive the expected scaling from perturbativearguments, instead of the above heuristic ones. In the absenceof Hanh, there is no anharmonic shift and the two-quantumeigenstates are just the two-boson states|u, V⟩ ) ∑n,m
unVman† am
† |g⟩. Let us consider the effect ofHanh on the exci-tonic overtone|2u⟩ ) (1/x2) ∑n,m unuman
† am† |g⟩, where the
prefactor 1/x2 ensures proper normalization (the one-quantumeigenvectorun is assumed to be normalized to unity). To firstorder inHanh, the anharmonic shift is then given by
whereL ≡ (∑n |un|4)-1 is now the participation ratio, a well-known measure of the one-particle delocalization size indisordered systems.47 This confirms the scaling postulated inref 23. One may argue, however, that for our system the valueof A does not justify a first-order treatment. To estimate higher-order effects, we also consider the second-order shift of theenergy of the state|2u⟩, which reads
If we consider this shift, in particular, for states|u⟩ that occurat the bottom of the exciton band, such as the spectrallydominant|a-⟩-type states, we see that∆2 is positive (i.e., itincreases the energy spacing between the bleaching and induced-absorption peaks). We can further estimate∆2 by approximatingthe energy denominator in eq 11 byB, whereB is on the orderof the total exciton bandwidth. The summations overu′ andu′′can then be performed using the closure relation on these wavefunctions, leading to∆2 ) 2A2/(BL), where againL is definedas the participation ratio. Because, for the system underconsideration, 2A ) 32 cm-1, while B is on the order of 60cm-1, we see that∆2 ≈ ∆1/2. It is likely that yet higher-orderterms add similar contributions, leaving us with an expectedscaling of∆ ) cA/L with c on the order of unity.
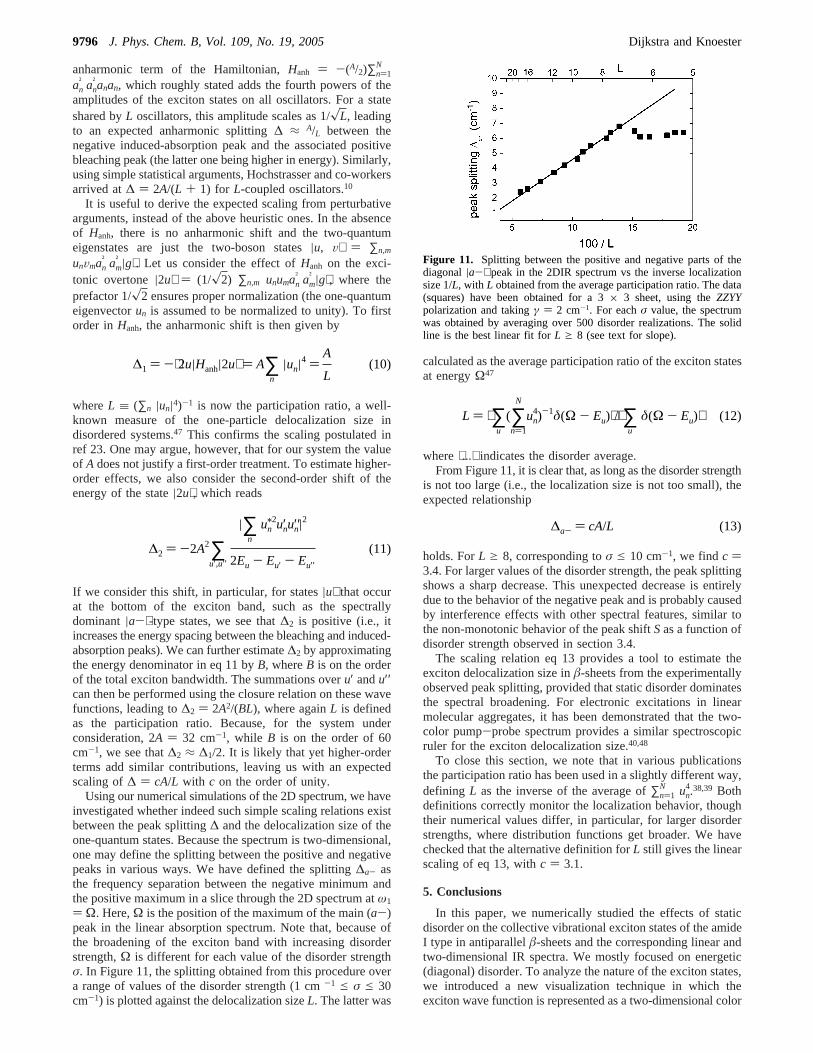
Using our numerical simulations of the 2D spectrum, we haveinvestigated whether indeed such simple scaling relations existbetween the peak splitting∆ and the delocalization size of theone-quantum states. Because the spectrum is two-dimensional,one may define the splitting between the positive and negativepeaks in various ways. We have defined the splitting∆a- asthe frequency separation between the negative minimum andthe positive maximum in a slice through the 2D spectrum atω1
) Ω. Here,Ω is the position of the maximum of the main (a-)peak in the linear absorption spectrum. Note that, because ofthe broadening of the exciton band with increasing disorderstrength,Ω is different for each value of the disorder strengthσ. In Figure 11, the splitting obtained from this procedure overa range of values of the disorder strength (1 cm-1 e σ e 30cm-1) is plotted against the delocalization sizeL. The latter was
calculated as the average participation ratio of the exciton statesat energyΩ47
where⟨...⟩ indicates the disorder average.From Figure 11, it is clear that, as long as the disorder strength
is not too large (i.e., the localization size is not too small), theexpected relationship
holds. ForL g 8, corresponding toσ e 10 cm-1, we find c )3.4. For larger values of the disorder strength, the peak splittingshows a sharp decrease. This unexpected decrease is entirelydue to the behavior of the negative peak and is probably causedby interference effects with other spectral features, similar tothe non-monotonic behavior of the peak shiftSas a function ofdisorder strength observed in section 3.4.
The scaling relation eq 13 provides a tool to estimate theexciton delocalization size inâ-sheets from the experimentallyobserved peak splitting, provided that static disorder dominatesthe spectral broadening. For electronic excitations in linearmolecular aggregates, it has been demonstrated that the two-color pump-probe spectrum provides a similar spectroscopicruler for the exciton delocalization size.40,48
To close this section, we note that in various publicationsthe participation ratio has been used in a slightly different way,defining L as the inverse of the average of∑n)1
N un4.38,39 Both
definitions correctly monitor the localization behavior, thoughtheir numerical values differ, in particular, for larger disorderstrengths, where distribution functions get broader. We havechecked that the alternative definition forL still gives the linearscaling of eq 13, withc ) 3.1.
5. Conclusions
In this paper, we numerically studied the effects of staticdisorder on the collective vibrational exciton states of the amideI type in antiparallelâ-sheets and the corresponding linear andtwo-dimensional IR spectra. We mostly focused on energetic(diagonal) disorder. To analyze the nature of the exciton states,we introduced a new visualization technique in which theexciton wave function is represented as a two-dimensional color
Figure 11. Splitting between the positive and negative parts of thediagonal|a-⟩ peak in the 2DIR spectrum vs the inverse localizationsize 1/L, with L obtained from the average participation ratio. The data(squares) have been obtained for a 3× 3 sheet, using theZZYYpolarization and takingγ ) 2 cm-1. For eachσ value, the spectrumwas obtained by averaging over 500 disorder realizations. The solidline is the best linear fit forL g 8 (see text for slope).
L ) ⟨∑u
(∑n)1
N
un4)-1δ(Ω - Eu)⟩/⟨∑
u
δ(Ω - Eu)⟩ (12)
∆a- ) cA/L (13)
∆1 ) -⟨2u|Hanh|2u⟩ ) A∑n
|un|4 )A
L(10)
∆2 ) -2A2∑u′,u′′
|∑n
un/2u′nu′′n|2
2Eu - Eu′ - Eu′′
(11)
9796 J. Phys. Chem. B, Vol. 109, No. 19, 2005 Dijkstra and Knoester
map. This color map facilitates recognizing symmetries of thewave function and phase relations between various oscillatorsin the sheet. Using these maps, we confirmed that for homo-geneousâ-hairpins the collective states to a very good ap-proximation separate into four different bands that have a one-to-one correspondence to the four eigenstates (|a-⟩, |a+⟩,|s-⟩, |s+⟩) of a single unit cell in the sheet.
For â-sheets that are extended in both directions, thisidentification is less ideal, as strong interactions betweendifferent unit cells mix the various types of cell eigenstates.Still, using the color maps, we have been able to demonstratethat in the absence of disorder several of the optically dominantstates of extended sheets still reflect the symmetries and phaserelations of the cell eigenstates. In particular, the strongest statenear 1645 cm-1 has a clear|a-⟩ character, as recognized fromits color map, which closely resembles an array of alternatingred and blue columns. A second optically strong state near 1680cm-1 is recognized as an|a+⟩-type state through its representa-tion as a stack of rows that alternate in color. Finally, acheckerboard color pattern is typical for the|s-⟩-type state thatoccurs around∼1705 cm-1. A few other visible states are eitherrecognized as higher wave vector states of the above ones oras mixtures of various unit cell states.
Energetic disorder has strong effects on the exciton states,as it destroys the translational symmetry (which is not perfectanyway, as a consequence of edge effects) and leads tolocalization of the exciton states. As we demonstrated, however,within their localization area, in particular, the states underlyingthe optically strongest peak in the linear spectrum clearly exhibitthe |a-⟩-type color map. In hindsight, this strongly suggeststhat the experimentally observedR- peak reported in ref 24for poly-L-lysine and severalâ-sheet-containing proteins maybe associated with the|a-⟩ state. A more rigorous identificationshould involve an analysis of the color maps for these systems,using their known coordinates as input for constructing theexciton Hamiltonian.
The effects of energetic disorder on the linear spectrum ofextended (two-dimensional) sheets reported here are quitegeneric: broadening and shifts of absorption lines follow powerlaws as long as the disorder strength is not too large. The powersfound differ from those obtained for two-dimensional lattices,as a consequence of the strong anisotropic nature of theinteractions inâ-sheets. We have also found that disorder inthe interactions, caused by random shifts of the oscillatorpositions, causes the dominant|a-⟩ peak to shift to the blue,rather than the red. This marked difference with energeticdisorder finds its origin in a decrease of the average TDCinteractions in the presence of this type of disorder and isdominated by shifts in the direction of the peptide strands.
For the 2DIR spectrum, energetic disorder leads to stretchingof the diagonal peaks in the diagonal direction, while the cross-peaks are stretched closer to theω1 direction. These two effectstogether lead to a Z-shape in the two-dimensional spectrum,which may be a useful signature ofâ-sheet content inexperimentally observed spectra. Indeed, a Z-shape has beenobserved in the 2DIR spectra of variousâ-sheet-containingsystems.24 As opposed to our model results, the cross-peaks inthe experimental spectra do not seem to exhibit any slantingrelative to theω1 direction. As explained in section 4, this mayresult from a relatively large dynamic contribution in thebroadening of the|a+⟩ transitions in experiment. We also foundthat, for not-too-large disorder, the splitting between associatedpositive and negative features in the 2DIR spectrum scalesinversely proportionally with the delocalization size of excitons
in the â-sheet. Future studies should address the effects ofdynamic disorder49,50 and investigate whether in this case asimilar scaling relation exists between the peak splitting andthe exciton coherence size.
Acknowledgment. We would like to thank Prof. A. Tok-makoff for stimulating discussions and for sharing experimentalresults with us prior to publication.
References and Notes
(1) Drenth, J.Principles of Protein X-ray Crystallography; Springer-Verlag: Berlin, 1994.
(2) Wuthrich, K. NMR of Proteins and Nucleic Acids; Wiley: NewYork, 1986.
(3) Mukamel, S.Acc. Chem. Res.1999, 32, 145.(4) Mukamel, S.Annu. ReV. Phys. Chem.2000, 51, 691.(5) Khalil, M.; Demirdoven, N.; Tokmakoff, A.J. Phys. Chem. A2003,
107, 5258.(6) Krimm, S.; Bandekar, J.AdV. Protein Chem.1986, 38, 181.(7) Jackson, M.; Mantsch, H.Crit. ReV. Biochem. Mol. Biol.1995,
30, 95.(8) Loring, R. F.; Mukamel, S.J. Chem. Phys.1985, 83, 2116.(9) Tanimura, Y.; Mukamel, S.J. Chem. Phys.1993, 99, 9496.
(10) Hamm, P.; Lim, M. H.; Hochstrasser, R. M.J. Phys. Chem. B1998,102, 6123.
(11) Woutersen, S.; Hamm, P.J. Chem. Phys.2001, 114, 2727.(12) Woutersen, S.; Mu, Y.; Stock, G.; Hamm, P.Proc. Natl. Acad.
Sci. U.S.A.2001, 98, 11254.(13) Golonzka, O.; Khalil, M.; Demirdo¨ven, N.; Tokmakoff, A.J. Chem.
Phys.2001, 115, 10814.(14) Zanni, M. T.; Ge, N. H.; Kim, Y. S.; Decatur, S. M.; Hochstrasser,
R. M. Biophys. J.2002, 82, 66.(15) Rubtsov, I. V.; Wang, J.; Hochstrasser, R. M.J. Phys. Chem. A
2003, 107, 3384.(16) Asbury, J. B.; Steinel, T.; Stromberg, C.; Gaffney, K. J.; Piletic, I.
R.; Goun, A.; Fayer, M. D.Phys. ReV. Lett. 2003, 91, 237402.(17) Asbury, J. B.; Steinel, T.; Stromberg, C.; Gaffney, K. J.; Piletic, I.
R.; Goun, A.; Fayer, M. D.Chem. Phys. Lett.2003, 374, 362.(18) Bredenbeck, J.; Helbing, J.; Behrendt, R.; Renner, C.; Moroder,
L.; Wachtveitl, J.; Hamm, P.J. Phys. Chem. B2003, 107, 8654.(19) Moran, A. M.; Park, S. M.; Dreyer, J.; Mukamel, S.J. Chem. Phys.
2003, 118, 3651.(20) Wang, J.; Hochstrasser, R. M.Chem. Phys.2004, 297, 195.(21) Abramavicius, D.; Zhuang, W.; Mukamel, S.J. Phys. Chem. B2004,
108, 18034.(22) Fang, C.; Wang, J.; Kim, Y. S.; Charnley, A. K.; Barber-Armstrong,
W.; Smith, A. B., III; Decatur, S. M.; Hochstrasser, R. M.J. Phys. Chem.B 2004, 108, 10415.
(23) Cheatum, C. M.; Tokmakoff, A.; Knoester, J.J. Chem. Phys.2004,120, 8201.
(24) Demirdoven, N.; Cheatum, C. M.; Sung, H. S.; Khalil, M.; Knoester,J.; Tokmakoff, A.J. Am. Chem. Soc.2004, 126, 7981.
(25) Chung, H. S.; Khalil, M.; Smith, A. W.; Ganim, Z.; Tokmakoff,A. Proc. Natl. Acad. Sci. U.S.A.2005, 102, 612.
(26) Mirkin, N. G.; Krimm, S.J. Am. Chem. Soc.1991, 113, 9742.(27) Scheurer, C.; Piryatinski, A.; Mukamel, S.J. Am. Chem. Soc.2001,
123, 3114.(28) Ham, S.; Kim, J. H.; Lee, H.; Cho, M.J. Chem. Phys.2003, 118,
3491.(29) Choi, J. H.; Ham, S.; Cho, M.J. Chem. Phys.2002, 117, 6821.(30) Torii, H.; Tasumi, M.J. Chem. Phys.1992, 96, 3379.(31) Ham, S.; Cha, S.; Choi, J.; Cho, M.J. Chem. Phys.2003, 119,
1451.(32) Choi, J.; Ham, S.; Cho, M.J. Phys. Chem. B2003, 107, 9132.(33) Mukamel, S.Principles of Nonlinear Optical Spectroscopy; Oxford
University Press: Oxford, 1995.(34) In ref 23, this state appears at 1641 cm-1. The discrepancy is
because, in the current calculations, we only account for the eight strongestinteractionsJnm (see Figure 2).
(35) Miyazawa, T.J. Chem. Phys.1960, 32, 1647.(36) Miyazawa, T.; Blout, E. R.J. Am. Chem. Soc.1961, 83, 712.(37) Chirgadze, Y. N.; Nevskaya, N. A.Biopolymers1976, 15, 607.(38) Schreiber, M.; Toyozawa, Y.J. Phys. Soc. Jpn.1982, 51, 1528.(39) Fidder, H.; Knoester, J.; Wiersma, D. A.J. Chem. Phys.1991, 95,
7880.(40) Bakalis, L. D.; Knoester, J.J. Phys. Chem. B1999, 103, 6620.(41) Bakalis, L. D.; Knoester, J.J. Lumin.1999, 83/84, 115.
Oscillations and Spectra of Inhomogeneousâ-Sheets J. Phys. Chem. B, Vol. 109, No. 19, 20059797

(42) Dahlbom, M.; Pullerits, T.; Mukamel, S.; Sundstro¨m, V. J. Phys.Chem. B2001, 105, 5515.
(43) Chachisvilis, M.; Ku¨hn, O.; Pullerits, T.; Sundstro¨m, V. J. Phys.Chem. B1997, 101, 7275.
(44) Didraga, C.; Knoester, J.J. Chem. Phys.2004, 121, 10687.(45) Knoester, J.J. Chem. Phys.1993, 99, 8466.
(46) Rubtsov, I. V.; Wang, J.; Hochstrasser, R. M.J. Chem. Phys.2003,118, 7733.
(47) Thouless, D. J.Phys. Rep.1974, 13, 93.(48) Juzeliujnas, G.Z. Phys. D1988, 8, 379.(49) Kwac, K.; Cho, M.J. Chem. Phys.2003, 119, 2247.(50) Kwac, K.; Cho, M.J. Chem. Phys.2003, 119, 2256.
9798 J. Phys. Chem. B, Vol. 109, No. 19, 2005 Dijkstra and Knoester