Coarse-Grained Modeling of Ionomers and Salt-Doped · PDF fileCoarse-Grained Modeling of...
17
Coarse-Grained Modeling of Ionomers and Salt-Doped Block Copolymers Lisa Hall H.C. “Slip” Slider Assistant Professor William G. Lowrie Department of Chemical and Biomolecular Engineering The Ohio State University Map from Wikimedia Commons My path: BS, Rose-Hulman PhD, UIUC Postdoc, Sandia
Transcript of Coarse-Grained Modeling of Ionomers and Salt-Doped · PDF fileCoarse-Grained Modeling of...
Coarse-Grained Modeling of Ionomers and Salt-Doped Block Copolymers
Lisa Hall H.C. “Slip” Slider Assistant Professor
William G. Lowrie Department of Chemical and Biomolecular Engineering The Ohio State University
Map from Wikimedia Commons
My path: BS, Rose-Hulman PhD, UIUC Postdoc, Sandia
2
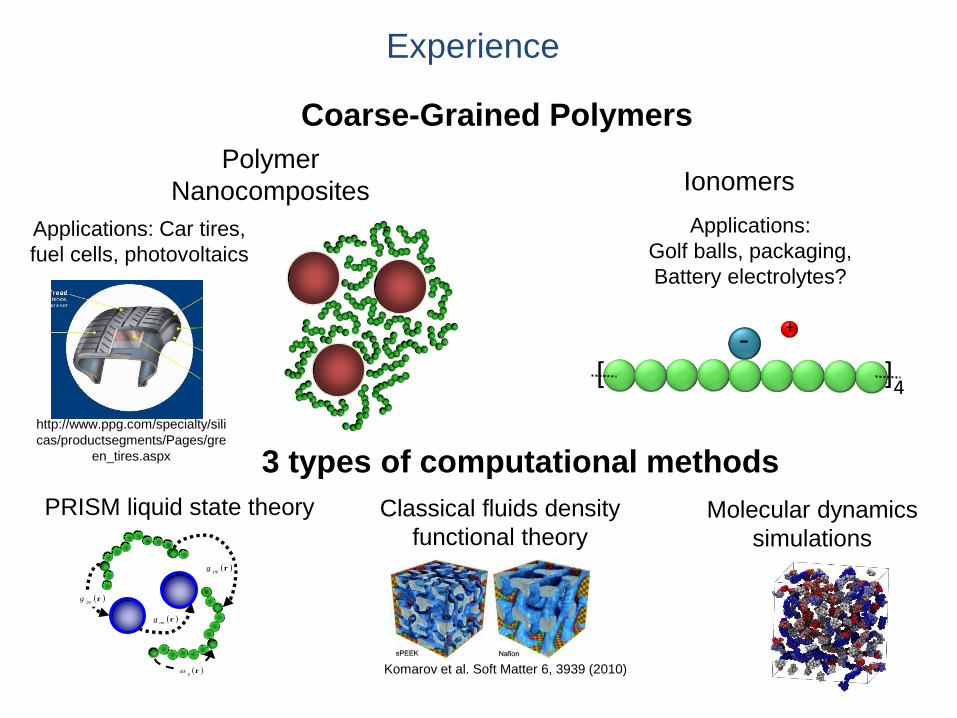
Experience
Polymer
Nanocomposites
Coarse-Grained Polymers
Ionomers
3 types of computational methods
rp
rpn
g
rnn
g
rpp
g
PRISM liquid state theory Classical fluids density
functional theory Molecular dynamics
simulations
Komarov et al. Soft Matter 6, 3939 (2010)
http://www.ppg.com/specialty/sili
cas/productsegments/Pages/gre
en_tires.aspx
Applications: Car tires,
fuel cells, photovoltaics
[ ]4
+ -
Applications:
Golf balls, packaging,
Battery electrolytes?
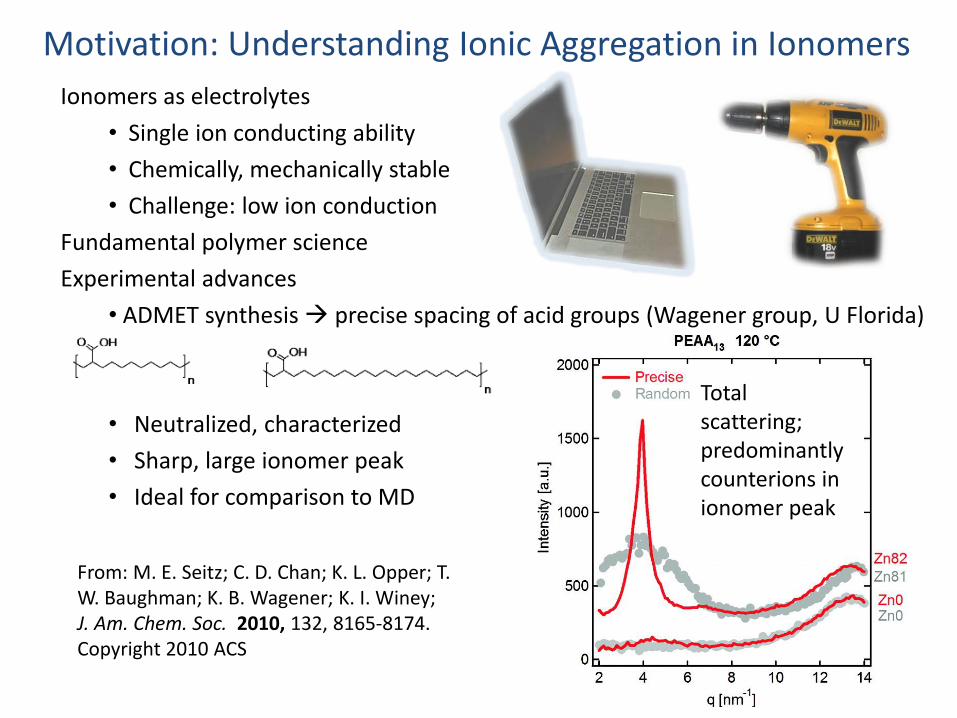
Ionomers as electrolytes
• Single ion conducting ability
• Chemically, mechanically stable
• Challenge: low ion conduction
Fundamental polymer science
Experimental advances
• ADMET synthesis precise spacing of acid groups (Wagener group, U Florida)
• Neutralized, characterized
• Sharp, large ionomer peak
• Ideal for comparison to MD
Motivation: Understanding Ionic Aggregation in Ionomers
From: M. E. Seitz; C. D. Chan; K. L. Opper; T. W. Baughman; K. B. Wagener; K. I. Winey; J. Am. Chem. Soc. 2010, 132, 8165-8174. Copyright 2010 ACS
Total scattering; predominantly counterions in ionomer peak
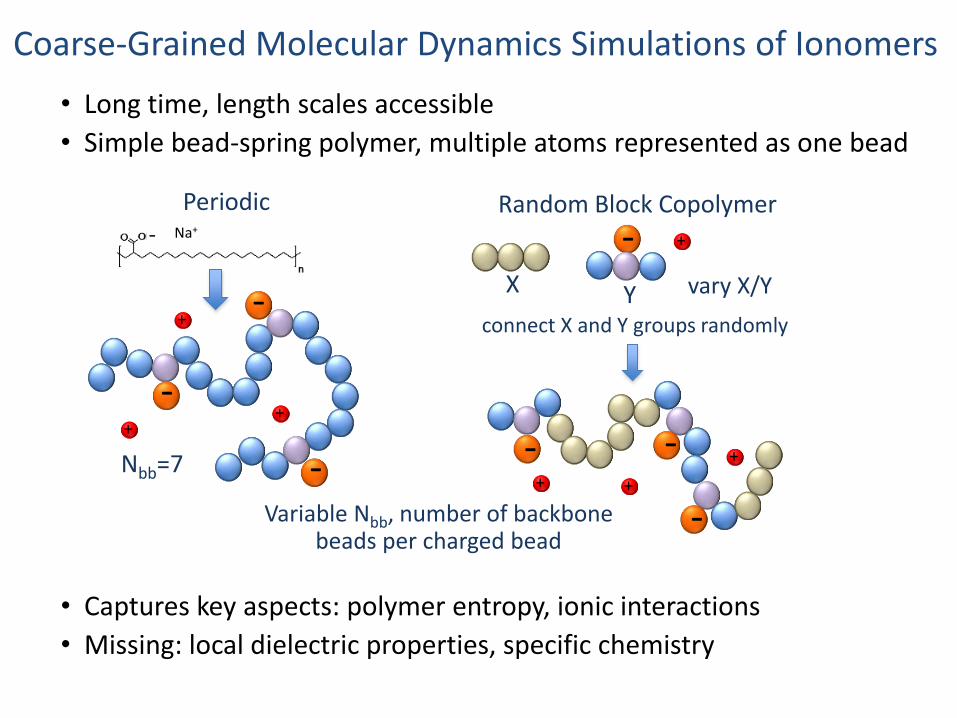
Coarse-Grained Molecular Dynamics Simulations of Ionomers
• Long time, length scales accessible
• Simple bead-spring polymer, multiple atoms represented as one bead
• Captures key aspects: polymer entropy, ionic interactions
• Missing: local dielectric properties, specific chemistry
+
Random Block Copolymer
-
- -
connect X and Y groups randomly
X
-
Y
vary X/Y
+
+
+
Periodic
-
-
-
-
Na+
+
+
+
Variable Nbb, number of backbone beads per charged bead
Nbb=7
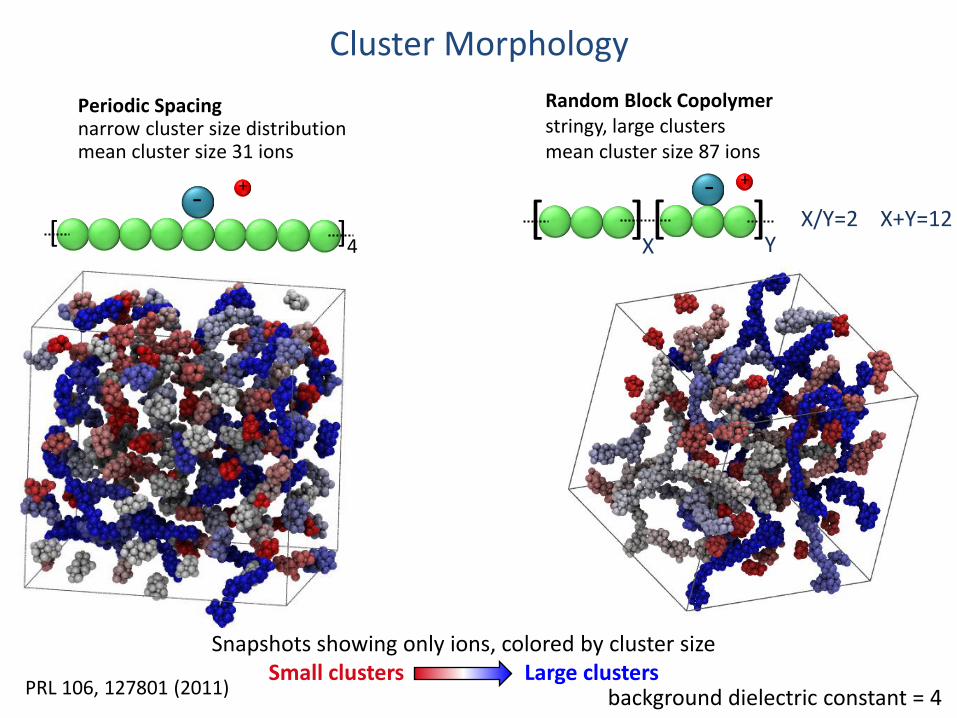
Random Block Copolymer stringy, large clusters mean cluster size 87 ions
background dielectric constant = 4
Snapshots showing only ions, colored by cluster size Small clusters Large clusters
Periodic Spacing narrow cluster size distribution mean cluster size 31 ions
Cluster Morphology
+ -
[ ] [ ] X
Y
X/Y=2 X+Y=12
[ ]4
+ -
PRL 106, 127801 (2011)
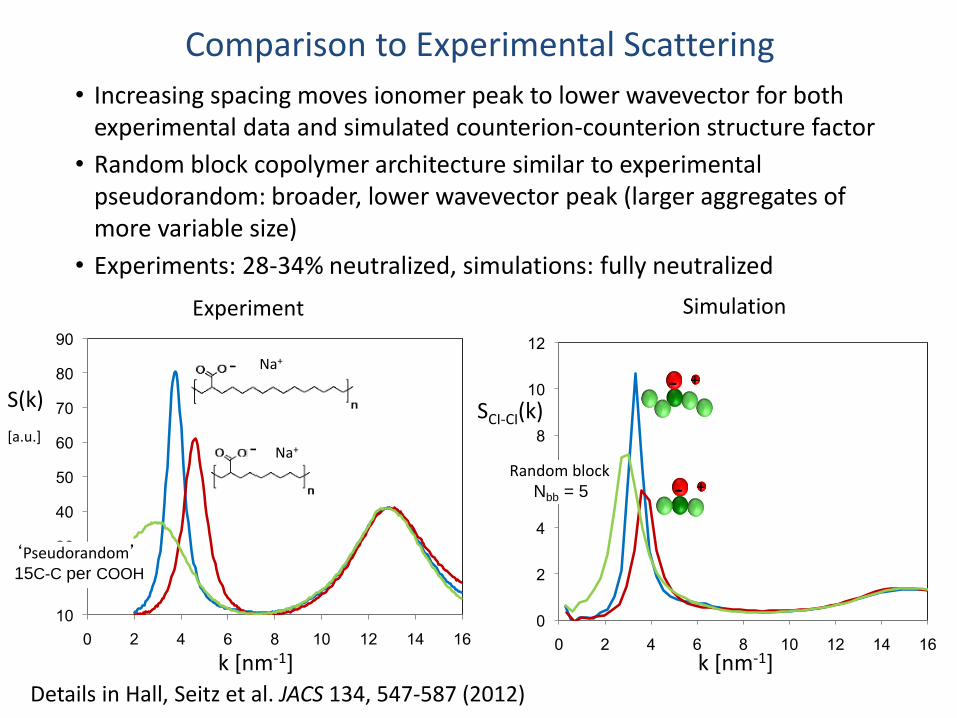
• Increasing spacing moves ionomer peak to lower wavevector for both experimental data and simulated counterion-counterion structure factor
• Random block copolymer architecture similar to experimental pseudorandom: broader, lower wavevector peak (larger aggregates of more variable size)
• Experiments: 28-34% neutralized, simulations: fully neutralized
+ -
+ -
Comparison to Experimental Scattering
Random block Nbb = 5
S(k)
[a.u.] SCI-CI(k)
k [nm-1] k [nm-1]
Experiment Simulation
‘Pseudorandom’ 15C-C per COOH
- Na+
- Na+
Details in Hall, Seitz et al. JACS 134, 547-587 (2012)
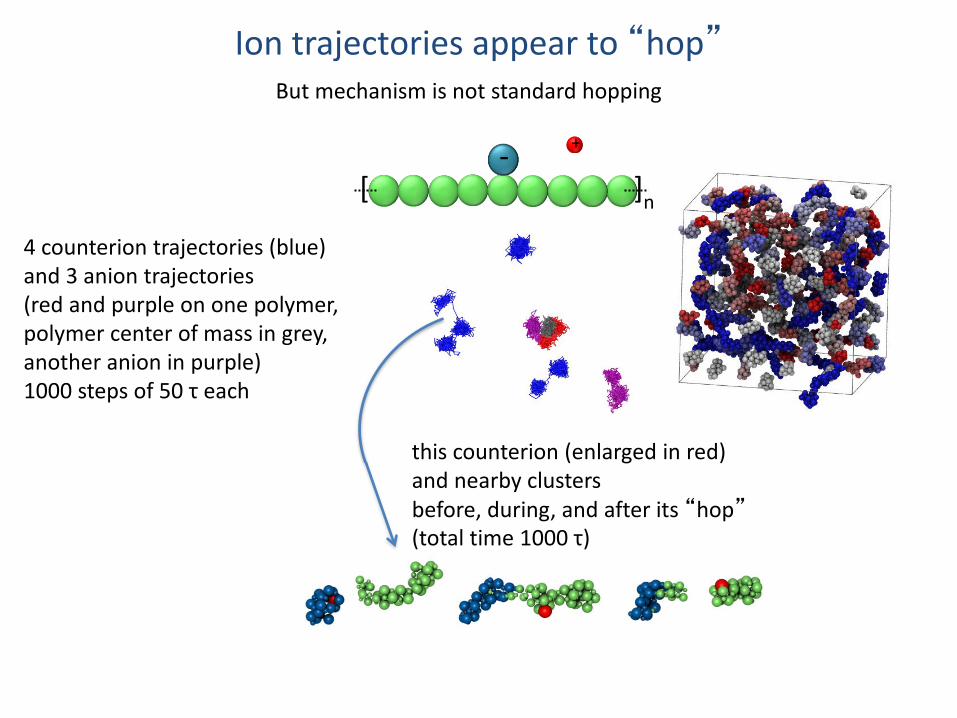
4 counterion trajectories (blue) and 3 anion trajectories (red and purple on one polymer, polymer center of mass in grey, another anion in purple) 1000 steps of 50 τ each
this counterion (enlarged in red) and nearby clusters before, during, and after its “hop” (total time 1000 τ)
But mechanism is not standard hopping
[ ]n
+ -
Ion trajectories appear to “hop”
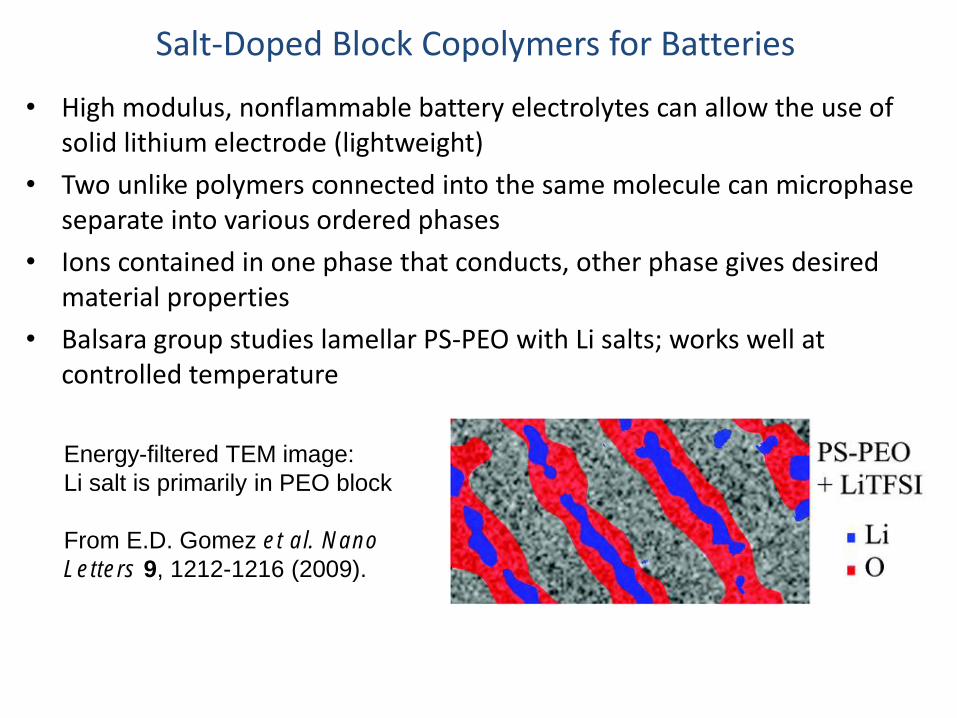
Salt-Doped Block Copolymers for Batteries
• High modulus, nonflammable battery electrolytes can allow the use of solid lithium electrode (lightweight)
• Two unlike polymers connected into the same molecule can microphase separate into various ordered phases
• Ions contained in one phase that conducts, other phase gives desired material properties
• Balsara group studies lamellar PS-PEO with Li salts; works well at controlled temperature
Energy-filtered TEM image:
Li salt is primarily in PEO block
From E.D. Gomez et al. Nano
Letters 9, 1212-1216 (2009).
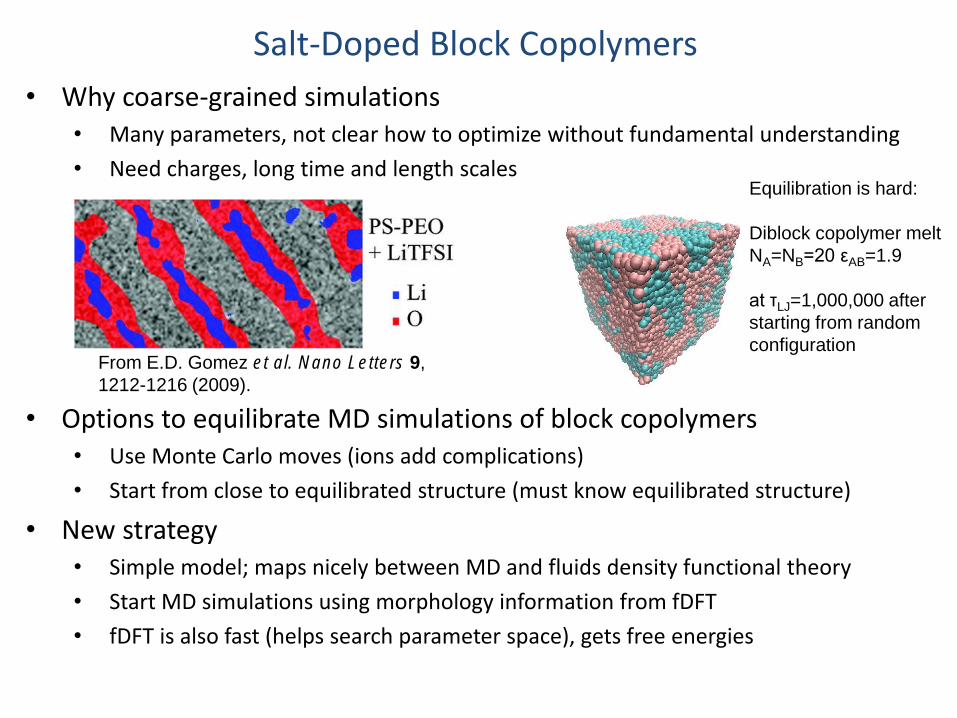
Salt-Doped Block Copolymers
• Why coarse-grained simulations • Many parameters, not clear how to optimize without fundamental understanding
• Need charges, long time and length scales
• Options to equilibrate MD simulations of block copolymers • Use Monte Carlo moves (ions add complications)
• Start from close to equilibrated structure (must know equilibrated structure)
• New strategy • Simple model; maps nicely between MD and fluids density functional theory
• Start MD simulations using morphology information from fDFT
• fDFT is also fast (helps search parameter space), gets free energies
Equilibration is hard:
Diblock copolymer melt
NA=NB=20 εAB=1.9
at τLJ=1,000,000 after
starting from random
configuration From E.D. Gomez et al. Nano Letters 9,
1212-1216 (2009).
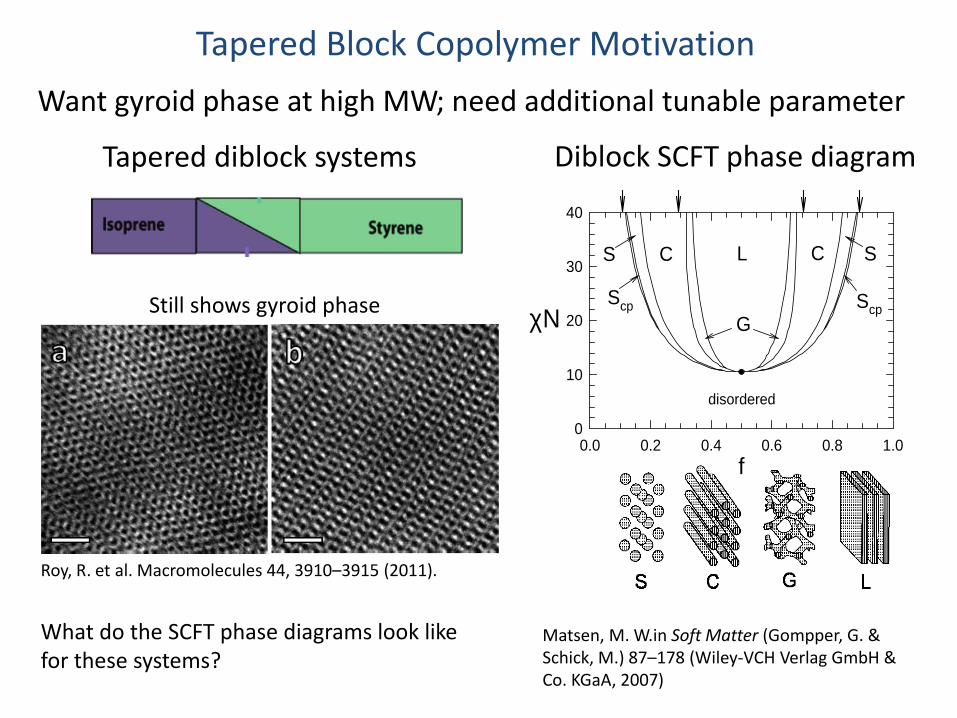
Want gyroid phase at high MW; need additional tunable parameter
66 1 Self-consistent field theory and its applications
in a file, the free energy of the C phase is calculated using the exact same expressions as for the
L phase. The same goes for the S and G phases, where their basis functions are catalogued by
Henry and Lonsdale (1969) under the space-group symmetries, Im 3̄m and Ia3̄d, respectively.
For the Scp and PL phases, there are near degeneracies (Matsen and Bates 1996a) in the
arrangement of spheres and the stacking of layers, respectively. As suggested by Matsen
and Bates (1996a), this is likely to result in irregular non-periodic arrangements, which is
indeed consistent with recent experimental observations (Sakamoto et al. 1997; Zhu et al.
2001). Nevertheless, for the purpose of calculating phase boundaries, it is sufficient to use
the symmetries Fm3̄m (i.e., fcc packing) and R3̄m (i.e., ABCABC... stacking), respectively.
The PL phase is also different in that it has two distinct periodicities, which implies that the
eigenvalue Eq. (1.165) for the basis functions must be generalized to
∇ 2f i (r ) = −λ ,i
D 2+λ⊥ ,i
D 2⊥
f i (r ) (1.298)
where D is the in-plane spacing between perforations and D ⊥ is the out-of-plane lamellar
spacing. However, this distinction only enters in an obvious extension to Eqs. (1.284) and
(1.285), and in the need to minimize F with respect to both D and D⊥ .
f0.0 0.2 0.4 0.6 0.8 1.0
cN
0
10
20
30
40
L CC S
disordered
G
S
Scp Scp
Figure 1.20: Theoretical phase diagram for diblock copolymer melts showing where the various
morphologies in Fig. 1.18 are stable. All phase transitions are discontinuous except for the
mean-field critical point denoted by the solid dot. Along part of the order-disorder transition
(ODT) is a narrow region, Scp , where spherical domains prefer a close-packed arrangement
over the usual bcc one. In the strong-segregation limit, the G region pinches off at χN ≈ 60,
the ODT approaches the two edges of the diagram, and the C/S and L/C boundaries approach
the fixed compositions estimated by the arrows at the top of the diagram.
Comparing the free energies of the disordered phase and all the ordered phases of Fig.
1.19 generates the phase diagram in Fig. 1.20, which maps the phase of lowest free energy as
Diblock SCFT phase diagram
Matsen, M. W.in Soft Matter (Gompper, G. & Schick, M.) 87–178 (Wiley-VCH Verlag GmbH & Co. KGaA, 2007)
Tapered diblock systems
Roy, R. et al. Macromolecules 44, 3910–3915 (2011).
Still shows gyroid phase
What do the SCFT phase diagrams look like for these systems?
Tapered Block Copolymer Motivation
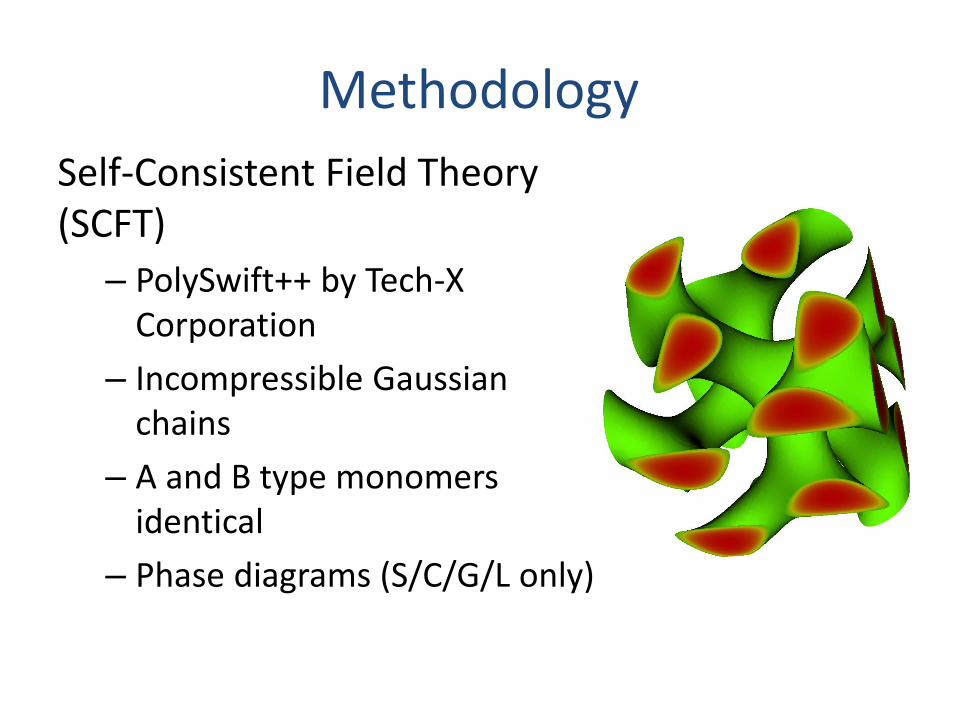
Methodology
Self-Consistent Field Theory (SCFT)
– PolySwift++ by Tech-X Corporation
– Incompressible Gaussian chains
– A and B type monomers identical
– Phase diagrams (S/C/G/L only)
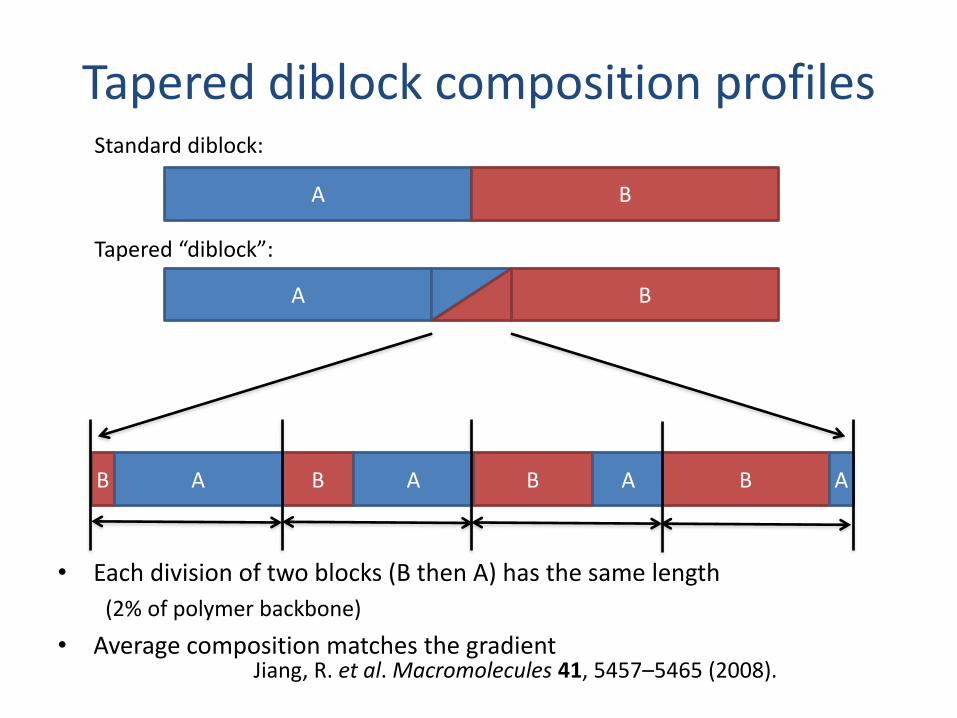
Tapered diblock composition profiles
A B
A B
Standard diblock:
Tapered “diblock”:
B A B A B A B A
Jiang, R. et al. Macromolecules 41, 5457–5465 (2008).
• Each division of two blocks (B then A) has the same length
(2% of polymer backbone)
• Average composition matches the gradient
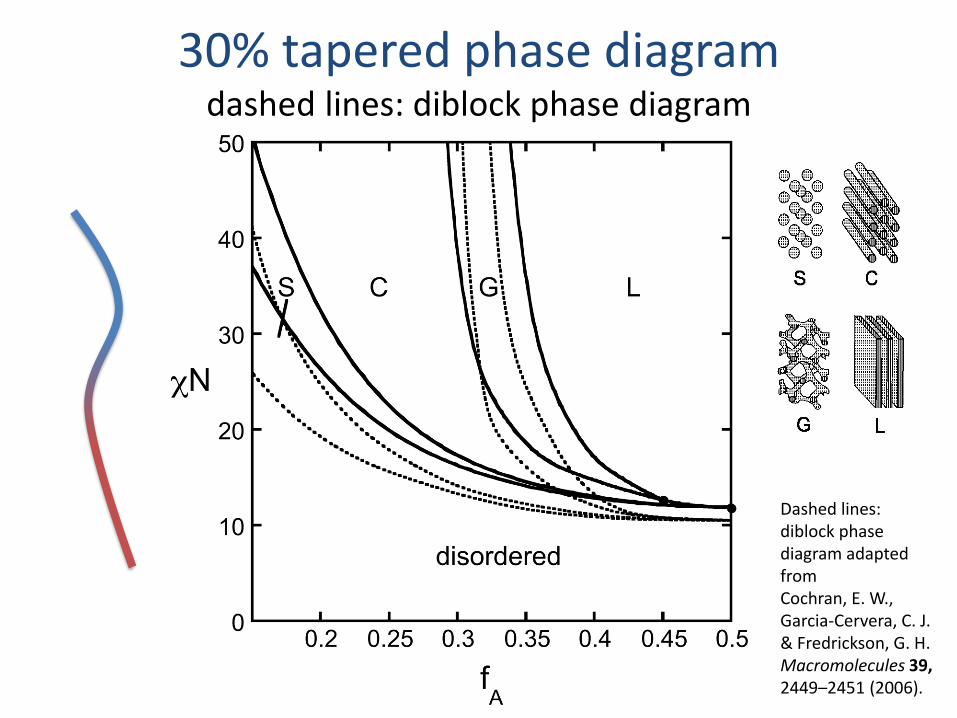
30% tapered phase diagram dashed lines: diblock phase diagram
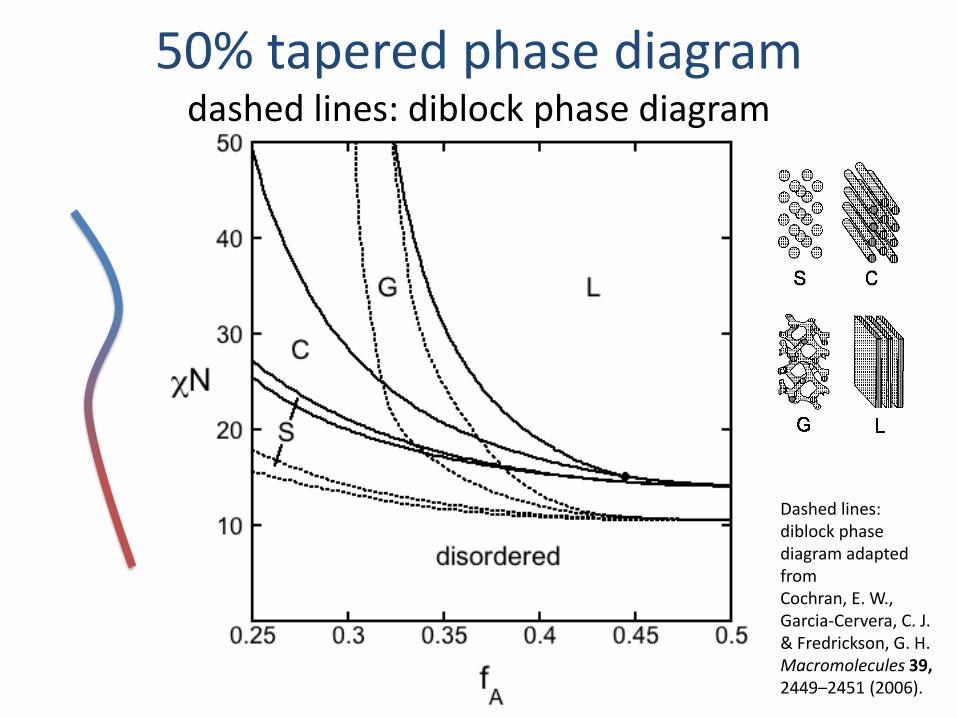
Dashed lines: diblock phase diagram adapted from Cochran, E. W., Garcia-Cervera, C. J. & Fredrickson, G. H. Macromolecules 39, 2449–2451 (2006).
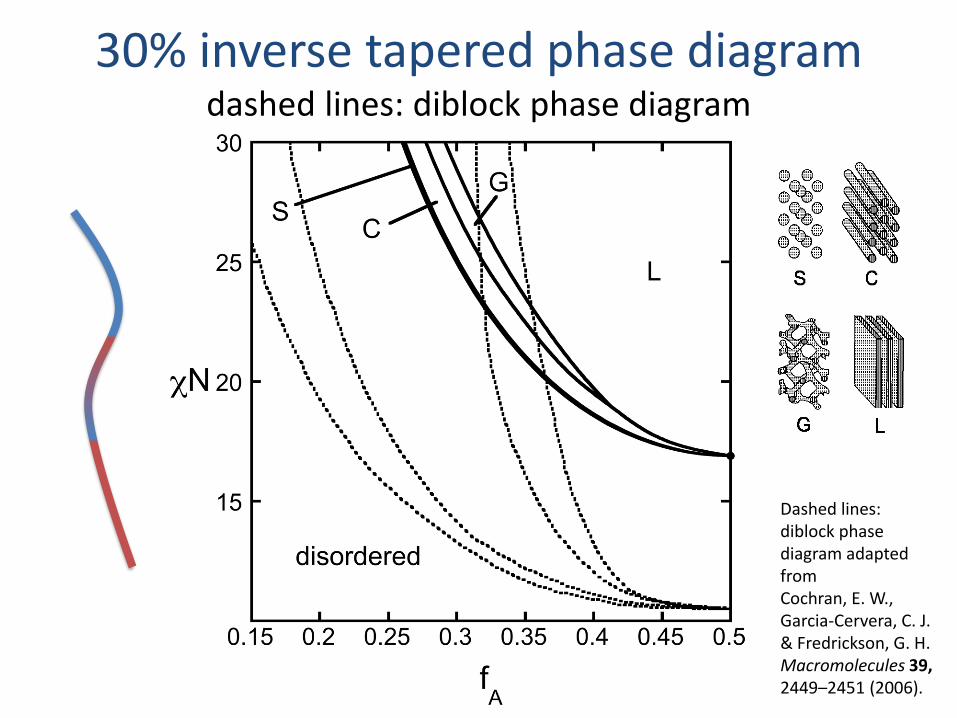
Dashed lines: diblock phase diagram adapted from Cochran, E. W., Garcia-Cervera, C. J. & Fredrickson, G. H. Macromolecules 39, 2449–2451 (2006).
50% tapered phase diagram dashed lines: diblock phase diagram
Dashed lines: diblock phase diagram adapted from Cochran, E. W., Garcia-Cervera, C. J. & Fredrickson, G. H. Macromolecules 39, 2449–2451 (2006).
30% inverse tapered phase diagram dashed lines: diblock phase diagram
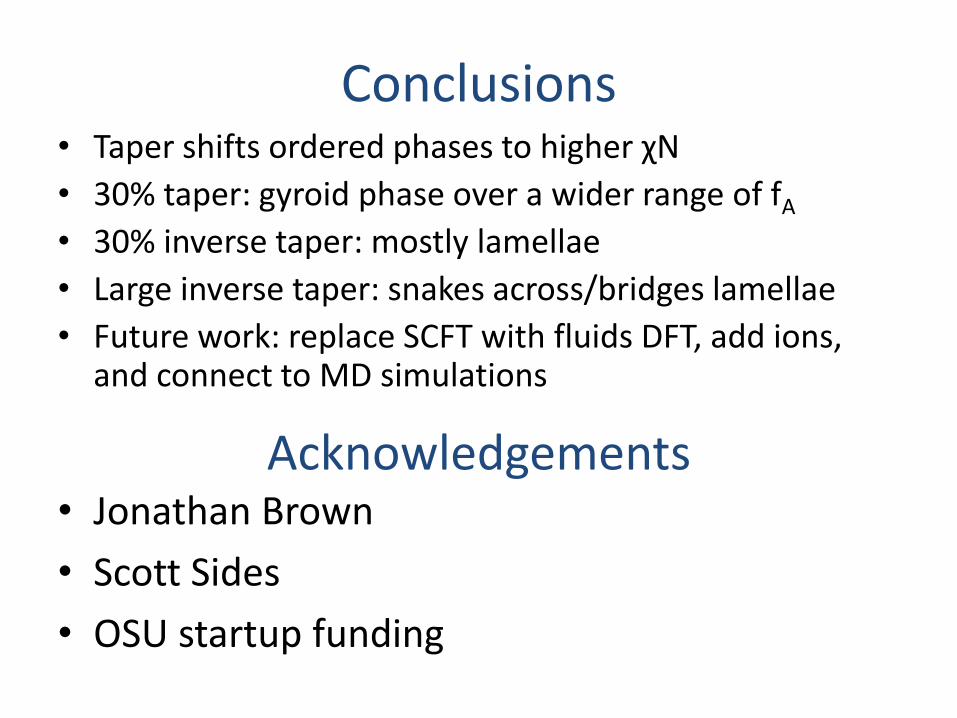
Acknowledgements • Jonathan Brown
• Scott Sides
• OSU startup funding
Conclusions • Taper shifts ordered phases to higher χN
• 30% taper: gyroid phase over a wider range of fA
• 30% inverse taper: mostly lamellae
• Large inverse taper: snakes across/bridges lamellae
• Future work: replace SCFT with fluids DFT, add ions, and connect to MD simulations
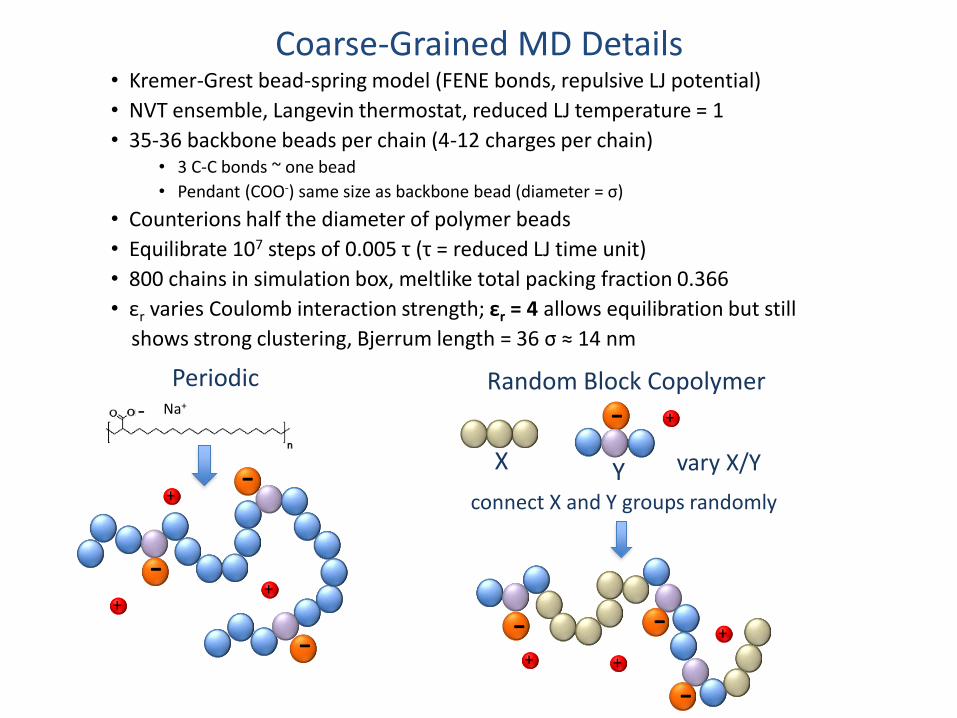
Coarse-Grained MD Details • Kremer-Grest bead-spring model (FENE bonds, repulsive LJ potential)
• NVT ensemble, Langevin thermostat, reduced LJ temperature = 1
• 35-36 backbone beads per chain (4-12 charges per chain) • 3 C-C bonds ~ one bead
• Pendant (COO-) same size as backbone bead (diameter = σ)
• Counterions half the diameter of polymer beads
• Equilibrate 107 steps of 0.005 τ (τ = reduced LJ time unit)
• 800 chains in simulation box, meltlike total packing fraction 0.366
• εr varies Coulomb interaction strength; εr = 4 allows equilibration but still
shows strong clustering, Bjerrum length = 36 σ ≈ 14 nm
+
Random Block Copolymer
-
- -
connect X and Y groups randomly
X
-
Y
vary X/Y
+
+
+
Periodic
-
-
-
-
Na+
+
+
+