Chemical zoning and lattice distortion in radiogenically ... · PDF filewith Pb and ΣREY...
4
LETTER Chemical zoning and lattice distortion in uraninite from Olympic Dam, South Australiak EDELTRAUD MACMILLAN 1,2, *, CRISTIANA L. CIOBANU 3 , KATHY EHRIG 2 , NIGEL J. COOK 3 , AND ALLAN PRING 4 1 School of Physical Sciences, The University of Adelaide, Adelaide, South Australia 5005, Australia 2 BHP Billiton Olympic Dam, Adelaide, South Australia 5000, Australia 3 School of Chemical Engineering, The University of Adelaide, Adelaide, South Australia 5005, Australia 4 School of Chemical and Physical Sciences, Flinders University, Bedford Park, South Australia 5042, Australia ABSTRACT Compositionally zoned uraninite from the Olympic Dam iron oxide-copper-gold deposit is rarely pre- served, but represents an early product of in situ transformation of primary uraninite. Electron backscatter diffraction data (inverse pole figure, image quality, and grain reference orientation deviation mapping) reveal formation of zoned uraninite to be the result of a sequence of superimposed effects rather than from primary growth mechanisms alone. This is the first known microstructural analysis of uraninite showing crystal-plastic deformation of uraninite via formation and migration of defects and dislocations into tilt boundaries. Defining grain-scale characteristics and microstructural features in radiogenically modified minerals like uraninite carries implications in better understanding the processes involved in their formation, highlights limitations in the use of uraninite for U-Pb chemical ages, as well as for constraining the incorporation and release of daughter radioisotopes, especially where zoning, porosity, fractures, and microstructures are present. Keywords: Uraninite, EBSD, chemical zoning, tilt boundaries, microstructures, Olympic Dam INTRODUCTION Compositional zoning is a common phenomenon in minerals (e.g., Shore and Fowler 1996, and references therein). Such zoning has, however, only rarely been reported for uraninite (e.g., Alex- andre et al. 2015; Macmillan et al. 2016) despite the frequently observed high concentrations of impurity elements including: Ca, Pb, REE+Y (hereafter ΣREY), Th, Fe, Si, P, Al, Mg, Mn, K, and many others (e.g., Finch and Murakami 1999). The ~1590 Ma Olympic Dam (OD) iron-oxide copper gold deposit is unusually rich in uranium where uraninite (ideally UO 2 ) is one of three main U-minerals (the others are coffinite and brannerite; Ehrig et al. 2012, and references therein). Two generations of uraninite, comprising four main textural classes are identified at OD (Macmillan et al. 2016): (1) primary, (2) zoned, (3) cobweb, and (4) massive. Of relevance here are the early generation (Classes 1–3), all charac- terized by Pb- and ΣREY-rich (up to 0.42 apfu collectively) single grains (tens to hundreds of micrometers in size). Differentiation between classes of early uraninite is based on textural and chemical zonation patterns (Macmillan et al. 2016). The authors show that primary uraninite represents the least-altered, most pristine, crystal- line uraninite, whereas zoned and cobweb types have undergone chemical-textural modifications by in situ alteration processes (i.e., single grains of primary uraninite are progressively altered via solid-state diffusion followed by interaction with hydrothermal fluids to form zoned through to cobweb uraninite). The cobweb class consists of rhythmic intergrowths of uraninite and sulfides from core to margin within any given grain. In contrast, changes in chemical zonation patterns relative to grain morphologies used to define zoned uraninite as distinct from the primary uraninite is less well constrained, and is the subject of the present study. The main questions addressed here are whether there is a link between the chemical zoning and microstructures within grains that show such modifications and, if so, could this provide clues in understanding the crystallization and alteration history of uraninite. BACKGROUND AND RATIONALE Morphological changes between internal zoning and the margin outline as seen in grains from the zoned class of uraninite (Mac- millan et al. 2016) can result either from primary crystallization processes, during which rates and growth orientation change, or from dynamic recrystallization in a broad range of geological en- vironments (e.g., Urai et al. 1986). The combined use of electron backscatter diffraction (EBSD) and orientation contrast (OC) imaging to study microstructures within minerals can be applied to any mineral at a range of scales (Prior et al. 1999). From EBSD and OC data it is possible to quantify microstructures empirically and constrain dislocation slip systems. This, coupled with other micro- and nanoscale observations, can lead to a more rigorous understanding of the formation of the observed mineral textures. The presence of microstructures, boundaries, and interfaces (i.e., slip systems, sub-grain boundaries) have been shown to be im- portant in controlling alteration processes, and the formation of micro- and meso-textures (Prior et al. 1999). The use of microstructural data from EBSD and OC imaging has been the subject of numerous studies to quantify the formation of various mineral textures. In zircon, microstructural features may form as a result of a combination of primary growth characteristics, degree of radiation damage, and recovery from crystal-plastic deformation, e.g., formation of dislocations, low-angle grain American Mineralogist, Volume 101, pages 2351–2354, 2016 0003-004X/16/0010–2351$05.00/DOI: http://dx.doi.org/10.2138/am-2016-5753 2351 * E-mail: [email protected] kOpen access: Article available to all readers online
Transcript of Chemical zoning and lattice distortion in radiogenically ... · PDF filewith Pb and ΣREY...
Letter
Chemical zoning and lattice distortion in uraninite from Olympic Dam, South Australiak
edeLtraud MacMiLLan1,2,*, cristiana L. ciobanu3, Kathy ehrig2, nigeL J. cooK3, and aLLan Pring4
1School of Physical Sciences, The University of Adelaide, Adelaide, South Australia 5005, Australia2BHP Billiton Olympic Dam, Adelaide, South Australia 5000, Australia
3School of Chemical Engineering, The University of Adelaide, Adelaide, South Australia 5005, Australia4School of Chemical and Physical Sciences, Flinders University, Bedford Park, South Australia 5042, Australia
abstract
Compositionally zoned uraninite from the Olympic Dam iron oxide-copper-gold deposit is rarely pre-served, but represents an early product of in situ transformation of primary uraninite. Electron backscatter diffraction data (inverse pole figure, image quality, and grain reference orientation deviation mapping) reveal formation of zoned uraninite to be the result of a sequence of superimposed effects rather than from primary growth mechanisms alone. This is the first known microstructural analysis of uraninite showing crystal-plastic deformation of uraninite via formation and migration of defects and dislocations into tilt boundaries. Defining grain-scale characteristics and microstructural features in radiogenically modified minerals like uraninite carries implications in better understanding the processes involved in their formation, highlights limitations in the use of uraninite for U-Pb chemical ages, as well as for constraining the incorporation and release of daughter radioisotopes, especially where zoning, porosity, fractures, and microstructures are present.
Keywords: Uraninite, EBSD, chemical zoning, tilt boundaries, microstructures, Olympic Dam
introduction
Compositional zoning is a common phenomenon in minerals (e.g., Shore and Fowler 1996, and references therein). Such zoning has, however, only rarely been reported for uraninite (e.g., Alex-andre et al. 2015; Macmillan et al. 2016) despite the frequently observed high concentrations of impurity elements including: Ca, Pb, REE+Y (hereafter ΣREY), Th, Fe, Si, P, Al, Mg, Mn, K, and many others (e.g., Finch and Murakami 1999). The ~1590 Ma Olympic Dam (OD) iron-oxide copper gold deposit is unusually rich in uranium where uraninite (ideally UO2) is one of three main U-minerals (the others are coffinite and brannerite; Ehrig et al. 2012, and references therein). Two generations of uraninite, comprising four main textural classes are identified at OD (Macmillan et al. 2016): (1) primary, (2) zoned, (3) cobweb, and (4) massive. Of relevance here are the early generation (Classes 1–3), all charac-terized by Pb- and ΣREY-rich (up to 0.42 apfu collectively) single grains (tens to hundreds of micrometers in size). Differentiation between classes of early uraninite is based on textural and chemical zonation patterns (Macmillan et al. 2016). The authors show that primary uraninite represents the least-altered, most pristine, crystal-line uraninite, whereas zoned and cobweb types have undergone chemical-textural modifications by in situ alteration processes (i.e., single grains of primary uraninite are progressively altered via solid-state diffusion followed by interaction with hydrothermal fluids to form zoned through to cobweb uraninite). The cobweb class consists of rhythmic intergrowths of uraninite and sulfides from core to margin within any given grain. In contrast, changes in chemical zonation patterns relative to grain morphologies used to
define zoned uraninite as distinct from the primary uraninite is less well constrained, and is the subject of the present study. The main questions addressed here are whether there is a link between the chemical zoning and microstructures within grains that show such modifications and, if so, could this provide clues in understanding the crystallization and alteration history of uraninite.
bacKground and rationaLe
Morphological changes between internal zoning and the margin outline as seen in grains from the zoned class of uraninite (Mac-millan et al. 2016) can result either from primary crystallization processes, during which rates and growth orientation change, or from dynamic recrystallization in a broad range of geological en-vironments (e.g., Urai et al. 1986). The combined use of electron backscatter diffraction (EBSD) and orientation contrast (OC) imaging to study microstructures within minerals can be applied to any mineral at a range of scales (Prior et al. 1999). From EBSD and OC data it is possible to quantify microstructures empirically and constrain dislocation slip systems. This, coupled with other micro- and nanoscale observations, can lead to a more rigorous understanding of the formation of the observed mineral textures. The presence of microstructures, boundaries, and interfaces (i.e., slip systems, sub-grain boundaries) have been shown to be im-portant in controlling alteration processes, and the formation of micro- and meso-textures (Prior et al. 1999).
The use of microstructural data from EBSD and OC imaging has been the subject of numerous studies to quantify the formation of various mineral textures. In zircon, microstructural features may form as a result of a combination of primary growth characteristics, degree of radiation damage, and recovery from crystal-plastic deformation, e.g., formation of dislocations, low-angle grain
American Mineralogist, Volume 101, pages 2351–2354, 2016
0003-004X/16/0010–2351$05.00/DOI: http://dx.doi.org/10.2138/am-2016-5753 2351
* E-mail: [email protected] access: Article available to all readers online
MACMILLAN ET AL.: CHEMICAL ZONING AND LATTICE DISTORTION IN URANINITE2352
boundaries, and movement of slip systems (e.g., Reddy et al. 2007, and references therein). In other minerals (e.g., garnet, spinel) there are strong crystallographic preferred orientations and these microstructural features are shown to be linked to slip systems, dislocation creep, and recovery (Boyle et al. 1998).
Defining grain-scale characteristics in radiogenically modified minerals like zircon or uraninite is important for constraining their geologic evolution or U-Pb ages, particularly when zoning, poros-ity, fractures, and microstructures are present. Incorporation and release of daughter products of 235U and 238U decay such as 207Pb and 206Pb, respectively, depend upon the robustness of the crystal lattice to radiation damage (i.e., amorphization and healing rates), as well as external factors such as exposure to hydrothermal fluids. In contrast to zircon, healing rates are considered much faster for uraninite and the mineral does not suffer from amorphization due to radiation damage (e.g., Janeczek and Ewing 1991).
There are three slip systems identified for UO2: {001}〈110〉 at room temperature and atmospheric pressure, and {110}〈110〉 or {111}〈110〉 at higher temperatures (Kelly et al. 2012). Any of these could be activated to generate microstructures during various processes, including concentration and/or release of minor/trace elements in uraninite. Here we employ EBSD analysis to study uraninite that has the necessary prerequisites to show relationships between minor element redistribution (modification of chemical zoning, fracture infill, and mineral inclusions; Macmillan et al. 2016) and microstructures resulting from lattice distortion.
anaLyticaL MethodoLogyQuantitative analysis of uraninite was performed using a Cameca SX-Five Elec-
tron Probe Micro-Analyzer (EPMA; Adelaide Microscopy, University of Adelaide) equipped with five tunable wavelength-dispersive spectrometers (WDS). Twenty-eight elements were measured; methodologies for data collection/analysis are given in Macmillan et al. (2016) and Appendix1 1. The EPMA was also used to generate WDS elemental maps including those for PbMα and CeLα in Figures 1a and 1b, respectively.
Electron backscatter diffraction (EBSD) data were collected using the EDAX-TSL EBSD system on a FEI Helios NanoLab “DualBeam” FIB/SEM platform (Ad-elaide Microscopy). Analytical details are given in Appendix1 1. Three data-processing methods are applied: inverse pole figure (IPF), grain reference orientation deviation (GROD), and image quality (IQ) mapping.
resuLts
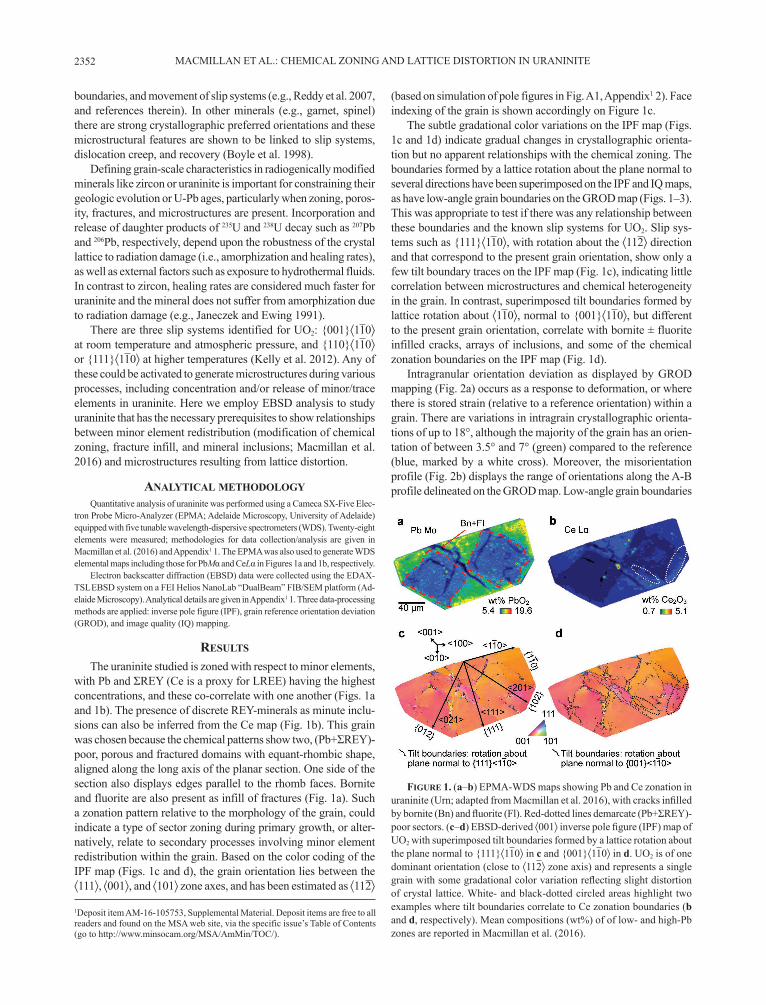
The uraninite studied is zoned with respect to minor elements, with Pb and ΣREY (Ce is a proxy for LREE) having the highest concentrations, and these co-correlate with one another (Figs. 1a and 1b). The presence of discrete REY-minerals as minute inclu-sions can also be inferred from the Ce map (Fig. 1b). This grain was chosen because the chemical patterns show two, (Pb+ΣREY)-poor, porous and fractured domains with equant-rhombic shape, aligned along the long axis of the planar section. One side of the section also displays edges parallel to the rhomb faces. Bornite and fluorite are also present as infill of fractures (Fig. 1a). Such a zonation pattern relative to the morphology of the grain, could indicate a type of sector zoning during primary growth, or alter-natively, relate to secondary processes involving minor element redistribution within the grain. Based on the color coding of the IPF map (Figs. 1c and d), the grain orientation lies between the 〈111〉, 〈001〉, and 〈101〉 zone axes, and has been estimated as 〈112〉
(based on simulation of pole figures in Fig. A1, Appendix1 2). Face indexing of the grain is shown accordingly on Figure 1c.
The subtle gradational color variations on the IPF map (Figs. 1c and 1d) indicate gradual changes in crystallographic orienta-tion but no apparent relationships with the chemical zoning. The boundaries formed by a lattice rotation about the plane normal to several directions have been superimposed on the IPF and IQ maps, as have low-angle grain boundaries on the GROD map (Figs. 1–3). This was appropriate to test if there was any relationship between these boundaries and the known slip systems for UO2. Slip sys-tems such as {111}〈110〉, with rotation about the 〈112〉 direction and that correspond to the present grain orientation, show only a few tilt boundary traces on the IPF map (Fig. 1c), indicating little correlation between microstructures and chemical heterogeneity in the grain. In contrast, superimposed tilt boundaries formed by lattice rotation about 〈110〉, normal to {001}〈110〉, but different to the present grain orientation, correlate with bornite ± fluorite infilled cracks, arrays of inclusions, and some of the chemical zonation boundaries on the IPF map (Fig. 1d).
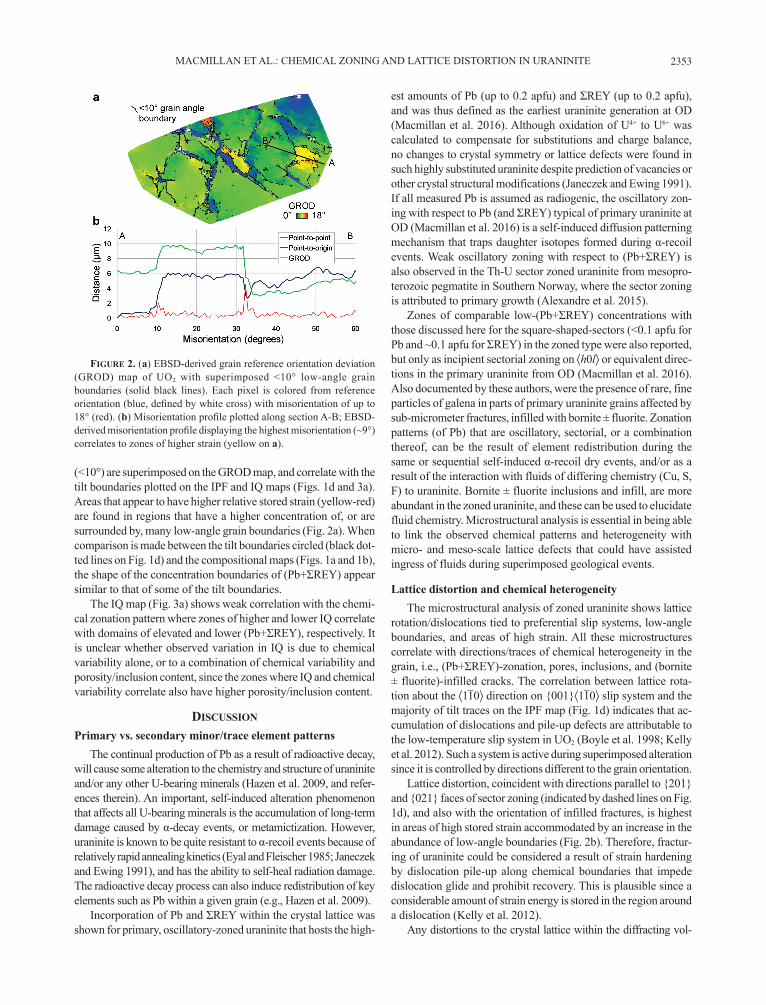
Intragranular orientation deviation as displayed by GROD mapping (Fig. 2a) occurs as a response to deformation, or where there is stored strain (relative to a reference orientation) within a grain. There are variations in intragrain crystallographic orienta-tions of up to 18°, although the majority of the grain has an orien-tation of between 3.5° and 7° (green) compared to the reference (blue, marked by a white cross). Moreover, the misorientation profile (Fig. 2b) displays the range of orientations along the A-B profile delineated on the GROD map. Low-angle grain boundaries
1Deposit item AM-16-105753, Supplemental Material. Deposit items are free to all readers and found on the MSA web site, via the specific issue’s Table of Contents (go to http://www.minsocam.org/MSA/AmMin/TOC/).
Figure 1. (a–b) EPMA-WDS maps showing Pb and Ce zonation in uraninite (Urn; adapted from Macmillan et al. 2016), with cracks infilled by bornite (Bn) and fluorite (Fl). Red-dotted lines demarcate (Pb+ΣREY)-poor sectors. (c–d) EBSD-derived 〈001〉 inverse pole figure (IPF) map of UO2 with superimposed tilt boundaries formed by a lattice rotation about the plane normal to {111}〈110〉 in c and {001}〈110〉 in d. UO2 is of one dominant orientation (close to 〈112〉 zone axis) and represents a single grain with some gradational color variation reflecting slight distortion of crystal lattice. White- and black-dotted circled areas highlight two examples where tilt boundaries correlate to Ce zonation boundaries (b and d, respectively). Mean compositions (wt%) of of low- and high-Pb zones are reported in Macmillan et al. (2016).
MACMILLAN ET AL.: CHEMICAL ZONING AND LATTICE DISTORTION IN URANINITE 2353
(<10°) are superimposed on the GROD map, and correlate with the tilt boundaries plotted on the IPF and IQ maps (Figs. 1d and 3a). Areas that appear to have higher relative stored strain (yellow-red) are found in regions that have a higher concentration of, or are surrounded by, many low-angle grain boundaries (Fig. 2a). When comparison is made between the tilt boundaries circled (black dot-ted lines on Fig. 1d) and the compositional maps (Figs. 1a and 1b), the shape of the concentration boundaries of (Pb+ΣREY) appear similar to that of some of the tilt boundaries.
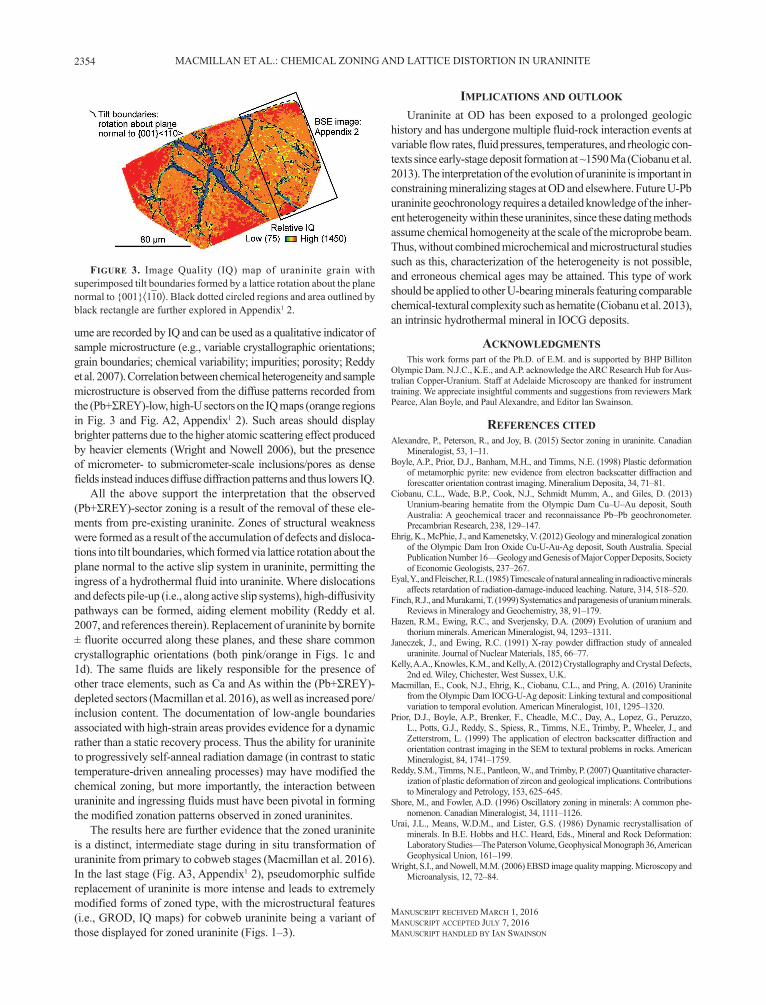
The IQ map (Fig. 3a) shows weak correlation with the chemi-cal zonation pattern where zones of higher and lower IQ correlate with domains of elevated and lower (Pb+ΣREY), respectively. It is unclear whether observed variation in IQ is due to chemical variability alone, or to a combination of chemical variability and porosity/inclusion content, since the zones where IQ and chemical variability correlate also have higher porosity/inclusion content.
discussion
Primary vs. secondary minor/trace element patternsThe continual production of Pb as a result of radioactive decay,
will cause some alteration to the chemistry and structure of uraninite and/or any other U-bearing minerals (Hazen et al. 2009, and refer-ences therein). An important, self-induced alteration phenomenon that affects all U-bearing minerals is the accumulation of long-term damage caused by α-decay events, or metamictization. However, uraninite is known to be quite resistant to α-recoil events because of relatively rapid annealing kinetics (Eyal and Fleischer 1985; Janeczek and Ewing 1991), and has the ability to self-heal radiation damage. The radioactive decay process can also induce redistribution of key elements such as Pb within a given grain (e.g., Hazen et al. 2009).
Incorporation of Pb and ΣREY within the crystal lattice was shown for primary, oscillatory-zoned uraninite that hosts the high-
Figure 2. (a) EBSD-derived grain reference orientation deviation (GROD) map of UO2 with superimposed <10° low-angle grain boundaries (solid black lines). Each pixel is colored from reference orientation (blue, defined by white cross) with misorientation of up to 18° (red). (b) Misorientation profile plotted along section A-B; EBSD-derived misorientation profile displaying the highest misorientation (~9°) correlates to zones of higher strain (yellow on a).
est amounts of Pb (up to 0.2 apfu) and ΣREY (up to 0.2 apfu), and was thus defined as the earliest uraninite generation at OD (Macmillan et al. 2016). Although oxidation of U4+ to U6+ was calculated to compensate for substitutions and charge balance, no changes to crystal symmetry or lattice defects were found in such highly substituted uraninite despite prediction of vacancies or other crystal structural modifications (Janeczek and Ewing 1991). If all measured Pb is assumed as radiogenic, the oscillatory zon-ing with respect to Pb (and ΣREY) typical of primary uraninite at OD (Macmillan et al. 2016) is a self-induced diffusion patterning mechanism that traps daughter isotopes formed during α-recoil events. Weak oscillatory zoning with respect to (Pb+ΣREY) is also observed in the Th-U sector zoned uraninite from mesopro-terozoic pegmatite in Southern Norway, where the sector zoning is attributed to primary growth (Alexandre et al. 2015).
Zones of comparable low-(Pb+ΣREY) concentrations with those discussed here for the square-shaped-sectors (<0.1 apfu for Pb and ~0.1 apfu for ΣREY) in the zoned type were also reported, but only as incipient sectorial zoning on 〈h0l〉 or equivalent direc-tions in the primary uraninite from OD (Macmillan et al. 2016). Also documented by these authors, were the presence of rare, fine particles of galena in parts of primary uraninite grains affected by sub-micrometer fractures, infilled with bornite ± fluorite. Zonation patterns (of Pb) that are oscillatory, sectorial, or a combination thereof, can be the result of element redistribution during the same or sequential self-induced α-recoil dry events, and/or as a result of the interaction with fluids of differing chemistry (Cu, S, F) to uraninite. Bornite ± fluorite inclusions and infill, are more abundant in the zoned uraninite, and these can be used to elucidate fluid chemistry. Microstructural analysis is essential in being able to link the observed chemical patterns and heterogeneity with micro- and meso-scale lattice defects that could have assisted ingress of fluids during superimposed geological events.
Lattice distortion and chemical heterogeneityThe microstructural analysis of zoned uraninite shows lattice
rotation/dislocations tied to preferential slip systems, low-angle boundaries, and areas of high strain. All these microstructures correlate with directions/traces of chemical heterogeneity in the grain, i.e., (Pb+ΣREY)-zonation, pores, inclusions, and (bornite ± fluorite)-infilled cracks. The correlation between lattice rota-tion about the 〈110〉 direction on {001}〈110〉 slip system and the majority of tilt traces on the IPF map (Fig. 1d) indicates that ac-cumulation of dislocations and pile-up defects are attributable to the low-temperature slip system in UO2 (Boyle et al. 1998; Kelly et al. 2012). Such a system is active during superimposed alteration since it is controlled by directions different to the grain orientation.
Lattice distortion, coincident with directions parallel to {201} and {021} faces of sector zoning (indicated by dashed lines on Fig. 1d), and also with the orientation of infilled fractures, is highest in areas of high stored strain accommodated by an increase in the abundance of low-angle boundaries (Fig. 2b). Therefore, fractur-ing of uraninite could be considered a result of strain hardening by dislocation pile-up along chemical boundaries that impede dislocation glide and prohibit recovery. This is plausible since a considerable amount of strain energy is stored in the region around a dislocation (Kelly et al. 2012).
Any distortions to the crystal lattice within the diffracting vol-
MACMILLAN ET AL.: CHEMICAL ZONING AND LATTICE DISTORTION IN URANINITE2354
ume are recorded by IQ and can be used as a qualitative indicator of sample microstructure (e.g., variable crystallographic orientations; grain boundaries; chemical variability; impurities; porosity; Reddy et al. 2007). Correlation between chemical heterogeneity and sample microstructure is observed from the diffuse patterns recorded from the (Pb+ΣREY)-low, high-U sectors on the IQ maps (orange regions in Fig. 3 and Fig. A2, Appendix1 2). Such areas should display brighter patterns due to the higher atomic scattering effect produced by heavier elements (Wright and Nowell 2006), but the presence of micrometer- to submicrometer-scale inclusions/pores as dense fields instead induces diffuse diffraction patterns and thus lowers IQ.
All the above support the interpretation that the observed (Pb+ΣREY)-sector zoning is a result of the removal of these ele-ments from pre-existing uraninite. Zones of structural weakness were formed as a result of the accumulation of defects and disloca-tions into tilt boundaries, which formed via lattice rotation about the plane normal to the active slip system in uraninite, permitting the ingress of a hydrothermal fluid into uraninite. Where dislocations and defects pile-up (i.e., along active slip systems), high-diffusivity pathways can be formed, aiding element mobility (Reddy et al. 2007, and references therein). Replacement of uraninite by bornite ± fluorite occurred along these planes, and these share common crystallographic orientations (both pink/orange in Figs. 1c and 1d). The same fluids are likely responsible for the presence of other trace elements, such as Ca and As within the (Pb+ΣREY)-depleted sectors (Macmillan et al. 2016), as well as increased pore/inclusion content. The documentation of low-angle boundaries associated with high-strain areas provides evidence for a dynamic rather than a static recovery process. Thus the ability for uraninite to progressively self-anneal radiation damage (in contrast to static temperature-driven annealing processes) may have modified the chemical zoning, but more importantly, the interaction between uraninite and ingressing fluids must have been pivotal in forming the modified zonation patterns observed in zoned uraninites.
The results here are further evidence that the zoned uraninite is a distinct, intermediate stage during in situ transformation of uraninite from primary to cobweb stages (Macmillan et al. 2016). In the last stage (Fig. A3, Appendix1 2), pseudomorphic sulfide replacement of uraninite is more intense and leads to extremely modified forms of zoned type, with the microstructural features (i.e., GROD, IQ maps) for cobweb uraninite being a variant of those displayed for zoned uraninite (Figs. 1–3).
iMPLications and outLooK
Uraninite at OD has been exposed to a prolonged geologic history and has undergone multiple fluid-rock interaction events at variable flow rates, fluid pressures, temperatures, and rheologic con-texts since early-stage deposit formation at ~1590 Ma (Ciobanu et al. 2013). The interpretation of the evolution of uraninite is important in constraining mineralizing stages at OD and elsewhere. Future U-Pb uraninite geochronology requires a detailed knowledge of the inher-ent heterogeneity within these uraninites, since these dating methods assume chemical homogeneity at the scale of the microprobe beam. Thus, without combined microchemical and microstructural studies such as this, characterization of the heterogeneity is not possible, and erroneous chemical ages may be attained. This type of work should be applied to other U-bearing minerals featuring comparable chemical-textural complexity such as hematite (Ciobanu et al. 2013), an intrinsic hydrothermal mineral in IOCG deposits.
acKnowLedgMentsThis work forms part of the Ph.D. of E.M. and is supported by BHP Billiton
Olympic Dam. N.J.C., K.E., and A.P. acknowledge the ARC Research Hub for Aus-tralian Copper-Uranium. Staff at Adelaide Microscopy are thanked for instrument training. We appreciate insightful comments and suggestions from reviewers Mark Pearce, Alan Boyle, and Paul Alexandre, and Editor Ian Swainson.
reFerences citedAlexandre, P., Peterson, R., and Joy, B. (2015) Sector zoning in uraninite. Canadian
Mineralogist, 53, 1–11.Boyle, A.P., Prior, D.J., Banham, M.H., and Timms, N.E. (1998) Plastic deformation
of metamorphic pyrite: new evidence from electron backscatter diffraction and forescatter orientation contrast imaging. Mineralium Deposita, 34, 71–81.
Ciobanu, C.L., Wade, B.P., Cook, N.J., Schmidt Mumm, A., and Giles, D. (2013) Uranium-bearing hematite from the Olympic Dam Cu–U–Au deposit, South Australia: A geochemical tracer and reconnaissance Pb–Pb geochronometer. Precambrian Research, 238, 129–147.
Ehrig, K., McPhie, J., and Kamenetsky, V. (2012) Geology and mineralogical zonation of the Olympic Dam Iron Oxide Cu-U-Au-Ag deposit, South Australia. Special Publication Number 16—Geology and Genesis of Major Copper Deposits, Society of Economic Geologists, 237–267.
Eyal, Y., and Fleischer, R.L. (1985) Timescale of natural annealing in radioactive minerals affects retardation of radiation-damage-induced leaching. Nature, 314, 518–520.
Finch, R.J., and Murakami, T. (1999) Systematics and paragenesis of uranium minerals. Reviews in Mineralogy and Geochemistry, 38, 91–179.
Hazen, R.M., Ewing, R.C., and Sverjensky, D.A. (2009) Evolution of uranium and thorium minerals. American Mineralogist, 94, 1293–1311.
Janeczek, J., and Ewing, R.C. (1991) X-ray powder diffraction study of annealed uraninite. Journal of Nuclear Materials, 185, 66–77.
Kelly, A.A., Knowles, K.M., and Kelly, A. (2012) Crystallography and Crystal Defects, 2nd ed. Wiley, Chichester, West Sussex, U.K.
Macmillan, E., Cook, N.J., Ehrig, K., Ciobanu, C.L., and Pring, A. (2016) Uraninite from the Olympic Dam IOCG-U-Ag deposit: Linking textural and compositional variation to temporal evolution. American Mineralogist, 101, 1295–1320.
Prior, D.J., Boyle, A.P., Brenker, F., Cheadle, M.C., Day, A., Lopez, G., Peruzzo, L., Potts, G.J., Reddy, S., Spiess, R., Timms, N.E., Trimby, P., Wheeler, J., and Zetterstrom, L. (1999) The application of electron backscatter diffraction and orientation contrast imaging in the SEM to textural problems in rocks. American Mineralogist, 84, 1741–1759.
Reddy, S.M., Timms, N.E., Pantleon, W., and Trimby, P. (2007) Quantitative character-ization of plastic deformation of zircon and geological implications. Contributions to Mineralogy and Petrology, 153, 625–645.
Shore, M., and Fowler, A.D. (1996) Oscillatory zoning in minerals: A common phe-nomenon. Canadian Mineralogist, 34, 1111–1126.
Urai, J.L., Means, W.D.M., and Lister, G.S. (1986) Dynamic recrystallisation of minerals. In B.E. Hobbs and H.C. Heard, Eds., Mineral and Rock Deformation: Laboratory Studies—The Paterson Volume, Geophysical Monograph 36, American Geophysical Union, 161–199.
Wright, S.I., and Nowell, M.M. (2006) EBSD image quality mapping. Microscopy and Microanalysis, 12, 72–84.
Manuscript received March 1, 2016 Manuscript accepted July 7, 2016Manuscript handled by ian swainson
Figure 3. Image Quality (IQ) map of uraninite grain with superimposed tilt boundaries formed by a lattice rotation about the plane normal to {001}〈110〉. Black dotted circled regions and area outlined by black rectangle are further explored in Appendix1 2.