Characterization of α-amylase in wheat and maize
147
Characterization of α-amylase in wheat and maize Dissertation to obtain the Ph. D. degree in the International Ph. D. Program for Agricultural Sciences in Göttingen (IPAG) at the Faculty of Agricultural Sciences, Georg-August-University Göttingen, Germany presented by Hanadi Riyad Aljabi born in Damascus, Syria Göttingen, May 2014
Transcript of Characterization of α-amylase in wheat and maize

Characterization of α-amylase in wheat and maize
Dissertation to obtain the Ph. D. degree
in the International Ph. D. Program for Agricultural Sciences in Göttingen (IPAG)
at the Faculty of Agricultural Sciences, Georg-August-University Göttingen, Germany
presented by
Hanadi Riyad Aljabi
born in Damascus, Syria
Göttingen, May 2014
D7 1. Name of supervisor: Prof. Dr. Elke Pawelzik 2. Name of co-supervisor: Prof. Dr. Jörg Michael Greef Date of dissertation: Juli the 16th, 2014

For My Love, DR. Mohamad Isam Almadani AND
MY LOVELY daughters: HANIN AND MARIAM And
My sweet Son Nabil

For My Majestic Parents Riad Al jabi
And Fatena Al Akrami
Dedicated to the soul of my father-In-Low Nabil Almadani
And The Syrian revolution martyrs
My Brother Mohanad For My sisters Heba and Ola
Acknowledgments
First of all I am indebted for the success in my research to Our Merciful “ALLAH” Who
always gives me the ability and facility to do my work.
Verse 58 in Yunus Sura in Holy Quran : (Say thanks to God and His mercy that let is better
than collecting).
I would like to express my deep gratitude to my supervisor Prof. Dr. Elke Pawelzik,
the Chair of Quality of Plant Products at Göttingen University for her patient supervision,
guidance, kindness, and encouragement throughout the entire period of my study. I never
forget her word “I am optimistic”. I am optimistic that you are able to do the lab work
successfully and I am optimistic that you are able to submit your thesis in the deadline. She is
showing in every meeting a very high sympathy and concern regarding to my personal
situation as a mother and a student as well.
I am grateful to my second supervisor Prof. Dr. Jörg Michael Greef, the Chair of Crop
and Soil Science at Julius Kühn-Institut (JKI), Braunschweig, who provided me when I was in
Syria an acceptance letter to achieve my PhD degree in Germany, and then he became my
second examiner. I would like to thank my third examiner, Prof. Dr. Klaus Dittert, the Chair
of Institute for Applied Plant Nutrition (IAPN) at Göttingen University for agreeing to be the
examiner in my final disputation. I would like to show my thankfulness to Dr. Frank Höppner,
a staff at Julius Kühn-Institut (JKI), Braunschweig, who for his invaluable help with collecting
maize samples from Braunschweig to do my experiments. I am greatly indebted to our friend
Dr. Walid Soufan, a staff in Al Baath University, Homs -Syria, who advised me to achieve my
PhD study in Göttingen, and patiently support me during my first days in Germany.
Thankfulness to my internal supervisor Dr. Mukhlis Shaherly, the chair of Crop Science
division in faculty of Agriculture, Damascus University- Syria, who guided me through the
research areas and during the thesis reviewing procedure.
I would also like to thank all technical assistance and colleagues in the section of
Quality of Plant Products – Crop Science department at Göttingen University, for their
support and encouragement during my doctoral studies as well for creating such friendly
atmosphere. In the following, some of them who have made this work possible are gratefully

acknowledged. First, I would like to thank Dr. Antje Wulkow for her closer supervision and
encouragement throughout the preliminary lab work at the beginning of my study. I would
like to thank my classmate and my friend Dr. Afrah Eltayeb Mohammed, for her inspiration,
hospitality and kind assistance in my research as well as in my studying life at Göttingen. She
was supporting me during the thesis reviewing procedure as well.
I would like to show my thankfulness to Urlika Hill, Manuela Krüger, Dr. Christina
Trümper and Dr. Marie Kreuzberger and Dr. Kai Eggert who guided me through wheat
experiment in FAEN-project in Göttingen. A lot of thanks also for Dr. Condro Wibowo and
Dr. Anggoro Cahyo Sukartiko, who are my colleagues during my PhD studying and we share
a lot of scientific experience and knowledge together to achieve the successful completion of
our work.
Finally, I am grateful to all relatives and friends who pray for me to achieve my PhD degree.
Table of contents I
Table of contents
ACKNOWLEDGMENTS ..................................................................................................... VII
TABLE OF CONTENTS .......................................................................................................... I
LIST OF FIGURES ............................................................................................................... VI
LIST OF TABLES .............................................................................................................. VIII
ABBREVIATIONS .............................................................................................................. XI
1. INTRODUCTION ............................................................................................................. 1
1.2. Objectives of the study ............................................................................................... 4
2. LITERATURE REVIEW ..................................................................................................... 7
2.1. Wheat and maize perspective .................................................................................... 7
2.1.1. Description and classification ....................................................................................... 7
2.1.2. Food utilization ............................................................................................................. 7
2.1.3. Production .................................................................................................................... 9
Worldwide .......................................................................................................................... 9
Germany ........................................................................................................................... 10
2.2. Characterization of the grain .................................................................................... 10
2.2.1. Grain anatomy ............................................................................................................ 10
Pericarp and testa ............................................................................................................ 11
Endosperm ....................................................................................................................... 12
Table of contents II
Embryo ............................................................................................................................. 12
2.2.2. Grain composition ...................................................................................................... 12
2.2.3. Grain growth and maturation .................................................................................... 13
2.3. Characterization of alpha-amylase ............................................................................ 15
2.3.1. Classification and function ......................................................................................... 15
2.3.2. Structure ..................................................................................................................... 16
2.3.3. Synthesis ..................................................................................................................... 17
2.3.4. Assay methods ........................................................................................................... 18
2.3.5. Technological importance .......................................................................................... 20
2.3.6. Pre-harvest sprouting ................................................................................................. 21
Physiological mechanism of pre-harvest sprouting ......................................................... 21
Economic losses of pre-harvest sprouting ....................................................................... 22
Tolerance to pre-harvest sprouting ................................................................................. 23
2.3.7. Enzyme kinetics .......................................................................................................... 25
2.3.8. Biochemical and kinetic properties of enzyme .......................................................... 26
The substrate concentration ............................................................................................ 26
The temperature effect .................................................................................................... 27
The pH effect .................................................................................................................... 27
Enzyme stability ................................................................................................................ 27
2.4. Factors influencing the grain composition and enzyme activity ................................. 30
Table of contents III
3. MATERIALS AND METHODS ......................................................................................... 31
3.1. Plant materials ......................................................................................................... 31
3.1.1. First experiment ......................................................................................................... 31
3.1.2. Second experiment .................................................................................................... 31
3.2. Post-harvest treatment ............................................................................................ 32
3.3. Determination of the chemical composition of grains ............................................... 32
3.3.1. Starch content ............................................................................................................ 32
3.3.2. Protein content .......................................................................................................... 33
3.3.3. Sugar content ............................................................................................................. 33
3.4. Ceralpha method ..................................................................................................... 34
3.4.1. Enzyme extraction ...................................................................................................... 34
3.4.2. Enzyme assay .............................................................................................................. 34
3.5. Properties of α-amylase ........................................................................................... 35
3.5.1. Enzyme extraction and assay ..................................................................................... 35
Enzyme extraction ............................................................................................................ 35
DNS method ..................................................................................................................... 35
3.5.2. Effect of temperature on enzyme activity and stability............................................. 36
3.5.3. Effect of pH on enzyme activity and stability ............................................................. 36
3.5.4. Kinetic parameters ..................................................................................................... 37
3.5.5. Electrophoretic properties of enzyme ....................................................................... 37
Table of contents IV
Extraction and purification of enzyme ............................................................................. 37
Isoelectric focusing (IEF) ................................................................................................... 38
Polyacrylamide gel electrophoresis (PAGE) ..................................................................... 38
3.6. Statistics .................................................................................................................. 39
4. RESULTS ...................................................................................................................... 40
4.1. Influence of cultivars and environments on α-amylase activity and chemical
composition throughout grain development ................................................................... 40
Experiment 1 .................................................................................................................... 40
Experiment 2 .................................................................................................................... 48
4.2. Characterization of α-amylase in wheat and maize ................................................... 57
Experiment 1 .................................................................................................................... 57
Experiment 2 .................................................................................................................... 61
5. DISCUSSION ................................................................................................................ 67
5.1. Influence of cultivars and environments on α-amylase activity and chemical
composition throughout grain development ................................................................... 67
5.1.1. The activity of α-amylase ........................................................................................... 67
5.1.2. Chemical composition ................................................................................................ 74
5.2. Characterization α-amylase in wheat and maize ....................................................... 80
5.2.1. The temperature and pH optimum of α-amylase ...................................................... 80
5.2.2. The temperature and pH stability of α-amylase ........................................................ 83
5.2.3. The kinetic properties of α-amylase .......................................................................... 86

Table of contents V
5.2.4. The electrophoretic properties of α-amylase ............................................................ 88
6. CONCLUSION .............................................................................................................. 91
7. SUMMARY .................................................................................................................. 94
8. BIBLIOGRAPHY ............................................................................................................ 96
9. APPENDIX .................................................................................................................. 114
List of figures VI
List of figures
Figure 1: The structure of (a) maize (b) and wheat (b) grains ................................................. 11
Figure 2: The action mode of α-amylase in (a) amylose and (b) amylopectin ......................... 15
Figure 3: Ribbon diagram of cereal α-amylase structure ......................................................... 17
Figure 4: Pre-harvest sprouting in (a) maize and (b) wheat .................................................... 21
Figure 5: Activity of α-amylase in two wheat cultivars planted in two locations during three
development stages ................................................................................................................. 41
Figure 6: Starch (a) and protein (b) content in two wheat cultivars planted in two locations
among three development stages ........................................................................................... 42
Figure 7: Sugar content in two wheat cultivars planted in two locations at (a) milk, (b) dough,
and (c) mature stage. ............................................................................................................... 45
Figure 8: Starch (a) and protein (b) content in seven maize cultivars among two years, 2010
and 2011, respectively ............................................................................................................. 52
Figure 9: Sugar content in seven maize cultivars in (a) 2010 and (b) 2011 ............................. 54
Figure 10: Biochemical characterization of α-amylase in two wheat cultivars planted in two
locations, (a, b): Temperature and pH optimum (c, d): Temperature and pH stability ........... 58
Figure 11: Michaelis-Menten curve for α-amylase activity in cv. Cubus (a) and cv. Amaretto
(b) in two locations, Gladebeck and Torland ........................................................................... 59
Figure 12: IEF (a) and activity staining (b) of α-amylase in two wheat cultivars at milk-ripe
stage planted in Torland........................................................................................................... 60
Figure 13: SDS-PAGE (a) and activity staining (b) of α-amylasein two wheat cultivars at milk-
ripe stage planted in Torland ................................................................................................... 61
List of figures VII
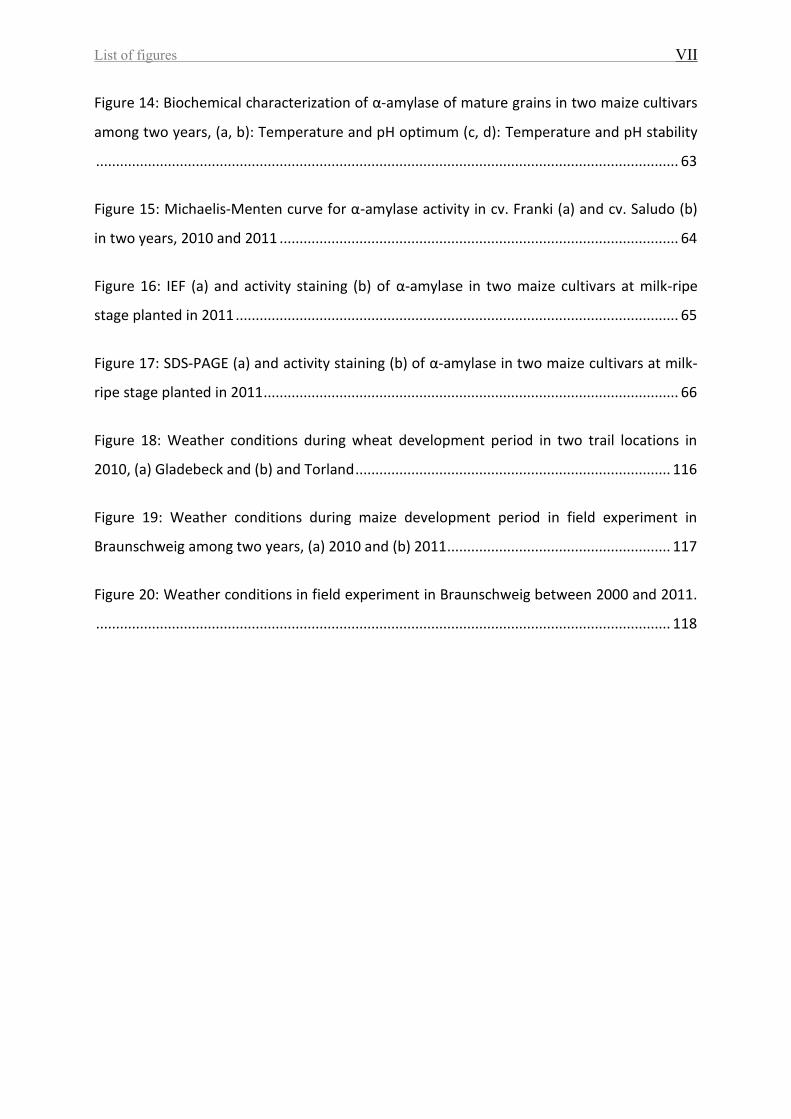
Figure 14: Biochemical characterization of α-amylase of mature grains in two maize cultivars
among two years, (a, b): Temperature and pH optimum (c, d): Temperature and pH stability
.................................................................................................................................................. 63
Figure 15: Michaelis-Menten curve for α-amylase activity in cv. Franki (a) and cv. Saludo (b)
in two years, 2010 and 2011 .................................................................................................... 64
Figure 16: IEF (a) and activity staining (b) of α-amylase in two maize cultivars at milk-ripe
stage planted in 2011 ............................................................................................................... 65
Figure 17: SDS-PAGE (a) and activity staining (b) of α-amylase in two maize cultivars at milk-
ripe stage planted in 2011 ........................................................................................................ 66
Figure 18: Weather conditions during wheat development period in two trail locations in
2010, (a) Gladebeck and (b) and Torland ............................................................................... 116
Figure 19: Weather conditions during maize development period in field experiment in
Braunschweig among two years, (a) 2010 and (b) 2011 ........................................................ 117
Figure 20: Weather conditions in field experiment in Braunschweig between 2000 and 2011.
................................................................................................................................................ 118
List of tables VIII
List of tables
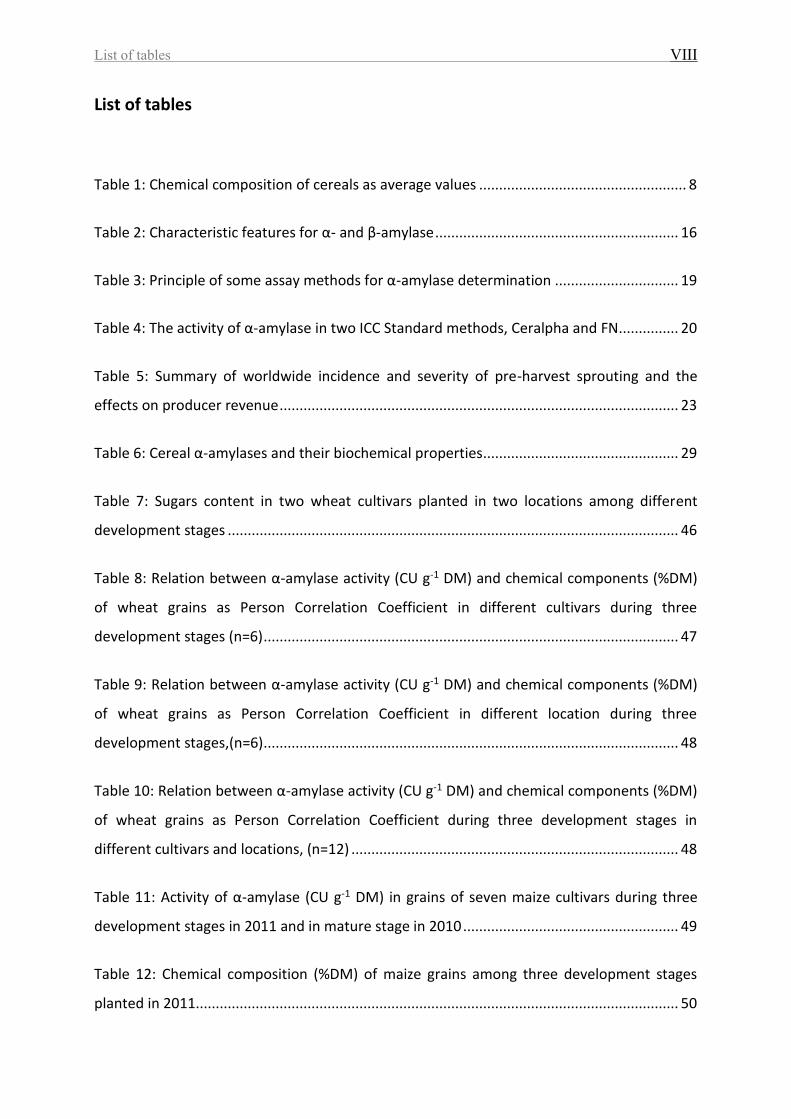
Table 1: Chemical composition of cereals as average values .................................................... 8
Table 2: Characteristic features for α- and β-amylase ............................................................. 16
Table 3: Principle of some assay methods for α-amylase determination ............................... 19
Table 4: The activity of α-amylase in two ICC Standard methods, Ceralpha and FN............... 20
Table 5: Summary of worldwide incidence and severity of pre-harvest sprouting and the
effects on producer revenue .................................................................................................... 23
Table 6: Cereal α-amylases and their biochemical properties ................................................. 29
Table 7: Sugars content in two wheat cultivars planted in two locations among different
development stages ................................................................................................................. 46
Table 8: Relation between α-amylase activity (CU g-1 DM) and chemical components (%DM)
of wheat grains as Person Correlation Coefficient in different cultivars during three
development stages (n=6) ........................................................................................................ 47
Table 9: Relation between α-amylase activity (CU g-1 DM) and chemical components (%DM)
of wheat grains as Person Correlation Coefficient in different location during three
development stages,(n=6) ........................................................................................................ 48
Table 10: Relation between α-amylase activity (CU g-1 DM) and chemical components (%DM)
of wheat grains as Person Correlation Coefficient during three development stages in
different cultivars and locations, (n=12) .................................................................................. 48
Table 11: Activity of α-amylase (CU g-1 DM) in grains of seven maize cultivars during three
development stages in 2011 and in mature stage in 2010 ...................................................... 49
Table 12: Chemical composition (%DM) of maize grains among three development stages
planted in 2011......................................................................................................................... 50
List of tables IX
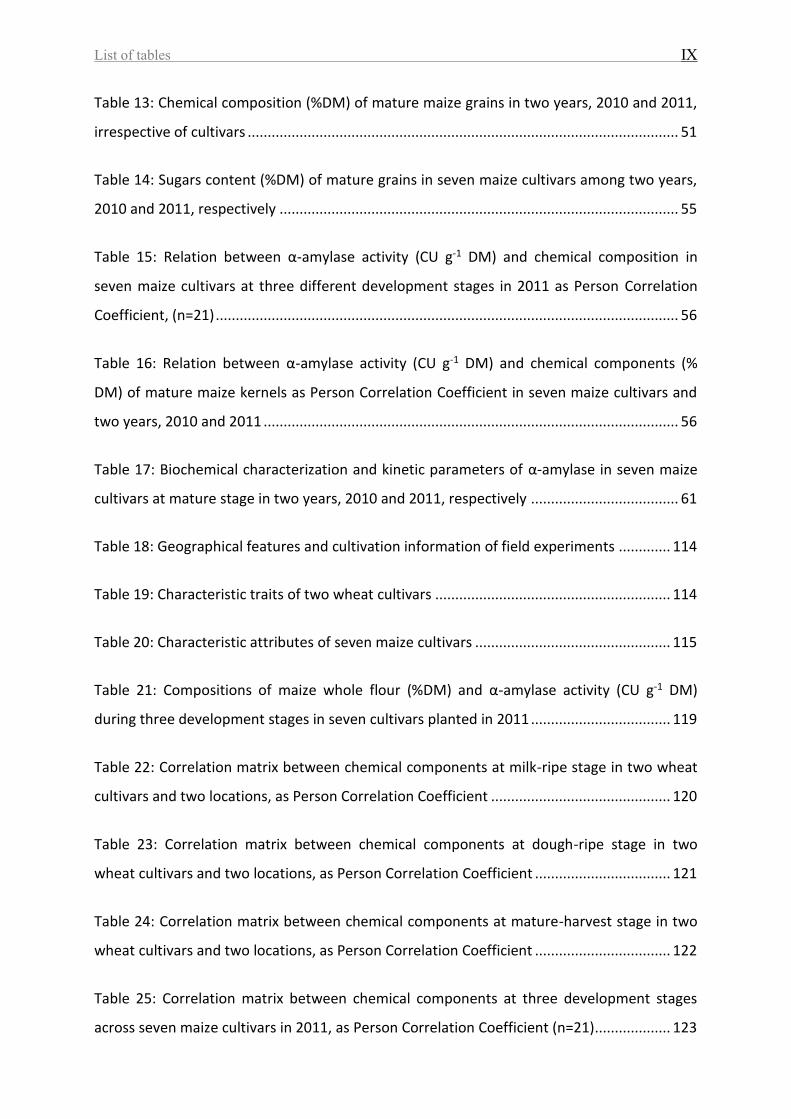
Table 13: Chemical composition (%DM) of mature maize grains in two years, 2010 and 2011,
irrespective of cultivars ............................................................................................................ 51
Table 14: Sugars content (%DM) of mature grains in seven maize cultivars among two years,
2010 and 2011, respectively .................................................................................................... 55
Table 15: Relation between α-amylase activity (CU g-1 DM) and chemical composition in
seven maize cultivars at three different development stages in 2011 as Person Correlation
Coefficient, (n=21) .................................................................................................................... 56
Table 16: Relation between α-amylase activity (CU g-1 DM) and chemical components (%
DM) of mature maize kernels as Person Correlation Coefficient in seven maize cultivars and
two years, 2010 and 2011 ........................................................................................................ 56
Table 17: Biochemical characterization and kinetic parameters of α-amylase in seven maize
cultivars at mature stage in two years, 2010 and 2011, respectively ..................................... 61
Table 18: Geographical features and cultivation information of field experiments ............. 114
Table 19: Characteristic traits of two wheat cultivars ........................................................... 114
Table 20: Characteristic attributes of seven maize cultivars ................................................. 115
Table 21: Compositions of maize whole flour (%DM) and α-amylase activity (CU g-1 DM)
during three development stages in seven cultivars planted in 2011 ................................... 119
Table 22: Correlation matrix between chemical components at milk-ripe stage in two wheat
cultivars and two locations, as Person Correlation Coefficient ............................................. 120
Table 23: Correlation matrix between chemical components at dough-ripe stage in two
wheat cultivars and two locations, as Person Correlation Coefficient .................................. 121
Table 24: Correlation matrix between chemical components at mature-harvest stage in two
wheat cultivars and two locations, as Person Correlation Coefficient .................................. 122
Table 25: Correlation matrix between chemical components at three development stages
across seven maize cultivars in 2011, as Person Correlation Coefficient (n=21)................... 123
List of tables X
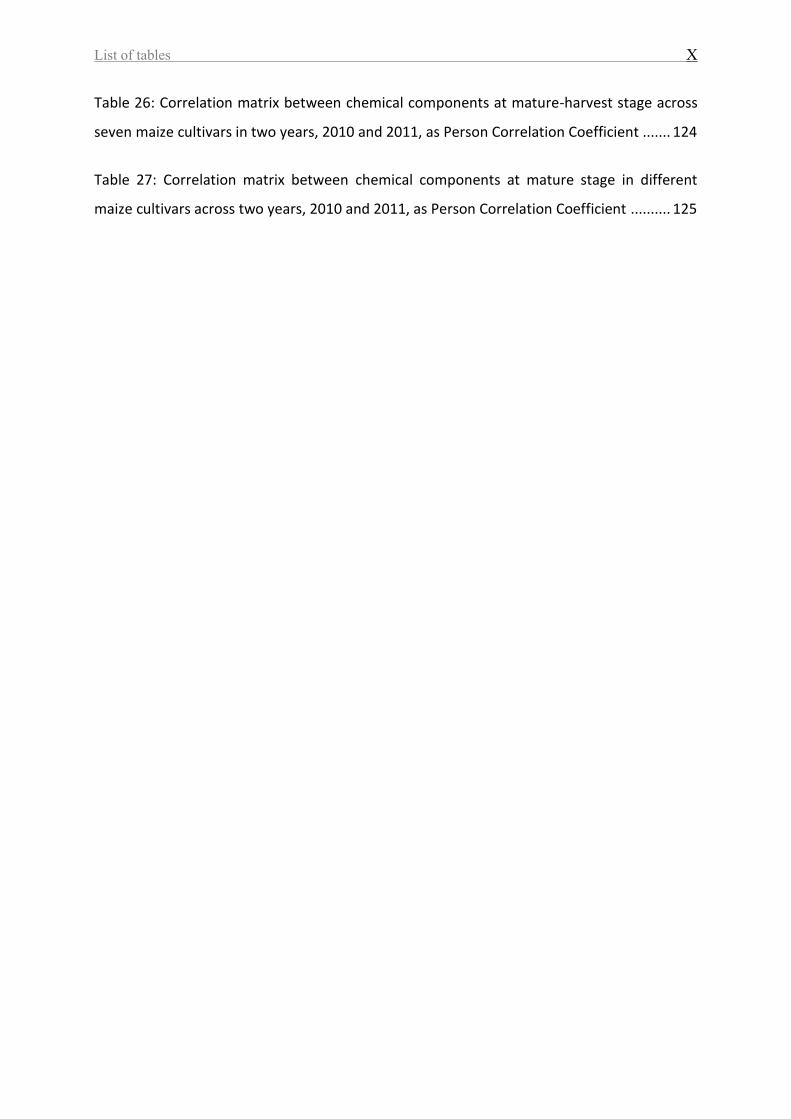
Table 26: Correlation matrix between chemical components at mature-harvest stage across
seven maize cultivars in two years, 2010 and 2011, as Person Correlation Coefficient ....... 124
Table 27: Correlation matrix between chemical components at mature stage in different
maize cultivars across two years, 2010 and 2011, as Person Correlation Coefficient .......... 125
Abbreviations XI
Abbreviations
…..............
……..
.......
..............
..........
………………..
…………………..
……………… .
……………….
………………….
………………..
……………….
……………….
…………….
…………….
…………..
……………..
……………...
………...
….........
ABA:
α-amylase:
β-amylase:
BBCH:
BPNPG7:
BSA:
°C:
cm:
CU:
cv:
cvs:
DM:
dm:
DNA:
DNS:
DWD:
e.g.:
Ed.:
ELISA:
et al.:
etc.:
EU:
EC:
Exp:
FAEN:
FAO:
FDA:
FN:
g:
Abscisic Acid
alpha-amylase
Beta-amylase
Bundesanstalt Bundessortenamt und CHemische industrie
ρ-nitrophenyl maltoheptaoside
Bundessortenamt (Federal Office of Plant Varieties)
degree Celius
centimeter
Ceralpha Unit
cultivar
cultivars
Dry Matter
decimeter
Deoxyribonucleic Acid
3,5-Dinitrosalicylic Acid
Deutsche Wetterdienst
for example
Editor
Enzyme Linked Immunosorbent Assay
and others
and so on
European Union
Enzyme Commission
Experiment
Forschungsverbund Agrar- und Ernährungswissenschaften Niedersachsen
Food and Agriculture Organization of the United Nations
FluoresceinDibutyrate Assay
Falling Number
gram
Abbreviations XII
...........
.........
…………
………….
……………
……………..
………… .
…………. .
……… ..
…… ..
…………
……… ..….
.........
...........
……….
…………….....
…………...
…..........
………………..
…………….…
GA:
ha:
HCl:
HPLC:
hrs:
ICC:
i.e.:
IEF:
JKI:
KDa:
Kg:
km:
K2O:
M:
mA:
mbar:
mg:
µl:
min:
ml:
μmol:
MPa:
mRNA:
Mw:
n:
N:
na:
NaOH:
nm:
No:
P:
PAGE:
Gibberellic Acid
hectare
Hydrochloride Acid
High Performance Liquid Chromatography
hours
International Association for Cereal Science and Technology
that is to say
Isoelectric focusing
Institut für Pflanzenbau und Bodenkunde
kilo dalton
kilogram
Michaelis-Menten constant
Potassium oxide
Mole
miliamber
millibar
milligram
microliter
minute
milliliter
micromole
Mega Pascal
messenger ribonucleic acid
Molecular weight
number of observations
Nitrogen
not available
Sodium hydroxide
nanometer
Number
product
Polyacrylamide Gel Electrophoresis
Abbreviations XIII
………….…...
………..
…………. ….
………….
………..
……….…
…………….…
…….….
………...
……………...
…………….
………….
……………..
………….
………….
…….…..
…….…..
GA:
pI:
PPD:
QTLs:
rpm:
s:
SDS-PAGE:
UK:
USA:
v:
V0:
Vmax:
vs:
VRN:
w/v:
%:
$:
Gibberellic Acid
isoelectric point
Photoperiodic Response Genes
Quantitative Trait Loci
revolution per minute
seconds
Sodium Dodecyl Sulphate-Polyacrylamide Gel Electrophoresis
United Kindom
United States of America
volt
initial velocity
the maximum velocity
versus
Vernalization genes
weight/volume
Percent
Dollar
Introduction 1
1. INTRODUCTION
Alpha-amylase belongs to a class of hydrolase enzymes that cleaves 0-glycosidic
bonds in starch molecules and related polysaccharides to give diverse products including
dextrin and smaller polymers composed of glucose units. It can be derived from several
sources including plants, animals and micro-organisms (Hussain et al. 2013).
Cereal α-amylases are known as enzyme originates from cereals grain such as wheat,
barley, maize, rye etc. (Muralikrishna and Nirmala 2005). It plays a dominant role in starch
metabolism during grain development as well as germination. It is synthesized under the
influence of plant growth hormones and exists in multiple forms (Cheng et al. 2014; Csiszar
et al. 2010). Moreover, it is successfully used in the hydrolysis of starch to low weight
products in the processing industry (Hussain et al. 2013). It is considered as an essential
criterion in the technological processing of cereals (Csiszar et al. 2010), because of its overall
effect on the quality of end-use products such as bread (Dencic et al. 2013; Goesaert et al.
2005), beer (Faltermaier et al. 2014), supplementary foods (Helland et al. 2002) and glucose
syrup (Muralikrishna and Nirmala 2005). For example, in bread making, millers would prefer
to have adequate activity of α-amylase in their wheat flour to sustain the production of
sugars required in fermentation and consequent gas production (Goesaert et al. 2005).
Additionally, low α-amylase activity from sorghum flour is desirable for stick porridge and
couscous preparation (Dicko et al. 2006). While in the brewing industry, high α-amylase
activity from malted cereals is desired to ensure the maximum production of fermentable
sugars in malting process (Awoyinka and Adebawo 2008; Dicko et al. 2006).
However, an excess of α-amylase activity impairs grains quality since enzymatic
hydrolysis of starch during food manufacture can lead to processing problems and
unsatisfactory end-products (Dencic et al. 2013; Basinskiene et al. 2011). For instance, in
baking industry, bread produced from high α-amylase activity (FN ≤ 180s to 62s, falling
number (FN) is a special number calculated to quantify the level of α-amylase activity in the
gelatinized flour/water suspension, see section 2.3.4 for details) in wheat flour has poor
volume, deformed loaf with open holes, a compact, moist and sticky crumb structure that is
difficult to slice and build up on slicer blades (Mohler et al. 2014; Dencic et al. 2013; Lunn et
al. 2001b). In addition, grain flour with high enzyme activity loses its thickening power,
Introduction 2
hence it can not be used in cream soup and gravy mixes. The noodles do not hold together
because of increasing α-amylase activity in durum wheat. Consequently, significant financial
losses affect both farmers and millers (Groos et al. 2002; Wahl and O’Rourke 1994).
From plant physiological point of view, the activity of α-amylase appears early during
development of grains, culminates somewhere between 10 and 20 days after anthesis and
then declines to low level as the grains mature (Dencic et al. 2013; Csiszar et al. 2010).
However, the elevation of α-amylase activity germplasm at harvest-ripe grains has been
identified in the European Union, South Africa, North America, Japan, Mexico and Australia
(Barnard and Smith 2012). The major cause of high α-amylase production in cereal grains in
these countries is pre-harvest sprouting. It is a phenomenon occurs occasionally in untimely
rains prior to and during the harvest season in which enhances mature grains to germinate
on the plant (Gao et al. 2013, see section 2.3.6. for details). It is determined by
environmental condition (e.g. changes of temperature, precipitation etc.) and genotypes as
well as by interactions between these factors (De laethauwer et al. 2013; Dencic et al. 2013;
Gao et al. 2013; Kondhare et al. 2012). The main destructive feature in sprouted grains is
increased α-amylase activity and other degrading enzymes, which affects significantly grains
quality and utilization in bread making and other industrial products (Dencic 2013; Csiszar et
al. 2010). This statement is supported by Singh et al. (2008) and Johansson (2002), who
recognized alteration and/or breakdown of the grain biochemical composition in the
sprouted grains results in decreasing starch, increasing sugars and protein, change in amino
acid composition and loss of dry matter. Furthermore, Simsek et al. (2014) stated that the
impact of pre-harvest sprouting on the end-products of wheat flour depends on enzyme
activities present and breakdown of starch and protein. Direct annual losses caused by
sprouting damage approach $1 billion dollars worldwide (Liu et al. 2013). This phenomenon
has an intermittent nature, in which occurs approximately 1 in 4 years in many cereal-
growing regions (Black et al. 2006; Biddulph et al. 2005). Selection for improved tolerance to
pre-harvest sprouting is a goal of cereal breeding programs worldwide (Gao et al. 2013).
The activity of cereal α-amylases plays dual roles in the breeding program for pre-
harvest sprouting. Firstly, it was found a significant difference in α-amylase activity between
resistance and sensitive cereals cultivars to pre-harvest sprouting (Gao et al. 2013). The
majority knowledge concerning the activity of α-amylase in sprouting grains is restricted to
wheat. There is only little information on maize. This is due to the fact that wheat is more
Introduction 3
susceptible to pre-harvest sprouting than maize (Bewley et al. 2013; Black et al. 2006).
Secondly, the measurement of α-amylase activity in grains is an indicator of sprouting
damage (Simsek et al. 2014; Khakimzhanov et al. 2011). The most popular method for
detecting sprouting damage, particularly in bread making industry, is FN method (ICC
Standard No. 107/1). However, several results have showed that FN can be influenced by
other parameters than only the α-amylase activity (Wang et al. 2008; Lenartz et al. 2003).
This can lead to underestimation or overestimation of actual activity of enzyme in which may
either reject lots of grains from milling processing or get rid of cultivars from breeding
programs. Instead of FN method, Ceralpha method (ICC Standard No. 303) is absolutely
specific assay for α-amylase activity and has the major advantages of simplicity, accuracy and
rapidity (Megazyme booklet 2012; Baks et al. 2006; Muralikrishna and Nirmala 2005). Hence,
it is desirable to use method which gives a direct measure of α-amylase activity in order to
screen cultivars to pre-harvest sprouting susceptibility.
From enzymological point of view, the characterization of cereal α-amylases have
been of interest to researchers for many years till now, because of thier technological
function in the end-products in different sectors ranging from food, fermentation and starch
processing industry (Adefila et al. 2012; Biazus et al. 2009; Curvelo-Santana et al. 2008;
Adewale et al. 2006; Dicko et al. 2006). The major focal point of such researches is to
investigate the optimal conditions of using the amylases from cereals in starch hydrolysis
processing. Detail knowledge about the properties of α-amylases from different cereals grain
leads to more effective selection of appropriate cereal α-amylases that meet the
prerequisites need for a specific application (El nour et al. 2013). In many developing
countries, microbial amylases either fungal or bacterial sources are expensive because of
importation. Hence, cereal amylases could be in principle a good substitute for microbial
amylases if they are sufficiently stable and available in large quantities (Adefila et al. 2012).
There are works support this idea. For example, studies carried out by Kumar et al. (2005)
had found that malted sorghum cv. M-35-1 produced a thermostable α-amylase up to 60 °C,
in which can be utilized in supplementary food that is reconstituted with hot milk or/and
water before consumption. In addition, Adewale et al. (2006) recommended Nigerian
maltsters to use α-amylase from malted sorghum over maize and millet as a brewing
adjuncts in commercial malt production because they found among three α-amylases that
sorghum α-amylase had the highest affinity, denotes as Km , towards soluble starch (see
Introduction 4
section 2.3.7 and 2.3.8 for details in kinetic properties of enzyme). This property of enzyme
is efficient in the bioconversion of starch to simple sugars by low substrate concentration
(Adefila et al. 2012).
Several studies showed that the properties of α-amylase varied somehow because of
using different maturity stage of grain i.e. immature vs. malted grains (Muralikrishna and
Nirmala 2005), different cultivars as well as different purification techniques (Daniel et al.
2008; Hunjan et al. 2006; Kumar et al. 2005). Considerable researches have been directed
towards characterizing exogenous α-amylase from malted grains (e.g. El nour et al. 2013;
Adefila et al. 2012; Biazus et al. 2009) which is de novo synthesis upon germination
(Barreroet al.2013), while there are relatively few reports concerning the properties of
endogenous α-amylase present in sound grains i.e. ungerminated grains (e.g. Rosell et al.
2001; Thevenot et al. 1992; Mares and Oettler 1991, Daussant and Renard 1987 and 1976;
Marchylo et al. 1980 and 1976). In addition, the enzymatic hydrolysis by amylases is
preferred to acid hydrolysis in starch processing industry e.g. glucose syrup, fructose syrup
etc. (Sivaramakrishnan et al. 2006), but the industrial conditions in which enzyme are used
are rather extreme, particularly with regards to temperature and pH (Prakash and Jaiswal
2010). Hence, there is enormous interest in biotechnology researches to find a particular
cereal cultivar to be a good source of α-amylase in which the characterizations of enzyme
meet the prerequisites for industrial applications (e.g. El nour et al. 2013 and 2010; Biazus et
al. 2009). Furthermore, the low cost of cereals α-amylases from local cultivars in developing
countries may enhance their utilization as a good alternative source for exporting microbials
amylases (Adefila et al. 2012; Egwim and Oloyede 2006; Adewale et al. 2006). Such work
needs to have thorough knowledge of the properties of amylase isolated from such source
and also the industrial conditions under which it is going to be applied (El nour et al. 2013;
Fernandes 2010; Biazus et al. 2009).
1.2. Objectives of the study
A key aspect of this work was to conduct systematic study on the basic
characterization of cereal α-amylase with respect to its activity and properties. A major risk
of α-amylase in cereal grains is the elevation of its activity in harvest-mature grains, making
grains inappropriate for baking and other food industry. It was reported in many literatures
that the activity of α-amylase is influenced by cultivars and environment conditions during
Introduction 5
the development of the grains up to maturity. Therefore, a method able to quantify actual α-
amylase activity is indispensable for a profound study of cereal α-amylases variability during
different development stages. Using Ceralpha method (ICC Standard No. 303) is desirable
because of its specific assay to α-amylase activity.
On the other hand, screening of a particular cereal cultivar to be a low-cost source of
α-amylase, with characteristic suitable for diverse processing conditions has gained more
attention in biotechnology in order to meet the increasing demand for that enzyme in
various industries (El nour et al. 2013). The majority of works concerning characterization of
α-amylase for food processing purpose was carried out on malted grains. Hardly any recent
study presented data of endogenous α-amylase properties from sound grains i.e. in the
normal physiological condition of grain without germination.
Therefore, our general goal was to give a complete picture of the nature of cereal α-
amylase from its activity during grain developing and ripening in the field till its properties in
sound harvest-mature grains.
Two specific objectives were drawn as following:
- In the first part of this study the objective was to assess the influence of cultivars
and environments on α-amylase activity throughout grain development using Ceralpha
method as a specific assay. In addition, biochemical compositions of grain (starch, protein
and sugars) were determined in order to find correlation with enzyme activity.
- In the second part of the study the focus was to characterize the nature of α-
amylase as present in sound grain from different cereal cultivars and environments.
To achieve this goal, two separate field experiments were conducted. In the first field,
wheat plants were grown, whereas maize plants planted in the second one. Those two
cereal crops were chosen as materials in this research because of the difference in their
susceptibility to pre-harvest sprouting as one of essential reason of increasing α-amylase
activity, and in their usage in food application as well. Wheat grains are more prone to pre-
harvest sprouting rather than maize grains. In addition, they are used in baking industry,
while maize grains are used in brewing and starch processing industry.
The present information from our study would be helpful to improve effective
selection in pre-harvest sprouting breeding programs and to promote the utilization of

Introduction 6
cereal α-amylase from particular cultivars as processing aids in hydrolysis of starch in many
food applications.
Literature review 7
2. LITERATURE REVIEW
2.1. Wheat and maize perspective
2.1.1. Description and classification
Botanically, bread wheat (Triticum aestivum L.) belongs to Pooideae subfamily of the
monocot family Poaceae (Shewry 2009). However, maize (Zea mays L.) comes from
Panicoideae subfamily in the family Poaceae (Fox and Manley 2009).
Agronomically, wheat is a temperate plant that grows best in a moderate climate
(Diallo et al. 2012). The grain classification systems are based on grain color (white vs. red),
grain hardness (hard vs. soft) and vernalization requirement (winter vs. spring) (Williams et
al. 2008). Several workers (Diallo et al. 2012; Distelfeld et al. 2009) have identified the
differences between winter and spring wheat. Winter cultivar requires vernalization. It is
planted in the middle latitude area with autumn sowing and harvested in early summer.
Spring cultivar does not have a vernalization requirement. It has planted in spring in the high
latitude area and in the low latitude area with warm winter. The harvest time is in
midsummer.
Maize is a tropical plant (Fox and Manley 2009) which requires warm growing
temperatures. There are four main categories of commercial importance which are
mentioned by McKevith 2004: (1) dent maize, is the most commonly grown for grain and
silage and is identified by the dented distal end in the crown of the grain, (2) flint maize, is
grown for food use and is characterized by an oval distal end, (3) sweet corn, is grown for
green ears (~ 70 % moisture content) being used as a human food and is dent type with high
sugar content and (4) popcorn, is consumed world-wide as a snack food and is characterized
as a flint type maize which expands when heated.
2.1.2. Food utilization
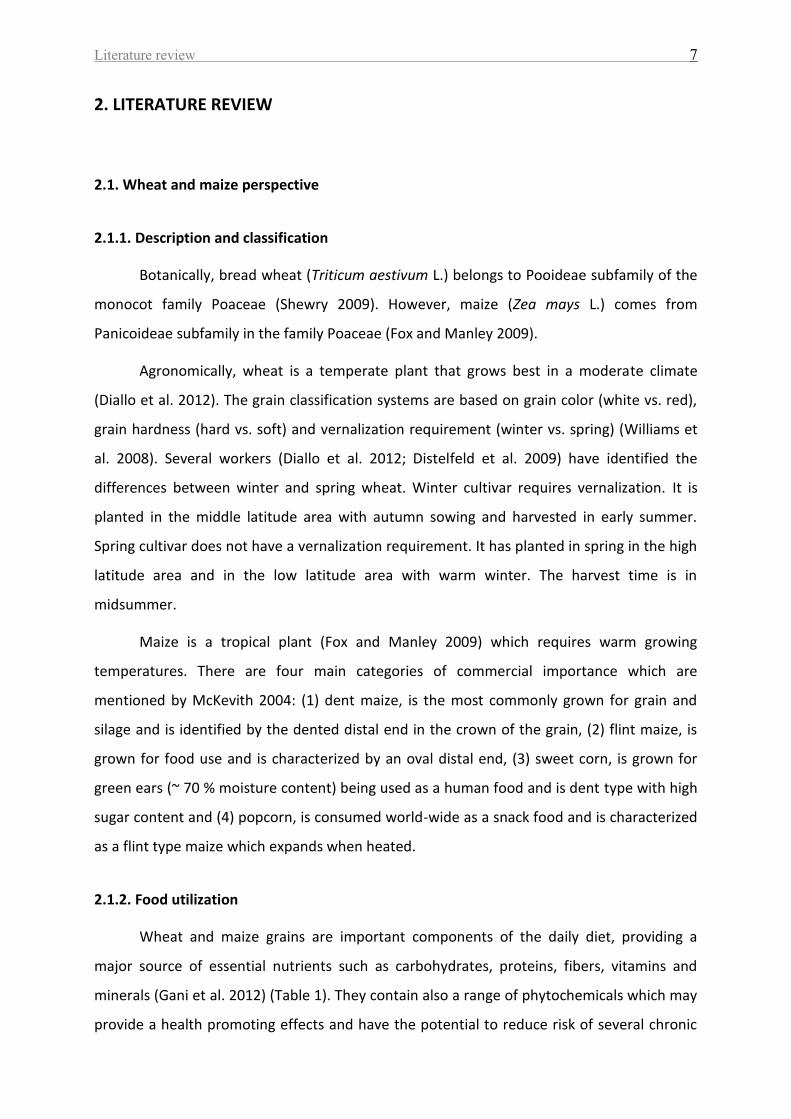
Wheat and maize grains are important components of the daily diet, providing a
major source of essential nutrients such as carbohydrates, proteins, fibers, vitamins and
minerals (Gani et al. 2012) (Table 1). They contain also a range of phytochemicals which may
provide a health promoting effects and have the potential to reduce risk of several chronic
Literature review 8
diseases such as coronary heart disease, type 2 diabetes and certain type of cancer. These
substances i.e. phytochemicals are phenolic compounds, phytosterols and carotenoids (Gani
et al. 2012). They also contain a number of anti-nutrients such as phytate and tannin that
inhibit micronutrient bioavailability (Gani et al. 2012).
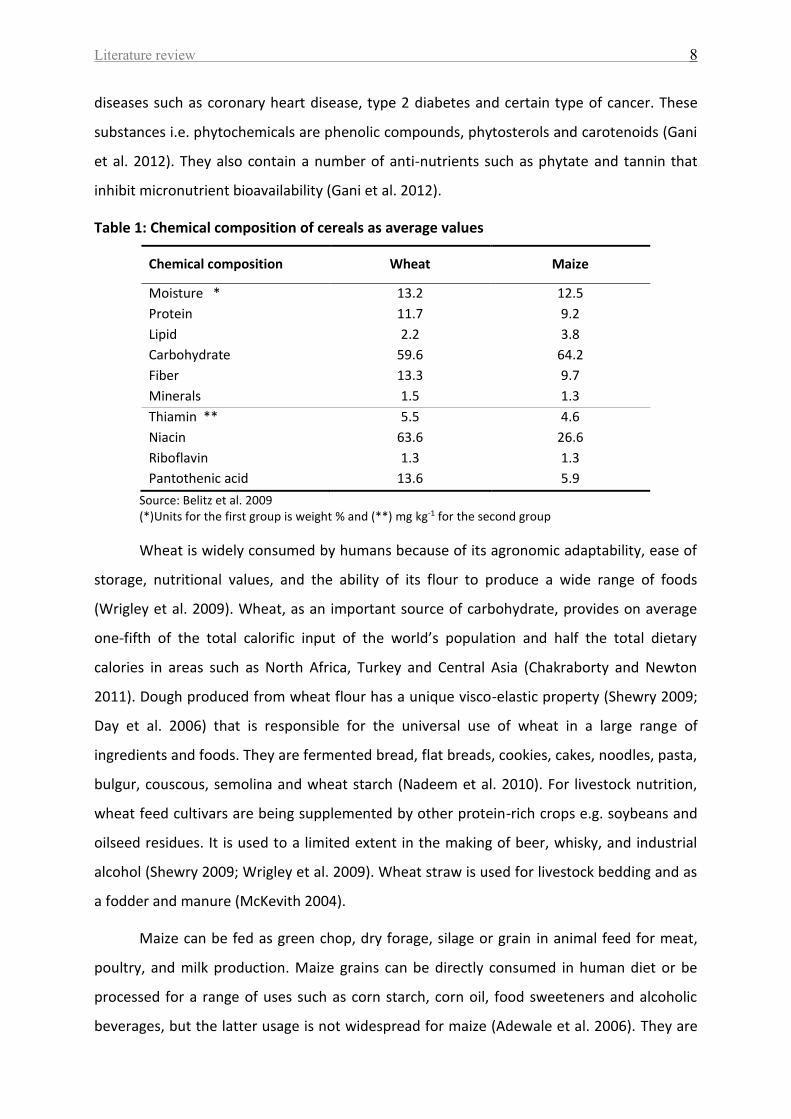
Table 1: Chemical composition of cereals as average values
Chemical composition Wheat Maize
Moisture *
Protein
Lipid
Carbohydrate
Fiber
Minerals
13.2
11.7
2.2
59.6
13.3
1.5
12.5
9.2
3.8
64.2
9.7
1.3
Thiamin **
Niacin
Riboflavin
Pantothenic acid
5.5
63.6
1.3
13.6
4.6
26.6
1.3
5.9
Source: Belitz et al. 2009 (*)Units for the first group is weight % and (**) mg kg-1 for the second group
Wheat is widely consumed by humans because of its agronomic adaptability, ease of
storage, nutritional values, and the ability of its flour to produce a wide range of foods
(Wrigley et al. 2009). Wheat, as an important source of carbohydrate, provides on average
one-fifth of the total calorific input of the world’s population and half the total dietary
calories in areas such as North Africa, Turkey and Central Asia (Chakraborty and Newton
2011). Dough produced from wheat flour has a unique visco-elastic property (Shewry 2009;
Day et al. 2006) that is responsible for the universal use of wheat in a large range of
ingredients and foods. They are fermented bread, flat breads, cookies, cakes, noodles, pasta,
bulgur, couscous, semolina and wheat starch (Nadeem et al. 2010). For livestock nutrition,
wheat feed cultivars are being supplemented by other protein-rich crops e.g. soybeans and
oilseed residues. It is used to a limited extent in the making of beer, whisky, and industrial
alcohol (Shewry 2009; Wrigley et al. 2009). Wheat straw is used for livestock bedding and as
a fodder and manure (McKevith 2004).
Maize can be fed as green chop, dry forage, silage or grain in animal feed for meat,
poultry, and milk production. Maize grains can be directly consumed in human diet or be
processed for a range of uses such as corn starch, corn oil, food sweeteners and alcoholic
beverages, but the latter usage is not widespread for maize (Adewale et al. 2006). They are
Literature review 9
used as food ingredients in breakfast i.e. corn flakes, tortilla, porridge, steamed products,
popcorn and snack (Gwirtz and Garcia‐Casal 2013). Maize contributes also in many
manufacturing sectors e.g. textile, insecticides, adhesive and paper industry (Balconi et al.
2007). It is also important substrate in biofuel (Wu and Gucl 2013). For a commercial
production, there are two methods applied in maize, named as dry and wet milling, to
produce specific end-products (Gwirtz and Garcia‐Casal 2013).
2.1.3. Production
Worldwide
The total world of wheat production is annually over 600 million tons of grain from
about 220 million ha, with an average yield of nearly 3 tons/ha (Wrigley et al. 2009; Shewry
2009). The consumption of wheat as food accounts for 53 % in the developed countries, and
close to 85 % in the developing countries (Dencic et al. 2011). It provides more than 60 % of
the total daily requirements of protein and calories. China is the largest wheat-growing area
in the world, followed closely by USA and the Russian Federation. An extensive wheat
growing regions occur in India, Australia, Canada, Pakistan, Argentina and some countries of
EU (Nadeem et al. 2010). The major wheat-growing countries in EU are France, Germany,
UK, Italy, Spain and Portugal (Curtis et al. 2002). Bread wheat occupies 95 % of the wheat
grown worldwide, with the most of the remaining 5 % being durum wheat (T. durum). Small
quantities of other wheat species, such as einkorn (T. monococcum), emmer (T. dicoccum),
spelt (T. spelta), are still grown in some countries including Spain, Turkey, the Balkans, India
and the Alpine areas (Shewry 2009).
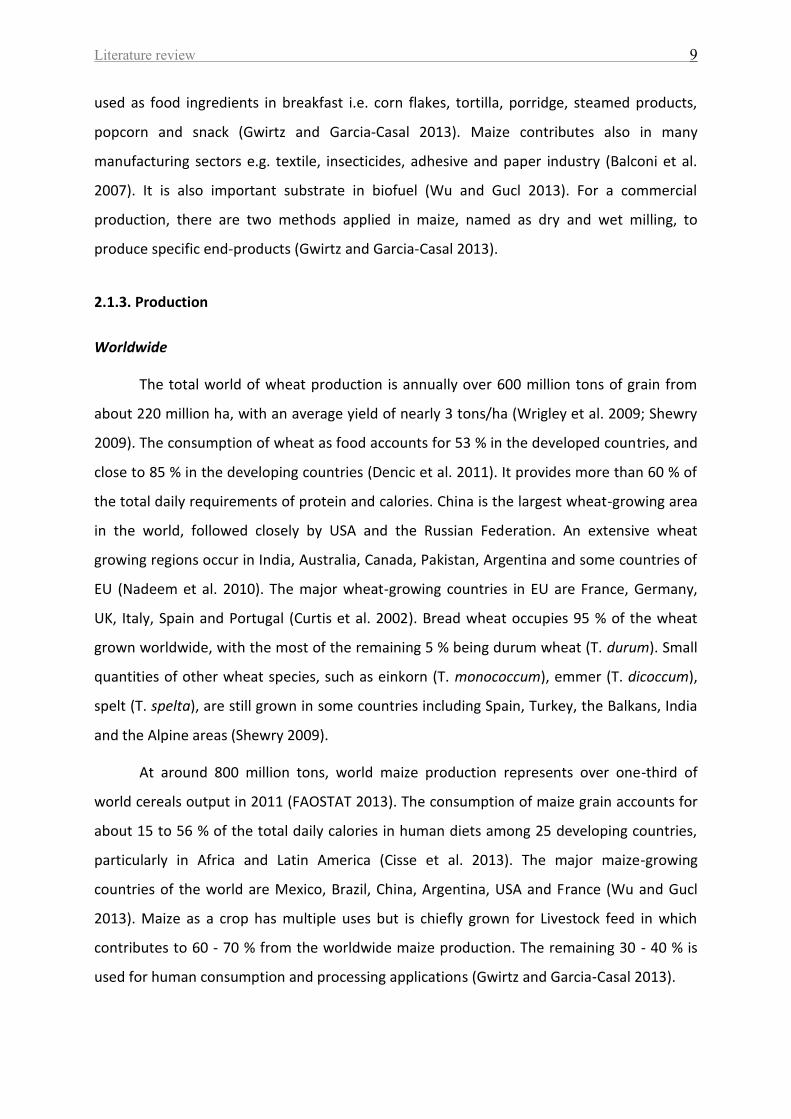
At around 800 million tons, world maize production represents over one-third of
world cereals output in 2011 (FAOSTAT 2013). The consumption of maize grain accounts for
about 15 to 56 % of the total daily calories in human diets among 25 developing countries,
particularly in Africa and Latin America (Cisse et al. 2013). The major maize-growing
countries of the world are Mexico, Brazil, China, Argentina, USA and France (Wu and Gucl
2013). Maize as a crop has multiple uses but is chiefly grown for Livestock feed in which
contributes to 60 - 70 % from the worldwide maize production. The remaining 30 - 40 % is
used for human consumption and processing applications (Gwirtz and Garcia‐Casal 2013).
Literature review 10
Germany
Germany is ranked as the world seventh largest wheat producer, as well as the EU’s
second-largest wheat producer, with an output of 24 million tons in 2010 (FAOSTAT 2013).
Most wheat in Germany is bread wheat either winter wheat (80 - 90 %) or spring wheat (10 -
20 %). Bavaria is the largest wheat producing state in Germany, followed by Lower Saxony.
Spelt wheat and durum wheat are also cultivated in some regions (Mesdage and Donner
2000). In 2009/10, about 17 million tons of wheat were domestically utilized, 48.6 % for
feed, 41 % for consumption and 10 % for industrial use (e.g. alcohol, malt, technological
starch and energy) (BMELV 2011).
In 2011, the majority of maize-planted area was for silage with 2 million ha out 2.515
million ha. The production of maize as silage was about 96 million tons compared to 5
million tons as maize grain (Deutsches Maiskomitee 2014). The largest maize-cultivating
federal states are Bavaria and Lower Saxony (Deutsches Maiskomitee 2014). Generally, the
major maize-cultivated acreage is used for animal feed as silage (Bringezu et al. 2011) in
which contributes to ~ 78 % (Frinke et al. 1999), while the remaining harvested area is used
for foods industrial applications (Goertz et al. 2010). Currently, the biomass from maize is
the dominant feedstock used in the biogas production in order to promote electricity
production along with other renewable energies such as wind and solar (Britz and Delzeit
2013; Goertz et al. 2010). For example, the production maize area for biogas sector has
exponentially increased during the past decade to more than 0.5 million ha in 2010. This
corresponds to more than 20 % of the total maize acreage of 2.3 million ha in which is
supplied 1 % of the total primary energy consumption in Germany (Grieder et al. 2012).
2.2. Characterization of the grain
2.2.1. Grain anatomy
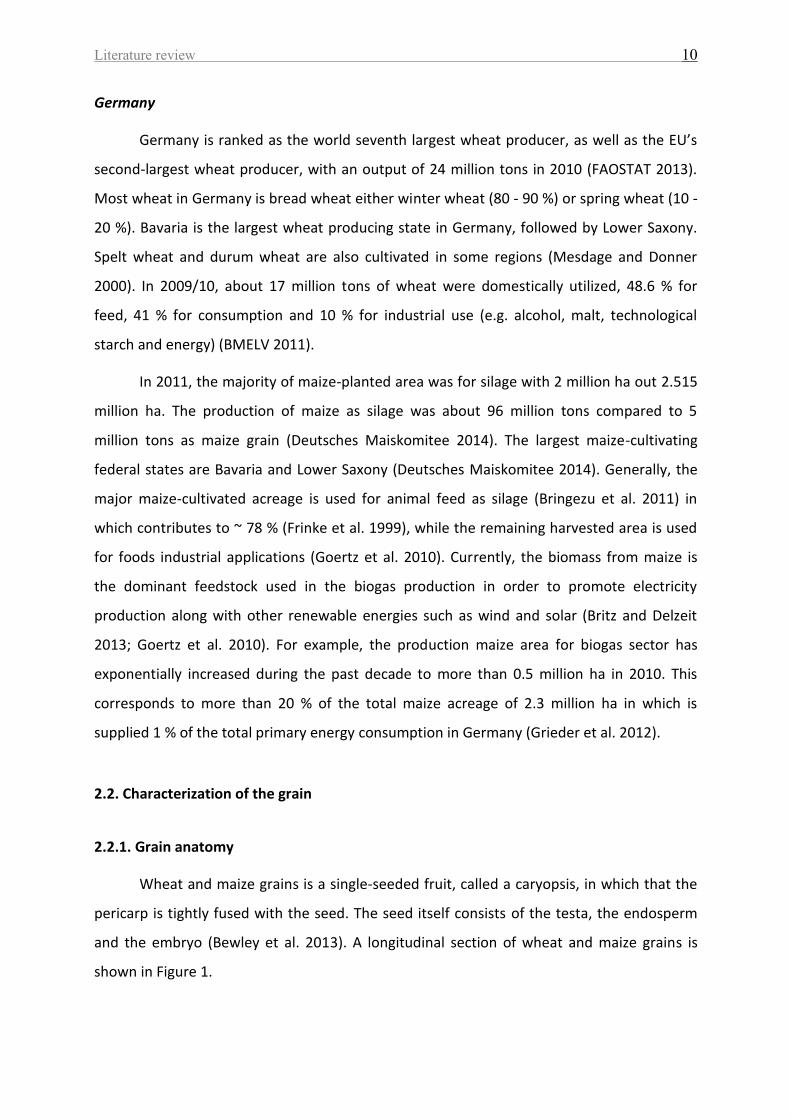
Wheat and maize grains is a single-seeded fruit, called a caryopsis, in which that the
pericarp is tightly fused with the seed. The seed itself consists of the testa, the endosperm
and the embryo (Bewley et al. 2013). A longitudinal section of wheat and maize grains is
shown in Figure 1.
Literature review 11
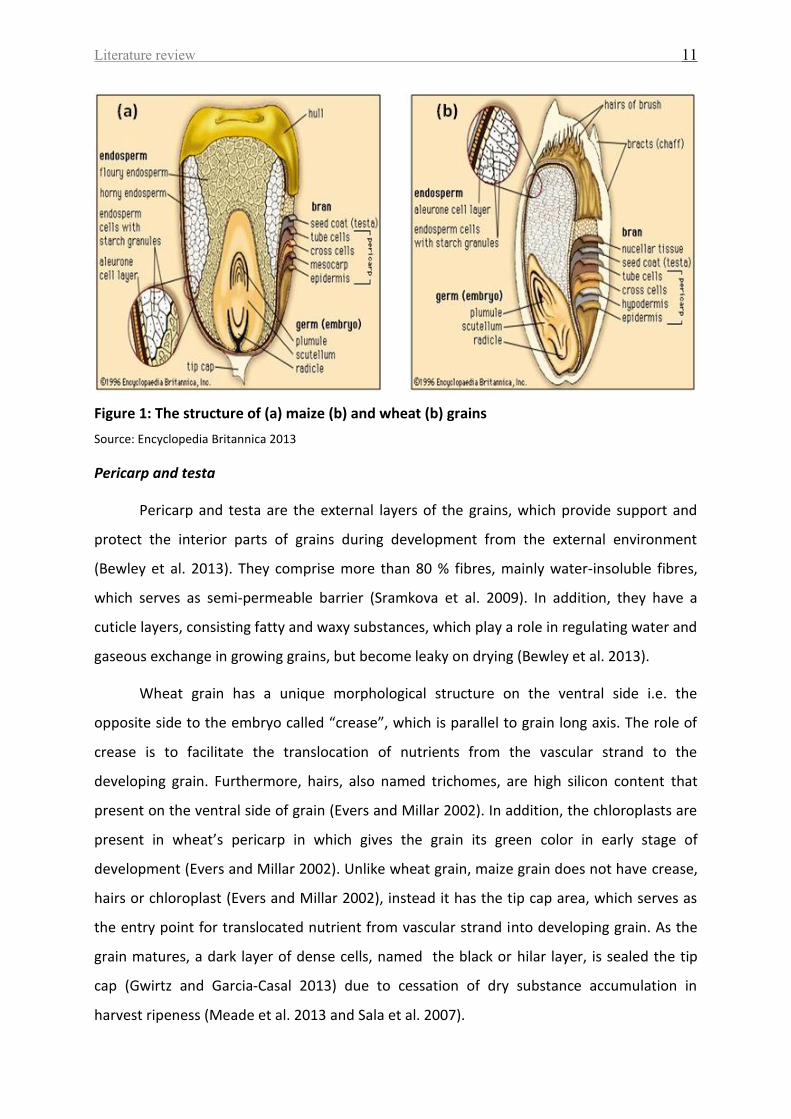
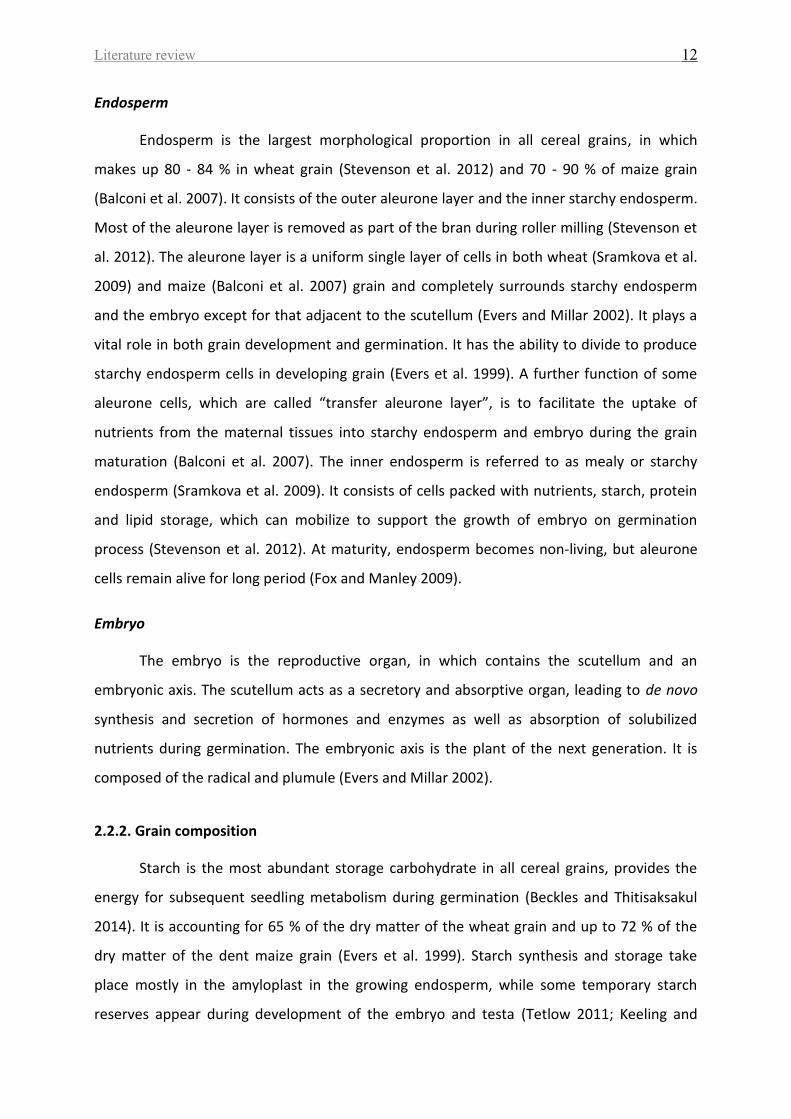
Figure 1: The structure of (a) maize (b) and wheat (b) grains
Source: Encyclopedia Britannica 2013
Pericarp and testa
Pericarp and testa are the external layers of the grains, which provide support and
protect the interior parts of grains during development from the external environment
(Bewley et al. 2013). They comprise more than 80 % fibres, mainly water-insoluble fibres,
which serves as semi-permeable barrier (Sramkova et al. 2009). In addition, they have a
cuticle layers, consisting fatty and waxy substances, which play a role in regulating water and
gaseous exchange in growing grains, but become leaky on drying (Bewley et al. 2013).
Wheat grain has a unique morphological structure on the ventral side i.e. the
opposite side to the embryo called “crease”, which is parallel to grain long axis. The role of
crease is to facilitate the translocation of nutrients from the vascular strand to the
developing grain. Furthermore, hairs, also named trichomes, are high silicon content that
present on the ventral side of grain (Evers and Millar 2002). In addition, the chloroplasts are
present in wheat’s pericarp in which gives the grain its green color in early stage of
development (Evers and Millar 2002). Unlike wheat grain, maize grain does not have crease,
hairs or chloroplast (Evers and Millar 2002), instead it has the tip cap area, which serves as
the entry point for translocated nutrient from vascular strand into developing grain. As the
grain matures, a dark layer of dense cells, named the black or hilar layer, is sealed the tip
cap (Gwirtz and Garcia‐Casal 2013) due to cessation of dry substance accumulation in
harvest ripeness (Meade et al. 2013 and Sala et al. 2007).
Literature review 12
Endosperm
Endosperm is the largest morphological proportion in all cereal grains, in which
makes up 80 - 84 % in wheat grain (Stevenson et al. 2012) and 70 - 90 % of maize grain
(Balconi et al. 2007). It consists of the outer aleurone layer and the inner starchy endosperm.
Most of the aleurone layer is removed as part of the bran during roller milling (Stevenson et
al. 2012). The aleurone layer is a uniform single layer of cells in both wheat (Sramkova et al.
2009) and maize (Balconi et al. 2007) grain and completely surrounds starchy endosperm
and the embryo except for that adjacent to the scutellum (Evers and Millar 2002). It plays a
vital role in both grain development and germination. It has the ability to divide to produce
starchy endosperm cells in developing grain (Evers et al. 1999). A further function of some
aleurone cells, which are called “transfer aleurone layer”, is to facilitate the uptake of
nutrients from the maternal tissues into starchy endosperm and embryo during the grain
maturation (Balconi et al. 2007). The inner endosperm is referred to as mealy or starchy
endosperm (Sramkova et al. 2009). It consists of cells packed with nutrients, starch, protein
and lipid storage, which can mobilize to support the growth of embryo on germination
process (Stevenson et al. 2012). At maturity, endosperm becomes non-living, but aleurone
cells remain alive for long period (Fox and Manley 2009).
Embryo
The embryo is the reproductive organ, in which contains the scutellum and an
embryonic axis. The scutellum acts as a secretory and absorptive organ, leading to de novo
synthesis and secretion of hormones and enzymes as well as absorption of solubilized
nutrients during germination. The embryonic axis is the plant of the next generation. It is
composed of the radical and plumule (Evers and Millar 2002).
2.2.2. Grain composition
Starch is the most abundant storage carbohydrate in all cereal grains, provides the
energy for subsequent seedling metabolism during germination (Beckles and Thitisaksakul
2014). It is accounting for 65 % of the dry matter of the wheat grain and up to 72 % of the
dry matter of the dent maize grain (Evers et al. 1999). Starch synthesis and storage take
place mostly in the amyloplast in the growing endosperm, while some temporary starch
reserves appear during development of the embryo and testa (Tetlow 2011; Keeling and
Literature review 13
Myers 2010). Protein content is in a relatively narrow range in cereal grains with 10 - 15 % of
the grain dry weight (She et al. 2011). Proteins of wheat and maize have primary deficiency
in lysine and methionine, whereas the secondary deficiency is threonine in wheat and
tryptophan in maize. Sugars occur in low content in mature cereals grains 1 - 2 % of the grain
dry weight, while relatively high amount of them is accumulated in immature grains (Evers et
al. 1999; Watson and Ramstad 1994). They are composed of monosaccharides, glucose and
fructose, and disaccharides, sucrose and maltose (Halford et al. 2011). Enzymes present in
cereals are relatively low in mature grain, but they are necessary for grain development and
germination (Koehler and Wieser 2013). The majority of enzymes activity during developing
period is concerned with synthesis, particularly the synthesis of storage components mainly
starch and protein. However, some hydrolytic enzymes are found in the pericarp of the
developing grain and may persist (Evers et al. 1999). Upon germination, the hydrolytic
enzymes involved in the breakdown of starch and protein are predominant in order to
provide the embryo with nutrients and energy (Koehler and Wieser 2013; Minic 2008).
Furthermore, cereal grains contain various enzyme inhibitors such as α-amylase inhibitors
(Juge and Svensson 2006) and protease inhibitors (Sharma and Gupta 2001). Maize grain is
rich in lipids with 5 % of dry matter (Watson and Ramstad 1994), whereas wheat grain
contains 0.8 - 1.5 % of its dry matter (Black et al. 2006). Cereal grain contains fibers, minerals
and vitamins from E and B-group (Koehler and Wieser 2013).
2.2.3. Grain growth and maturation
Grain development starts after the process of a double fertilization is taken place
inside the embryonic sac of the ovule. One pollen nucleus fuses with the egg nucleus to form
a diploid zygote, which gives rise to the embryo. A second pollen nucleus fuses with the two
polar nuclei forming the primary endosperm nucleus, which later produces a triploid
endosperm (Bewley et al. 2013). Pericarp and testa originate as maternal tissues present in
the carpel at the time of fertilization (Evers and Millart 2002).
The initial phase is characterized by cell division, histo-differentiation to form the
embryo and endosperm tissues, followed by cell expansion due to the influx of water into
the grain (Bewley et al. 2013; Bringezu et al. 2011). Thus the grain fresh weight increases due
to the accumulation of solutes (Meade et al. 2013; Thakur et al. 2010). The phase is referred
Literature review 14
to as “grain enlargement phase” (Balconi et al. 2007), “lag phase” (Meade et al. 2013; Thakur
et al. 2010) or “pre-storage phase” (Bringezu et al. 2011).
Next is a “storage phase” in which cell division slowly ceases and deposition of
storage reserves begins near linear (Meade et al. 2013; Bringezu et al. 2011). The sources of
nutrients for storage reserve synthesis are provided by current photosynthesis and by
remobilization reserve nutrients in vegetative tissues such as the leaves, stem and ear
(Bewley et al. 2013). The grain is called milk grain as it appears to contain a thin liquid upon
easily squashing (Edwards 2010; Dupont and Altenbach 2003). The grains of wheat have
green color because of chloroplasts in pericarp layers, whereas no chloroplast appeared in
the maize grain (Evers and Millar 2002). Cell expansion, which is related to
endoreduplication (Balconi et al. 2007) and endomitosis of DNA inside the nuclei, continues
during this phase in which influences the final grain size (Bringezu et al. 2011). After that, the
grain dry weight rapidly increases, resulted in a reduction in water content gradually as the
insoluble storage reserves displace water from the cytoplasm (Bewley et al. 2013), and the
grain as a consequence has the consistency of dough (Edwards 2010; Dupont and Altenbach
2003). The color of dough grains in wheat changes from green to yellow (Dornez 2007),
while in maize grain, a distinct horizontal line across the grain, called “milk line”, is appeared
as boundary between the liquid and solid areas of the developing grain. This line slowly
progresses to the tip of grain over next weeks (Sala et al. 2007; Santos et al. 2005). By the
end of this phase, the grain reaches its maximum dry weight, commonly referred to as
physiological maturity, even though it still contains approximately 30 - 35 % water (Meade et
al. 2013; Thakur et al. 2010). Cell expansion and water accumulation stops first, followed by
the accumulation of protein and starch ceases (Bewley et al. 2013). This prevention of
reserve is caused due to the formation of a waxy layer at the placenta-chalazal region
prevents the supply of nutrients into the grain (Dupont and Altenbach 2003). Around this
time, the endosperm cells undergo a form of apoptosis i.e. programmed cell death, while the
aleurone layer remains viable (Balconi et al. 2007). The plant has become completely yellow
and the grain color in wheat turns to golden yellow (Dornez 2007). In maize grains, the “milk
line” disappears (Sala et al. 2007 and Santos et al. 2005) and a “black layer” or “hilar” forms
at the tip cap of the grains (Gwirtz and Garcia‐Casal 2013) due to cessation of dry substance
accumulation (Meade et al. 2013; Sala et al. 2007). The period from the beginning of grain
growth until the grain reaches maximum dry weight at physiological maturity is called “grain
Literature review 15
filling” period (Egli 2004), and grain quality is essentially formed during this period (Zhang et
al. 2008).
Ripening (Edward 2010), the last phase, is associated with the loss of moisture, stable
dry weight and entrance of grain into a quiescent state (Meade et al. 2013; Bewley et al.
2013; Thakur et al. 2010). The grain is usually harvested when it has dried to between 13 and
15 % moisture. This phase is sometimes termed as “harvest ripe”, “grain ripe”, “harvest
maturity”, “harvest ripeness” (Bringezu et al. 2011; Farrer et al. 2006).
2.3. Characterization of alpha-amylase
2.3.1. Classification and function
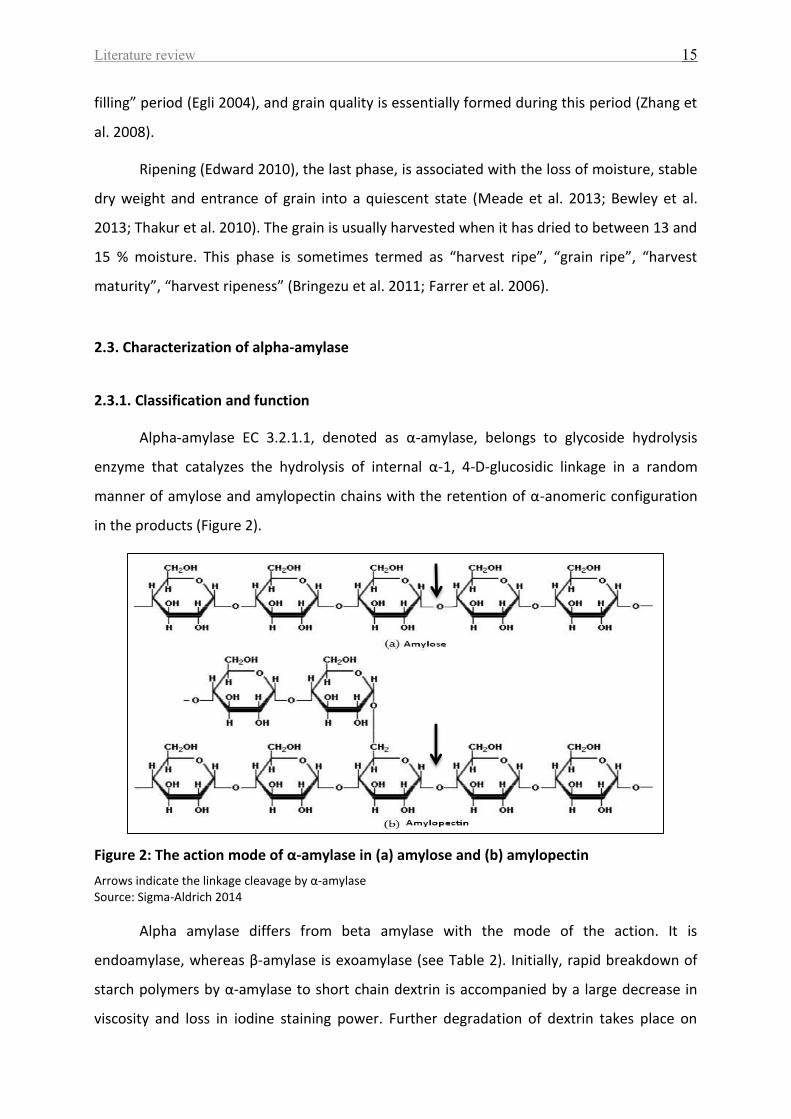
Alpha-amylase EC 3.2.1.1, denoted as α-amylase, belongs to glycoside hydrolysis
enzyme that catalyzes the hydrolysis of internal α-1, 4-D-glucosidic linkage in a random
manner of amylose and amylopectin chains with the retention of α-anomeric configuration
in the products (Figure 2).
Figure 2: The action mode of α-amylase in (a) amylose and (b) amylopectin
Arrows indicate the linkage cleavage by α-amylase Source: Sigma-Aldrich 2014
Alpha amylase differs from beta amylase with the mode of the action. It is
endoamylase, whereas β-amylase is exoamylase (see Table 2). Initially, rapid breakdown of
starch polymers by α-amylase to short chain dextrin is accompanied by a large decrease in
viscosity and loss in iodine staining power. Further degradation of dextrin takes place on
Literature review 16
longer incubation, reducing sugars then appear and finally α-maltose is formed (Belitz et al.
2009; Minic 2008; Muralikrishna and Nirmala 2005; Gupta et al. 2003).
Table 2: Characteristic features for α- and β-amylase
Characteristic features α-amylase1 β-amylase2
Glycosidic bond specificity α-1, 4-D-glucosyl of polymer at
internal positions α-1, 4-D-glucosyl from the
nonreducing end of polymer Mode of the action Endo-attack Exo-attack
Products of starch hydrolysis α-dextrin, α-maltose and α-
malto-oligoasaccharides β-matose
Action at branch point α-1, 6-D-glucosyl
Can bypass Can not bypass
Decrease in viscosity and Iodine staining
Rapid Slow
Source: 1Muralikrishna and Nirmala 2005, 2 Ziegler 1999
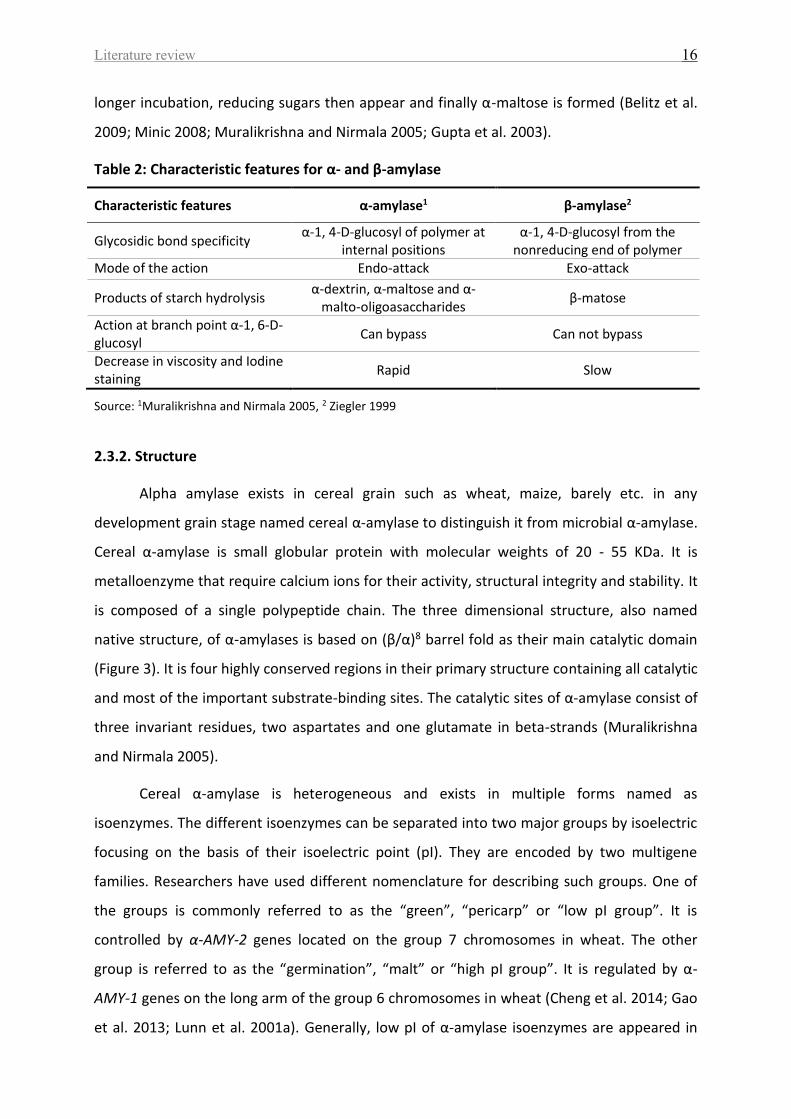
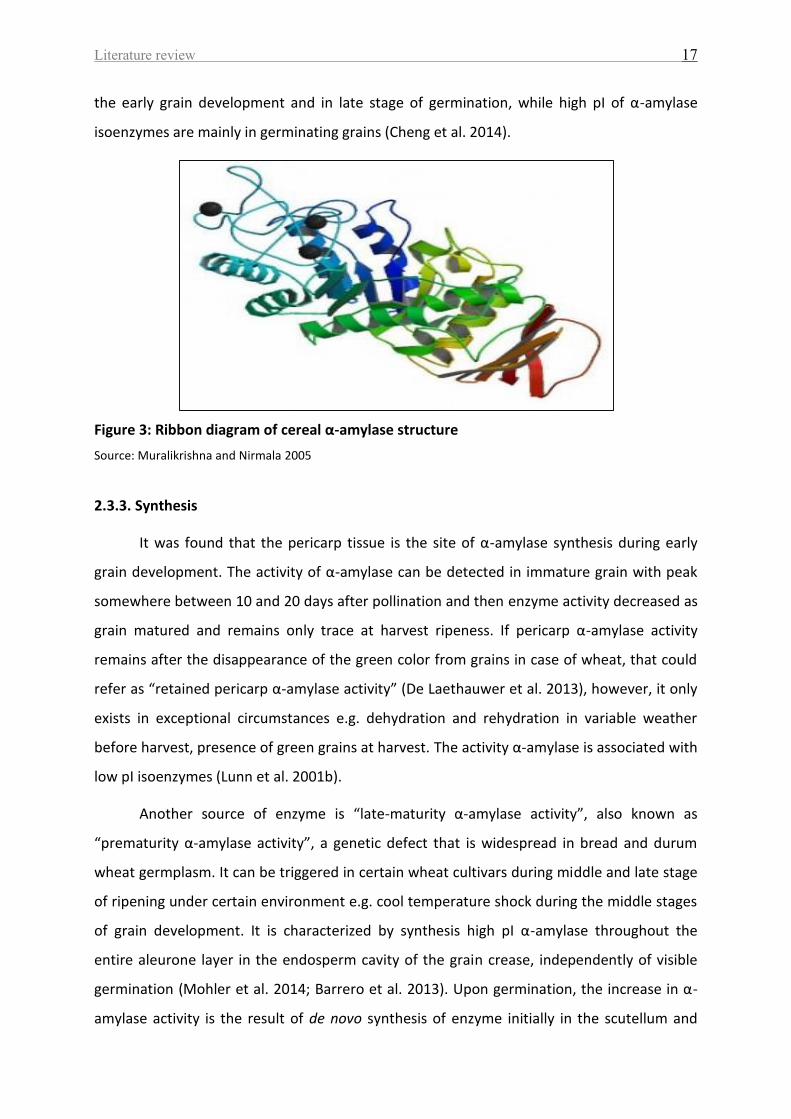
2.3.2. Structure
Alpha amylase exists in cereal grain such as wheat, maize, barely etc. in any
development grain stage named cereal α-amylase to distinguish it from microbial α-amylase.
Cereal α-amylase is small globular protein with molecular weights of 20 - 55 KDa. It is
metalloenzyme that require calcium ions for their activity, structural integrity and stability. It
is composed of a single polypeptide chain. The three dimensional structure, also named
native structure, of α-amylases is based on (β/α)8 barrel fold as their main catalytic domain
(Figure 3). It is four highly conserved regions in their primary structure containing all catalytic
and most of the important substrate-binding sites. The catalytic sites of α-amylase consist of
three invariant residues, two aspartates and one glutamate in beta-strands (Muralikrishna
and Nirmala 2005).
Cereal α-amylase is heterogeneous and exists in multiple forms named as
isoenzymes. The different isoenzymes can be separated into two major groups by isoelectric
focusing on the basis of their isoelectric point (pI). They are encoded by two multigene
families. Researchers have used different nomenclature for describing such groups. One of
the groups is commonly referred to as the “green”, “pericarp” or “low pI group”. It is
controlled by α-AMY-2 genes located on the group 7 chromosomes in wheat. The other
group is referred to as the “germination”, “malt” or “high pI group”. It is regulated by α-
AMY-1 genes on the long arm of the group 6 chromosomes in wheat (Cheng et al. 2014; Gao
et al. 2013; Lunn et al. 2001a). Generally, low pI of α-amylase isoenzymes are appeared in
Literature review 17
the early grain development and in late stage of germination, while high pI of α-amylase
isoenzymes are mainly in germinating grains (Cheng et al. 2014).
Figure 3: Ribbon diagram of cereal α-amylase structure
Source: Muralikrishna and Nirmala 2005
2.3.3. Synthesis
It was found that the pericarp tissue is the site of α-amylase synthesis during early
grain development. The activity of α-amylase can be detected in immature grain with peak
somewhere between 10 and 20 days after pollination and then enzyme activity decreased as
grain matured and remains only trace at harvest ripeness. If pericarp α-amylase activity
remains after the disappearance of the green color from grains in case of wheat, that could
refer as “retained pericarp α-amylase activity” (De Laethauwer et al. 2013), however, it only
exists in exceptional circumstances e.g. dehydration and rehydration in variable weather
before harvest, presence of green grains at harvest. The activity α-amylase is associated with
low pI isoenzymes (Lunn et al. 2001b).
Another source of enzyme is “late-maturity α-amylase activity”, also known as
“prematurity α-amylase activity”, a genetic defect that is widespread in bread and durum
wheat germplasm. It can be triggered in certain wheat cultivars during middle and late stage
of ripening under certain environment e.g. cool temperature shock during the middle stages
of grain development. It is characterized by synthesis high pI α-amylase throughout the
entire aleurone layer in the endosperm cavity of the grain crease, independently of visible
germination (Mohler et al. 2014; Barrero et al. 2013). Upon germination, the increase in α-
amylase activity is the result of de novo synthesis of enzyme initially in the scutellum and
Literature review 18
later by the adjacent aleurone (Barrero et al. 2013). If the germination process occurs in
grains still on the ear during wet and cool harvest period, the process of that germination
and induction of α-amylase activity is named “pre-harvest sprouting” (De Laethauwer et al.
2013; Gao et al. 2013). Two isoenzymes group of α-amylase have been identified in sprouted
grains, high pI group in the early germination, and low pI in the later stages of germination
(Lunn et al. 2001a). There is also another enzyme activity that is rarely recognized in
literatures. This enzyme activity “pre-maturity sprouting” enhanced upon germination of
developing grain that has high moisture content > 35 % (Lunn et al. 2001a).
The dominant role of α-amylase in grain development as well as germination grain is
in starch metabolism (Cheng et al. 2014; Minic 2008). The regulatory mechanism that
influence α-amylase gene expression and secretory processes during grain development,
maturation and germination appeared to be controlled by several factors such as the growth
hormones, intracellular calcium concentration and metabolic sugars (Muralikrishna and
Nirmala 2005; Lovegrove and Hooley 2000). Typically, the secretion pathway of enzyme
proceeds by means of transcription, translation of mRNA on rough endoplasmic reticulum,
and intracellular transport of enzyme protein to the Golgi apparatus, and then to the plasma
membrane (Mitsui and Iton 1997). Differences in the activity of α-amylase could be induced
by genotypes, environmental conditions, quantitative trait loci (QTLs) and the interaction
between these factors (De Laethauwer et al. 2013; Dencic et al. 2013).
2.3.4. Assay methods
A number of methods which are currently available for α-amylase assay are present
in Table 3 (e.g. Megazyme booklet 2012; Xiao et al. 2006; Muralikrishna and Nirmala 2005;
Gupta et al. 2003; ICC Standard booklet 1999). These are based mainly on four groups: (1)
decrease in the blue color of starch-iodine complex. This procedure reflects the
endocleavage of starch and can be used routinely to assay α-amylase. (2) Increase in the
reducing sugars, 3, 5-dinitrosalicylic acid (DNS) is the most commonly method used for direct
measure of starch hydrolysis because of its reliability and simplicity. (3) Decrease in the
viscosity of starch solution, falling number (FN) method is accepted as international standard
methods ICC Standard No. 107/1 in the bakery industry to assess the quality of the flour
based on the determination of the rheological properties of the dough. The FN value above
220s is required for good bread quality (Dencic et al. 2013; Kreuzberger 2011; Johansson
Literature review 19
2002). (4) Degradation of color-complexed substrate, ρ-nitrophenyl maltoheptaoside
(BPNPG7) is an example of a chromogenic substrate which is sensitive for α-amylase
determination in Ceralpha method (ICC Standard No. 303).
Table 3: Principle of some assay methods for α-amylase determination
Method Substrate Reaction principle Unit
Starch-
iodine1 Starch or amylose
Starch-iodine complex hydrolysis, reducing the complex and blue color
U ml-1*
3,5dinitro- salicylic
acid
(DNS)2
Native or soluble starch
3,5-Dinitrosalicylicacid reduced to 3-amino-5-nitrosalicylic
μmol reducing sugar min-1
Falling number
(FN)3
Flour as native substrate
Measures the time required for a plunger to fall through heated suspension of flour in water at
100 °C in a large glass test tube second (s)
Ceralpha 4
ρ-nitrophenyl maltoheptaoside
(BPNPG)
Endolytic attack followed by α-glucosidase/glucoamilase action on p-
nitropphenol maltosaccharide fragment, releasing free p-nitropphenol
Ceralpha Unit (CU)
*U: One unit is definedas the disappearance of an average of 1 mg of iodine binding starch per min Source: 1Gupta et al. 2003; 2Xiao et al. 2006; 3ICC Standard booklet 1999; 4Megazyme booklet 2012
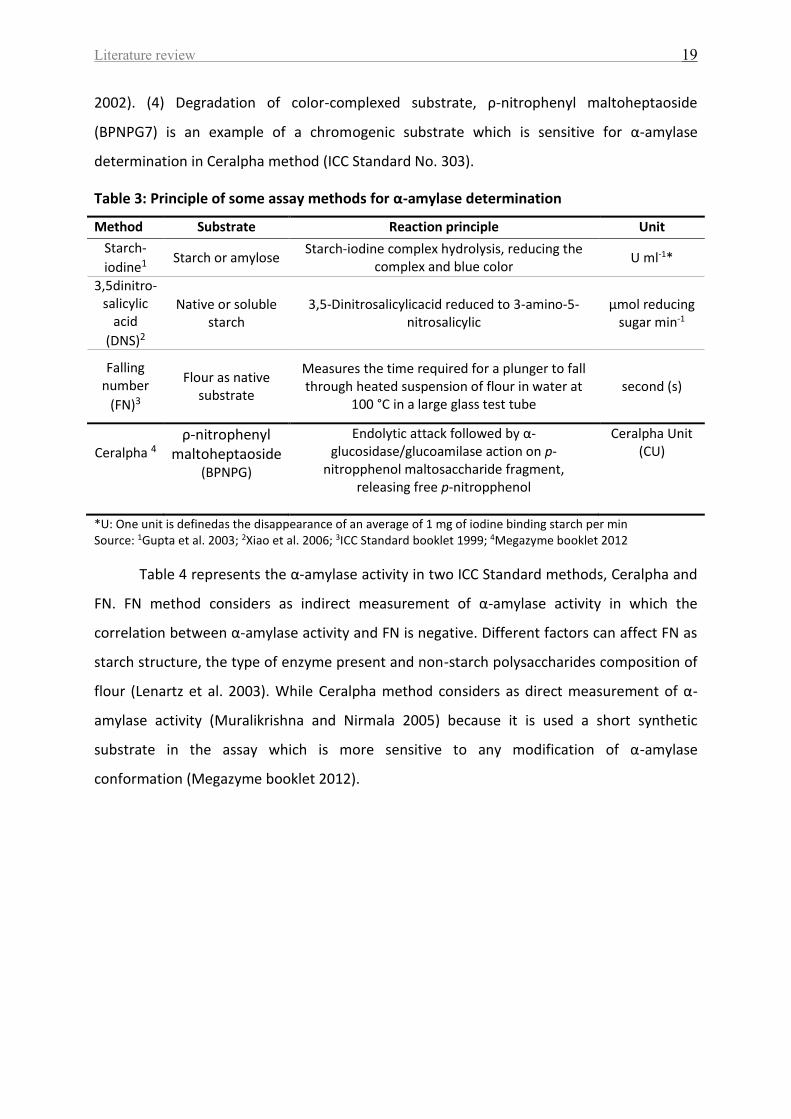
Table 4 represents the α-amylase activity in two ICC Standard methods, Ceralpha and
FN. FN method considers as indirect measurement of α-amylase activity in which the
correlation between α-amylase activity and FN is negative. Different factors can affect FN as
starch structure, the type of enzyme present and non-starch polysaccharides composition of
flour (Lenartz et al. 2003). While Ceralpha method considers as direct measurement of α-
amylase activity (Muralikrishna and Nirmala 2005) because it is used a short synthetic
substrate in the assay which is more sensitive to any modification of α-amylase
conformation (Megazyme booklet 2012).
Literature review 20
Table 4: The activity of α-amylase in two ICC Standard methods, Ceralpha and FN
Ceralpha method ICC Standard No. 303
(CU)*
FN method ICC Standard No. 107/1
(s)*
0.15 373 0.25 290 0.28 258 0.33 249 0.45 224 0.62 189 1.2 162 2.6 120 4.3 73 4.6 62
Source: Kindred et al. 2005; Cato 2005; Bhandari 2002 *CU, Ceralpha Unit and s, second
2.3.5. Technological importance
Numerous studies in the past till now have been illustrated the significance of α-
amylase in breadmaking (e.g. Belitz et al. 2009; Goesaert et al. 2005; Martinez-Anaya and
Jimenez 1997). Their work can be summarized as follows, α-amylase has two primary
functions in baking: (1) hydrolysis of native starch granules, damaged starch and gelatinized
starch and subsequently reduction the dough viscosity resulting in improved dough handling
and enhancement of crumb volume and texture, (2) the enhanced provision of fermentable
sugars for yeast activity to produce carbon dioxide, thus improved the gas retention
properties of dough and increased the loaf volume of bread. Additionally, bread flavor and
crust color are improved both by sugars produced by α-amylase and Maillard reaction
products.
Addition of α-amylase is required to optimize the α-amylase activity of the flour i.e.
flour standardization and at retarding bread staling. Flour standardization is performed by
malted barley and wheat or fungal α-amylase from Aspergillus oryzae.
However, the main issues with high α-amylase activity are softening of dough, sticky
bread crumb, problems when slicing bread and bread crust overly colored as a result of
sugar caramelization due to extreme amount of dextrin. These problems occur from flour of
sprouted wheat grains as a result of unfavorable growing conditions of plant prior to harvest
and it is discussed in details in section 2.3.6.
In addition to bread making, cereal α-amylases in barley, sorghum, maize and millet
grains are necessary in the malt and beer production to ensure the maximum production of
Literature review 21
fermentable sugars (Faltermaier et al. 2014; Taylor et al. 2013). They are also used in
supplementary foods e.g. porridge in many African countries (Dicko et al. 2006; Helland et al.
2002).
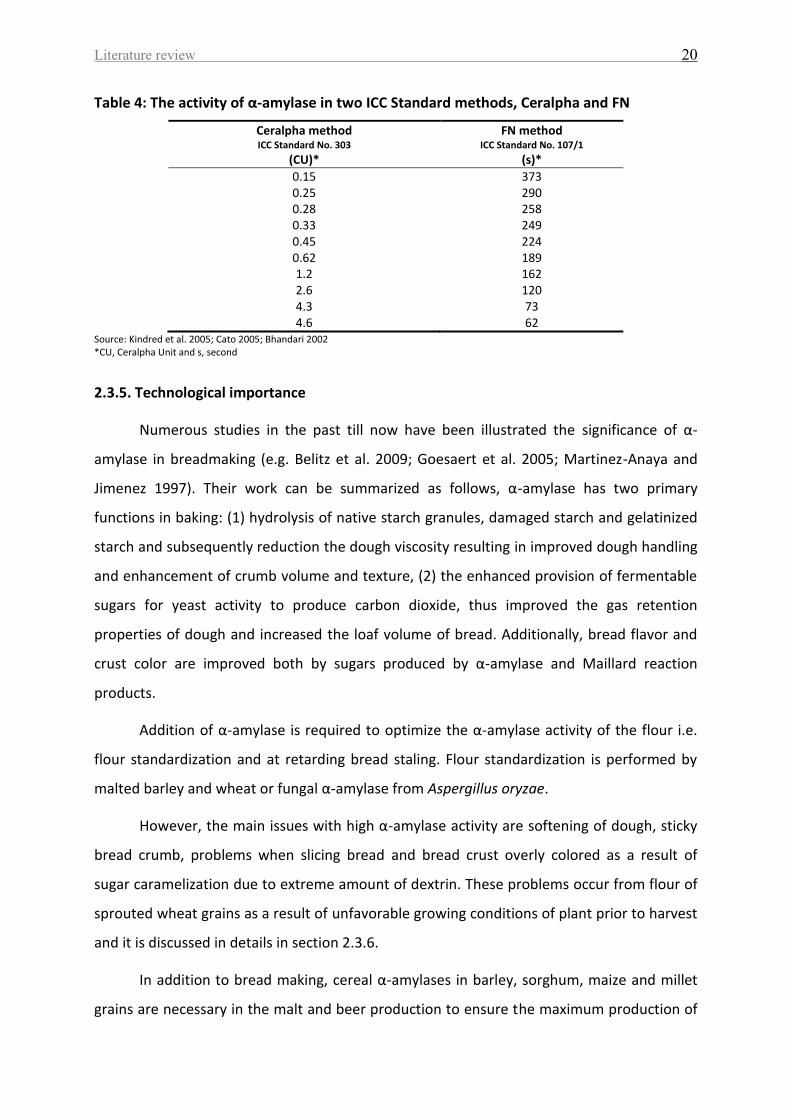
2.3.6. Pre-harvest sprouting
The pre-harvest sprouting phenomenon is defined as the sprouting occurs on the ripe
grains while still on the ear of the mother plant during wet harvest period due to the lack of
dormancy (see Figure 4) (Gao et al. 2013). It is also termed as “precocious germination”
(Bewley et al. 2013). Such phenomenon is a serious problem in cereal-growing regions,
where cool damp conditions prior to harvest are possible, because it reduces grain quality
due the presence of excessive α-amylase activity in sprout-damaged grains, and thus results
in unsatisfactory end-products and significant economic losses (De Laethauwer et al. 2013).
Figure 4: Pre-harvest sprouting in (a) maize and (b) wheat
Source: Bewley et al. 2013
Physiological mechanism of pre-harvest sprouting
Sprouting of cereal grains on the ear prior to and during harvest period can be divided
into a number of sequential physical and biochemical events. They are: imbibition of water,
enzyme activation, metabolism of storage materials and subsequent mobilization to the
growing embryonic axis, and finally rupture of the pericarp and testa tissues and the
emergence of the seedling (Bewley et al. 2013).
Literature review 22
Water uptake by grain via physical imbibition is an essential and initial step toward
germination. It is influenced by factors such as availability of water, temperature and
humidity. The water moves firstly to the vegetative parts of the ear, then to the grain surface
i.e. pericarp and testa and finally to the embryo and endosperm tissues (Bewley et al. 2013).
Therefore, the amount of wetting and water uptake by grains is affected by grain hardness,
thickness of testa and other layers, grain size and surface-to-volume as well as the
morphology of the ear such as the presence or absence of awns, husk structure, ear
waxiness and ear-nodding angle (Black et al. 2006). Typically, the water uptake by grain is
triphasic. In phase I “ imbibition”, the water absorption of the grain is rapid in the first three
hours due to extremely low water potential (-100 MPa) of the grain, which attributed to its
matric characteristics. The imbibed grain undergoes some metabolic events such as initiation
of respiration, mitochondrial and DNA repair, the initial synthesis of enzyme and proteins
due to transcription and translation of stored mRNA (Bewley et al. 2013). Phase II “plateau
phase”, this is the lag phase of water uptake and the grain has swollen to a maximum size.
During this phase, the major metabolic events occur such as the synthesis of new DNA and
mitochondria and synthesis protein and enzyme due to new mRNA (Black et al. 2006). The
mobilization of the stored reserves is taken place via several enzymes in order to provide
nutrients for seedling growth (Bewley et al. 2013). Finally, phase III “completion of the
germination” is characterized by further increase of water uptake and is concurrent with the
radical due to the cellular expansion and division (Bewley et al. 2013).
Economic losses of pre-harvest sprouting
Pre-harvest sprouting occurs in wet or humid weather during the harvest season of
cereals grains in many regions of the world, including northern and Western Europe, North
and South America, Australia, China, India and the southern parts of Africa. This
phenomenon leads in some years to large losses to the agricultural industry. The average
annual losses approach US $1 billion worldwide, mostly to wheat (Liu et al. 2013; Barnard
and Smith 2012; Black et al. 2006). The extent of the problem is illustrated by a few
examples in Table 5. Beside wheat grains, other cereal grains such as barley, rye, triticale and
maize are prone to pre-harvest sprouting (Black et al. 2006).
Many scientists (Schramm et al. 2013; Csiszar et al. 2010; Black et al. 2006) have paid
attention to the pre-harvest sprouting and its direct and indirect losses. The yield reduces
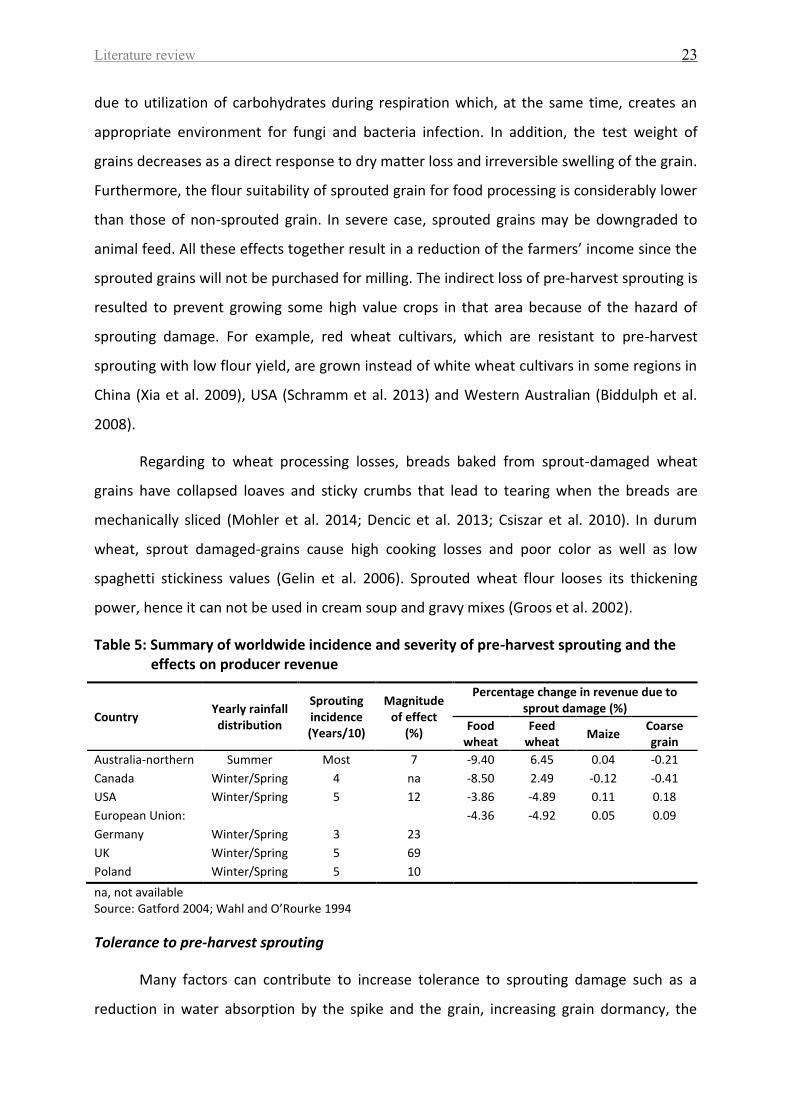
Literature review 23
due to utilization of carbohydrates during respiration which, at the same time, creates an
appropriate environment for fungi and bacteria infection. In addition, the test weight of
grains decreases as a direct response to dry matter loss and irreversible swelling of the grain.
Furthermore, the flour suitability of sprouted grain for food processing is considerably lower
than those of non-sprouted grain. In severe case, sprouted grains may be downgraded to
animal feed. All these effects together result in a reduction of the farmers’ income since the
sprouted grains will not be purchased for milling. The indirect loss of pre-harvest sprouting is
resulted to prevent growing some high value crops in that area because of the hazard of
sprouting damage. For example, red wheat cultivars, which are resistant to pre-harvest
sprouting with low flour yield, are grown instead of white wheat cultivars in some regions in
China (Xia et al. 2009), USA (Schramm et al. 2013) and Western Australian (Biddulph et al.
2008).
Regarding to wheat processing losses, breads baked from sprout-damaged wheat
grains have collapsed loaves and sticky crumbs that lead to tearing when the breads are
mechanically sliced (Mohler et al. 2014; Dencic et al. 2013; Csiszar et al. 2010). In durum
wheat, sprout damaged-grains cause high cooking losses and poor color as well as low
spaghetti stickiness values (Gelin et al. 2006). Sprouted wheat flour looses its thickening
power, hence it can not be used in cream soup and gravy mixes (Groos et al. 2002).
Table 5: Summary of worldwide incidence and severity of pre-harvest sprouting and the effects on producer revenue
Country Yearly rainfall distribution
Sprouting incidence (Years/10)
Magnitude of effect
(%)
Percentage change in revenue due to sprout damage (%)
Food wheat
Feed wheat
Maize Coarse grain
Australia-northern
Canada
USA
European Union:
Germany
UK
Poland
Summer
Winter/Spring
Winter/Spring
Winter/Spring
Winter/Spring
Winter/Spring
Most
4
5
3
5
5
7
na
12
23
69
10
-9.40
-8.50
-3.86
-4.36
6.45
2.49
-4.89
-4.92
0.04
-0.12
0.11
0.05
-0.21
-0.41
0.18
0.09
na, not available Source: Gatford 2004; Wahl and O’Rourke 1994
Tolerance to pre-harvest sprouting
Many factors can contribute to increase tolerance to sprouting damage such as a
reduction in water absorption by the spike and the grain, increasing grain dormancy, the
Literature review 24
presence of germination inhibitors, the alteration responses to phytohormones and the
reduction in the activity of grain α-amylase activity (Gao et al. 2013; De Laethauwer et al.
2013).
Previous studies have been indicated that the presence of awns in wheat or husks in
maize cob (Black et al. 2006), the strong glume tenacity (Liu et al. 2013) and high level of ear
waxiness (King and von Wettstein-Knowles 2000) have a positive effect on the tolerance to
pre-harvest sprouting by shedding water and decreasing grain imbibition.
Grain dormancy has been found as an important multigenic trait for effectively
reducing grain-sprouting damage (Gao et al. 2013). The stronger grain dormancy of cereal
cultivar has been, the more tolerant cultivar to pre-harvest sprouting is observed. Grain
dormancy is strongly influenced by environmental factors and determined by seed coat and
embryo factors (Schramm et al. 2013). Different dormant level could be determined by
germination test or germination resistance index (Biddulph et al. 2008).
It was found by Weidner et al. (1999 and 2002) that wheat, rye and triticale grains
with deep dormancy possessed a high concentration of phenolic compounds, particularly
phenolic acids in the form of their soluble esters such as caffeic, p-coumaric, ferulic and
sinapic acids. Theses phenolic compounds can act as germination inhibitors (Divashuk et al.
2012). Additionally, the pigmentation of testa has an influence on the tolerance to pre-
harvest sprouting, where colored grain more tolerant to pre-harvest sprouting than white
grain (Liu et al. 2013; Schramm et al. 2013).
Abscisic acid (ABA) and gibberellic acid (GA) signaling pathways and the tissue
responses to these phytohormones affect cereal cultivars tolerance to pre-harvest sprouting
through enhancing or delaying seed dormancy and germination (Kondhare et al. 2012;
Finkelstein et al. 2008).
The activity of α-amylase differs significantly between resistant and sensitive wheat
cultivars to pre-harvest sprouting (Gao et al. 2013). A number of factors, including genotypes
and environmental factors, are suggested to induce or modify the α-amylase activity and
synthesis (Dencic et al. 2013; Liatukas and Ruzgas 2009). Several studies have indicated that
different environmental variables can affect amylase activity, either individually or in
combination. They are high precipitation (Barnard and Smith 2009; Yanagisawa et al. 2005),
changes of temperature (Farrell and Kettlewell 2009; Biddulph et al. 2008 and 2005; Osanai
Literature review 25
et al. 2005) and the rate of grain desiccation (Kettlewell and Cashman 1997). It was also
found that the grain size and weight (Farrell and Kettlewell 2009) and the application of
fertilizers (Kindred et al. 2005) have been associated with differences in α-amylase activity.
The FN is the most widely used test to screen wheat for pre-harvest sprouting, the higher
the level of sprouting is detected, the lower of FN result will be (Barnard and Smith 2012;
Liatukas and Ruzgas 2009). The FN value below 200s indicates grain damage by sprouting
(Cato 2011). Therefore, the magnitude of effect of α-amylase has resulted in its being a focus
for detecting pre-harvest sprouting damaged grains (Simsek et al. 2014; Khakimzhanov et al.
2011). Recently, many scientists have paid attention to the application of molecular marker
technology and quantitative trait locus (QTL) analysis to achieve resistant cultivar breeding
(e.g. Mohler et al. 2014 and 2012; Gao et al. 2013). It was reported that the infection by
Fusarium spp. (Kreuzberger 2011; Wang et al. 2008) and orange wheat blossom midge
(Sitodiplosis mosellana) larvae (Singh et al. 2008; Kindred et al. 2005) increased the α-
amylase activity in grains. Therefore, both fungicide and insecticide treatments may have
potential benefits in reduction α-amylase activity.
There are some steps can be taken to reduce the incidence of pre-harvest sprouting.
Taking the weather conditions into account, sprouting susceptibility can somehow be
predicted. Cereal crop may harvest earlier than usual at moisture content higher than > 15
%, with respect to grain viability and development of the fungal growth (Black et al. 2006;
FAO 2002). Gains may be harvested, by reaping or swathing the grain and allowing it to dry
in windrows, sheaves, shocks or stacked (FAO 2002). Additionally, the storage of harvested
grain at low temperature ~ 10 - 13 °C (Black et al. 2006) until use is important to preserve
dormancy (Knox et al. 2012).
2.3.7. Enzyme kinetics
Enzyme as a catalyst has the ability to accelerate the rate of biochemical reactions
under normal cellular conditions. The overall reaction involving conversion of substrate (S)
to product (P) with formation of enzyme-substrate complex (ES) can be written as:
E + S → ES → E + P (1)
Enzyme kinetics refers to the quantitative analysis of all factors influence the rate of
enzyme catalyzed-reactions such as the concentration of enzyme and substrate, pH,
Literature review 26
temperature, ionic strength, irradiation, inhibitors, activators etc. According to equation 1,
the experimental determination of enzyme activity is based on the amount of product
formed or substrate consumed under known set of conditions. This study provides
information about the important aspects such as mechanism of enzyme action in the
metabolic regulation as well as the parameters which characterize the properties of enzyme.
The latter is important from a technological perspective, since it allows the utilization of
enzyme in several foods and industrial processing (Panesar et al. 2010; Rogers and Gibon
2009; Illanes 2008).
2.3.8. Biochemical and kinetic properties of enzyme
The substrate concentration
In the cell, enzyme is exposed to change in the concentration of S, so the dependence
of enzyme velocity on the concentration of S is the first line of metabolic regulation. The
Michaelis-Menten equation is algebraic expression of enzyme kinetics, in which the velocity
of enzyme reaction depends on the substrate concentration in the presence of constant
enzyme concentration according to the following equation:
𝑉0 =𝑉𝑚𝑎𝑥[𝑆]
𝐾𝑚+[𝑆] (2)
V0 denotes the initial velocity, [S] denotes the concentration of substrate, Vmax is the
maximum velocity approached at substrate saturation of enzyme under a given set of
conditions and Km, Michaelis-Menten constant, is numerically equal to the concentration of
specific substrate required to produce a velocity that one-half of Vmax. The Km parameter
provides an indication of the binding strength of that enzyme to its substrate. A high Km
indicates a lower affinity for substrate and vice versa. The equation corresponds to a
rectangular hyperbola. There are a number of graphical linearization methods to obtain Vmax
and Km to avoid evaluating enzyme kinetics using a nonlinear plot, while today there are
nonlinear curve-fitting programs which are preferred tools of determining the values of
kinetic parameters (Panesar et al. 2010; Rogers and Gibon 2009; Illanes 2008; Copeland
2004; Ranaldi et al.1999).
Literature review 27
The temperature effect
Temperature is the most relevant variable in any biological process. As the
temperature is increased, the rate of reaction increases as well, but at the same time there is
inactivation and/or denaturation of enzyme protein. Therefore, it has remarkable effect on
enzyme reaction. Each enzyme shows so-called temperature optimum, which is maximum
enzyme activity (Belitz et al. 2009; Daniel et al. 2008; Copeland 2004).
The pH effect
Because enzyme is polyionic polymer, the pH of the reaction medium affects enzyme
activity. Each enzyme has a characteristic pH at which its activity is a maximum, named pH
optimum of enzyme, while denaturation of enzyme may occurs at extremely low and high
pH (Belitz et al. 2009; Copeland 2004).
Enzyme stability
Enzyme stability is not related to activity. It is regarded as the capacity of enzyme to
retain its activity through the time. It is dependent on enzyme three-dimensional structure.
Like all proteins, enzyme in its native structure is optimally stabilized by specific surrounding
conditions of pH, temperature, ionic strength and so on. The alteration in the environment
surrounding enzyme in which its native conformation is changed causes protein
denaturation. This term denotes an event or a sequence of events leading to structural
changes with subsequent aggregation or improper folding or even unfolding to the extent of
altering the catalytic capacity of enzyme and loss its activity. This phenomenon may be
reversible if the denaturing influence is removed, or be irreversible. It is worthwhile to
mention that the solution conditions that are optimal for enzyme’s protein stability may not
necessarily the same as those for optimal enzymatic activity (Prakash and Jaiswal 2010;
Belitz et al. 2009; Illanes 2008; Copeland 2004).
A summary of α-amylase characteristics from different sources is given in Table 6.
Although broadly similar properties of cereal α-amylases are present, there are differences
in the properties of α-amylases from different cereals grains and even individual isoenzymes
of a particular cereal (Muralikrishna and Nirmala 2005). It has been concluded in earlier
reports (Kruger 1989; Kruger and Lineback 1987) as well as recent reports (El Nour et al.

Literature review 28
2013; Usha et al. 2011) that cereal α-amylases share common properties which distinguish
them from other cereal enzymes. They are: (1) relative thermal stability and (2) acid lability.
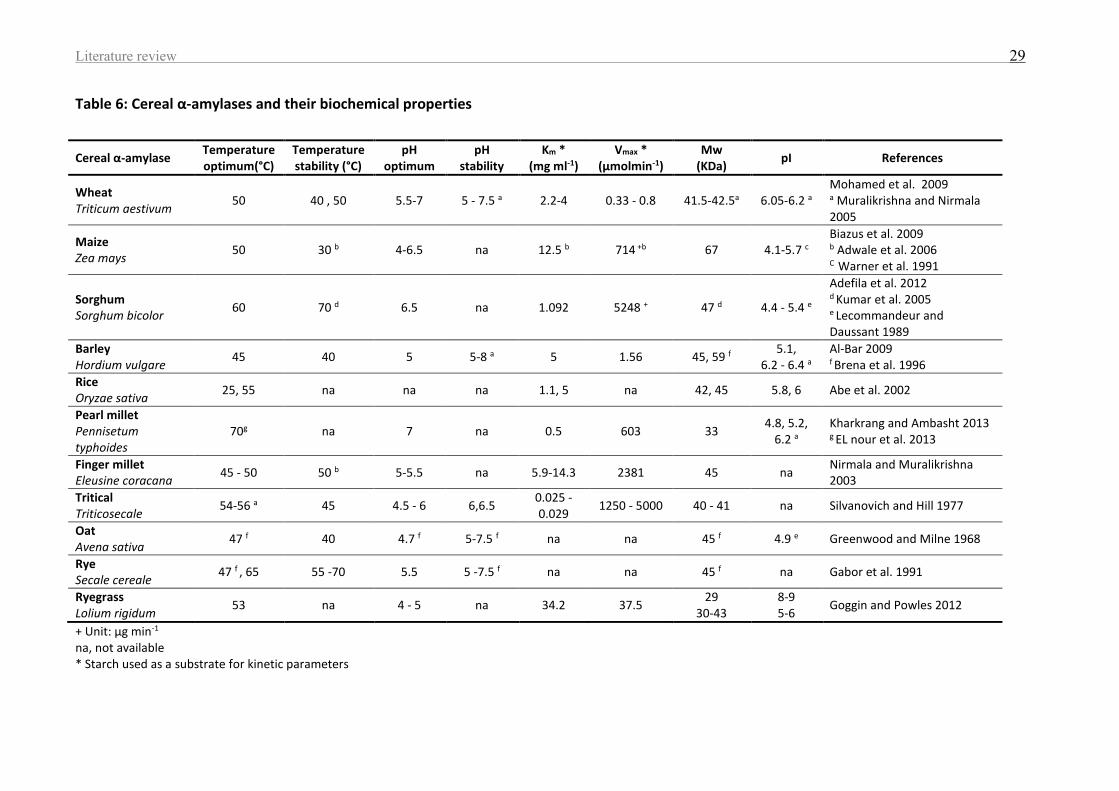
Literature review 29
Table 6: Cereal α-amylases and their biochemical properties
Cereal α-amylase Temperature optimum(°C)
Temperature stability (°C)
pH optimum
pH stability
Km * (mg ml-1)
Vmax * (μmolmin-1)
Mw (KDa)
pI References
Wheat Triticum aestivum
50 40 , 50 5.5-7 5 - 7.5 a 2.2-4 0.33 - 0.8 41.5-42.5a 6.05-6.2 a Mohamed et al. 2009 a Muralikrishna and Nirmala 2005
Maize Zea mays
50 30 b 4-6.5 na 12.5 b
714 +b
67 4.1-5.7 c
Biazus et al. 2009 b Adwale et al. 2006 C Warner et al. 1991
Sorghum Sorghum bicolor
60 70 d 6.5 na 1.092 5248 + 47 d 4.4 - 5.4 e
Adefila et al. 2012 d Kumar et al. 2005 e Lecommandeur and Daussant 1989
Barley Hordium vulgare
45 40 5 5-8 a 5 1.56 45, 59 f 5.1,
6.2 - 6.4 a Al-Bar 2009 f Brena et al. 1996
Rice Oryzae sativa
25, 55 na na na 1.1, 5 na 42, 45 5.8, 6 Abe et al. 2002
Pearl millet Pennisetum typhoides
70g na 7 na 0.5 603 33 4.8, 5.2,
6.2 a Kharkrang and Ambasht 2013 g EL nour et al. 2013
Finger millet Eleusine coracana
45 - 50 50 b 5-5.5 na 5.9-14.3 2381 45 na Nirmala and Muralikrishna 2003
Tritical Triticosecale
54-56 a 45 4.5 - 6 6,6.5 0.025 -0.029
1250 - 5000 40 - 41 na Silvanovich and Hill 1977
Oat Avena sativa
47 f 40 4.7 f 5-7.5 f na na 45 f 4.9 e Greenwood and Milne 1968
Rye Secale cereale
47 f , 65 55 -70 5.5 5 -7.5 f na na 45 f na Gabor et al. 1991
Ryegrass Lolium rigidum
53 na 4 - 5 na 34.2 37.5 29
30-43 8-9 5-6
Goggin and Powles 2012
+ Unit: μg min-1 na, not available * Starch used as a substrate for kinetic parameters
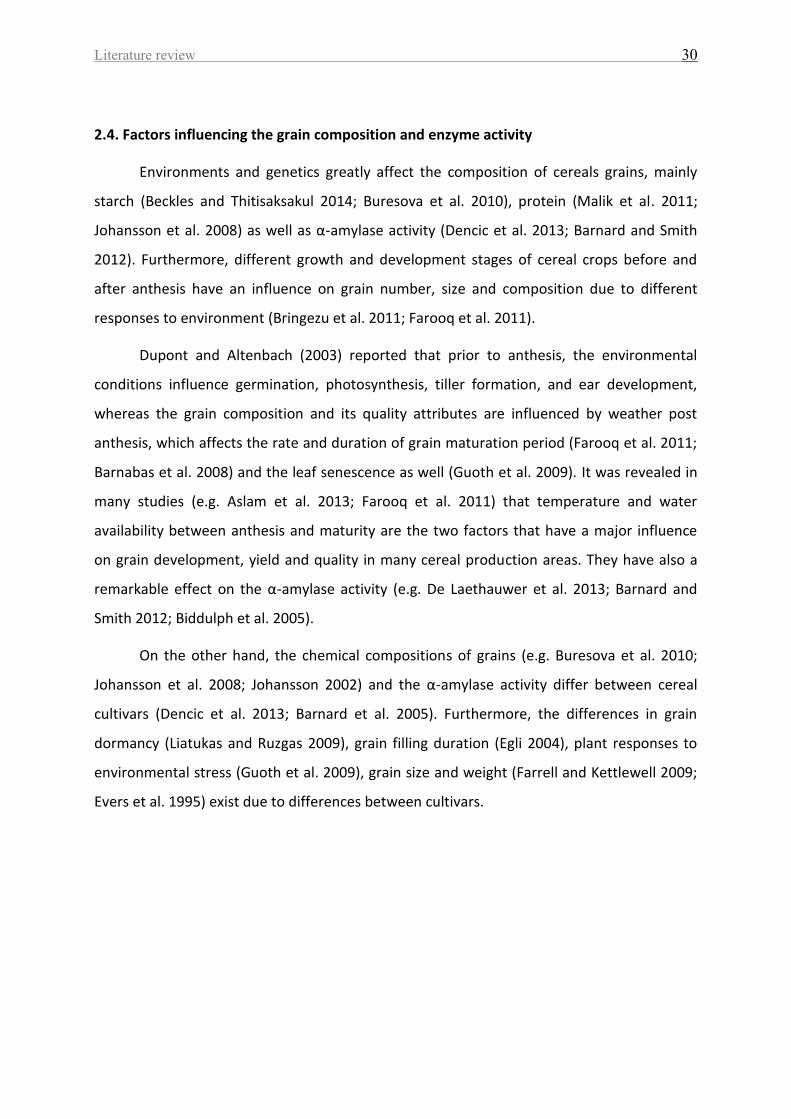
Literature review 30
2.4. Factors influencing the grain composition and enzyme activity
Environments and genetics greatly affect the composition of cereals grains, mainly
starch (Beckles and Thitisaksakul 2014; Buresova et al. 2010), protein (Malik et al. 2011;
Johansson et al. 2008) as well as α-amylase activity (Dencic et al. 2013; Barnard and Smith
2012). Furthermore, different growth and development stages of cereal crops before and
after anthesis have an influence on grain number, size and composition due to different
responses to environment (Bringezu et al. 2011; Farooq et al. 2011).
Dupont and Altenbach (2003) reported that prior to anthesis, the environmental
conditions influence germination, photosynthesis, tiller formation, and ear development,
whereas the grain composition and its quality attributes are influenced by weather post
anthesis, which affects the rate and duration of grain maturation period (Farooq et al. 2011;
Barnabas et al. 2008) and the leaf senescence as well (Guoth et al. 2009). It was revealed in
many studies (e.g. Aslam et al. 2013; Farooq et al. 2011) that temperature and water
availability between anthesis and maturity are the two factors that have a major influence
on grain development, yield and quality in many cereal production areas. They have also a
remarkable effect on the α-amylase activity (e.g. De Laethauwer et al. 2013; Barnard and
Smith 2012; Biddulph et al. 2005).
On the other hand, the chemical compositions of grains (e.g. Buresova et al. 2010;
Johansson et al. 2008; Johansson 2002) and the α-amylase activity differ between cereal
cultivars (Dencic et al. 2013; Barnard et al. 2005). Furthermore, the differences in grain
dormancy (Liatukas and Ruzgas 2009), grain filling duration (Egli 2004), plant responses to
environmental stress (Guoth et al. 2009), grain size and weight (Farrell and Kettlewell 2009;
Evers et al. 1995) exist due to differences between cultivars.
Materials and methods 31
3. MATERIALS AND METHODS
3.1. Plant materials
Two field experiments were carried out with different cereal crops. The post-harvest
treatments as well as the determination methods for different parameters and enzyme
properties were the same in both experiments.
3.1.1. First experiment
Two bread wheat cultivars, winter wheat of cv. Cubus and summer wheat of cv.
Amaretto, were provided from two separate trail locations belongs to project
Forschungsverbund Agrar- und Ernährungswissenschaften Niedersachsen (FAEN) in the
north of Göttingen, Germany. These locations termed as Gladebeck and Torland in the
subsequent text. The grains collected ony from 2010, while in 2011 the crops were exposed
to forest damage. Weather conditions during development period as well as geographical
and cultivation information are shown in appendix Figure 18 and Table 16. Characteristic
attributes of two cultivars are presented in appendix Table 18. The development stages of
the cereals were identified using the extended BBCH-scale. The BBCH-scale defines the
phenological growth stages with a standardized decimal code. The abbreviation BBCH
derives from Bundesanstalt Bundessortenamt und CHemische industrie (Meier, 2001).
Wheat grains were collected as milk (BBCH 75 - 77), dough (BBCH 87) and mature stage
(BBCH 97) only from 2010, since in 2011 the plants were damaged by frost and now yield
was obtained.
3.1.2. Second experiment
Seven cultivars of forage maize (Benicia, EsBombastic, Franki, Justina, Lukas LG 3226,
Saludo, and PR39F58) were provided from one trail location belongs to Institut für
Pflanzenbau und Bodenkunde, JKI, Braunschweig, Germany in 2010 and 2011. Further
information about the weather data during development period and features of selected
cultivars is shown in appendix Figure 19 and Table 18. Maize grains were harvested at corn
mature stage (BBCH 97) in 2010, whereas in 2011 the samples were collected at three
Materials and methods 32
development stages based on BBCH-scale as milk (BBCH 75 - 77), dough (BBCH 87) and corn
mature stage (BBCH 97).
3.2. Post-harvest treatment
The grains were cleaned with an automatic cleaning apparatus (SLN model, Rationel
Kornesrvice, Esbjerg, Denmark). Then the grains were immediately frozen at -20°C before
freeze dried (CHRIST Epsilon 2-40, Osterode, Germany) to avoid decay of enzyme activities.
The freeze dried grain were ground into whole grain flours by an automatic mill (Retsch
Rotormill ZM 100, GmbH, Haan, Germany) with a sieve of 0.5 mm and stored in air-tight
bottle at -20 °C until testing.
3.3. Determination of the chemical composition of grains
Freeze-dried whole flour was used to determine the chemical composition.
Determination was repeated triplicate as technical measurements except protein content in
duplicate. All values were based on dry matter of freeze dried samples.
3.3.1. Starch content
Starch was determined by the ICC Standard No. 123/1 (ICC Standard booklet 1999)
using polarimeter type (V DrNa, Zeiss AG, Jena, Germany). Starch content was calculated
using the following formula:
Starch content(% DM) =C×V
W× 100:
DM
100 (3)
C =α
L×D (4)
C = concentration of starch (g l-1) V = extraction volume (ml) W = weigh of sample (g) DM = dry matter α = measured optical rotation L = length of polarimeter tube (1.901 dm) D = specific rotation angle for wheat starch (182.7 °) and maize starch (184.6 °)
Materials and methods 33
3.3.2. Protein content
Protein was determined by by a combustion method (ICC Standard No. 105/2) (ICC
Standard booklet 1999) using elemental analyzer (Elementar Vario EL, Elementar
Analysensysteme GmbH, Hanau, Germany). Protein content was calculated using the
following formula:
Protein content (% DM) = N × F:DM
100 (5)
N = measured nitrogen content (%) F = protein conversion factor for wheat (5.7) and for maize (6.25)
3.3.3. Sugar content
Whole grain flour (1 g) was dissolved with distilled water (6.5, 2.5 ml for wheat and
maize, respectively) and vortexed for 2 min to homogenize the solution. The extraction
procedure was performed for 20 min at room temperature with magnetic stirring (Variomag
Multipoint 15, H+P Labortechnik AG, Oberschleissheim, Germany). The sample was
centrifuged at 20 °C for 20 min at 10 000 rpm (Du Pont Instrument, Sorvall, RC-5B,
Germany).The extraction was repeated twice, then the supernatants were combined and
filled up to 13 ml. Carrez solution No.1 (1 ml) and Carrez solution No.2 (1 ml) were added to
the solution and shaken vigorously .The sample was subsequently centrifuged at 4 °C for 20
min at 11 000 rpm. The supernatant was applied to rotational vacuum concentrator (CHRIST,
RVC 2-25 CD plus, Osterode am Harz, Germany) at 30 °C, vacuum 4.1mbar and vapour-
pressure 15 mbar until reached 1 ml residue. The concentrated solution was washed twice
with 0.5 ml distilled water and then centrifuged at 20 °C for 20 min at 14 000 rpm
(Centrifuge 5804R, Eppendorf, Hamburg, Germany).
The HPLC system (Jasco LC-2000 Plus, Germany) was used to quantify fructose,
glucose, sucrose and maltose concentrations in samples (modified Zörb et al. 2012). The
column is LiChrospher, NH2, 5 µm, 250 - 4. The detector was RI 2301. The eluent is ratio
acetonitrile: water as 80 : 20. Twenty µl was used as injection volume, and the flow was 1 ml
min-1.
Different sugars concentrations were measured by comparing the peak of the
samples to that of the standard. The following formula was used in calculation:
Materials and methods 34
Sugar content (% DM) =C×V
W×10:
DM
100 (6)
C = measured concentration of sugar (g l-1) V = extraction volume (l) W = weigh of sample (g)
DM = dry matter
Total reducing sugars expressed as sum of fructose, glucose and maltose content in
each sample. The total sugars were the sum of fructose, glucose, maltose and sucrose in
each sample.
3.4. Ceralpha method
The α-amylase activity was assayed spectrophotometrically by using non-reducing-
end blocked ρ-nitrophenyl maltoheptaoside (BPNPG7) as a substrate following Ceralpha
method (ICC Standard No. 303) in Megazyme booklet (2012).
3.4.1. Enzyme extraction
Three gram of whole grain flour was extracted with 20 ml of buffer extraction
[sodium malate (1 M) +sodium chloride (1 M) + calcium chloride (40 mM) + sodium azide
(0.1 %), pH 5.4]. The mixture was incubated for 20 min at 40 °C, with occasional mixing
(Thermomixer comfort, Eppendorf AG, Hamburg, Germany). At the end of 20 min, the
mixture was centrifuged at 10000 rpm for 10 min at 20 °C (Centrifuge 5804R, Eppendorf,
Hamburg, Germany). The modification in extraction and assay was done in grains of wheat
because of excessive enzyme activity that its absorbance exceeded the range of spectrum of
photometer. For enzyme extraction, 0.5 g of whole grain flour was mixed with 100 ml of
buffer extraction for 15 min at room temperature, with occasional mixing and then
centrifuged ( 10 000 rpm, 10 min at 20 °C ). An aliquot of the supernatant was diluted 1: 100
and analyzed.
3.4.2. Enzyme assay
Enzyme solution and BPNPG7 were pre-incubated at 40 °C for 5 min before used. To
0.1 ml BPNPG7 solution, 0.1 ml of enzyme extraction was added and incubated at 40 °C for
20 min while the incubation time for enzyme extracted from wheat grains was 10 min. At the
end of incubation, the reaction was stopped by adding 1.5 ml tris-sodium phosphate solution
Materials and methods 35
(20 % (w/v), pH 11) and stirred vigorously. Subsequently the absorbance of mixture was
measured by spectrophotometer (Hewlett Packard 8453, Palo Alto, USA). The blank was
obtained by mixing 0.1 of BPNPG7 solution and 1.5 ml of the stopping solution. At the end of
incubation, 0.1 ml of enzyme was added. One Ceralpha Unit (CU) of α-amylase was defined
as the amount of enzyme producing one μmole ρ-nitrophenyl from BPNPG7 per one min at
40 °C and pH 5.4. The formula was used in calculation as following:
Enzyme activity (CU g−1 DM) =∆E400
10×
V1
V2×
1
EmM×
V3
W× Dilution ∶
DM
100 (7)
∆E400 = absorbance of reaction – absorbance of blank V1, V2, V3 = total volume, extraction volume and enzyme assay volume (ml), respectively EmM = absorbance of ρ-nitrophenyl in 1 % tris-sodium phosphate at 400 nm = 18.1
3.5. Properties of α-amylase
Enzyme properties were performed on whole grain flour from harvest-mature stage
in wheat and maize samples. Each measurement was repeated triplicate as technical
measurements.
3.5.1. Enzyme extraction and assay
The α-amylase activity was assayed by 3,5-dinitrosalicylic acid (DNS) procedure
(Bernfeld 1955; Sigma-Aldrich protocol 2010) using 1 % soluble starch as substrate.
Enzyme extraction
Whole grain flour (0.5 g) was extracted with 10 ml of buffer solution [sodium acetate
(0.1 M) + calcium chloride (10 mM), pH 6] for 30 min at 40 °C with gentle shaking using
thermomixer. After centrifugation (10 000 rpm, 10 min, 20 °C), enzyme extract was used
directly for further analyses.
DNS method
One ml of enzyme extract was incubated for 5 min at 40 °C with 1 ml of soluble starch
as a substrate. The reaction was stopped by addition of 2 ml DNS .Reaction tube was placed
in boiling water bath for 5 min and then cooled in an ice bath for 5 min. After the addition of
10 ml of distilled water, the absorbance of sample was read at 540 nm by
spectrophotometer. A blank containing only a buffer extraction was run simultaneously with
Materials and methods 36
the reaction mixture. Calibration curve was prepared from maltose and processed in the
same way as the samples.
One unit of α-amylase activity was defined as the amount of enzyme required to
produce reducing sugar equivalent to 1 μmol of maltose per min from soluble starch at 40 °C
and pH 6 in 1 ml of enzyme. Enzyme activity was calculated as the following (Yaldagard et al.
2008):
Enzyme activity (μmol min−1ml−1) =A×1000×Dilution
M×T×VE (8)
A = amount of maltose released (mg) M = molecular weight of maltose (360.32 g mol-1) T = incubation time (min) VE = volume of enzyme used (ml)
3.5.2. Effect of temperature on enzyme activity and stability
The effect of temperature on α-amylase activity was determined by assaying enzyme
extract at temperature from 30 to 90 °C. The relative activity at different temperatures was
calculated, taking the maximum activity as 100 %. To determine temperature stability,
enzyme extract was pre-incubated at various temperatures (30 - 90 °C) for 30 min prior to
substrate addition. Then enzyme extract was cooled and the residual activity was assayed
under the standard assay conditions, taking the maximum residual activity as 100 %.
3.5.3. Effect of pH on enzyme activity and stability
To determine the optimum pH of α-amylase activity, enzyme preparation and assay
were done at different pH values (3 - 9) in the following buffers: 100 mM of sodium acetate
buffer (3 - 6) and 100 mM Tris-HCl buffer (7 - 9). All buffers contained 10 mM calcium
chloride. The relative activity at different pH values was calculated, taking the maximum
activity as 100 %.
To estimate pH stability, enzyme extract was pre-incubated at various pH values (3 -
9) for 30 min. Then enzyme extract was adjusted to pH 6 by adding suitable amounts of HCl
or NaOH. The assay was carried out in the same manner as described under enzyme assay
and the residual activity was calculated, taking the maximum residual activity as 100 %.
Materials and methods 37
3.5.4. Kinetic parameters
Kinetic parameters of α-amylase were obtained by using various soluble starch
concentrations as substrate (S) of 0.005, 0.01, 0.015, 0.02 and 0.025 g ml-1 of reaction
mixture under standard assay conditions. The estimation for Michaelis-Menten constant (Km)
and the maximum velocity (Vmax) for enzyme were performed by computer-program
software SigmaPlot 10 as well as plotted Michaelis-Menten curve.
3.5.5. Electrophoretic properties of enzyme
Preliminary test for isoenzymes detection was applied in mature-harvest stage of
grains using partial purified α-amylase. The test failed to show any bands on gel. Then gel
electrophoresis techniques were applied in milk-ripe stage of both wheat and maize because
of the highest activity of α-amylase appeared in immature grains, therefore the bands on
gels of target proteins can be obviously shown with partly enzyme purification applied. The
samples were wheat collected only from Torland, while just two maize cultivars, Franki and
Saludo, harvested in 2011 were used.
Extraction and purification of enzyme
Whole grain flour (0.5 g) was extracted with 5 ml of buffer solution [sodium acetate
(0.1 M) + calcium chloride (10 mM), pH 6] for 2 hrs using magnetic stirring. After
centrifugation (10 000 rpm , 10 min), the supernatant was heated at 70 °C for 15 min using
thermomixer and rapidly cooled on ice bath in order to inactivate β-amylase. Enzyme was re-
centrifuged to remove the pellet and the supernatant thus was treated as crude enzyme and
was used for ammonium sulphate precipitation. The purification procedure was carried out
stepwise at 4 °C. In the first step, the solid ammonium sulphate was added slowly to the
crude enzyme extract to achieve 0 - 20 % saturation with gentle stirring for 3 hrs. The pellet
was collected by centrifugation (10 000 rpm, 10 min) and re-solubilized in buffer extraction
to use it in the second step. The percentage saturation of ammonium sulphate was brought
to 20 - 60 %. Protein pellet then was re-collected by centrifugation and dissolved in
appropriate sample buffer depends on further analyses eitherisoelectric focusing (IEF) or
polyacrylamide gel electrophoresis(PAGE). The aliquot was dialysed for 10 hrs in a cellulose-
membrane tubing (D977, Sigma, Germany) and then applied to rotational vacuum
concentrator (30 °C, 4.1 mbar, and 10 hrs) in order to concentrate the solution. The purified
Materials and methods 38
enzyme extract before applied to gels was monitored for enzyme activity by DNS method as
well as for protein content by Bradford procedure using bovine serum albumin in calibration
curve (Bio-Rad protein assay protocol). The purified enzyme extract kept at -80 °C until
analyzed.
Isoelectric focusing (IEF)
Sample was run on IEF gels in duplicate, one to be stained for protein detection and
the other to be used for enzyme detection, also named zymogram. Stained proteins on gel
and zymogram were compared to determine the isoelectric point (pI) of target proteins of α-
amylase.
IEF was carried out in a Multiphor ІІ apparatus (GE Healthcare, Munich, Germany).
Commercially purchased FocusGel (pH 3 - 7, size 250 x 115 x 0.65 mm, No. 43328 Serva
Electrophoresis, Germany), IEF sample buffer (No. 42357 Serva Electrophoresis, Germany)
and IEF standards (pH 3-10, No.39212 Serva Electrophoresis, Germany) were used. The
loading sample was 20 μl. The setting conditions were according to manufacturer’s
instructions: 30 min 500 v, 1 hr and 30 min 850 v and 30 min 1000 v. The current was 20 mA
and the run was performed in a cold room at 4 °C. For protein detection, the gel was fixed
and stained in room temperature with Coomassie G-250 as instruction manual for FocusGels
(Serva Electrophoresis, Germany).
A calibration curve of pI was made by plotting the migration distances from cathode
of proteins in a set of standards versus their known pI. Then the pI of particular proteins
bands were estimated based upon their positions relative to those of IEF standards.
For enzyme activity staining, the gel was immersed in soluble starch solution (1 %) for
30 min with gentle shaking. After that, the Lugol's solution was added. The zones of α-
amylase activity appeared as clear bands against dark background.
Polyacrylamide gel electrophoresis (PAGE)
Two sets of experiments were performed in each sample: 1. sodium dodecyl
sulphate-polyacrylamide gel electrophoresis (SDS-PAGE) to be stained for protein detection.
2. native-PAGE (nondenaturing) to be used for zymograms. Stained proteins and zymogram
were compared to determine the molecular weight ofenzyme’s protein.
Materials and methods 39
SDS-PAGE was carried out using mini Protean II Cell (Bio-Rad Laboratories GmbH,
Munich, Germany). The total monomer concentrations of polyacrylamide gel were 12.5 and
5 % for resolving gel and the stacking gel, respectively. The sample buffer (pH 6.8) had the
following composition: 4 % SDS, 12 % glycerol, 0.61 % Tris-HCl, 5 % mercaptoethanol and
0.004 % bromophenol blue. The loading sample was 20 μl. The setting conditions were: 5
min 100 v and 40 min 200 v. The current was 10 mA and the run was performed at room
temperature. The molecular weight standards from 10 to 250 kDa were used (Precision Plus
Protein Stanadrds No. 161-0373, Bio-Rad, Germany). After the time was elapsed, the gel was
fixed and stained with Coomassie brilliant blue R-250. The molecular weight of proteins
bands were estimated based upon their positions relative to those of the molecular weight
standards following the Bio-Rad protocol.
To visualize the activity of α-amylase, native PAGE was applied in the same manner of
SDS-PAGE run but without using SDS and mercaptoethanol in the buffer sample (Walker
2002). The gel then was immersed in lugol's solution and soluble starch as substrate. The
zones of α-amylase activity appeared as clear bands against dark background.
3.6. Statistics
The calculation of means, standard deviation, maximum and minimum values was
performed with Microsoft Excel 2003 (Microsoft, USA). The data were analysed with
SigmaStat (statistical software version 2.0, SPSS Inc., USA). The Kolmogorov-Smirnov’s test
was used to check the normal distribution of all data except protein data in which Shapiro-
Wilk test was used. The means separation was performed using Student t-test in wheat data
and one way analysis of variance (ANOVA) in maize data. Significant differences (p ≤ 0.05)
were represented by different letters. Correlation procedures between normally distributed
parameters under our study were performed using Person correlation coefficients. The
measure of significances were indicated with ***, ** and * which means p ≤ 0.001, 0.01 and
0.05, respectively, whereas ns showed no significant relationships. Kinetic parameters were
calculated by SigmaPlot 10.0 (Systat software GmbH, Erkrath, Germany). The Michaelis-
Menten curve and graphics were prepared by Sigmaplot 10.0 as well.
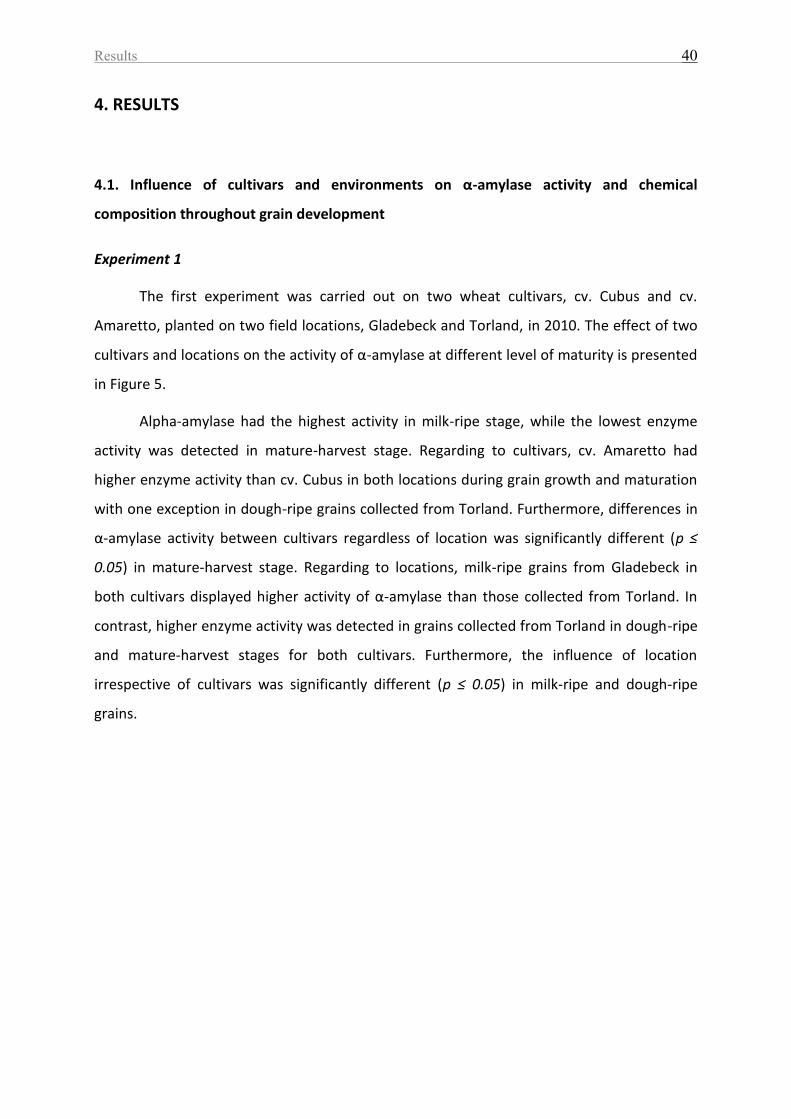
Results 40
4. RESULTS
4.1. Influence of cultivars and environments on α-amylase activity and chemical
composition throughout grain development
Experiment 1
The first experiment was carried out on two wheat cultivars, cv. Cubus and cv.
Amaretto, planted on two field locations, Gladebeck and Torland, in 2010. The effect of two
cultivars and locations on the activity of α-amylase at different level of maturity is presented
in Figure 5.
Alpha-amylase had the highest activity in milk-ripe stage, while the lowest enzyme
activity was detected in mature-harvest stage. Regarding to cultivars, cv. Amaretto had
higher enzyme activity than cv. Cubus in both locations during grain growth and maturation
with one exception in dough-ripe grains collected from Torland. Furthermore, differences in
α-amylase activity between cultivars regardless of location was significantly different (p ≤
0.05) in mature-harvest stage. Regarding to locations, milk-ripe grains from Gladebeck in
both cultivars displayed higher activity of α-amylase than those collected from Torland. In
contrast, higher enzyme activity was detected in grains collected from Torland in dough-ripe
and mature-harvest stages for both cultivars. Furthermore, the influence of location
irrespective of cultivars was significantly different (p ≤ 0.05) in milk-ripe and dough-ripe
grains.
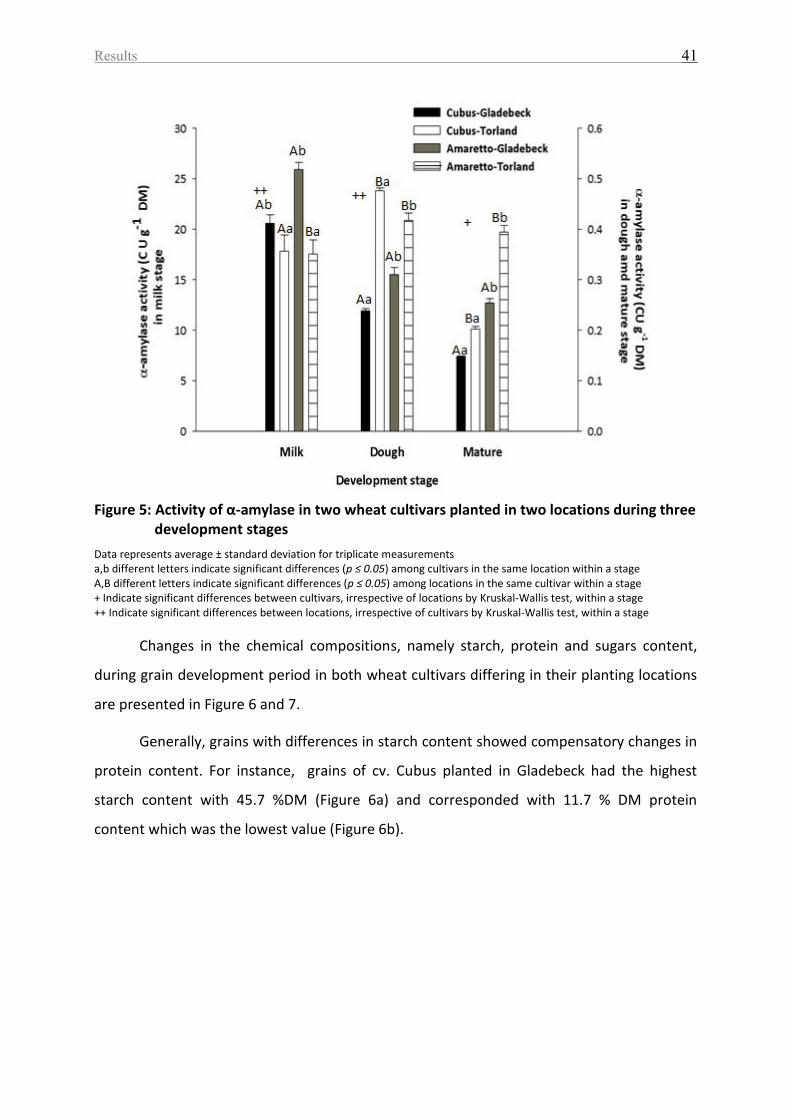
Results 41
Figure 5: Activity of α-amylase in two wheat cultivars planted in two locations during three
development stages
Data represents average ± standard deviation for triplicate measurements a,b different letters indicate significant differences (p ≤ 0.05) among cultivars in the same location within a stage A,B different letters indicate significant differences (p ≤ 0.05) among locations in the same cultivar within a stage + Indicate significant differences between cultivars, irrespective of locations by Kruskal-Wallis test, within a stage ++ Indicate significant differences between locations, irrespective of cultivars by Kruskal-Wallis test, within a stage
Changes in the chemical compositions, namely starch, protein and sugars content,
during grain development period in both wheat cultivars differing in their planting locations
are presented in Figure 6 and 7.
Generally, grains with differences in starch content showed compensatory changes in
protein content. For instance, grains of cv. Cubus planted in Gladebeck had the highest
starch content with 45.7 %DM (Figure 6a) and corresponded with 11.7 % DM protein
content which was the lowest value (Figure 6b).
Results 42
Figure 6: Starch (a) and protein (b) content in two wheat cultivars planted in two locations among three development stages
Data represents average ± standard deviation for triplicate measurements except protein with duplicate a, b different letters indicate significant differences among cultivars (p ≤ 0.05) in the same location within a stage A, B different letters indicate significant differences among locations (p ≤ 0.05) in the same cultivar within a stage *indicates significant differences between cultivars (p ≤ 0.05) within single parameters within a stage, irrespective of loactions + indicates significant differences between locations (p ≤ 0.05) within single parameters within a stage, irrespective of cultivars
The accumulation of starch increased towards maturity. Milk-ripe wheat grains
contained 40 %DM starch on average, while mature-harvest grains had 65.14 %DM starch
(Figure 6a). Regarding to cultivars, starch content of grains in cv. Cubus was significantly
higher than those in cv. Amaretto either in both locations or irrespective of locations.
However, the influence of location on starch content was obvious in mature-harvest stage.
Cv. Cubus harvested in Gladebeck contained more starch (67.39 %DM) than those in Torland
(61.84 %DM). Similarly, cv. Amaretto had higher starch content in grains harvested in
Results 43
Gladebeck (67.39 %DM) than those in Torland (63.95 %DM). Furthermore, mature grains
harvested from Gladebeck contained significantly more starch compared with those
harvested in Torland regardless of cultivars (Figure 6a).
Protein content was significantly influenced by the locations and cultivars in milk-ripe
and dough-ripe stages (Figure 6b). For instance, milk-ripe grains of cv. Amaretto planted in
Gladebeck accumulated more protein (13.9 %DM) compared to either the same cultivar
planted in Torland (11.9 %DM) or cv. Cubus planted in the same location (11.7 %DM). On the
other hand, grains from cv. Cubus-Torland in milk-ripe stage contained more protein (13.4
%DM) compared to those planted in Gladebeck (11.7 %DM) or cv. Amaretto-Torland (11.9
%DM). The similar interaction pattern between two locations and cultivars was also
observed in protein content of dough-ripe grains.
The results of individual sugar monosaccharides, fructose and glucose, or
disaccharides, sucrose and maltose, as well as the reducing sugars and total sugars are
presented in Figure 7 and Table 7. The individual reducing sugar and its total sum values
showed the maximum concentration at milk-ripe stage and then declined continuously
towards maturity.
In order to follow the change in content of each of the four sugars, a collective data
was obtained from particular stacked bars and a row for each sugar in Figure 7 and Table 7,
respectively across cultivars and locations at different stages of maturity. Fructose declined
sharply from a range within 12.2 - 34.3 %DM in milk-ripe grains of different cultivars to 0.4 -
0.91 %DM as wheat matured. Glucose followed a pattern similar to that fructose. Maltose
concentration of grains decreased from a range within 8.4-21.6 %DM in milk-ripe stage to
5.1-7.5 %DM at dough-ripe stage, followed with an increase until the harvest time. On the
other hand, the lowest concentration of the sucrose content was at milk-ripe stage with a
range 0.74 - 1.3 %DM. Thereafter, sucrose content increased remarkably in dough-ripe
grains with a range 2.6 - 4.6 %DM, followed with a slight increase in mature-harvest grains
,on a range 3.9 - 4.7 %DM. Fructose was predominant sugar in milk-ripe grains, whereas
maltose was predominant in the dough-ripe and mature-harvest stages.
Regarding to cultivars, both cultivars did considerably differ in all sugars under
investigation in the most development stages across both locations. Grains of cv. Amaretto
in Torland accumulated more monosaccharides and less disaccharides compared with cv.

Results 44
Cubus in the same location during grain development and maturation. Additionally, cv.
Amaretto in Gladebeck accumulated more sugars i.e. mono-and di-saccharides compared to
those of cv. Cubus in the same location at the most stages of ripening. However, the
influence of cultivars irrespective of locations was statically detected at p ≤ 0.05 in reducing
sugars and total sugars at early stage as well as in both monosaccharides in dough-ripe
stage. None of both disaccharides across three stages were influenced by cultivars
irrespective of locations (Table 8).
Regarding to locations, cv. Amaretto collected from Gladebeck contained significantly
more disaccharides (p ≤ 0.05) than those in Torland at three different development stages.
Moreover, more monosaccharides were accumulated in cv. Cubus in Gladebeck compared to
those collected from Torland during grain development and maturation.
What is interesting that out of the four sugars assessed in this study, only maltose
content varied significantly among locations irrespective of cultivars across three
development stages. Additionally, the location of cultivation influenced the reducing sugars
and total sugars in dough-ripe and mature-harvest stages (Table 7).
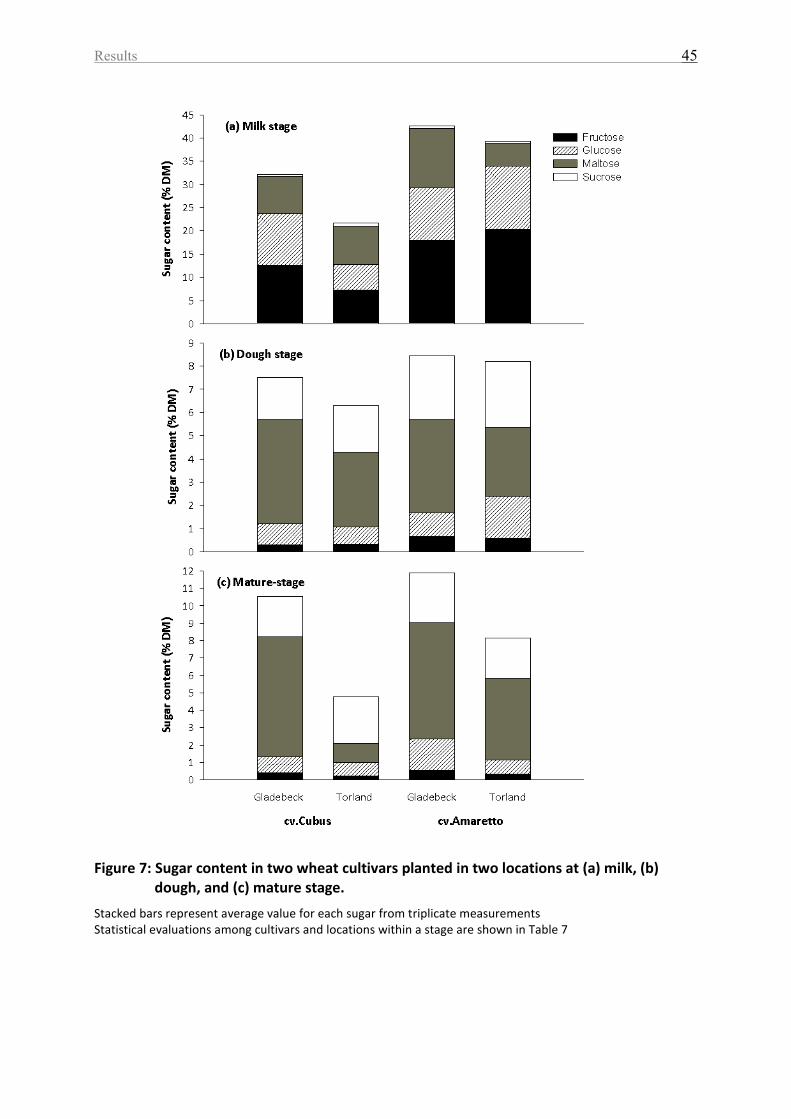
Results 45
Figure 7: Sugar content in two wheat cultivars planted in two locations at (a) milk, (b) dough, and (c) mature stage.
Stacked bars represent average value for each sugar from triplicate measurements Statistical evaluations among cultivars and locations within a stage are shown in Table 7
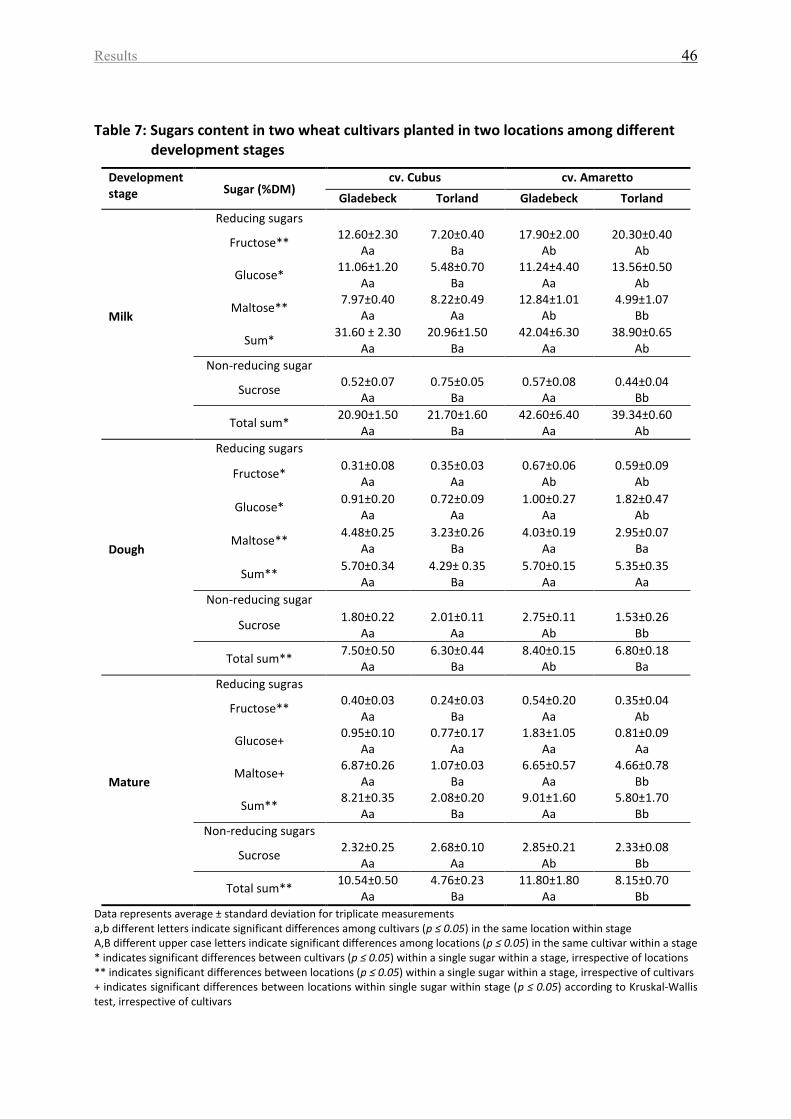
Results 46
Table 7: Sugars content in two wheat cultivars planted in two locations among different development stages
Development stage Sugar (%DM)
cv. Cubus cv. Amaretto
Gladebeck Torland Gladebeck Torland
Milk
Reducing sugars
Fructose** 12.60±2.30
Aa 7.20±0.40
Ba 17.90±2.00
Ab 20.30±0.40
Ab
Glucose* 11.06±1.20
Aa 5.48±0.70
Ba 11.24±4.40
Aa 13.56±0.50
Ab
Maltose** 7.97±0.40
Aa 8.22±0.49
Aa 12.84±1.01
Ab 4.99±1.07
Bb
Sum* 31.60 ± 2.30
Aa 20.96±1.50
Ba 42.04±6.30
Aa 38.90±0.65
Ab
Non-reducing sugar
Sucrose 0.52±0.07
Aa 0.75±0.05
Ba 0.57±0.08
Aa 0.44±0.04
Bb
Total sum* 20.90±1.50
Aa 21.70±1.60
Ba 42.60±6.40
Aa 39.34±0.60
Ab
Dough
Reducing sugars
Fructose* 0.31±0.08
Aa 0.35±0.03
Aa 0.67±0.06
Ab 0.59±0.09
Ab
Glucose* 0.91±0.20
Aa 0.72±0.09
Aa 1.00±0.27
Aa 1.82±0.47
Ab
Maltose** 4.48±0.25
Aa 3.23±0.26
Ba 4.03±0.19
Aa 2.95±0.07
Ba
Sum** 5.70±0.34
Aa 4.29± 0.35
Ba 5.70±0.15
Aa 5.35±0.35
Aa
Non-reducing sugar
Sucrose 1.80±0.22
Aa 2.01±0.11
Aa 2.75±0.11
Ab 1.53±0.26
Bb
Total sum** 7.50±0.50
Aa 6.30±0.44
Ba 8.40±0.15
Ab 6.80±0.18
Ba
Mature
Reducing sugras
Fructose** 0.40±0.03
Aa 0.24±0.03
Ba 0.54±0.20
Aa 0.35±0.04
Ab
Glucose+ 0.95±0.10
Aa 0.77±0.17
Aa 1.83±1.05
Aa 0.81±0.09
Aa
Maltose+ 6.87±0.26
Aa 1.07±0.03
Ba 6.65±0.57
Aa 4.66±0.78
Bb
Sum** 8.21±0.35
Aa 2.08±0.20
Ba 9.01±1.60
Aa 5.80±1.70
Bb
Non-reducing sugars
Sucrose 2.32±0.25
Aa 2.68±0.10
Aa 2.85±0.21
Ab 2.33±0.08
Bb
Total sum** 10.54±0.50
Aa 4.76±0.23
Ba 11.80±1.80
Aa 8.15±0.70
Bb
Data represents average ± standard deviation for triplicate measurements a,b different letters indicate significant differences among cultivars (p ≤ 0.05) in the same location within stage A,B different upper case letters indicate significant differences among locations (p ≤ 0.05) in the same cultivar within a stage * indicates significant differences between cultivars (p ≤ 0.05) within a single sugar within a stage, irrespective of locations ** indicates significant differences between locations (p ≤ 0.05) within a single sugar within a stage, irrespective of cultivars + indicates significant differences between locations within single sugar within stage (p ≤ 0.05) according to Kruskal-Wallis test, irrespective of cultivars
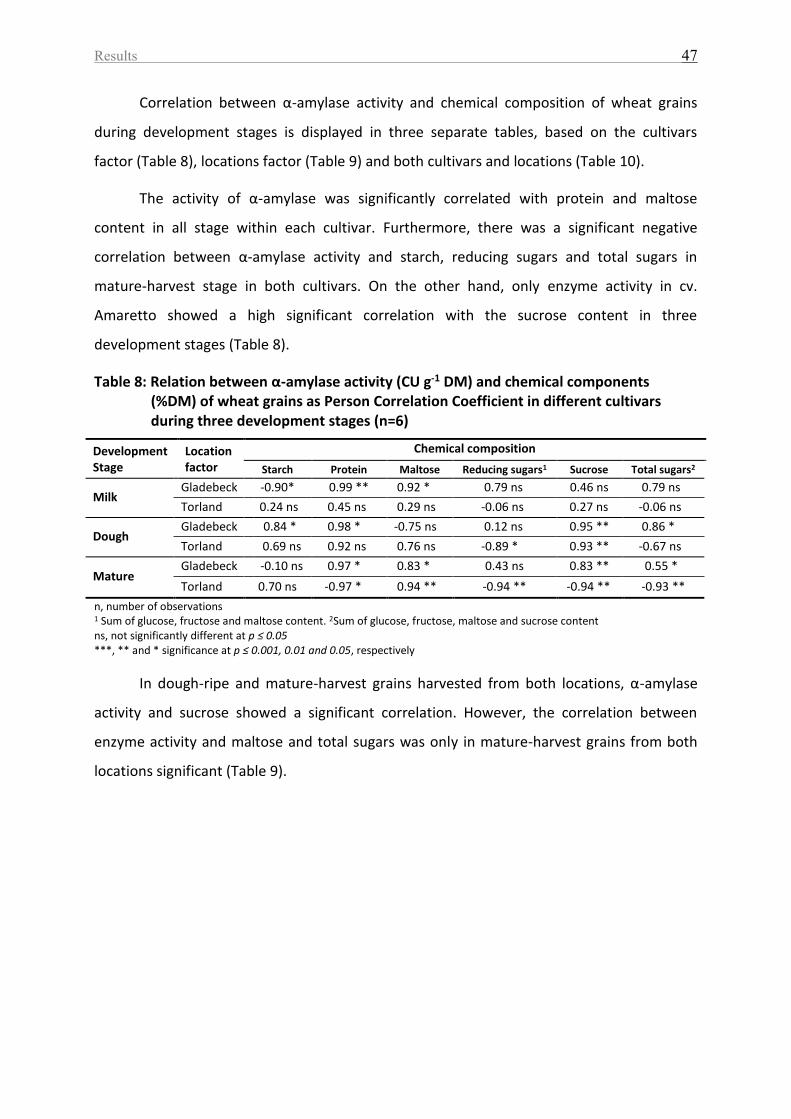
Results 47
Correlation between α-amylase activity and chemical composition of wheat grains
during development stages is displayed in three separate tables, based on the cultivars
factor (Table 8), locations factor (Table 9) and both cultivars and locations (Table 10).
The activity of α-amylase was significantly correlated with protein and maltose
content in all stage within each cultivar. Furthermore, there was a significant negative
correlation between α-amylase activity and starch, reducing sugars and total sugars in
mature-harvest stage in both cultivars. On the other hand, only enzyme activity in cv.
Amaretto showed a high significant correlation with the sucrose content in three
development stages (Table 8).
Table 8: Relation between α-amylase activity (CU g-1 DM) and chemical components (%DM) of wheat grains as Person Correlation Coefficient in different cultivars during three development stages (n=6)
Development Stage
Location factor
Chemical composition
Starch Protein Maltose Reducing sugars1 Sucrose Total sugars2
Milk Gladebeck -0.90* 0.99 ** 0.92 * 0.79 ns 0.46 ns 0.79 ns
Torland 0.24 ns 0.45 ns 0.29 ns -0.06 ns 0.27 ns -0.06 ns
Dough Gladebeck 0.84 * 0.98 * -0.75 ns 0.12 ns 0.95 ** 0.86 *
Torland 0.69 ns 0.92 ns 0.76 ns -0.89 * 0.93 ** -0.67 ns
Mature Gladebeck -0.10 ns 0.97 * 0.83 * 0.43 ns 0.83 ** 0.55 *
Torland 0.70 ns -0.97 * 0.94 ** -0.94 ** -0.94 ** -0.93 **
n, number of observations 1 Sum of glucose, fructose and maltose content. 2Sum of glucose, fructose, maltose and sucrose content ns, not significantly different at p ≤ 0.05 ***, ** and * significance at p ≤ 0.001, 0.01 and 0.05, respectively
In dough-ripe and mature-harvest grains harvested from both locations, α-amylase
activity and sucrose showed a significant correlation. However, the correlation between
enzyme activity and maltose and total sugars was only in mature-harvest grains from both
locations significant (Table 9).
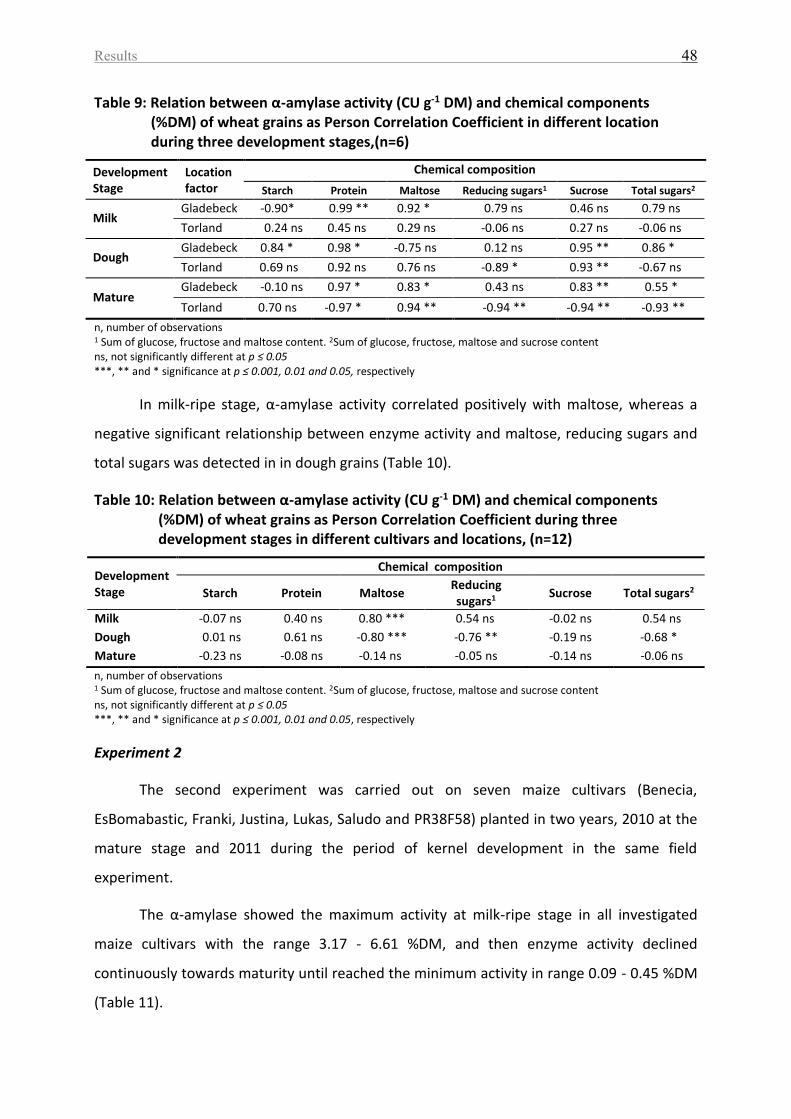
Results 48
Table 9: Relation between α-amylase activity (CU g-1 DM) and chemical components (%DM) of wheat grains as Person Correlation Coefficient in different location during three development stages,(n=6)
Development Stage
Location factor
Chemical composition
Starch Protein Maltose Reducing sugars1 Sucrose Total sugars2
Milk Gladebeck -0.90* 0.99 ** 0.92 * 0.79 ns 0.46 ns 0.79 ns
Torland 0.24 ns 0.45 ns 0.29 ns -0.06 ns 0.27 ns -0.06 ns
Dough Gladebeck 0.84 * 0.98 * -0.75 ns 0.12 ns 0.95 ** 0.86 *
Torland 0.69 ns 0.92 ns 0.76 ns -0.89 * 0.93 ** -0.67 ns
Mature Gladebeck -0.10 ns 0.97 * 0.83 * 0.43 ns 0.83 ** 0.55 *
Torland 0.70 ns -0.97 * 0.94 ** -0.94 ** -0.94 ** -0.93 **
n, number of observations 1 Sum of glucose, fructose and maltose content. 2Sum of glucose, fructose, maltose and sucrose content ns, not significantly different at p ≤ 0.05 ***, ** and * significance at p ≤ 0.001, 0.01 and 0.05, respectively
In milk-ripe stage, α-amylase activity correlated positively with maltose, whereas a
negative significant relationship between enzyme activity and maltose, reducing sugars and
total sugars was detected in in dough grains (Table 10).
Table 10: Relation between α-amylase activity (CU g-1 DM) and chemical components (%DM) of wheat grains as Person Correlation Coefficient during three development stages in different cultivars and locations, (n=12)
Development Stage
Chemical composition
Starch Protein Maltose Reducing sugars1
Sucrose Total sugars2
Milk -0.07 ns 0.40 ns 0.80 *** 0.54 ns -0.02 ns 0.54 ns
Dough 0.01 ns 0.61 ns -0.80 *** -0.76 ** -0.19 ns -0.68 *
Mature -0.23 ns -0.08 ns -0.14 ns -0.05 ns -0.14 ns -0.06 ns
n, number of observations 1 Sum of glucose, fructose and maltose content. 2Sum of glucose, fructose, maltose and sucrose content ns, not significantly different at p ≤ 0.05 ***, ** and * significance at p ≤ 0.001, 0.01 and 0.05, respectively
Experiment 2
The second experiment was carried out on seven maize cultivars (Benecia,
EsBomabastic, Franki, Justina, Lukas, Saludo and PR38F58) planted in two years, 2010 at the
mature stage and 2011 during the period of kernel development in the same field
experiment.
The α-amylase showed the maximum activity at milk-ripe stage in all investigated
maize cultivars with the range 3.17 - 6.61 %DM, and then enzyme activity declined
continuously towards maturity until reached the minimum activity in range 0.09 - 0.45 %DM
(Table 11).
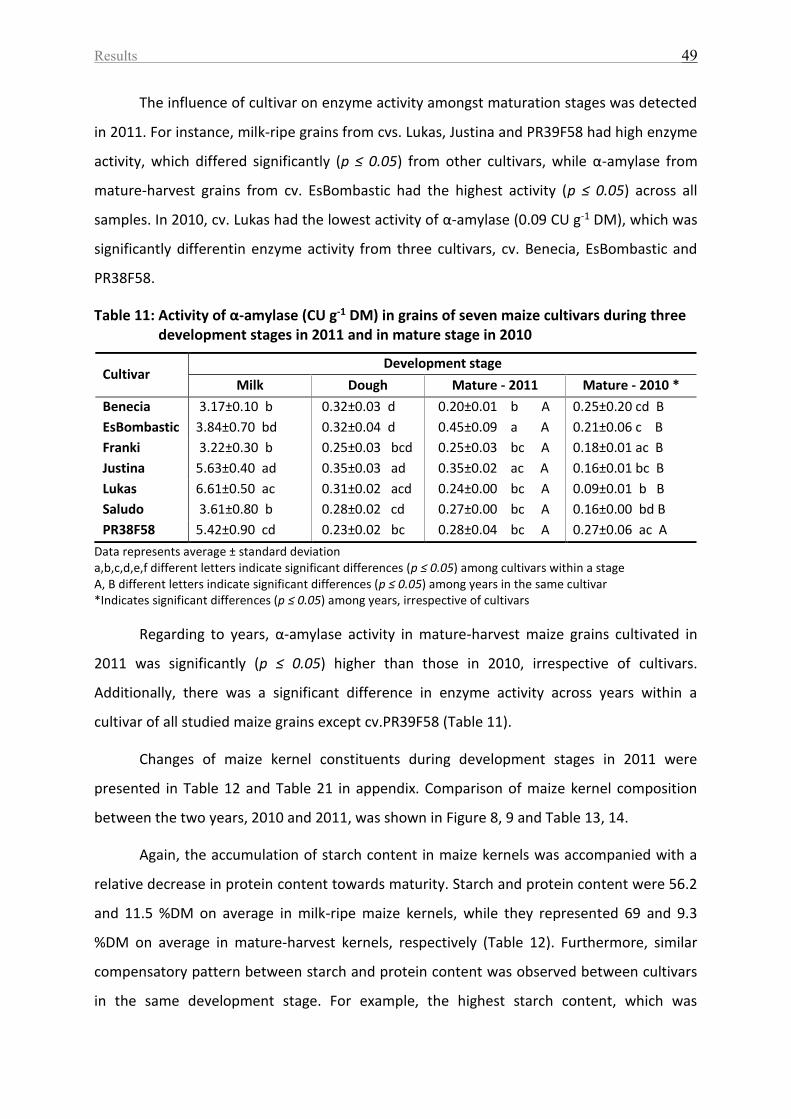
Results 49
The influence of cultivar on enzyme activity amongst maturation stages was detected
in 2011. For instance, milk-ripe grains from cvs. Lukas, Justina and PR39F58 had high enzyme
activity, which differed significantly (p ≤ 0.05) from other cultivars, while α-amylase from
mature-harvest grains from cv. EsBombastic had the highest activity (p ≤ 0.05) across all
samples. In 2010, cv. Lukas had the lowest activity of α-amylase (0.09 CU g-1 DM), which was
significantly differentin enzyme activity from three cultivars, cv. Benecia, EsBombastic and
PR38F58.
Table 11: Activity of α-amylase (CU g-1 DM) in grains of seven maize cultivars during three development stages in 2011 and in mature stage in 2010
Cultivar Development stage
Milk Dough Mature - 2011 Mature - 2010 *
Benecia 3.17±0.10 b 0.32±0.03 d 0.20±0.01 b A 0.25±0.20 cd B
EsBombastic 3.84±0.70 bd 0.32±0.04 d 0.45±0.09 a A 0.21±0.06 c B
Franki 3.22±0.30 b 0.25±0.03 bcd 0.25±0.03 bc A 0.18±0.01 ac B
Justina 5.63±0.40 ad 0.35±0.03 ad 0.35±0.02 ac A 0.16±0.01 bc B
Lukas 6.61±0.50 ac 0.31±0.02 acd 0.24±0.00 bc A 0.09±0.01 b B
Saludo 3.61±0.80 b 0.28±0.02 cd 0.27±0.00 bc A 0.16±0.00 bd B
PR38F58 5.42±0.90 cd 0.23±0.02 bc 0.28±0.04 bc A 0.27±0.06 ac A
Data represents average ± standard deviation a,b,c,d,e,f different letters indicate significant differences (p ≤ 0.05) among cultivars within a stage A, B different letters indicate significant differences (p ≤ 0.05) among years in the same cultivar *Indicates significant differences (p ≤ 0.05) among years, irrespective of cultivars
Regarding to years, α-amylase activity in mature-harvest maize grains cultivated in
2011 was significantly (p ≤ 0.05) higher than those in 2010, irrespective of cultivars.
Additionally, there was a significant difference in enzyme activity across years within a
cultivar of all studied maize grains except cv.PR39F58 (Table 11).
Changes of maize kernel constituents during development stages in 2011 were
presented in Table 12 and Table 21 in appendix. Comparison of maize kernel composition
between the two years, 2010 and 2011, was shown in Figure 8, 9 and Table 13, 14.
Again, the accumulation of starch content in maize kernels was accompanied with a
relative decrease in protein content towards maturity. Starch and protein content were 56.2
and 11.5 %DM on average in milk-ripe maize kernels, while they represented 69 and 9.3
%DM on average in mature-harvest kernels, respectively (Table 12). Furthermore, similar
compensatory pattern between starch and protein content was observed between cultivars
in the same development stage. For example, the highest starch content, which was
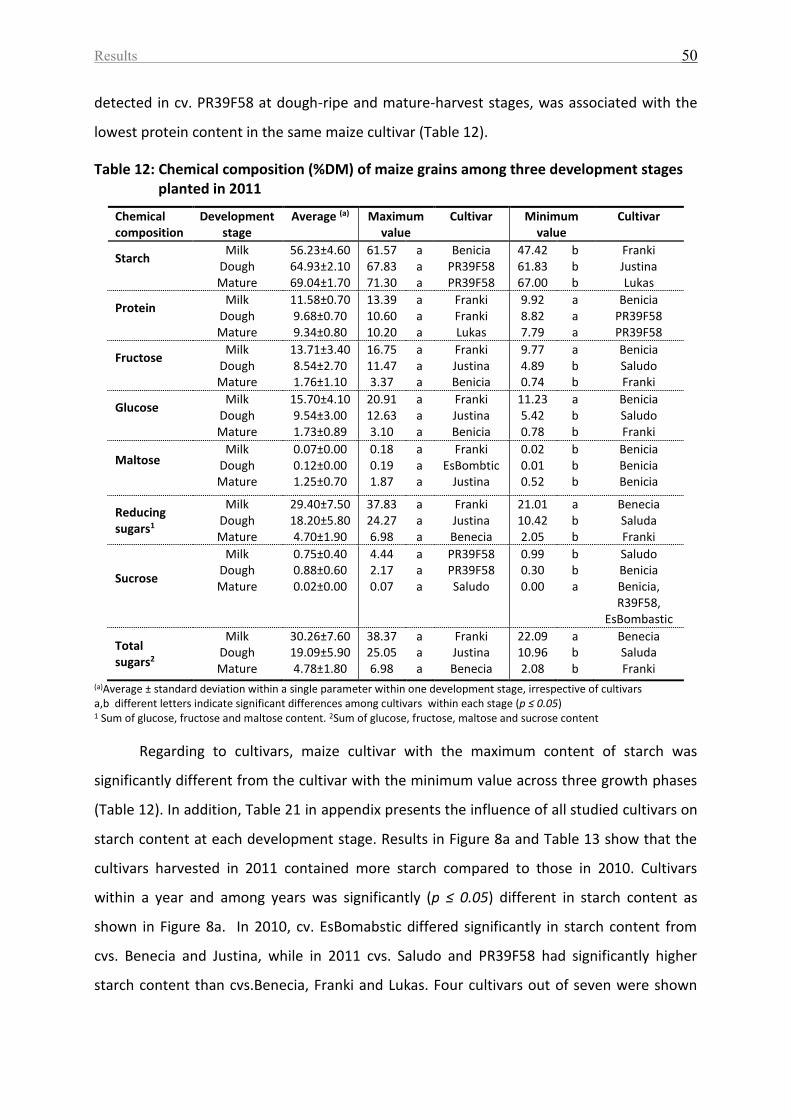
Results 50
detected in cv. PR39F58 at dough-ripe and mature-harvest stages, was associated with the
lowest protein content in the same maize cultivar (Table 12).
Table 12: Chemical composition (%DM) of maize grains among three development stages planted in 2011
Chemical composition
Development stage
Average (a) Maximum value
Cultivar Minimum value
Cultivar
Starch
Milk Dough Mature
56.23±4.60 64.93±2.10 69.04±1.70
61.57 67.83 71.30
a a a
Benicia PR39F58 PR39F58
47.42 61.83 67.00
b b b
Franki Justina Lukas
Protein
Milk Dough Mature
11.58±0.70 9.68±0.70 9.34±0.80
13.39 10.60 10.20
a a a
Franki Franki Lukas
9.92 8.82 7.79
a a a
Benicia PR39F58 PR39F58
Fructose
Milk Dough Mature
13.71±3.40 8.54±2.70 1.76±1.10
16.75 11.47 3.37
a a a
Franki Justina Benicia
9.77 4.89 0.74
a b b
Benicia Saludo Franki
Glucose
Milk Dough Mature
15.70±4.10 9.54±3.00 1.73±0.89
20.91 12.63 3.10
a a a
Franki Justina Benicia
11.23 5.42 0.78
a b b
Benicia Saludo Franki
Maltose
Milk Dough Mature
0.07±0.00 0.12±0.00 1.25±0.70
0.18 0.19 1.87
a a a
Franki EsBombtic
Justina
0.02 0.01 0.52
b b b
Benicia Benicia Benicia
Reducing sugars1
Milk Dough Mature
29.40±7.50 18.20±5.80 4.70±1.90
37.83 24.27 6.98
a a a
Franki Justina Benecia
21.01 10.42 2.05
a b b
Benecia Saluda Franki
Sucrose
Milk Dough Mature
0.75±0.40 0.88±0.60 0.02±0.00
4.44 2.17 0.07
a a a
PR39F58 PR39F58 Saludo
0.99 0.30 0.00
b b a
Saludo Benicia Benicia, R39F58,
EsBombastic
Total sugars2
Milk Dough Mature
30.26±7.60 19.09±5.90 4.78±1.80
38.37 25.05 6.98
a a a
Franki Justina Benecia
22.09 10.96 2.08
a b b
Benecia Saluda Franki
(a)Average ± standard deviation within a single parameter within one development stage, irrespective of cultivars a,b different letters indicate significant differences among cultivars within each stage (p ≤ 0.05) 1 Sum of glucose, fructose and maltose content. 2Sum of glucose, fructose, maltose and sucrose content
Regarding to cultivars, maize cultivar with the maximum content of starch was
significantly different from the cultivar with the minimum value across three growth phases
(Table 12). In addition, Table 21 in appendix presents the influence of all studied cultivars on
starch content at each development stage. Results in Figure 8a and Table 13 show that the
cultivars harvested in 2011 contained more starch compared to those in 2010. Cultivars
within a year and among years was significantly (p ≤ 0.05) different in starch content as
shown in Figure 8a. In 2010, cv. EsBomabstic differed significantly in starch content from
cvs. Benecia and Justina, while in 2011 cvs. Saludo and PR39F58 had significantly higher
starch content than cvs.Benecia, Franki and Lukas. Four cultivars out of seven were shown
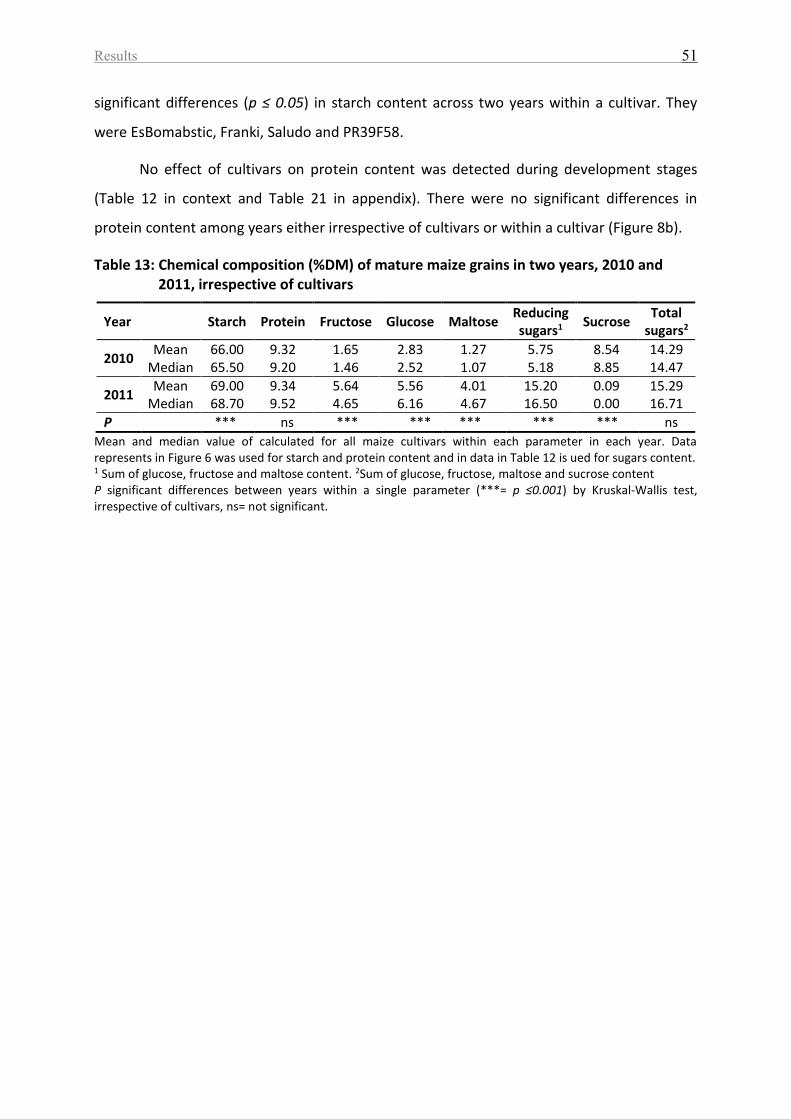
Results 51
significant differences (p ≤ 0.05) in starch content across two years within a cultivar. They
were EsBomabstic, Franki, Saludo and PR39F58.
No effect of cultivars on protein content was detected during development stages
(Table 12 in context and Table 21 in appendix). There were no significant differences in
protein content among years either irrespective of cultivars or within a cultivar (Figure 8b).
Table 13: Chemical composition (%DM) of mature maize grains in two years, 2010 and 2011, irrespective of cultivars
Year
Starch Protein Fructose Glucose Maltose Reducing sugars1
Sucrose Total
sugars2
2010 Mean 66.00 9.32 1.65 2.83 1.27 5.75 8.54 14.29
Median 65.50 9.20 1.46 2.52 1.07 5.18 8.85 14.47
2011 Mean 69.00 9.34 5.64 5.56 4.01 15.20 0.09 15.29
Median 68.70 9.52 4.65 6.16 4.67 16.50 0.00 16.71
P *** ns *** *** *** *** *** ns
Mean and median value of calculated for all maize cultivars within each parameter in each year. Data represents in Figure 6 was used for starch and protein content and in data in Table 12 is ued for sugars content. 1 Sum of glucose, fructose and maltose content. 2Sum of glucose, fructose, maltose and sucrose content P significant differences between years within a single parameter (***= p ≤0.001) by Kruskal-Wallis test, irrespective of cultivars, ns= not significant.
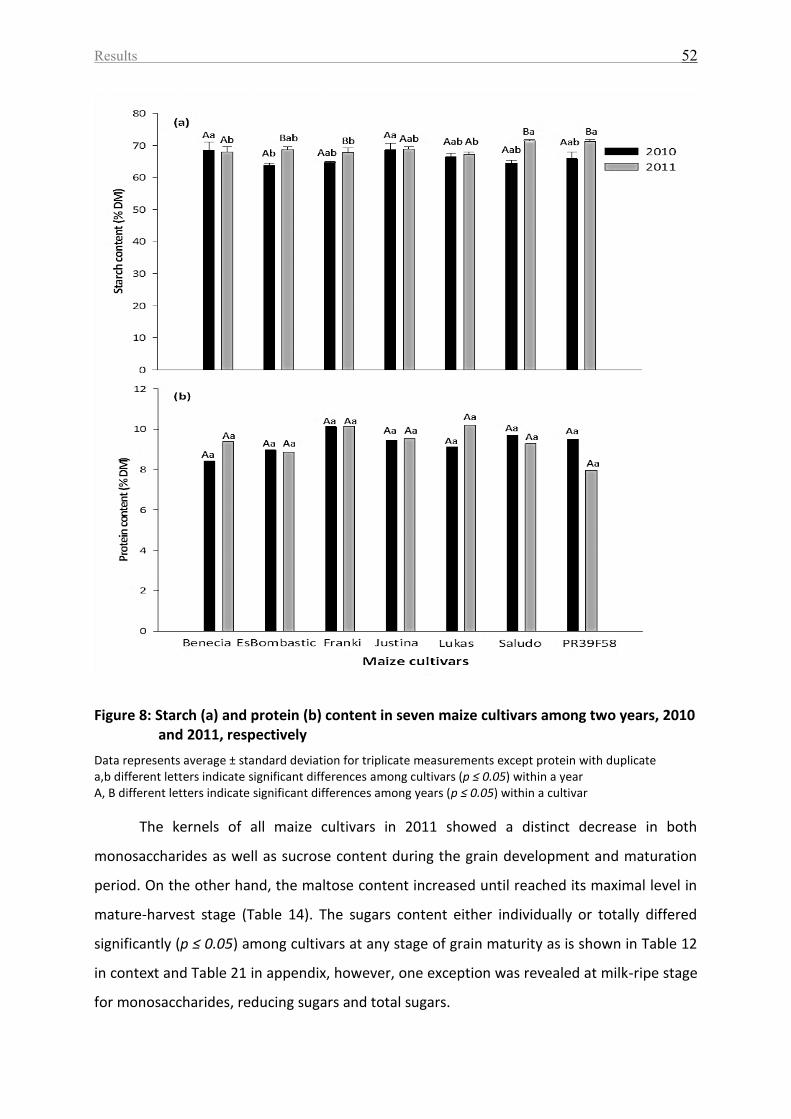
Results 52
Figure 8: Starch (a) and protein (b) content in seven maize cultivars among two years, 2010 and 2011, respectively
Data represents average ± standard deviation for triplicate measurements except protein with duplicate a,b different letters indicate significant differences among cultivars (p ≤ 0.05) within a year A, B different letters indicate significant differences among years (p ≤ 0.05) within a cultivar
The kernels of all maize cultivars in 2011 showed a distinct decrease in both
monosaccharides as well as sucrose content during the grain development and maturation
period. On the other hand, the maltose content increased until reached its maximal level in
mature-harvest stage (Table 14). The sugars content either individually or totally differed
significantly (p ≤ 0.05) among cultivars at any stage of grain maturity as is shown in Table 12
in context and Table 21 in appendix, however, one exception was revealed at milk-ripe stage
for monosaccharides, reducing sugars and total sugars.
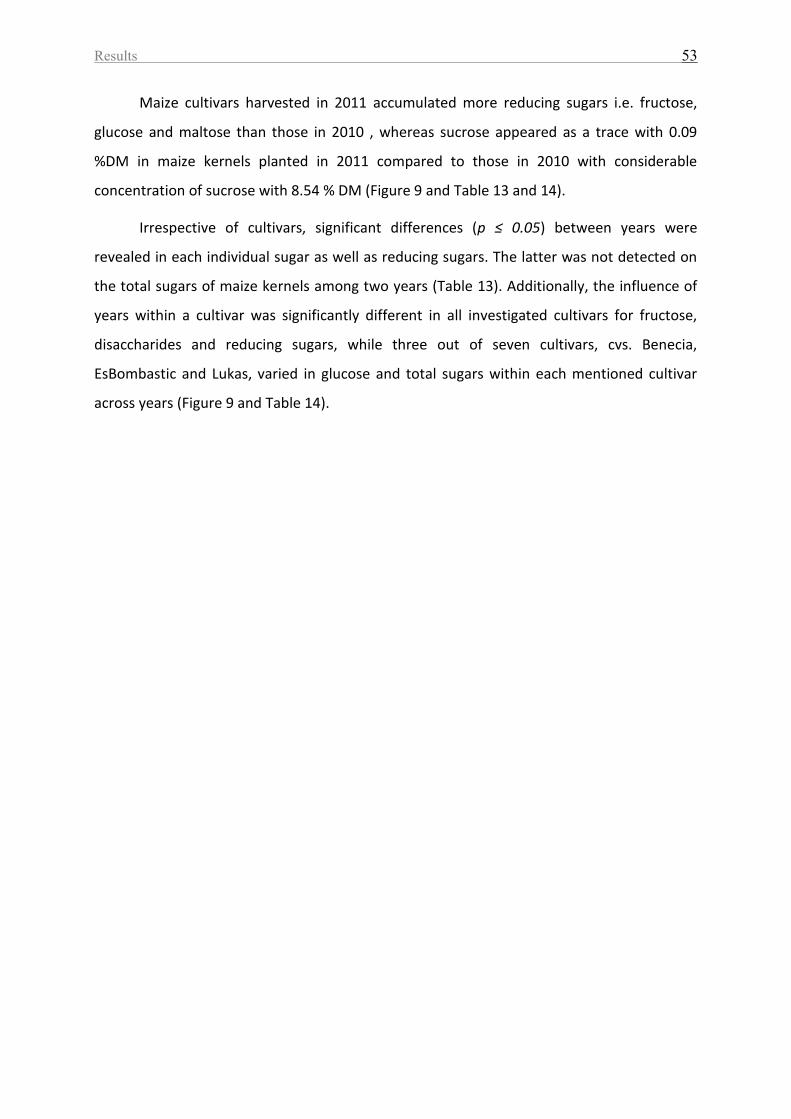
Results 53
Maize cultivars harvested in 2011 accumulated more reducing sugars i.e. fructose,
glucose and maltose than those in 2010 , whereas sucrose appeared as a trace with 0.09
%DM in maize kernels planted in 2011 compared to those in 2010 with considerable
concentration of sucrose with 8.54 % DM (Figure 9 and Table 13 and 14).
Irrespective of cultivars, significant differences (p ≤ 0.05) between years were
revealed in each individual sugar as well as reducing sugars. The latter was not detected on
the total sugars of maize kernels among two years (Table 13). Additionally, the influence of
years within a cultivar was significantly different in all investigated cultivars for fructose,
disaccharides and reducing sugars, while three out of seven cultivars, cvs. Benecia,
EsBombastic and Lukas, varied in glucose and total sugars within each mentioned cultivar
across years (Figure 9 and Table 14).
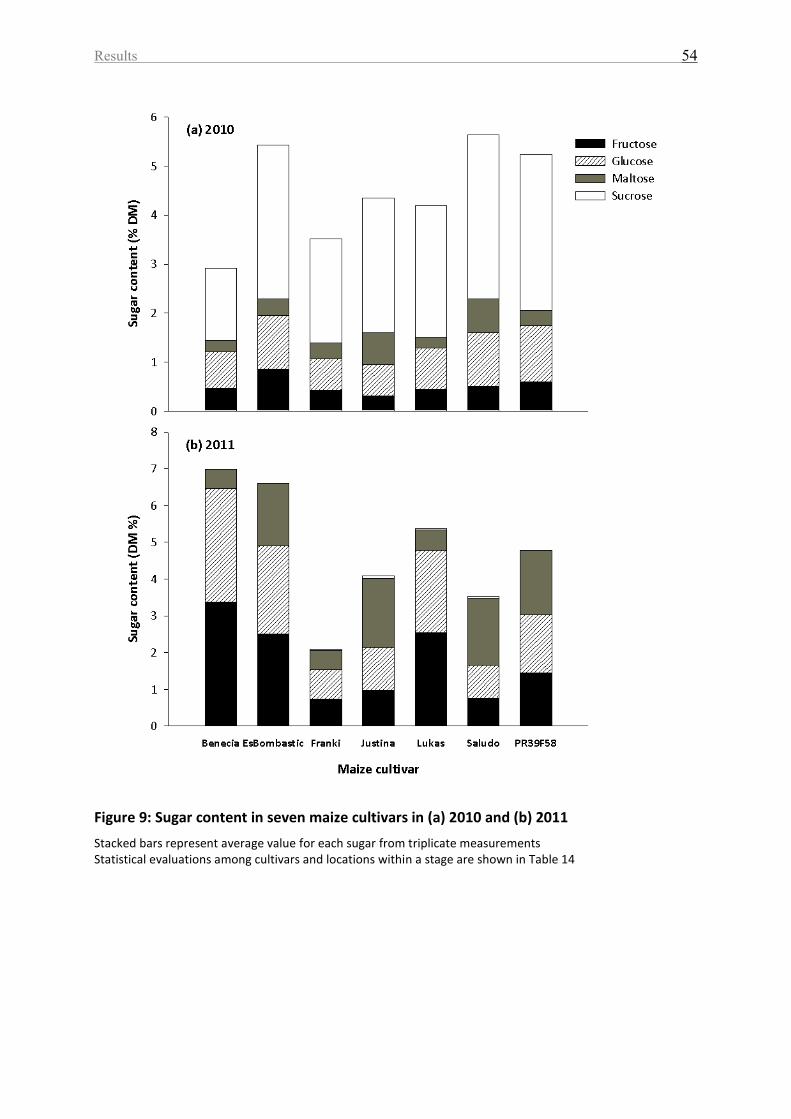
Results 54
Figure 9: Sugar content in seven maize cultivars in (a) 2010 and (b) 2011
Stacked bars represent average value for each sugar from triplicate measurements Statistical evaluations among cultivars and locations within a stage are shown in Table 14
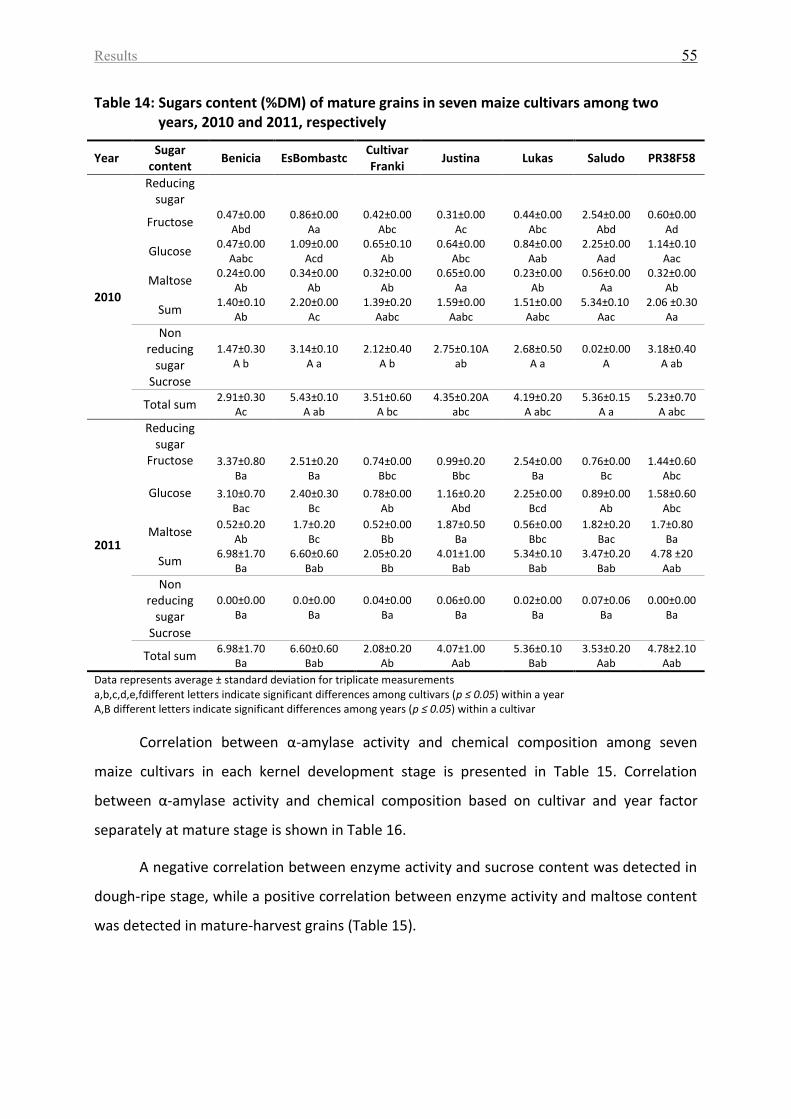
Results 55
Table 14: Sugars content (%DM) of mature grains in seven maize cultivars among two years, 2010 and 2011, respectively
Year Sugar
content Benicia EsBombastc
Cultivar Franki
Justina Lukas Saludo PR38F58
2010
Reducing sugar
Fructose 0.47±0.00
Abd 0.86±0.00
Aa 0.42±0.00
Abc 0.31±0.00
Ac 0.44±0.00
Abc 2.54±0.00
Abd 0.60±0.00
Ad
Glucose 0.47±0.00
Aabc 1.09±0.00
Acd 0.65±0.10
Ab 0.64±0.00
Abc 0.84±0.00
Aab 2.25±0.00
Aad 1.14±0.10
Aac
Maltose 0.24±0.00
Ab 0.34±0.00
Ab 0.32±0.00
Ab 0.65±0.00
Aa 0.23±0.00
Ab 0.56±0.00
Aa 0.32±0.00
Ab
Sum 1.40±0.10
Ab 2.20±0.00
Ac 1.39±0.20
Aabc 1.59±0.00
Aabc 1.51±0.00
Aabc 5.34±0.10
Aac 2.06 ±0.30
Aa Non
reducing sugar
1.47±0.30
A b
3.14±0.10
A a
2.12±0.40
A b
2.75±0.10A
ab
2.68±0.50
A a
0.02±0.00
A
3.18±0.40
A ab
Sucrose
Total sum 2.91±0.30
Ac 5.43±0.10
A ab 3.51±0.60
A bc 4.35±0.20A
abc 4.19±0.20
A abc 5.36±0.15
A a 5.23±0.70
A abc
2011
Reducing sugar
Fructose
3.37±0.80 Ba
2.51±0.20 Ba
0.74±0.00 Bbc
0.99±0.20 Bbc
2.54±0.00 Ba
0.76±0.00 Bc
1.44±0.60 Abc
Glucose
3.10±0.70 Bac
2.40±0.30 Bc
0.78±0.00 Ab
1.16±0.20 Abd
2.25±0.00 Bcd
0.89±0.00 Ab
1.58±0.60 Abc
Maltose 0.52±0.20
Ab 1.7±0.20
Bc 0.52±0.00
Bb 1.87±0.50
Ba 0.56±0.00
Bbc 1.82±0.20
Bac 1.7±0.80
Ba
Sum 6.98±1.70
Ba 6.60±0.60
Bab 2.05±0.20
Bb 4.01±1.00
Bab 5.34±0.10
Bab 3.47±0.20
Bab 4.78 ±20
Aab Non
reducing sugar
0.00±0.00
Ba
0.0±0.00
Ba
0.04±0.00
Ba
0.06±0.00
Ba
0.02±0.00
Ba
0.07±0.06
Ba
0.00±0.00
Ba
Sucrose
Total sum 6.98±1.70
Ba 6.60±0.60
Bab 2.08±0.20
Ab 4.07±1.00
Aab 5.36±0.10
Bab 3.53±0.20
Aab 4.78±2.10
Aab
Data represents average ± standard deviation for triplicate measurements a,b,c,d,e,fdifferent letters indicate significant differences among cultivars (p ≤ 0.05) within a year A,B different letters indicate significant differences among years (p ≤ 0.05) within a cultivar
Correlation between α-amylase activity and chemical composition among seven
maize cultivars in each kernel development stage is presented in Table 15. Correlation
between α-amylase activity and chemical composition based on cultivar and year factor
separately at mature stage is shown in Table 16.
A negative correlation between enzyme activity and sucrose content was detected in
dough-ripe stage, while a positive correlation between enzyme activity and maltose content
was detected in mature-harvest grains (Table 15).
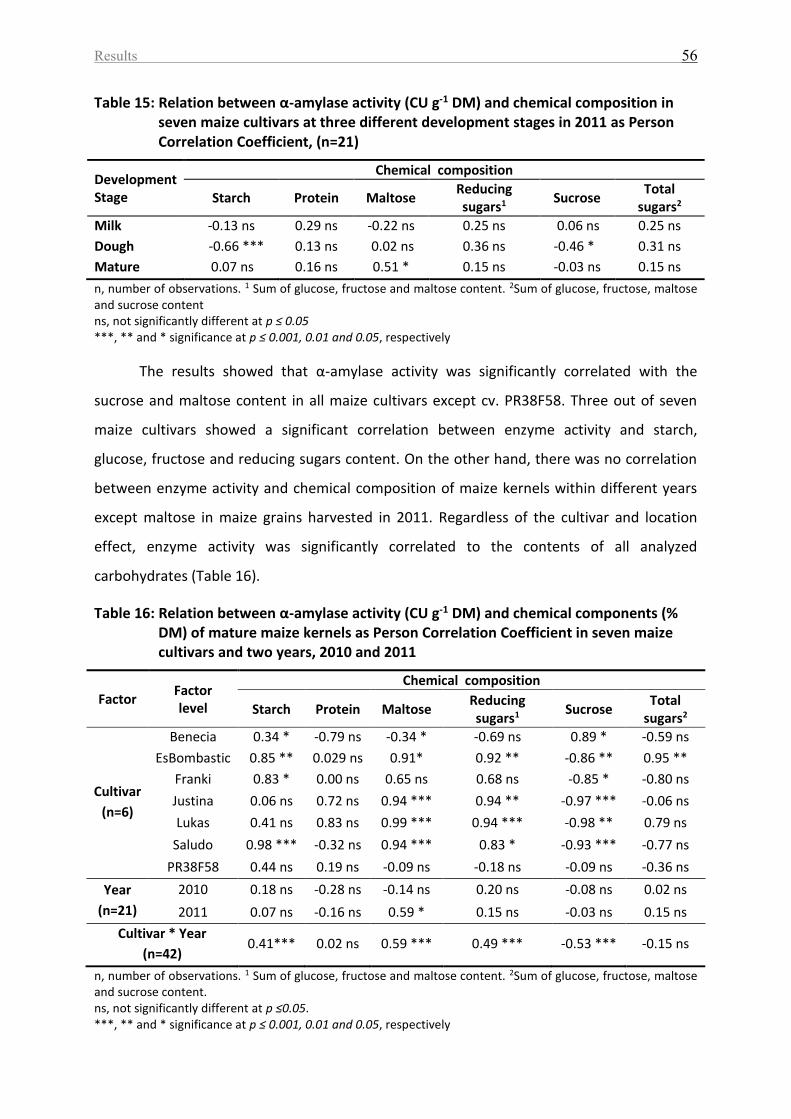
Results 56
Table 15: Relation between α-amylase activity (CU g-1 DM) and chemical composition in seven maize cultivars at three different development stages in 2011 as Person Correlation Coefficient, (n=21)
Development Stage
Chemical composition
Starch Protein Maltose Reducing sugars1
Sucrose Total
sugars2
Milk -0.13 ns 0.29 ns -0.22 ns 0.25 ns 0.06 ns 0.25 ns
Dough -0.66 *** 0.13 ns 0.02 ns 0.36 ns -0.46 * 0.31 ns
Mature 0.07 ns 0.16 ns 0.51 * 0.15 ns -0.03 ns 0.15 ns
n, number of observations. 1 Sum of glucose, fructose and maltose content. 2Sum of glucose, fructose, maltose and sucrose content ns, not significantly different at p ≤ 0.05 ***, ** and * significance at p ≤ 0.001, 0.01 and 0.05, respectively
The results showed that α-amylase activity was significantly correlated with the
sucrose and maltose content in all maize cultivars except cv. PR38F58. Three out of seven
maize cultivars showed a significant correlation between enzyme activity and starch,
glucose, fructose and reducing sugars content. On the other hand, there was no correlation
between enzyme activity and chemical composition of maize kernels within different years
except maltose in maize grains harvested in 2011. Regardless of the cultivar and location
effect, enzyme activity was significantly correlated to the contents of all analyzed
carbohydrates (Table 16).
Table 16: Relation between α-amylase activity (CU g-1 DM) and chemical components (% DM) of mature maize kernels as Person Correlation Coefficient in seven maize cultivars and two years, 2010 and 2011
Factor Factor level
Chemical composition
Starch Protein Maltose Reducing sugars1
Sucrose Total
sugars2
Cultivar
(n=6)
Benecia 0.34 * -0.79 ns -0.34 * -0.69 ns 0.89 * -0.59 ns
EsBombastic 0.85 ** 0.029 ns 0.91* 0.92 ** -0.86 ** 0.95 **
Franki 0.83 * 0.00 ns 0.65 ns 0.68 ns -0.85 * -0.80 ns
Justina 0.06 ns 0.72 ns 0.94 *** 0.94 ** -0.97 *** -0.06 ns
Lukas 0.41 ns 0.83 ns 0.99 *** 0.94 *** -0.98 ** 0.79 ns
Saludo 0.98 *** -0.32 ns 0.94 *** 0.83 * -0.93 *** -0.77 ns
PR38F58 0.44 ns 0.19 ns -0.09 ns -0.18 ns -0.09 ns -0.36 ns
Year
(n=21)
2010 0.18 ns -0.28 ns -0.14 ns 0.20 ns -0.08 ns 0.02 ns
2011 0.07 ns -0.16 ns 0.59 * 0.15 ns -0.03 ns 0.15 ns
Cultivar * Year
(n=42) 0.41*** 0.02 ns 0.59 *** 0.49 *** -0.53 *** -0.15 ns
n, number of observations. 1 Sum of glucose, fructose and maltose content. 2Sum of glucose, fructose, maltose and sucrose content. ns, not significantly different at p ≤0.05. ***, ** and * significance at p ≤ 0.001, 0.01 and 0.05, respectively
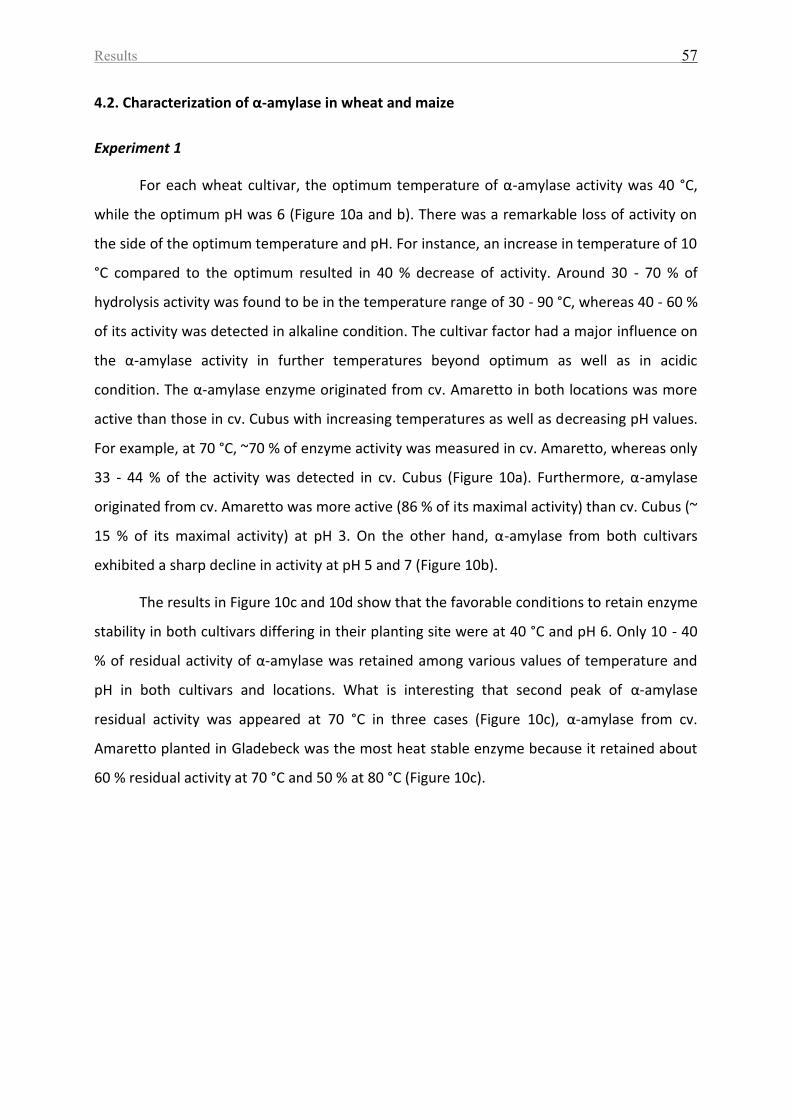
Results 57
4.2. Characterization of α-amylase in wheat and maize
Experiment 1
For each wheat cultivar, the optimum temperature of α-amylase activity was 40 °C,
while the optimum pH was 6 (Figure 10a and b). There was a remarkable loss of activity on
the side of the optimum temperature and pH. For instance, an increase in temperature of 10
°C compared to the optimum resulted in 40 % decrease of activity. Around 30 - 70 % of
hydrolysis activity was found to be in the temperature range of 30 - 90 °C, whereas 40 - 60 %
of its activity was detected in alkaline condition. The cultivar factor had a major influence on
the α-amylase activity in further temperatures beyond optimum as well as in acidic
condition. The α-amylase enzyme originated from cv. Amaretto in both locations was more
active than those in cv. Cubus with increasing temperatures as well as decreasing pH values.
For example, at 70 °C, ~70 % of enzyme activity was measured in cv. Amaretto, whereas only
33 - 44 % of the activity was detected in cv. Cubus (Figure 10a). Furthermore, α-amylase
originated from cv. Amaretto was more active (86 % of its maximal activity) than cv. Cubus (~
15 % of its maximal activity) at pH 3. On the other hand, α-amylase from both cultivars
exhibited a sharp decline in activity at pH 5 and 7 (Figure 10b).
The results in Figure 10c and 10d show that the favorable conditions to retain enzyme
stability in both cultivars differing in their planting site were at 40 °C and pH 6. Only 10 - 40
% of residual activity of α-amylase was retained among various values of temperature and
pH in both cultivars and locations. What is interesting that second peak of α-amylase
residual activity was appeared at 70 °C in three cases (Figure 10c), α-amylase from cv.
Amaretto planted in Gladebeck was the most heat stable enzyme because it retained about
60 % residual activity at 70 °C and 50 % at 80 °C (Figure 10c).
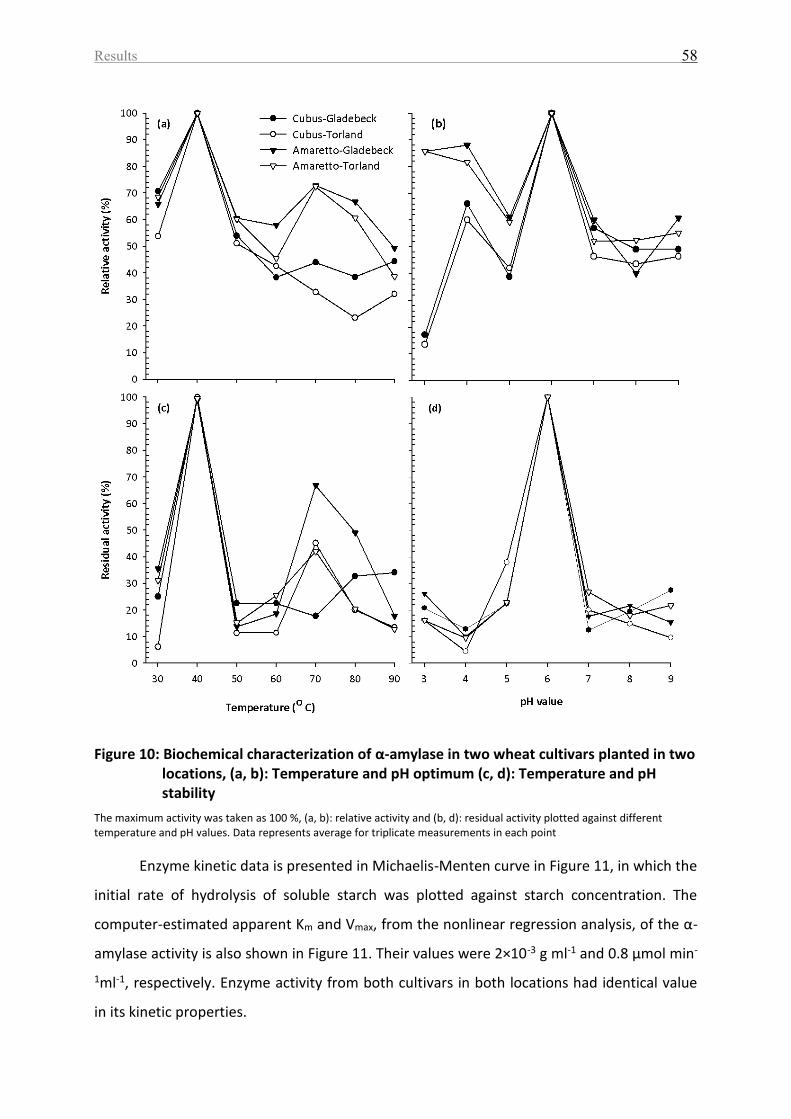
Results 58
Figure 10: Biochemical characterization of α-amylase in two wheat cultivars planted in two locations, (a, b): Temperature and pH optimum (c, d): Temperature and pH stability
The maximum activity was taken as 100 %, (a, b): relative activity and (b, d): residual activity plotted against different temperature and pH values. Data represents average for triplicate measurements in each point
Enzyme kinetic data is presented in Michaelis-Menten curve in Figure 11, in which the
initial rate of hydrolysis of soluble starch was plotted against starch concentration. The
computer-estimated apparent Km and Vmax, from the nonlinear regression analysis, of the α-
amylase activity is also shown in Figure 11. Their values were 2×10⁻³ g ml-1 and 0.8 μmol min-
1ml-1, respectively. Enzyme activity from both cultivars in both locations had identical value
in its kinetic properties.
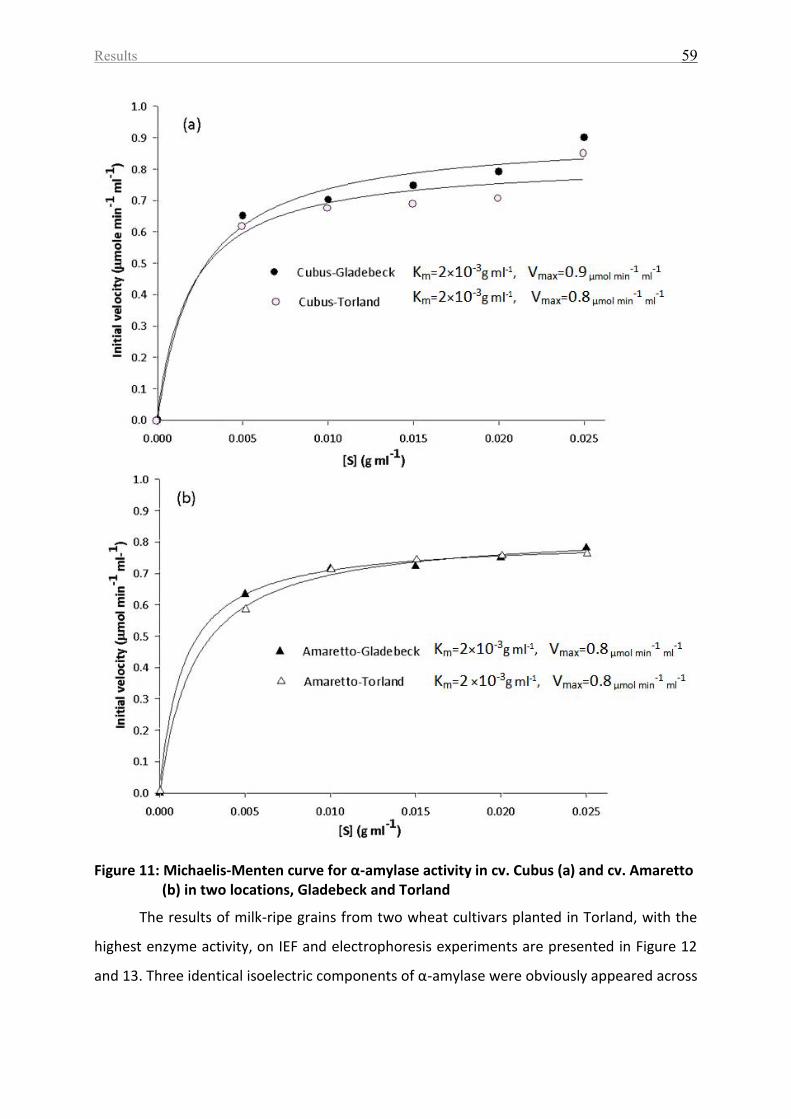
Results 59
Figure 11: Michaelis-Menten curve for α-amylase activity in cv. Cubus (a) and cv. Amaretto
(b) in two locations, Gladebeck and Torland
The results of milk-ripe grains from two wheat cultivars planted in Torland, with the
highest enzyme activity, on IEF and electrophoresis experiments are presented in Figure 12
and 13. Three identical isoelectric components of α-amylase were obviously appeared across
Results 60
two cultivars, their pIs were 4.4, 4.6 and 4.8 (Figure 12). The molecular weight value
determined by SDS-PAGE was 37.2 kDa in both cultivars (Figure 13).
Figure 12: IEF (a) and activity staining (b) of α-amylase in two wheat cultivars at milk-ripe stage planted in Torland
The arrows indicate the zones of α-amylase activity appeared as clear bands against dark background. The amount of extract applied to the gel (Figure 12 and 13) corresponding to 1.16 - 1.61 μmol min-1 ml-1. The protein concentration was 0.46 - 0.71 mg ml-1

Results 61
Experiment 2
The characteristic of α-amylase originated from seven maize cultivars across two
years is presented in Table 17. In order to highlight the trend of α-amylase attributes across
different cultivars and years, the data of enzyme characterization in two cultivars, cvs. Franki
and Saludo had been arbitrary chosen among other cultivars and then plotted among each
year (Figure 14, 15, 16 and 17).
Table 17: Biochemical characterization and kinetic parameters of α-amylase in seven maize cultivars at mature stage in two years, 2010 and 2011, respectively
Cultivar Temperature Optimum(°C)
Temperature stability(°C)
pH optimum
pH stability
Km
(× 10-3
g ml-1
) Vmax
(µmol min-1
ml-1
) 2010 2011 2010 2011 2010 2011 2010 2011 2010 2011 2010 2011
Benecia 50 50 60 40 5 3 6 6 6 5 0.21 0.46
EsBombastic 40 40 60 40 4 6 5 6 6 5 0.21 0.44
Franki 50 50 50 50 5 6 5 6 6 4 0.24 0.26
Justina 40 40 40 40 4 3 6 7 8 2 0.13 0.28
Lukas 50 40 40 40 5 5-6 3 6 8 19 0.12 0.51
Saludo 40 40 40 40 5 6 6 6 7 3 0.29 0.27
PR39F58 70 40 70 40 5 6 6 7 6 2 0.13 0.31
Data represents average for triplicate measurements
Figure 13: SDS-PAGE (a) and activity staining (b) of α-amylasein two wheat cultivars at milk-ripe stage planted in Torland The arrows indicate the zones of α-amylase activity appeared as clear bands against dark background
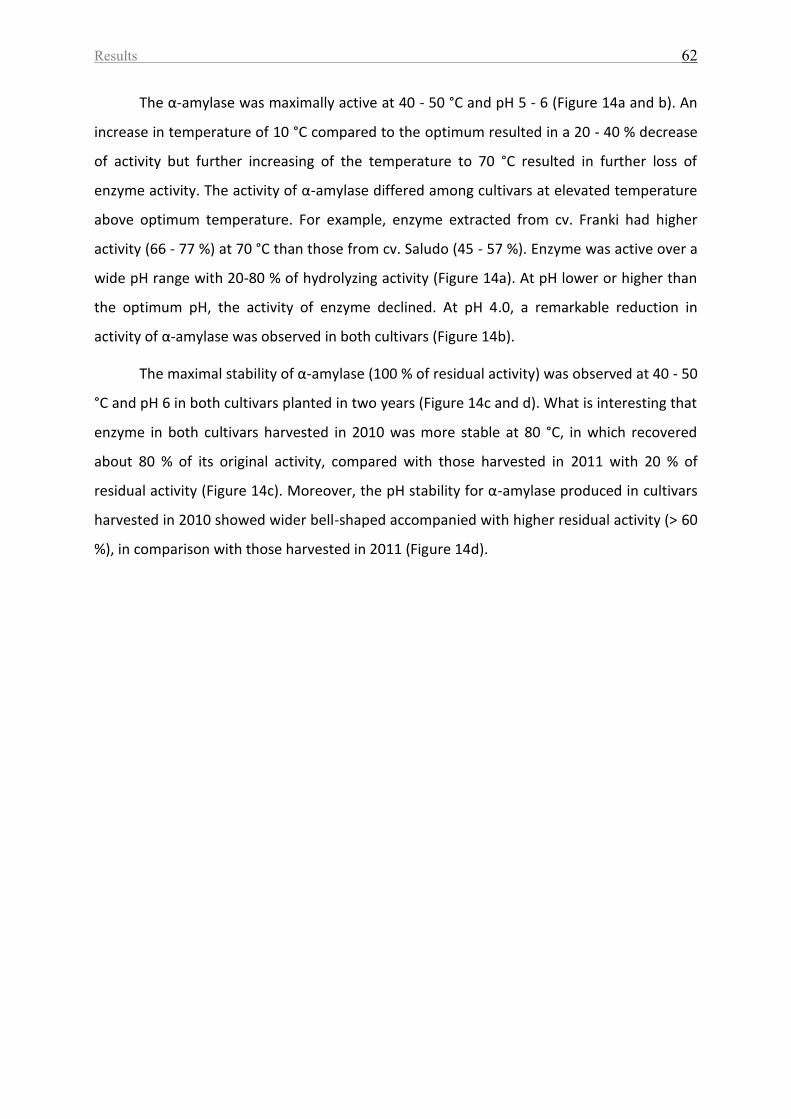
Results 62
The α-amylase was maximally active at 40 - 50 °C and pH 5 - 6 (Figure 14a and b). An
increase in temperature of 10 °C compared to the optimum resulted in a 20 - 40 % decrease
of activity but further increasing of the temperature to 70 °C resulted in further loss of
enzyme activity. The activity of α-amylase differed among cultivars at elevated temperature
above optimum temperature. For example, enzyme extracted from cv. Franki had higher
activity (66 - 77 %) at 70 °C than those from cv. Saludo (45 - 57 %). Enzyme was active over a
wide pH range with 20-80 % of hydrolyzing activity (Figure 14a). At pH lower or higher than
the optimum pH, the activity of enzyme declined. At pH 4.0, a remarkable reduction in
activity of α-amylase was observed in both cultivars (Figure 14b).
The maximal stability of α-amylase (100 % of residual activity) was observed at 40 - 50
°C and pH 6 in both cultivars planted in two years (Figure 14c and d). What is interesting that
enzyme in both cultivars harvested in 2010 was more stable at 80 °C, in which recovered
about 80 % of its original activity, compared with those harvested in 2011 with 20 % of
residual activity (Figure 14c). Moreover, the pH stability for α-amylase produced in cultivars
harvested in 2010 showed wider bell-shaped accompanied with higher residual activity (> 60
%), in comparison with those harvested in 2011 (Figure 14d).
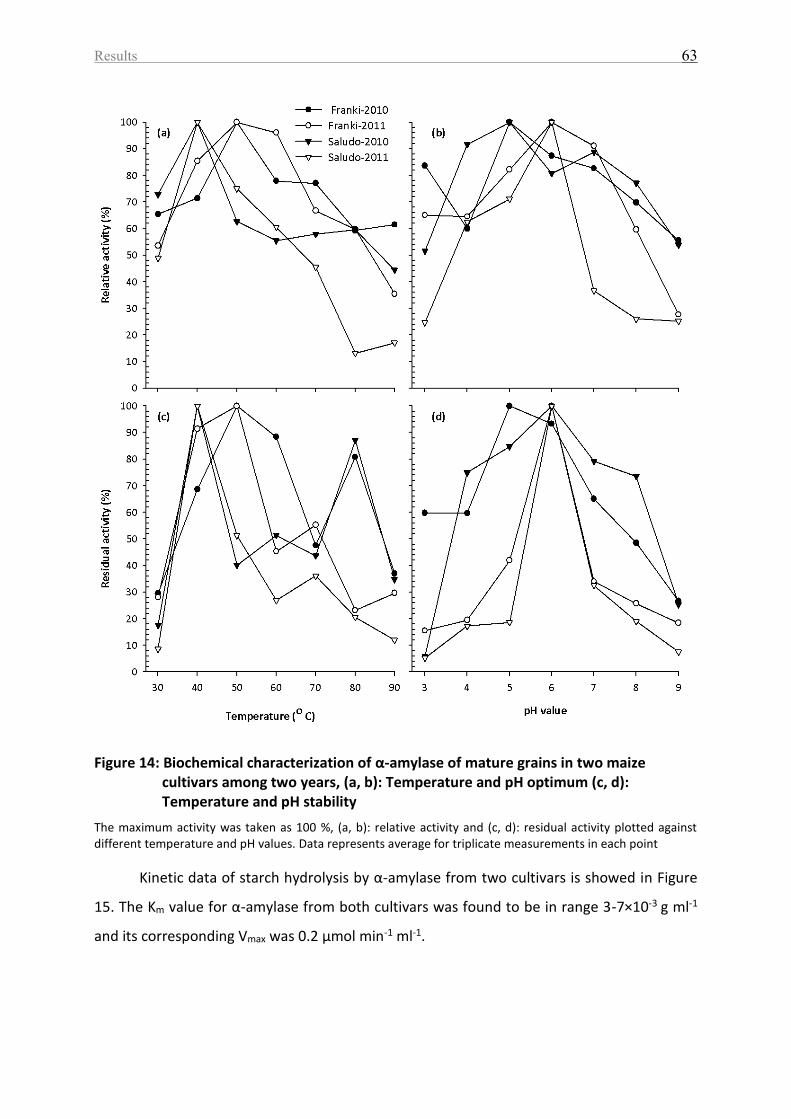
Results 63
Figure 14: Biochemical characterization of α-amylase of mature grains in two maize cultivars among two years, (a, b): Temperature and pH optimum (c, d): Temperature and pH stability
The maximum activity was taken as 100 %, (a, b): relative activity and (c, d): residual activity plotted against different temperature and pH values. Data represents average for triplicate measurements in each point
Kinetic data of starch hydrolysis by α-amylase from two cultivars is showed in Figure
15. The Km value for α-amylase from both cultivars was found to be in range 3-7×10⁻³ g ml-1
and its corresponding Vmax was 0.2 µmol min-1 ml-1.
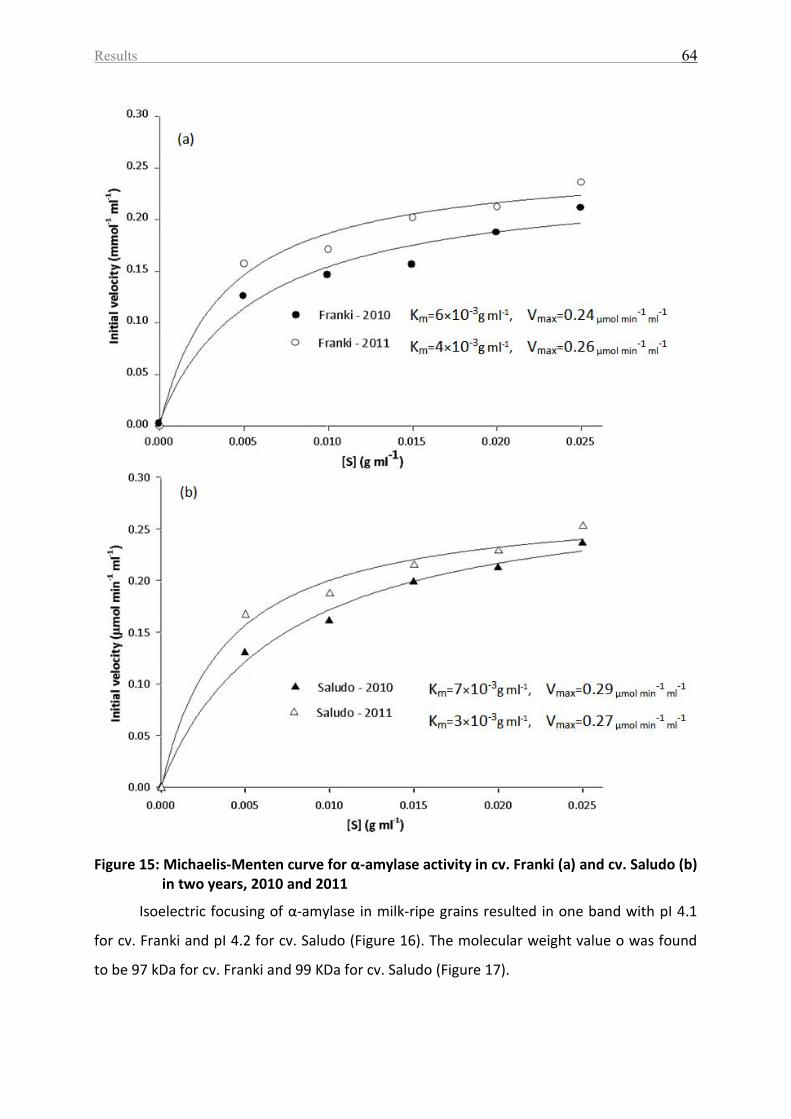
Results 64
Figure 15: Michaelis-Menten curve for α-amylase activity in cv. Franki (a) and cv. Saludo (b)
in two years, 2010 and 2011
Isoelectric focusing of α-amylase in milk-ripe grains resulted in one band with pI 4.1
for cv. Franki and pI 4.2 for cv. Saludo (Figure 16). The molecular weight value o was found
to be 97 kDa for cv. Franki and 99 KDa for cv. Saludo (Figure 17).
Results 65
Figure 16: IEF (a) and activity staining (b) of α-amylase in two maize cultivars at milk-ripe stage planted in 2011 The arrows indicate the zones of α-amylase activity appeared as clear bands against dark background The amount of extract applied to the gel (Figure 16 and 17) corresponding to 0.58 - 0.56 μmol min-1ml-1. The protein concentration was 0.38 - 0.47 mg ml-1
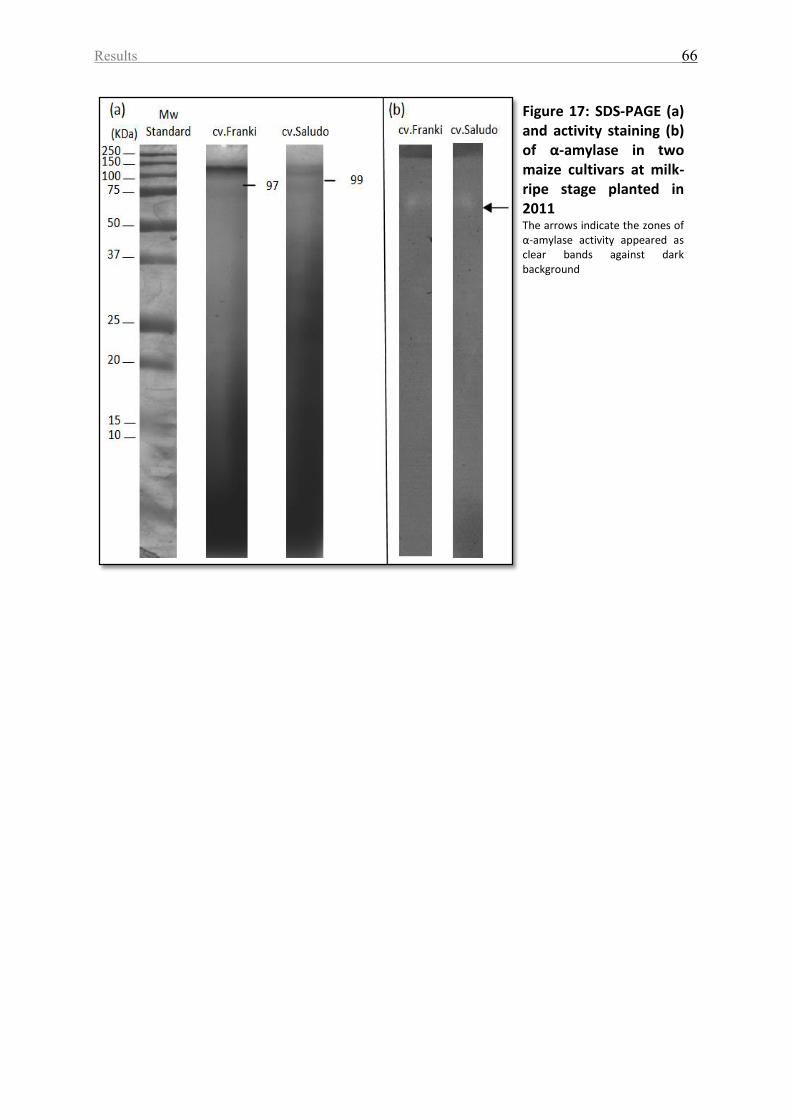
Results 66
Figure 17: SDS-PAGE (a) and activity staining (b) of α-amylase in two maize cultivars at milk-ripe stage planted in 2011 The arrows indicate the zones of α-amylase activity appeared as clear bands against dark background
Discussion 67
5. DISCUSSION
5.1. Influence of cultivars and environments on α-amylase activity and chemical composition throughout grain development
For convenience of discussion, the results from two experiments were combined to
explain the influence of cultivars and environments on α-amylase activity and chemical
composition of grains.
5.1.1. The activity of α-amylase
In the present study, the influence of the cultivars and environments (locations and
years) on the α-amylase activity in cereals grains, wheat and maize, was investigated during
grain growth and maturation.
Our results showed that the developmental pattern of α-amylase activity in grains
from wheat (Figure 5) and maize cultivars (Table 11) was similar. Enzyme activity peaked at
milk-ripe grains, followed by a rapid decline as the grains matured. This would be completely
in agreement with a previous finding by De Laethauwer et al. (2013), who stated that the
appearance of the highest α-amylase activity was detected during the first two weeks after
pollination, and then the activity of enzyme declined during the latter stages of maturation.
Furthermore, protein of α-amylase belongs to albumin and globulin fractions, in which the
latter represent 90 % of the total proteins in the first two weeks of the grain growth, and
then they decline until make up 20 - 30 % at mature-harvest stage (Emanuelsson et al. 2003;
Evers et al. 1999), so it is reasonable to presume that α-amylase activity may somehow
correlate with protein content as cited in several studies (Mikulikova et al. 2009; Barnard et
al. 2005; Kindred et al. 2005; Every et al. 2002). In our study, a strong significant correlation
between α-amylase activity and protein was observed in wheat across all grain development
stages (Table 8 and 9).
Alpha-amylase is mainly located in the pericarp tissues (Barrero et al. 2013), although
its presence has been reported in endosperm in immature wheat (Sidhu and Singh 2002) and
maize (Mechin et al. 2004) grains at 14 days after anthesis. In the early grain development,
pericarp of immature cereal grains represents a main part of the grain and contains a
significant amount of transitory starch (Kalinga et al. 2013). Pericarp starch represents a
Discussion 68
temporary energy store accumulated through active metabolism of the chloroplasts in the
pericarp of immature wheat grains (Zeeman et al. 2010; Evers and Millar 2002). In maize,
transitory starch is observed in the pedicel and pericarp tissues (Barnabas et al. 2008) before
fertilization and remains after fertilization in immature kernels (Kalinga et al. 2013). Pericarp
starch can be mobilized and translocated to other tissues during grain development in order
to serve as source of short-primer for starch synthesis in the endosperm (Kalinga et al.
2013). Therefore, it was believed that the function of α-amylase activity at early
development stage is involved in the breakdown of pericarp starch to produce maltose and
malto-oligosaccharides for subsequent use as primer molecules and/or in respiration during
starch synthesis in endosperm (e.g. Asthir et al. 2012; Piasecka-Kwiatkowska et al. 2007;
Sidhu and Singh 2002). After that, α-amylase degrades progressively during grain maturation
(Halford et al. 2011) and becomes undetectable at maturity-harvest stage (Faltermaier et al.
2014; lunn et al. 2001a). The degradation of enzyme coincides with disappearance of
transitory starch (Sidhu and Singh 2002).
In the present study, the range of α-amylase activity at milk-ripe stage was higher in
wheat grains (17.5 - 25.9 CU g-1 DM) than those in maize kernels (3.2 - 6.6 CU g-1 DM) (Figure
5 for wheat and Table 11 for maize). This is probably related to the chloroplast of pericarp
tissues in wheat grains, whereas maize grains have no chloroplast in their pericarp (Evers
and Millar 2002). It appears reasonable to assume that the more temporary starch in
pericarp is present, the more enzyme induction is revealed as suggested by Sidhu and Singh
(2002).
Regarding to the cultivars factor, the activity of α-amylase was significantly higher in
grains of cv. Amaretto harvested from Gladebeck and Torland, 0.25 and 0.39 CU g-1 DM,
respectively, than those from cv. Cubus in both locations, 0.14 and 0.20 CU g-1 DM,
respectively, at mature-harvest stage. In addition, mature-harvest grains from cv. Amaretto
showed significantly higher activity (p ≤ 0.05) of α-amylase than those from cv. Cubus,
irrespective of locations (Figure 5). This would be in agreement with Faltermaier et al.
(2014), who reviewed that differences in α-amylase activity was observed in different
cultivars and classes of wheat. Three reasons related to cultivar attributes are discussed for
these differences.
Discussion 69
The first reason is the differences in the flowering time between two wheat cultivars
in our study. The flowering time is one of remarkable features in cereal grains, influencing
duration and rate of grain filling as well as the harvest-maturity time (Egli 2004; Altenbach et
al. 2003). It is controlled by photoperiodic response (PPD genes) and vernalization
requirement (VRN genes) genes (Diallo et al. 2012; Distelfeld et al. 2009). The flowering time
in spring wheat of cv. Amaretto occurred between 30th June and 5th July, which was late
compared to winter wheat of cv. Cubus between 16th June and 20th June (Figure 18 in
appendix). The difference in flowering time between spring and winter wheat is due to
differences in VRN genes (Distelfeld et al. 2009), which leads to delay the mature-harvest
stage of cv. Amaretto to 20th August compared to cv. Cubus on 3rd August. Johansson
(2002) stated that wheat varieties flowering late were more vulnerable to pre-harvest
sprouting. This is presumably true because they may expose to unfavorable weather
conditions before harvest time (Farrer et al. 2006), resulting in an increase in α-amylase
activity due to de novo synthesis of enzyme in sprouted grains (Barrero et al. 2013).
Therefore, it can be assumed that cv. Amaretto grains are susceptible to pre-harvest
spouting phenomenon, since they subjected to unfavorable weather condition, particularly
high precipitation before harvest time (Figure 18 in appendix). Further details about the
influence of weather condition on α-amylase activity will be discussed thereinafter within
this subtitle 2.5.1.
Secondly, Biddulph et al. (2008) supposed that grain dormancy as genetic trait is
involved in differences in α-amylase activity. The α-amylase activity is correlated with the
degree of grain dormancy since α-amylase regards as one of factors that affect grain
germination rate (Gao et al. 2013). Furthermore, Dencic et al. (2013) found that wheat
cultivars could be classified based on their dormancy level and FN value. The first group was
strongly dormant cultivars whose FN value above 300s. The second group was partially
dormant cultivars that retain FN value not less than 250s. The third group was non-dormant
cultivars that showed significantly low FN value below 250s under. It reasonable to assume
that differences in α-amylase activity between two wheat cultivars in our study at mature-
harvest stage may attribute to the differences in the degree of grain dormancy from those
cultivars, although there was no information or preliminary germination test in both
experiments to measure dormancy behaviour on grains from investigated cultivars in the
Discussion 70
present study. The finding by Mohler et al. (2014) confirmed that there are many winter
wheat varieties are characterized by non-deep physiological seed dormancy.
Besides the flowering time and grain dormancy, grain size and α-amylase activity are
correlated with each other (Faltermaier et al. 2014). Evers et al. (1995) separated five UK
wheat cultivars into different grain size categories, and measured FN for each group. They
found that grains passing through 2.75 mm sieve had a higher FN value than the larger grains
between 2.75 - 3.75 mm. Farrell and Kettlewell (2009) reported that the association
between α-amylase activity and thousand grain weight as quantitative measure of grain size
was not consistent enough to indicate a direct mechanistic link across all UK wheat varieties,
although both genetic and environmental factors appeared to influence such association.
Large grain generally has more endospermic cells, longer filling duration and higher filling
rate than small grains (Dai et al. 2009). In both experiments, there was no grains size or
thousand kernels weight measurement. The activity of α-amylase and other chemical
components were calculated on a grain dry matter instead per grain. This calculation is
supposed to eliminate grain size differences as suggested by Ahmadi and Baker (2001).
In the second experiment, differences in α-amylase activity were significantly
detected (p ≤ 0.05) among seven maize cultivars at different development stages (Table 11).
The set of cultivars in our study was different in the hybrid type (one-way hybrid vs. three-
way hybrid), maturity behaviour (fast vs. slow), the flowering date and the time to maturity
(Table 20 in appendix). All mentioned factors may contribute to differences in α-amylase
activity in Exp.2. In addition, the assumption of differences in grain dormancy and grain size
in maize cultivars may cause differences in α-amylase activity, which have been discussed
before for wheat cultivars.
Regarding to environments factor, both locations (Exp.1) and two years (Exp.2) had a
major influence on differences in enzyme activity. These differences could be explained in
term of weather conditions in the field. Precipitation and temperature are the two climatic
factors that have a large effect on the plant growing periods (Barnabas et al. 2008) as well as
the grain growth and maturation (Barnard and Smith 2009). The influence of the weather
conditions on the cereals crops are distinguished between pre-anthesis impact and post-
anthesis impact (Aslam et al. 2013). Since our study focused on the changes of α-amylase
activity and chemical composition during grain filling and ripening, weather conditions
Discussion 71
between anthesis and maturity are discussed in the following context. The climate data is
presented in Figure 18 and 19 in appendix for both experiments.
Barnard and smith (2012 and 2009) found that the precipitation between the critical
periods of anthesis and maturity is accounted for the most differences between year-to-year
in both pre-harvest sprouting tolerance and the expression of dormancy, hence differences
in α-amylase activity. The precipitation and subsequent high relative humidity during grain
filling reduced the grain drying rate and dormancy that was initiated in mature grain. Such
conditions can stimulate germination and associate with α-amylase formation and activation
(Biddulph et al. 2005). It was found that the variation in precipitation at different locations
accounted for almost 85 % of the variation in sprouting tolerance in wheat cultivars,
particularly 20 day period before harvest (Barnard and Smith 2009). In addition, Barnard and
Smith (2012) found in their study that the FN value of 7 out of 11 wheat cultivars was
negatively affected by precipitation during the later stages of maturity. Furthermore, in a
research conducted on 17 wheat cultivars in three sites in Virginia, USA, Barbeau et al.
(2006), cited by Dencic et al. (2013), found that 6 cultivars had considerably lower FN than
the other cultivars in the site with intense precipitation (> 3 inches) during the week before
harvest. These cultivars did not differ from the others in the site with a dry period before
harvest. Regarding to our results in Exp.1, dough-ripe and mature-harvest grains collected
from Torland showed significantly higher (p ≤ 0.05) enzyme activity than those in Gladebeck
in each wheat cultivars (Figure 5). This difference seems to be related to the difference in
amount of the precipitation in both locations (see Figure 18 in appendix). For instance, the
average precipitation was 3.59 mm between 2nd July and 19th July in Torland, while it was
2.02 mm in Gladebeck. This difference in precipitation amount leads to double α-amylase
activity in dough-ripe grain in cv. Cubus from Torland (0.48 CU g-1 DM) compared to those
from Gladebeck (0.24 CU g-1 DM). Similarly, mature-harvest grains from cv. Amaretto in
Torland had higher α-amylase activity (0.39 CU g-1 DM) than those in Gladebeck (0.25 CU g-1
DM). Again, the high precipitation in Torland caused high α-amylase activity. The average
precipitation in Torland between 3rd August and 20th August was 5.5 mm, higher than in
Gladebeck with 2.56 mm.
In addition, the intensive precipitation was above 8.8 mm in Torland before and at
harvest date on 3rd August, which caused higher α-amylase activity in dough-ripe grains of
cv. Amaretto from Torland (0.41 CU g-1 DM) compared to those from Gladebeck (0.31 CU g-1
Discussion 72
DM), where the precipitation was ~1 mm. Tillmann (2013) pointed out that the precipitation
rate on August 2010 in Torland was higher than the period between 1960-1990.
Regarding to EXp.2, the significant difference in α-amylase activity between years was
detected within a cultivar except PR38F58, and without consideration to cultivars (Table 11).
Such difference appeared to be related to precipitation rate during grain maturity. In 2011,
the average precipitation during kernel development was 4.41 mm, while in 2010 it
amounted to 1.45 mm. The weather in 2011 was wetter than the period between 2000 and
2009, except 2007 (see Figure 20 in appendix) during the entire kernel development.
Beside the influence of precipitation on α-amylase activity by induction of pre-harvest
sprouting, Joe et al. (2005) found that the early precipitation during grain growth modified
α-amylase activity through its influence on gene expression. This may explain the significant
higher enzyme activity in grains of cv. Amaretto from Gladebeck (25.91 CU g-1 DM)
compared to those of cv. Cubus (20.59 CU g-1 DM) from the same location (Figure 5). In
Gladebeck, the average daily precipitation at milk-ripe stage was higher for cv. Amaretto
with 1.13 mm than and 0.28 mm for cv. Cubus. Furthermore, high temperature at milk stage
of cv. Amaretto may also be reasonable for higher α-amylase activity than cv. Cubus, since
high temperature increases enzyme activity and metabolic processes (Barnabas et al. 2008).
The maximum, average, and minimum daily temperatures were 22, 19 and 14.5 °C at milk-
ripe stage of cv. Amaretto, while they are 23, 17 and 9 °C at milk-ripe stage of cv. Cubus.
However, high ambient temperature in the summer is associated with high FN (Wang
et al. 2008), and hence a reduction in α-amylase activity. There could be more than one
explanation for this. On possible reason could be the gradual degradation of enzyme by the
constant exposure to ambient high temperatures ≥ 30 °C in the absence of sprouting
(Biddulph et al. 2008). The second reason could be shortened the period during which α-
amylase could accumulate and become active (Joe et al. 2005). Furthermore, high
temperature prior to harvest promotes the grain drying process and reduces the chance of
wet condition around the mature grain and thus can favor timely harvest (Joe et al. 2005;
Smith and Gooding et al. 1999). Barnard and Smith (2009) also found that high temperature
during grain filling was associated with induced dormancy in certain cultivars. The findings
mentioned above are consistent with our observation in differences in α-amylase activity
with differences temperature patterns at dough-ripe and mature-harvest grains in both
Discussion 73
cultivars and locations in Exp.1 (Figure 5). For example, dough-ripe grains of cv. Amaretto
planted in Gladebeck was lower in their enzyme activity (0.31 CU g-1 DM) compared to those
planted in Torland (0.41 CU g-1 DM) due to differences in the maximum daily temperature
range at dough-ripe stage, 20 - 30 °C in Gladebeck and 15 - 25 °C in Torland. Furthermore,
mature-harvest grain of cv. Cubus grains exhibited to the maximum daily temperature
ranged 20 - 33 °C in Gladebeck, had lower activity than grains either from the same cultivars
exhibited to the maximum daily temperature in range 16 - 21 °C in Torland, or from cv.
Amaretto grains in the same location with the maximum daily temperature ranged 16 - 17 °C
(Figure 18 in appendix).
The reduction in sunshine hours and temperature for a near constant precipitation
reduces the ability of mature grain to dry by reducing evapotranspiration. This leads to
delaying harvest and hence increasing susceptibility to pre-harvest sprouting damage
(Hollins et al. 2004). This result is inconsistent to our results in Exp.2, where the weather in
2011 was wetter, hotter and more sunny hours in a day compared to 2010. The average of
precipitation, the maximum daily temperature and daily sunshine hours in 2011 were 4.45
mm, 22°C and 6 hrs., whereas they were 1.45 mm, 19 °C and 4 hrs. (Figure 19 in appendix).
The activity of α-amylase was significantly higher (p ≤ 0.05) in maize grains harvested in 2011
than those in 2010 (Table 11). This difference may attribute to the dominant effect of
precipitation on enzyme activity during mature-harvest stage and prior to harvest of mature
grain as discussed before, in which leads to mitigate the positive effect of high temperature
as well as the sunshine duration on reduction α-amylase activity of kernels harvested in
2011. Other possibility could be that the accumulated effect of low temperature at dough-
ripe grains in 2010 was pronounced at mature-harvest stage (Beckles and Thitisaksakul
2014). It was found that low temperature 10 - 15 °C at dough-ripe stage (Osanai et al. 2005)
induces deep grain dormancy compared to 25 °C (Biddulph et al. 2008). The maximum,
average and minimum daily temperatures at dough stage in 2010 (18, 14 and 10 °C,
respectively) were lower than those in 2011 (21, 17and 13 °C, respectively). Therefore, maize
kernels from 2010 seem to have a deep dormancy in which prolonged to mature-harvest
stage, and hence reduction in enzyme activity.
All together, the cultivars and environments affected clearly α-amylase activity in
both experiments. The high α-amylase activity in mature-harvest stage in cv. Amaretto (see
Figure 5 in Exp.1) and in almost all maize cultivars harvested in 2011 (see Table 11 in Exp.2)
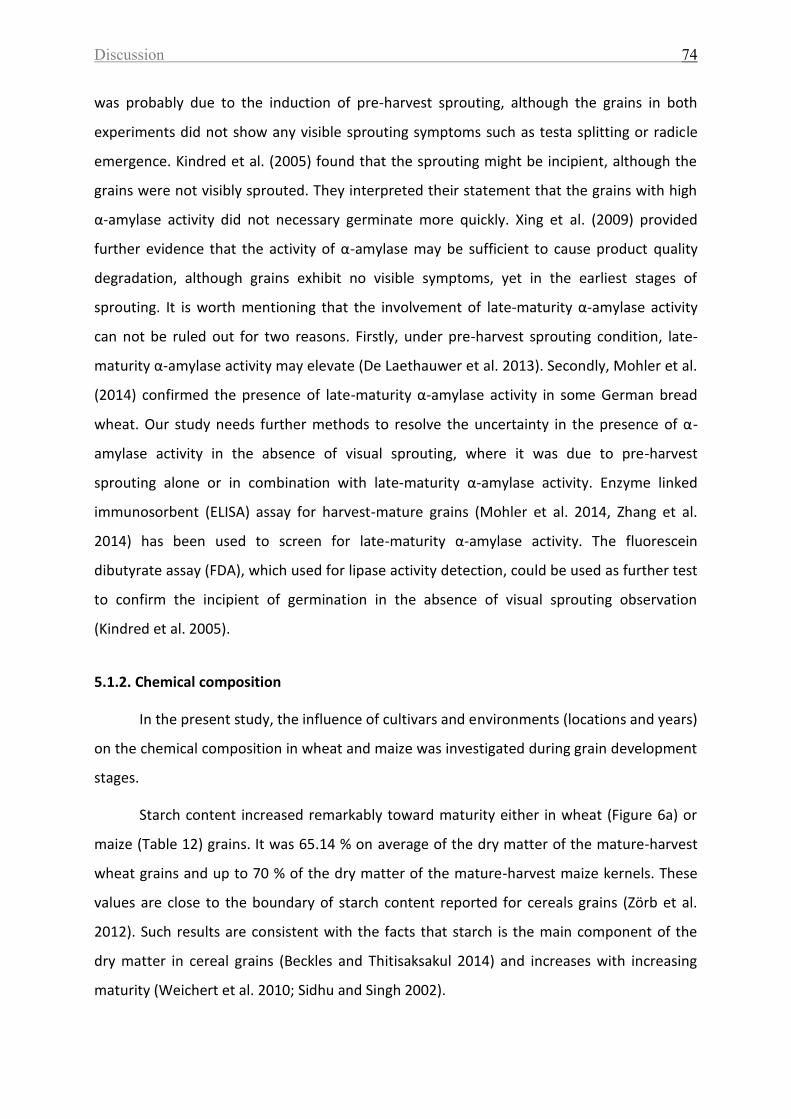
Discussion 74
was probably due to the induction of pre-harvest sprouting, although the grains in both
experiments did not show any visible sprouting symptoms such as testa splitting or radicle
emergence. Kindred et al. (2005) found that the sprouting might be incipient, although the
grains were not visibly sprouted. They interpreted their statement that the grains with high
α-amylase activity did not necessary germinate more quickly. Xing et al. (2009) provided
further evidence that the activity of α-amylase may be sufficient to cause product quality
degradation, although grains exhibit no visible symptoms, yet in the earliest stages of
sprouting. It is worth mentioning that the involvement of late-maturity α-amylase activity
can not be ruled out for two reasons. Firstly, under pre-harvest sprouting condition, late-
maturity α-amylase activity may elevate (De Laethauwer et al. 2013). Secondly, Mohler et al.
(2014) confirmed the presence of late-maturity α-amylase activity in some German bread
wheat. Our study needs further methods to resolve the uncertainty in the presence of α-
amylase activity in the absence of visual sprouting, where it was due to pre-harvest
sprouting alone or in combination with late-maturity α-amylase activity. Enzyme linked
immunosorbent (ELISA) assay for harvest-mature grains (Mohler et al. 2014, Zhang et al.
2014) has been used to screen for late-maturity α-amylase activity. The fluorescein
dibutyrate assay (FDA), which used for lipase activity detection, could be used as further test
to confirm the incipient of germination in the absence of visual sprouting observation
(Kindred et al. 2005).
5.1.2. Chemical composition
In the present study, the influence of cultivars and environments (locations and years)
on the chemical composition in wheat and maize was investigated during grain development
stages.
Starch content increased remarkably toward maturity either in wheat (Figure 6a) or
maize (Table 12) grains. It was 65.14 % on average of the dry matter of the mature-harvest
wheat grains and up to 70 % of the dry matter of the mature-harvest maize kernels. These
values are close to the boundary of starch content reported for cereals grains (Zörb et al.
2012). Such results are consistent with the facts that starch is the main component of the
dry matter in cereal grains (Beckles and Thitisaksakul 2014) and increases with increasing
maturity (Weichert et al. 2010; Sidhu and Singh 2002).
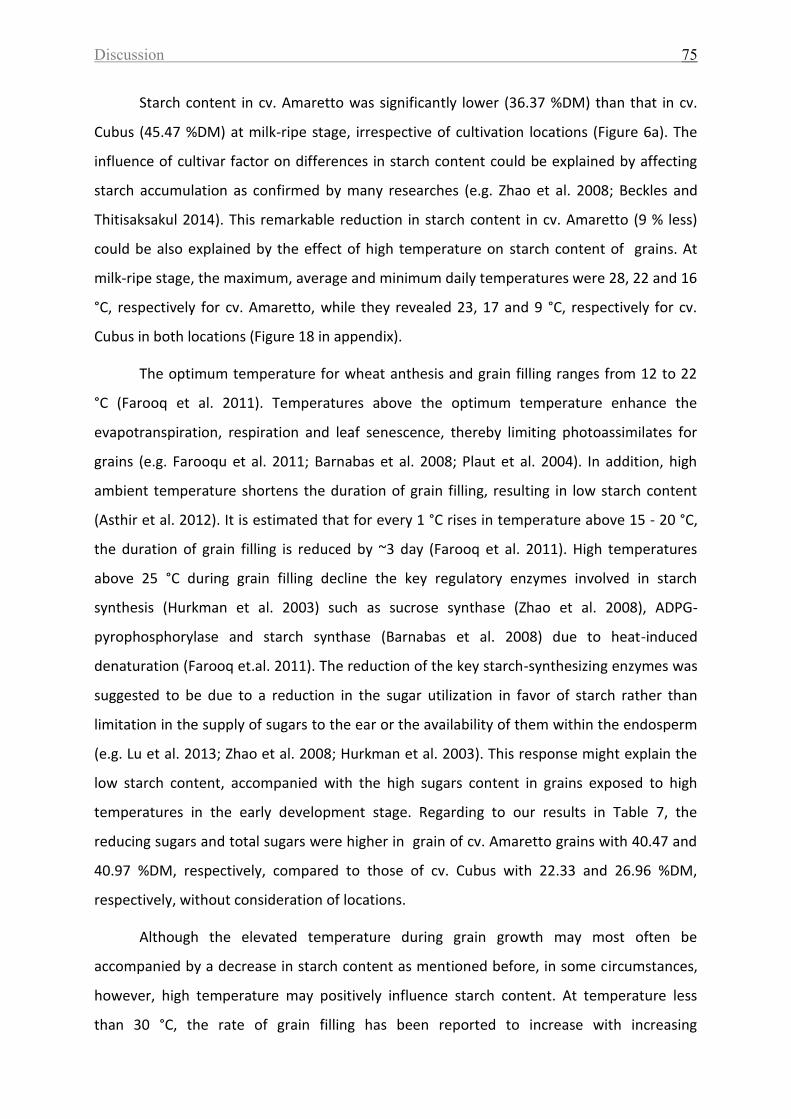
Discussion 75
Starch content in cv. Amaretto was significantly lower (36.37 %DM) than that in cv.
Cubus (45.47 %DM) at milk-ripe stage, irrespective of cultivation locations (Figure 6a). The
influence of cultivar factor on differences in starch content could be explained by affecting
starch accumulation as confirmed by many researches (e.g. Zhao et al. 2008; Beckles and
Thitisaksakul 2014). This remarkable reduction in starch content in cv. Amaretto (9 % less)
could be also explained by the effect of high temperature on starch content of grains. At
milk-ripe stage, the maximum, average and minimum daily temperatures were 28, 22 and 16
°C, respectively for cv. Amaretto, while they revealed 23, 17 and 9 °C, respectively for cv.
Cubus in both locations (Figure 18 in appendix).
The optimum temperature for wheat anthesis and grain filling ranges from 12 to 22
°C (Farooq et al. 2011). Temperatures above the optimum temperature enhance the
evapotranspiration, respiration and leaf senescence, thereby limiting photoassimilates for
grains (e.g. Farooqu et al. 2011; Barnabas et al. 2008; Plaut et al. 2004). In addition, high
ambient temperature shortens the duration of grain filling, resulting in low starch content
(Asthir et al. 2012). It is estimated that for every 1 °C rises in temperature above 15 - 20 °C,
the duration of grain filling is reduced by ~3 day (Farooq et al. 2011). High temperatures
above 25 °C during grain filling decline the key regulatory enzymes involved in starch
synthesis (Hurkman et al. 2003) such as sucrose synthase (Zhao et al. 2008), ADPG-
pyrophosphorylase and starch synthase (Barnabas et al. 2008) due to heat-induced
denaturation (Farooq et.al. 2011). The reduction of the key starch-synthesizing enzymes was
suggested to be due to a reduction in the sugar utilization in favor of starch rather than
limitation in the supply of sugars to the ear or the availability of them within the endosperm
(e.g. Lu et al. 2013; Zhao et al. 2008; Hurkman et al. 2003). This response might explain the
low starch content, accompanied with the high sugars content in grains exposed to high
temperatures in the early development stage. Regarding to our results in Table 7, the
reducing sugars and total sugars were higher in grain of cv. Amaretto grains with 40.47 and
40.97 %DM, respectively, compared to those of cv. Cubus with 22.33 and 26.96 %DM,
respectively, without consideration of locations.
Although the elevated temperature during grain growth may most often be
accompanied by a decrease in starch content as mentioned before, in some circumstances,
however, high temperature may positively influence starch content. At temperature less
than 30 °C, the rate of grain filling has been reported to increase with increasing
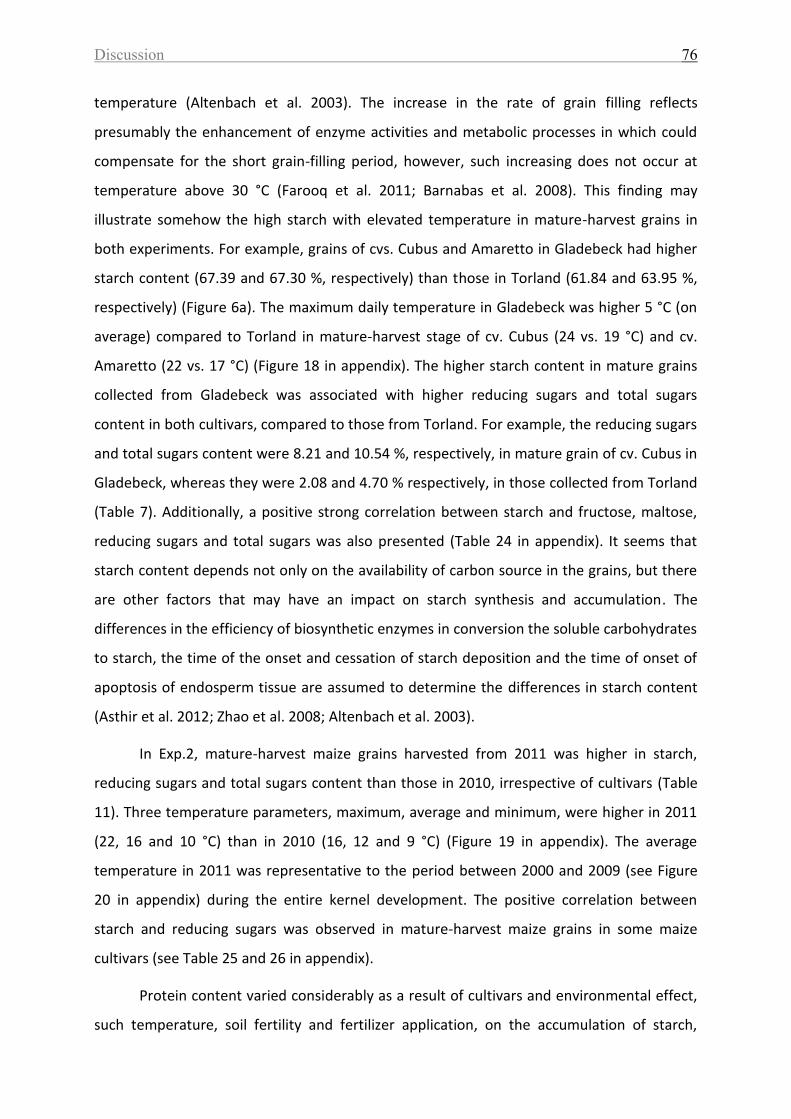
Discussion 76
temperature (Altenbach et al. 2003). The increase in the rate of grain filling reflects
presumably the enhancement of enzyme activities and metabolic processes in which could
compensate for the short grain-filling period, however, such increasing does not occur at
temperature above 30 °C (Farooq et al. 2011; Barnabas et al. 2008). This finding may
illustrate somehow the high starch with elevated temperature in mature-harvest grains in
both experiments. For example, grains of cvs. Cubus and Amaretto in Gladebeck had higher
starch content (67.39 and 67.30 %, respectively) than those in Torland (61.84 and 63.95 %,
respectively) (Figure 6a). The maximum daily temperature in Gladebeck was higher 5 °C (on
average) compared to Torland in mature-harvest stage of cv. Cubus (24 vs. 19 °C) and cv.
Amaretto (22 vs. 17 °C) (Figure 18 in appendix). The higher starch content in mature grains
collected from Gladebeck was associated with higher reducing sugars and total sugars
content in both cultivars, compared to those from Torland. For example, the reducing sugars
and total sugars content were 8.21 and 10.54 %, respectively, in mature grain of cv. Cubus in
Gladebeck, whereas they were 2.08 and 4.70 % respectively, in those collected from Torland
(Table 7). Additionally, a positive strong correlation between starch and fructose, maltose,
reducing sugars and total sugars was also presented (Table 24 in appendix). It seems that
starch content depends not only on the availability of carbon source in the grains, but there
are other factors that may have an impact on starch synthesis and accumulation. The
differences in the efficiency of biosynthetic enzymes in conversion the soluble carbohydrates
to starch, the time of the onset and cessation of starch deposition and the time of onset of
apoptosis of endosperm tissue are assumed to determine the differences in starch content
(Asthir et al. 2012; Zhao et al. 2008; Altenbach et al. 2003).
In Exp.2, mature-harvest maize grains harvested from 2011 was higher in starch,
reducing sugars and total sugars content than those in 2010, irrespective of cultivars (Table
11). Three temperature parameters, maximum, average and minimum, were higher in 2011
(22, 16 and 10 °C) than in 2010 (16, 12 and 9 °C) (Figure 19 in appendix). The average
temperature in 2011 was representative to the period between 2000 and 2009 (see Figure
20 in appendix) during the entire kernel development. The positive correlation between
starch and reducing sugars was observed in mature-harvest maize grains in some maize
cultivars (see Table 25 and 26 in appendix).
Protein content varied considerably as a result of cultivars and environmental effect,
such temperature, soil fertility and fertilizer application, on the accumulation of starch,
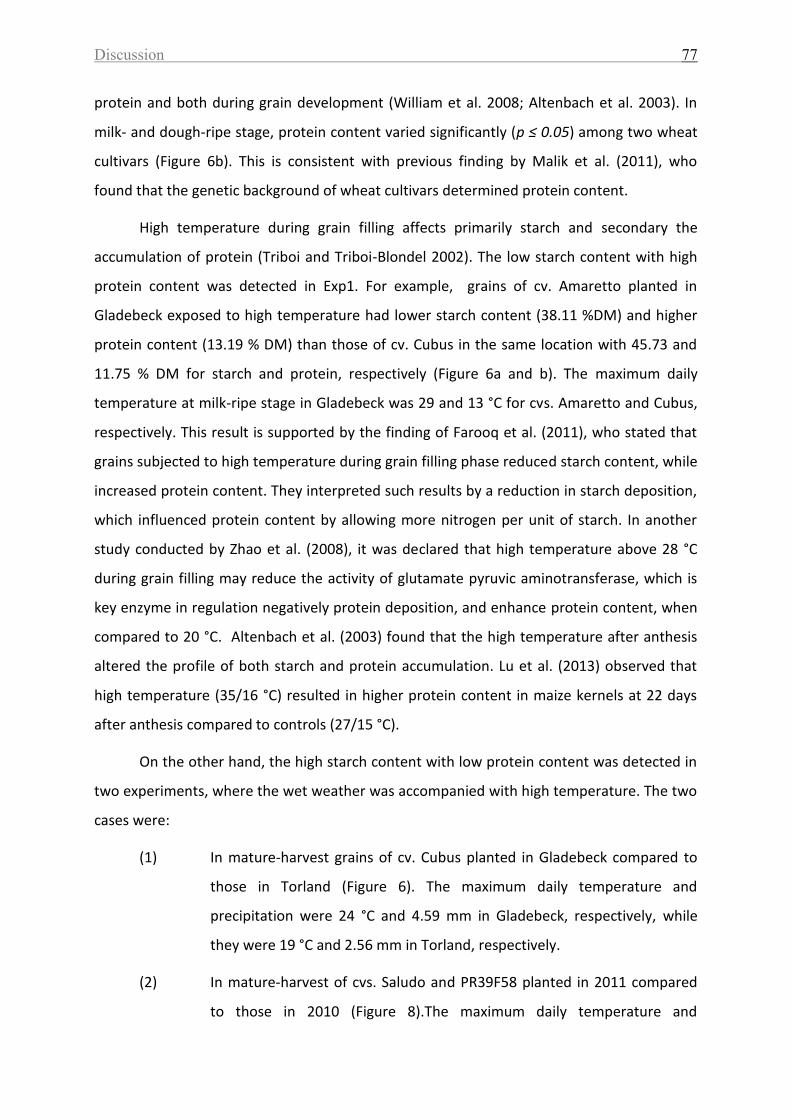
Discussion 77
protein and both during grain development (William et al. 2008; Altenbach et al. 2003). In
milk- and dough-ripe stage, protein content varied significantly (p ≤ 0.05) among two wheat
cultivars (Figure 6b). This is consistent with previous finding by Malik et al. (2011), who
found that the genetic background of wheat cultivars determined protein content.
High temperature during grain filling affects primarily starch and secondary the
accumulation of protein (Triboi and Triboi-Blondel 2002). The low starch content with high
protein content was detected in Exp1. For example, grains of cv. Amaretto planted in
Gladebeck exposed to high temperature had lower starch content (38.11 %DM) and higher
protein content (13.19 % DM) than those of cv. Cubus in the same location with 45.73 and
11.75 % DM for starch and protein, respectively (Figure 6a and b). The maximum daily
temperature at milk-ripe stage in Gladebeck was 29 and 13 °C for cvs. Amaretto and Cubus,
respectively. This result is supported by the finding of Farooq et al. (2011), who stated that
grains subjected to high temperature during grain filling phase reduced starch content, while
increased protein content. They interpreted such results by a reduction in starch deposition,
which influenced protein content by allowing more nitrogen per unit of starch. In another
study conducted by Zhao et al. (2008), it was declared that high temperature above 28 °C
during grain filling may reduce the activity of glutamate pyruvic aminotransferase, which is
key enzyme in regulation negatively protein deposition, and enhance protein content, when
compared to 20 °C. Altenbach et al. (2003) found that the high temperature after anthesis
altered the profile of both starch and protein accumulation. Lu et al. (2013) observed that
high temperature (35/16 °C) resulted in higher protein content in maize kernels at 22 days
after anthesis compared to controls (27/15 °C).
On the other hand, the high starch content with low protein content was detected in
two experiments, where the wet weather was accompanied with high temperature. The two
cases were:
(1) In mature-harvest grains of cv. Cubus planted in Gladebeck compared to
those in Torland (Figure 6). The maximum daily temperature and
precipitation were 24 °C and 4.59 mm in Gladebeck, respectively, while
they were 19 °C and 2.56 mm in Torland, respectively.
(2) In mature-harvest of cvs. Saludo and PR39F58 planted in 2011 compared
to those in 2010 (Figure 8).The maximum daily temperature and
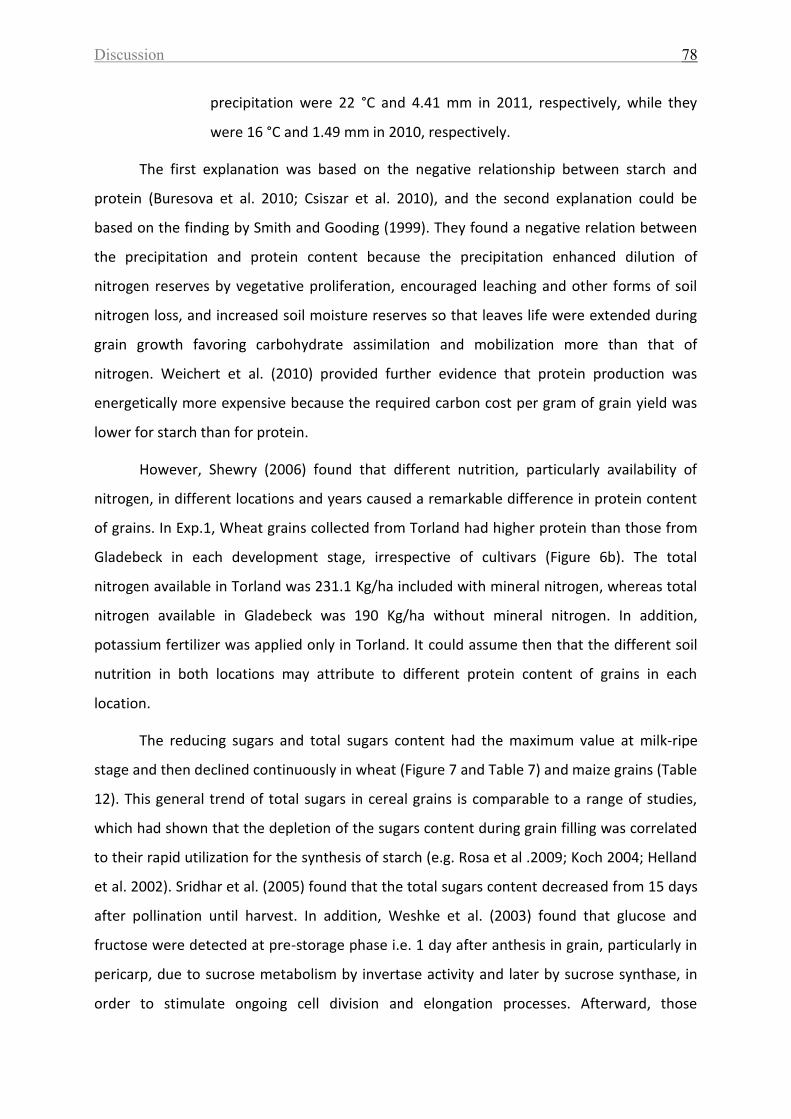
Discussion 78
precipitation were 22 °C and 4.41 mm in 2011, respectively, while they
were 16 °C and 1.49 mm in 2010, respectively.
The first explanation was based on the negative relationship between starch and
protein (Buresova et al. 2010; Csiszar et al. 2010), and the second explanation could be
based on the finding by Smith and Gooding (1999). They found a negative relation between
the precipitation and protein content because the precipitation enhanced dilution of
nitrogen reserves by vegetative proliferation, encouraged leaching and other forms of soil
nitrogen loss, and increased soil moisture reserves so that leaves life were extended during
grain growth favoring carbohydrate assimilation and mobilization more than that of
nitrogen. Weichert et al. (2010) provided further evidence that protein production was
energetically more expensive because the required carbon cost per gram of grain yield was
lower for starch than for protein.
However, Shewry (2006) found that different nutrition, particularly availability of
nitrogen, in different locations and years caused a remarkable difference in protein content
of grains. In Exp.1, Wheat grains collected from Torland had higher protein than those from
Gladebeck in each development stage, irrespective of cultivars (Figure 6b). The total
nitrogen available in Torland was 231.1 Kg/ha included with mineral nitrogen, whereas total
nitrogen available in Gladebeck was 190 Kg/ha without mineral nitrogen. In addition,
potassium fertilizer was applied only in Torland. It could assume then that the different soil
nutrition in both locations may attribute to different protein content of grains in each
location.
The reducing sugars and total sugars content had the maximum value at milk-ripe
stage and then declined continuously in wheat (Figure 7 and Table 7) and maize grains (Table
12). This general trend of total sugars in cereal grains is comparable to a range of studies,
which had shown that the depletion of the sugars content during grain filling was correlated
to their rapid utilization for the synthesis of starch (e.g. Rosa et al .2009; Koch 2004; Helland
et al. 2002). Sridhar et al. (2005) found that the total sugars content decreased from 15 days
after pollination until harvest. In addition, Weshke et al. (2003) found that glucose and
fructose were detected at pre-storage phase i.e. 1 day after anthesis in grain, particularly in
pericarp, due to sucrose metabolism by invertase activity and later by sucrose synthase, in
order to stimulate ongoing cell division and elongation processes. Afterward, those
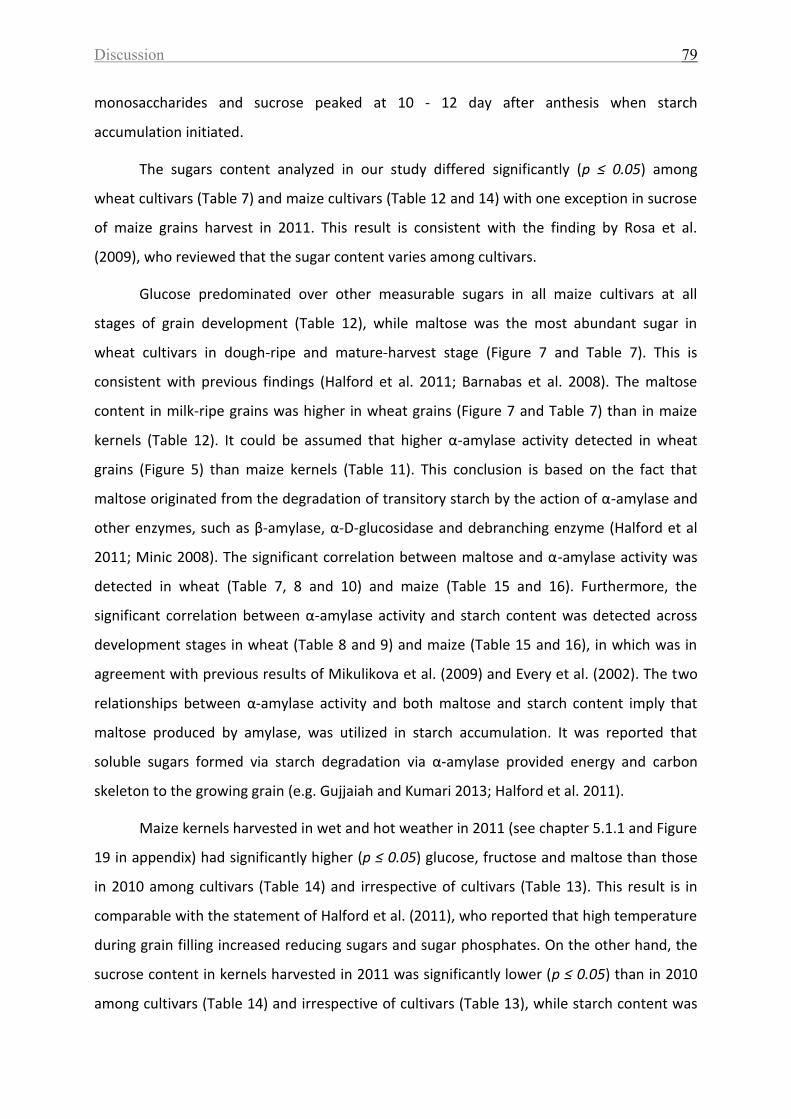
Discussion 79
monosaccharides and sucrose peaked at 10 - 12 day after anthesis when starch
accumulation initiated.
The sugars content analyzed in our study differed significantly (p ≤ 0.05) among
wheat cultivars (Table 7) and maize cultivars (Table 12 and 14) with one exception in sucrose
of maize grains harvest in 2011. This result is consistent with the finding by Rosa et al.
(2009), who reviewed that the sugar content varies among cultivars.
Glucose predominated over other measurable sugars in all maize cultivars at all
stages of grain development (Table 12), while maltose was the most abundant sugar in
wheat cultivars in dough-ripe and mature-harvest stage (Figure 7 and Table 7). This is
consistent with previous findings (Halford et al. 2011; Barnabas et al. 2008). The maltose
content in milk-ripe grains was higher in wheat grains (Figure 7 and Table 7) than in maize
kernels (Table 12). It could be assumed that higher α-amylase activity detected in wheat
grains (Figure 5) than maize kernels (Table 11). This conclusion is based on the fact that
maltose originated from the degradation of transitory starch by the action of α-amylase and
other enzymes, such as β-amylase, α-D-glucosidase and debranching enzyme (Halford et al
2011; Minic 2008). The significant correlation between maltose and α-amylase activity was
detected in wheat (Table 7, 8 and 10) and maize (Table 15 and 16). Furthermore, the
significant correlation between α-amylase activity and starch content was detected across
development stages in wheat (Table 8 and 9) and maize (Table 15 and 16), in which was in
agreement with previous results of Mikulikova et al. (2009) and Every et al. (2002). The two
relationships between α-amylase activity and both maltose and starch content imply that
maltose produced by amylase, was utilized in starch accumulation. It was reported that
soluble sugars formed via starch degradation via α-amylase provided energy and carbon
skeleton to the growing grain (e.g. Gujjaiah and Kumari 2013; Halford et al. 2011).
Maize kernels harvested in wet and hot weather in 2011 (see chapter 5.1.1 and Figure
19 in appendix) had significantly higher (p ≤ 0.05) glucose, fructose and maltose than those
in 2010 among cultivars (Table 14) and irrespective of cultivars (Table 13). This result is in
comparable with the statement of Halford et al. (2011), who reported that high temperature
during grain filling increased reducing sugars and sugar phosphates. On the other hand, the
sucrose content in kernels harvested in 2011 was significantly lower (p ≤ 0.05) than in 2010
among cultivars (Table 14) and irrespective of cultivars (Table 13), while starch content was
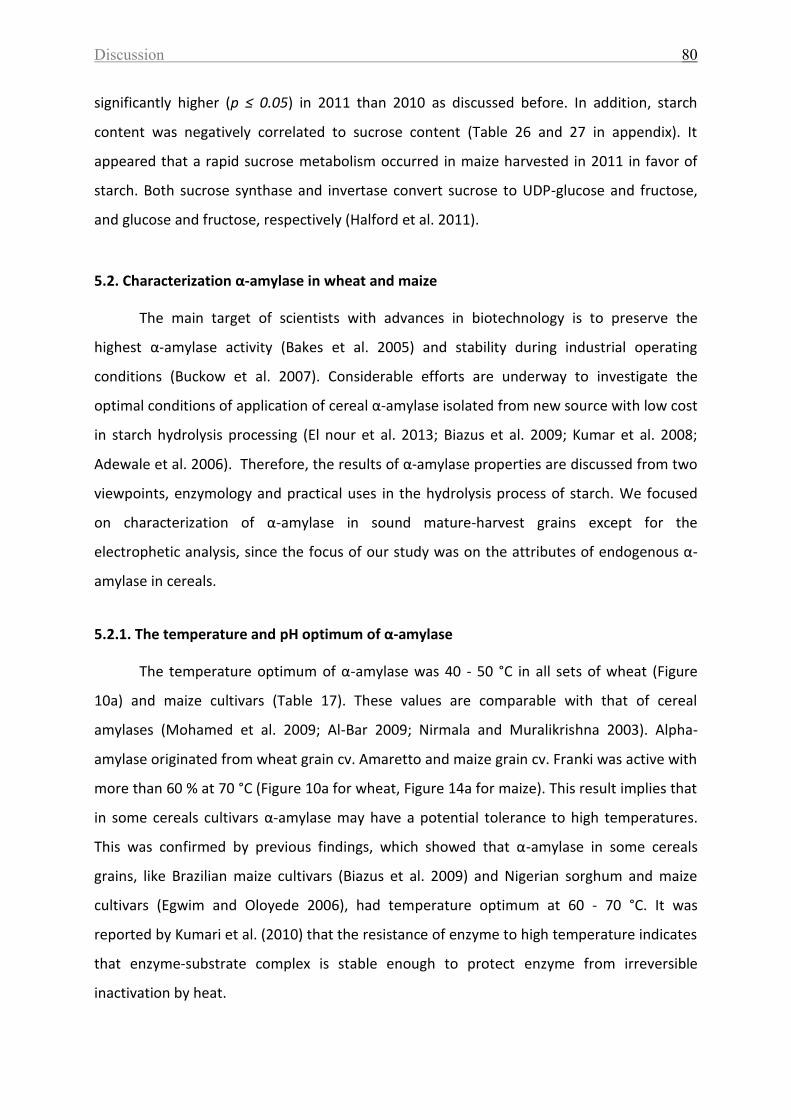
Discussion 80
significantly higher (p ≤ 0.05) in 2011 than 2010 as discussed before. In addition, starch
content was negatively correlated to sucrose content (Table 26 and 27 in appendix). It
appeared that a rapid sucrose metabolism occurred in maize harvested in 2011 in favor of
starch. Both sucrose synthase and invertase convert sucrose to UDP-glucose and fructose,
and glucose and fructose, respectively (Halford et al. 2011).
5.2. Characterization α-amylase in wheat and maize
The main target of scientists with advances in biotechnology is to preserve the
highest α-amylase activity (Bakes et al. 2005) and stability during industrial operating
conditions (Buckow et al. 2007). Considerable efforts are underway to investigate the
optimal conditions of application of cereal α-amylase isolated from new source with low cost
in starch hydrolysis processing (El nour et al. 2013; Biazus et al. 2009; Kumar et al. 2008;
Adewale et al. 2006). Therefore, the results of α-amylase properties are discussed from two
viewpoints, enzymology and practical uses in the hydrolysis process of starch. We focused
on characterization of α-amylase in sound mature-harvest grains except for the
electrophetic analysis, since the focus of our study was on the attributes of endogenous α-
amylase in cereals.
5.2.1. The temperature and pH optimum of α-amylase
The temperature optimum of α-amylase was 40 - 50 °C in all sets of wheat (Figure
10a) and maize cultivars (Table 17). These values are comparable with that of cereal
amylases (Mohamed et al. 2009; Al-Bar 2009; Nirmala and Muralikrishna 2003). Alpha-
amylase originated from wheat grain cv. Amaretto and maize grain cv. Franki was active with
more than 60 % at 70 °C (Figure 10a for wheat, Figure 14a for maize). This result implies that
in some cereals cultivars α-amylase may have a potential tolerance to high temperatures.
This was confirmed by previous findings, which showed that α-amylase in some cereals
grains, like Brazilian maize cultivars (Biazus et al. 2009) and Nigerian sorghum and maize
cultivars (Egwim and Oloyede 2006), had temperature optimum at 60 - 70 °C. It was
reported by Kumari et al. (2010) that the resistance of enzyme to high temperature indicates
that enzyme-substrate complex is stable enough to protect enzyme from irreversible
inactivation by heat.
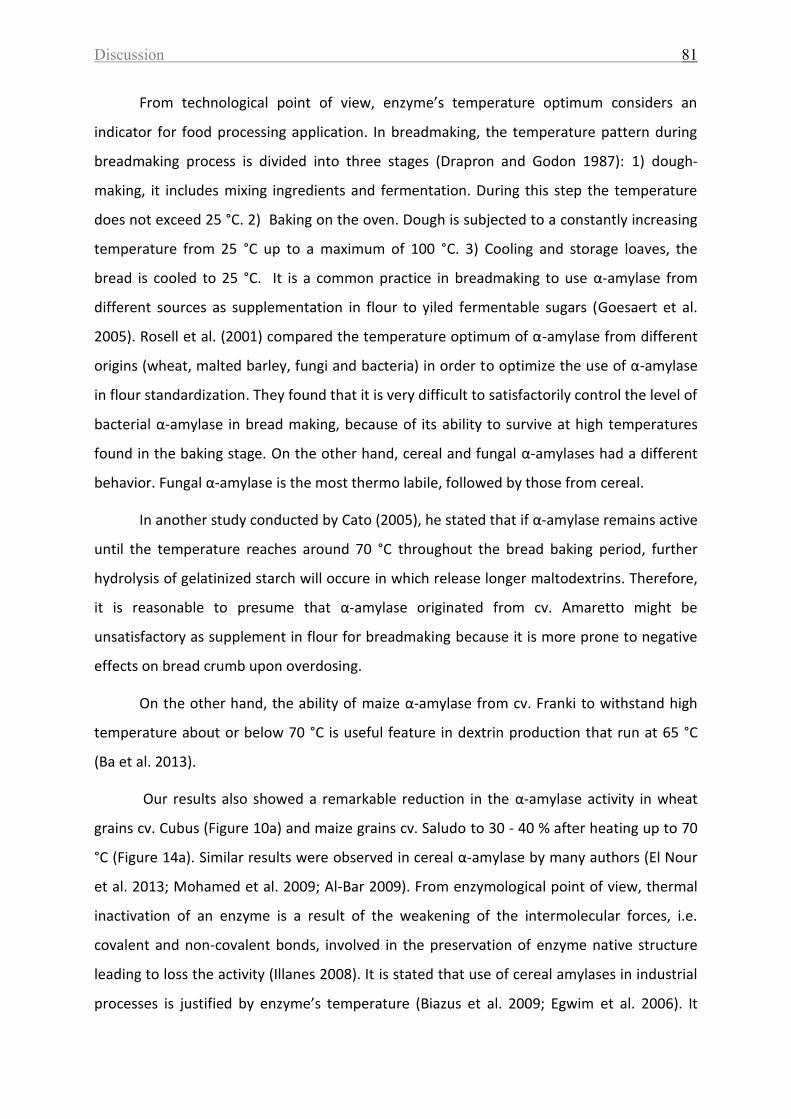
Discussion 81
From technological point of view, enzyme’s temperature optimum considers an
indicator for food processing application. In breadmaking, the temperature pattern during
breadmaking process is divided into three stages (Drapron and Godon 1987): 1) dough-
making, it includes mixing ingredients and fermentation. During this step the temperature
does not exceed 25 °C. 2) Baking on the oven. Dough is subjected to a constantly increasing
temperature from 25 °C up to a maximum of 100 °C. 3) Cooling and storage loaves, the
bread is cooled to 25 °C. It is a common practice in breadmaking to use α-amylase from
different sources as supplementation in flour to yiled fermentable sugars (Goesaert et al.
2005). Rosell et al. (2001) compared the temperature optimum of α-amylase from different
origins (wheat, malted barley, fungi and bacteria) in order to optimize the use of α-amylase
in flour standardization. They found that it is very difficult to satisfactorily control the level of
bacterial α-amylase in bread making, because of its ability to survive at high temperatures
found in the baking stage. On the other hand, cereal and fungal α-amylases had a different
behavior. Fungal α-amylase is the most thermo labile, followed by those from cereal.
In another study conducted by Cato (2005), he stated that if α-amylase remains active
until the temperature reaches around 70 °C throughout the bread baking period, further
hydrolysis of gelatinized starch will occure in which release longer maltodextrins. Therefore,
it is reasonable to presume that α-amylase originated from cv. Amaretto might be
unsatisfactory as supplement in flour for breadmaking because it is more prone to negative
effects on bread crumb upon overdosing.
On the other hand, the ability of maize α-amylase from cv. Franki to withstand high
temperature about or below 70 °C is useful feature in dextrin production that run at 65 °C
(Ba et al. 2013).
Our results also showed a remarkable reduction in the α-amylase activity in wheat
grains cv. Cubus (Figure 10a) and maize grains cv. Saludo to 30 - 40 % after heating up to 70
°C (Figure 14a). Similar results were observed in cereal α-amylase by many authors (El Nour
et al. 2013; Mohamed et al. 2009; Al-Bar 2009). From enzymological point of view, thermal
inactivation of an enzyme is a result of the weakening of the intermolecular forces, i.e.
covalent and non-covalent bonds, involved in the preservation of enzyme native structure
leading to loss the activity (Illanes 2008). It is stated that use of cereal amylases in industrial
processes is justified by enzyme’s temperature (Biazus et al. 2009; Egwim et al. 2006). It
Discussion 82
implies therefore that α-amylase originated from cvs. Cubus and Saludo may useful in
starch-hydrolyzing industries that run at lower temperature than 70 °C because of their
inactivation at high temperature 70 °C.
The pH range of the maximal activity of α-amylase was within 4 and 6 in both wheat
(Figure 10b) and maize (Table 17 and Figure 14b). Similar results have been reported for α-
amylase from wheat (Mohamed et al. 2009), maize, sorghum, (Egwim and Oloyede 2006)
and barley (Al-Bar 2009). From food technological point of view, the pH in most of food
applications can not be readily adjusted to the pH optimum of α-amylase. Therefore, the
origin of enzyme has to be chosen on the basis of its activity at the natural food pH (Curvelo
et al. 2008; Cato 2005). For instance, natural pH of starch surry is general around 4.5
(Sivaramakrish 2006).
Egwim and Oloyede (2006) tested the suitability of α-amylase from different
sprouting Nigerian cereals (maize, acha, rice and sorghum) in starch hydrolysis processes
based on the pH value. They found that the four cereals exhibited broad pH optima of α-
amylase, ranging from 4 to 6, which was in agreement with the industrial practice. In
addition, Curvelo et al. (2008) reported the optimal conditions to produce fermentable syrup
from manioc starch by maize amylase. Their work showed that the maize amylase had the
optimum pH values between 4.5 - 6.5 with optimum temperatures between 50 - 90 °C. From
our present study, we may suggest to involve α-amylases from investigated maize cultivars
in the hydrolysis process of starch by food industries because of thier broad pH optimum
between 4 and 6.
Sometimes the activity of α-amylase that presents naturally in flour is not suffient to
produce good bread volume and quality. Therefore, flour is routinely supplemented with
exogenous amylases to optimize the amylase activity. Commercial amylase can be obtained
from fungal, cereal or bacterial sources (Goesaert et al. 2005). Studies carried out by Rosell
et al. (2001) have tested the activity of amylase from those commercial sources with the
process condition in breadmaking. They found that the pH optimum of cereal α-amylase at
4.5 - 6.0 was appropriate to use this source of enzyme in flour standardization. We may
suggest using them as source of amylases in flour standardization for breadmaking owing to
the broad optimum pH of their amylases.
Discussion 83
On the other hand, it was reported that irreversible inactivation of cereal α-amylase
occurred below pH 4.5 (Brena et al. 1996) resulted in a sharp reduction in the activity (Al-Bar
2009; Nirmala and Muralikrishna 2003). Comparable results were also obtained in our study
at pH 5 and 4 in wheat and maize amylases, respectively (Figure 10b for wheat and 14b for
maize). It was stated that the pH profile and optimum of enzyme activity may differ from
different cultivars (Mohamed et al. 2009; Kumar et al. 2005). Generally, an increase or
decrease of the pH outside the optimal range declines the α-amylase activity (Usha et al.
2011). From enzymology point of view, this dependency may arise from several factors as
mentioned by Panesar et al. (2010) and Belitz et al. (2009). First, a change in pH value may
weaken the intermolecular forces stabilizing enzyme native structure leading to loss the
activity. Second, it may influence the ionization degree in enzyme and its substrate in which
alter the propensity of the two molecules to combine or decompose enzyme-substrate
complex. Third, it may influence the the ionization of amino acid residue in the active site of
enzyme which results in alteration of the breakage of enzyme-substrate complex to product
(see enzyme rate equation No.1 in section 2.3.7).
Taking together, the optimum temperature and pH of α-amylase activity in both
experiments indicate the favorable conditions in which the maximum numbers of the active
site in enzyme are active (Egwim and Oloyede 2006). However, differences in the effect of
temperature and pH on the same enzyme activity between several studies may contribute to
differences in purification procedures, assay duration, different buffers and stabilizing agents
used (e.g. Daniel et al. 2008; Buckow et al. 2007; Kumar et al. 2005).
5.2.2. The temperature and pH stability of α-amylase
The temperature stability of α-amylase, in which retained its native configuration as
well the catalytic capacity, was at 40 - 50 °C in wheat (Figure 10c) and maize (Table 17 and
Figure 14c) grains. This stability is in agreement with other studies which found that cereal
α-amylase is generally stable up to 50 °C (Mohamed et al. 2009; Al-Bar 2009), but exceptions
exist on both sides of the maximal temperature stability of enzyme. For instance, α-amylase
was inactivated more or less completely at 70 - 90 °C in different cereals grains (Adefila et al.
2012; Mohamed et al. 2009). Sinha (2004) pointed out that beyond 45 °C enzyme get
denatured and loose its activity due to change in three-dimension structure of protein.
Daniel et al. (2008) reported that the temperature affects on the equilibrium position
Discussion 84
between active and inactive forms of enzyme’s protein. Evidence was supported by Gimbi
and Kitabatake (2002), who found in their work that thermosatbility of α-amylase isolated
from finger millet had an irregular pattern of changes, either increased, decreased and
increased or remained constant, at 40-70 °C for 20 min. They interpreted to denaturation
(inactivation) and renaturation (reactivation) of proteins during heating and cooling,
respectively.Regarding to our study, we observed differences in enzyme response to
temperature above the maximal temperature stability i.e. thermostable vs. thermolabile,
among different cultivars within each cereal grains (Figure 10c for wheat and 14c for maize).
From industrial point of view, heat stability of α-amylase is a crucial factor for the use
in several applications (Sivaramakrishnan et al. 2006). This is based on the fact that amylases
are exposed to harsh conditions for purposes industrial such as high temperature and
pressure to improve productivity and reduce the risk of microbial contamination (Kumar
2008; Buckow et al. 2007). Hence, it is necessary to have throughout knowledge of thermal
stability of enzyme under which is going to be added (Fernandes 2010).
Study carried out by Kumar et al. (2005) had shown that the temperature stability of
α-amylase from malted sorghum was higher compared to those from barley and finger millet
at 70 °C. They concluded that sorghum’s amylase from malted grains is a suitable source,
among other cereal sources, for incorporation in supplementary foods that is reconstituted
with hot milk or/and water for consumption. In brewing industry, three different
temperatures are applied during adjunct mashing process as following (Young 2014): 1) The
first hold is at 40 - 50 °C, 2) The second hold is at 63 - 68 °C and 3) the last hold of mash is
raised at 70 - 90 °C. Adewale et al. (2006) reported that sorghum grains was better choice
compared to maize and millet grains for maltsters in order to produce beer and other
beverages in developing countries. This conclusion is most likely due to the superior of
sorghum α-amylase properties compared to maize and millet amylases. One of these
properties was the thermal stability of α-amylase during mashing process conducted at 50
°C. Among the three cereal amylases, sorghum amylase was found to be the most
thermostable.
Regarding to our results, it seems that maize α-amylases isolated from cvs. Benecia,
Esbomabstic, Franki and PR39F58 are suitable in starch hydrolysis industry because of thier
thermal stability ≥ 50 °C. Mohamed et al. (2009) found that wheat amylase from cv. Balady
Discussion 85
was stable up to 40 °C. They concluded that this property of wheat amylase with
combination of others i.e. pH and temperature optimum, activators etc. meet the
prerequisites need for food industry. Therefore, amylase of tested wheat cultivars has a
good potential for the use in the food industry.
On the other hand, studies carried out by several authors (e.g. Goggin and Powles
2012; El nour et al. 2010; Muralikrishna and Nirmala 2005) claimed that the heating of crude
extraction at 70 °C for 15 min was recommended for purification of α-amylase in order to
inactivate other starch-hydrolyzing enzymes. Based on our observations, α-amylase from
wheat cv. Amaretto and maize cv. Franki was more stable at 70 °C for 30 min (with 60 % of
residual activity) compared to that from wheat cv. Cubus and maize cv. Saludo (with 20 - 35
% of residual activity) (Figure 10c for wheat and 14c for maize). Therefore, caution must be
taken before applied heating at 70 °C for α-amylase purification procedures. We suggest
conducting preliminarily experiments on residua activity of α-amylase at 70 °C in different
time incubation before decide such step. In our study, this procedure was applied only in the
extraction of α-amylase from milk-ripe grains used in electrophetic analysis (see section
3.5.2. and 3.5.5. for details).
The pH stability of α-amylase was 6 for both wheat (Figure 10d) and maize (Table 17
and Figure 14d). It conforms with the results published by Muralikrishna and Nirmala (2005),
who found the maximal pH stability of cereal α-amylases, was between 5.5 and 8.0. It was
reported that the α-amylase was inactive in extreme acidic condition, indicating acid labile
nature of cereal α-amylases (Usha et al. 2011).
The presence of excessive α-amylase activity in flour from sprouted grains is an
important problem in European countries, particularly in wheat grown regions (Dencic
2013). Several solutions for this problem were suggested. The acid treatment for flour
containing high α-amylase activity was suggested by Kruger (1989) in order to ameliorate the
deleterious effects of high α-amylase in bread quality. Regarding to wheat experiment, α-
amylase from both wheat cultivars was the most labile at pH 4 (Figure 10d). These results
imply that we may acidify flour from cvs. Amaretto and Cubus in case of a minor sprouting
damage in those bread wheat cultivars.
Taking together, the optimal temperature and pH stability of α-amylase in both
experiments indicate a specefic conditions to retain the original enzyme activity (Usha et al.
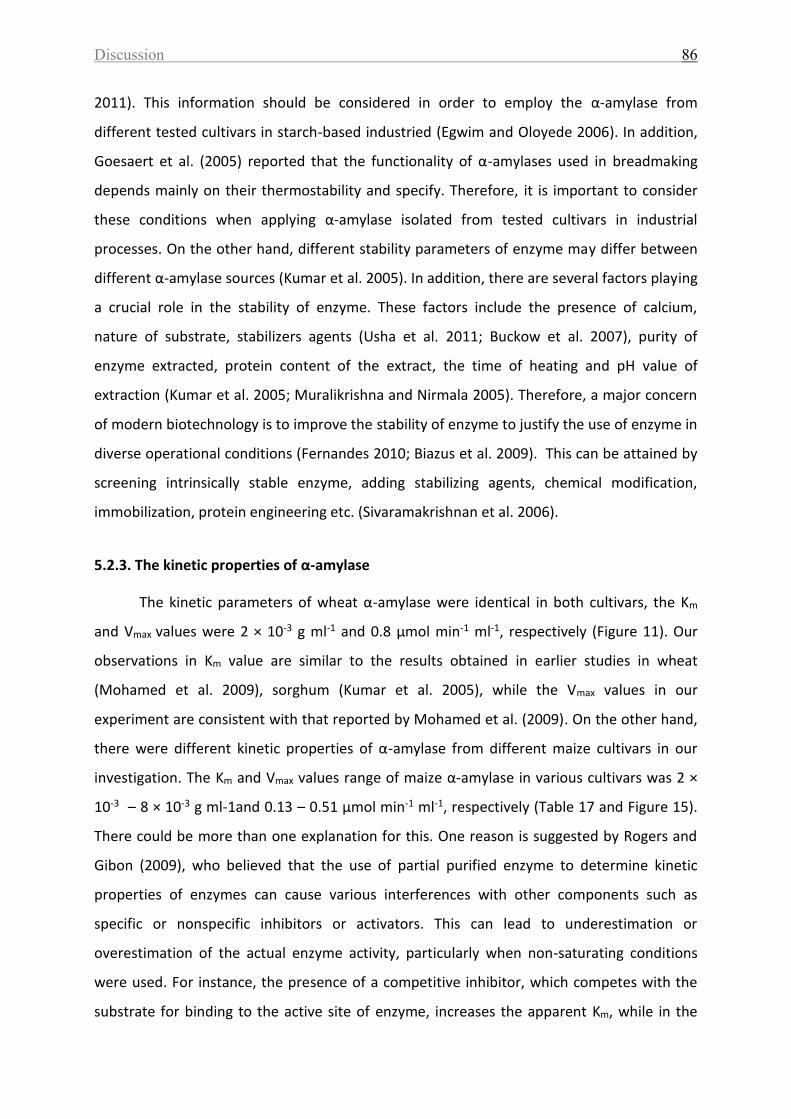
Discussion 86
2011). This information should be considered in order to employ the α-amylase from
different tested cultivars in starch-based industried (Egwim and Oloyede 2006). In addition,
Goesaert et al. (2005) reported that the functionality of α-amylases used in breadmaking
depends mainly on their thermostability and specify. Therefore, it is important to consider
these conditions when applying α-amylase isolated from tested cultivars in industrial
processes. On the other hand, different stability parameters of enzyme may differ between
different α-amylase sources (Kumar et al. 2005). In addition, there are several factors playing
a crucial role in the stability of enzyme. These factors include the presence of calcium,
nature of substrate, stabilizers agents (Usha et al. 2011; Buckow et al. 2007), purity of
enzyme extracted, protein content of the extract, the time of heating and pH value of
extraction (Kumar et al. 2005; Muralikrishna and Nirmala 2005). Therefore, a major concern
of modern biotechnology is to improve the stability of enzyme to justify the use of enzyme in
diverse operational conditions (Fernandes 2010; Biazus et al. 2009). This can be attained by
screening intrinsically stable enzyme, adding stabilizing agents, chemical modification,
immobilization, protein engineering etc. (Sivaramakrishnan et al. 2006).
5.2.3. The kinetic properties of α-amylase
The kinetic parameters of wheat α-amylase were identical in both cultivars, the Km
and Vmax values were 2 × 10⁻³ g ml-1 and 0.8 μmol min-1 ml-1, respectively (Figure 11). Our
observations in Km value are similar to the results obtained in earlier studies in wheat
(Mohamed et al. 2009), sorghum (Kumar et al. 2005), while the Vmax values in our
experiment are consistent with that reported by Mohamed et al. (2009). On the other hand,
there were different kinetic properties of α-amylase from different maize cultivars in our
investigation. The Km and Vmax values range of maize α-amylase in various cultivars was 2 ×
10-3 – 8 × 10⁻³ g ml-1and 0.13 – 0.51 μmol min-1 ml-1, respectively (Table 17 and Figure 15).
There could be more than one explanation for this. One reason is suggested by Rogers and
Gibon (2009), who believed that the use of partial purified enzyme to determine kinetic
properties of enzymes can cause various interferences with other components such as
specific or nonspecific inhibitors or activators. This can lead to underestimation or
overestimation of the actual enzyme activity, particularly when non-saturating conditions
were used. For instance, the presence of a competitive inhibitor, which competes with the
substrate for binding to the active site of enzyme, increases the apparent Km, while in the
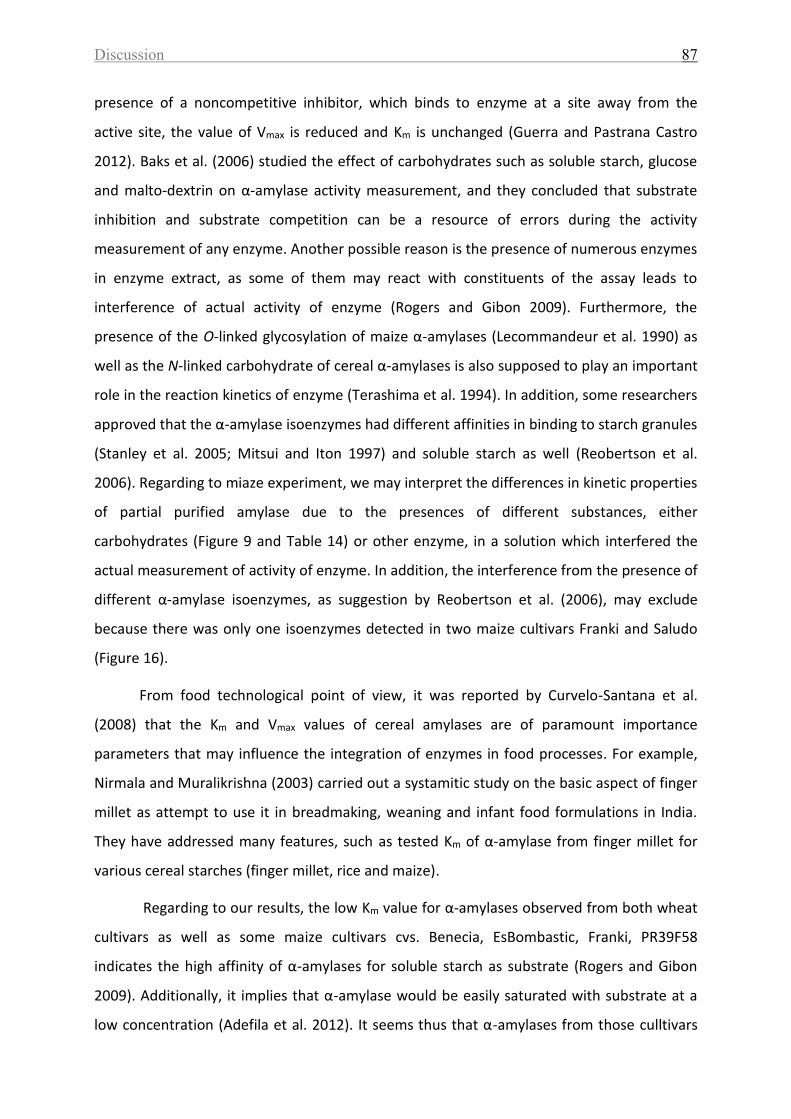
Discussion 87
presence of a noncompetitive inhibitor, which binds to enzyme at a site away from the
active site, the value of Vmax is reduced and Km is unchanged (Guerra and Pastrana Castro
2012). Baks et al. (2006) studied the effect of carbohydrates such as soluble starch, glucose
and malto-dextrin on α-amylase activity measurement, and they concluded that substrate
inhibition and substrate competition can be a resource of errors during the activity
measurement of any enzyme. Another possible reason is the presence of numerous enzymes
in enzyme extract, as some of them may react with constituents of the assay leads to
interference of actual activity of enzyme (Rogers and Gibon 2009). Furthermore, the
presence of the O-linked glycosylation of maize α-amylases (Lecommandeur et al. 1990) as
well as the N-linked carbohydrate of cereal α-amylases is also supposed to play an important
role in the reaction kinetics of enzyme (Terashima et al. 1994). In addition, some researchers
approved that the α-amylase isoenzymes had different affinities in binding to starch granules
(Stanley et al. 2005; Mitsui and Iton 1997) and soluble starch as well (Reobertson et al.
2006). Regarding to miaze experiment, we may interpret the differences in kinetic properties
of partial purified amylase due to the presences of different substances, either
carbohydrates (Figure 9 and Table 14) or other enzyme, in a solution which interfered the
actual measurement of activity of enzyme. In addition, the interference from the presence of
different α-amylase isoenzymes, as suggestion by Reobertson et al. (2006), may exclude
because there was only one isoenzymes detected in two maize cultivars Franki and Saludo
(Figure 16).
From food technological point of view, it was reported by Curvelo-Santana et al.
(2008) that the Km and Vmax values of cereal amylases are of paramount importance
parameters that may influence the integration of enzymes in food processes. For example,
Nirmala and Muralikrishna (2003) carried out a systamitic study on the basic aspect of finger
millet as attempt to use it in breadmaking, weaning and infant food formulations in India.
They have addressed many features, such as tested Km of α-amylase from finger millet for
various cereal starches (finger millet, rice and maize).
Regarding to our results, the low Km value for α-amylases observed from both wheat
cultivars as well as some maize cultivars cvs. Benecia, EsBombastic, Franki, PR39F58
indicates the high affinity of α-amylases for soluble starch as substrate (Rogers and Gibon
2009). Additionally, it implies that α-amylase would be easily saturated with substrate at a
low concentration (Adefila et al. 2012). It seems thus that α-amylases from those culltivars
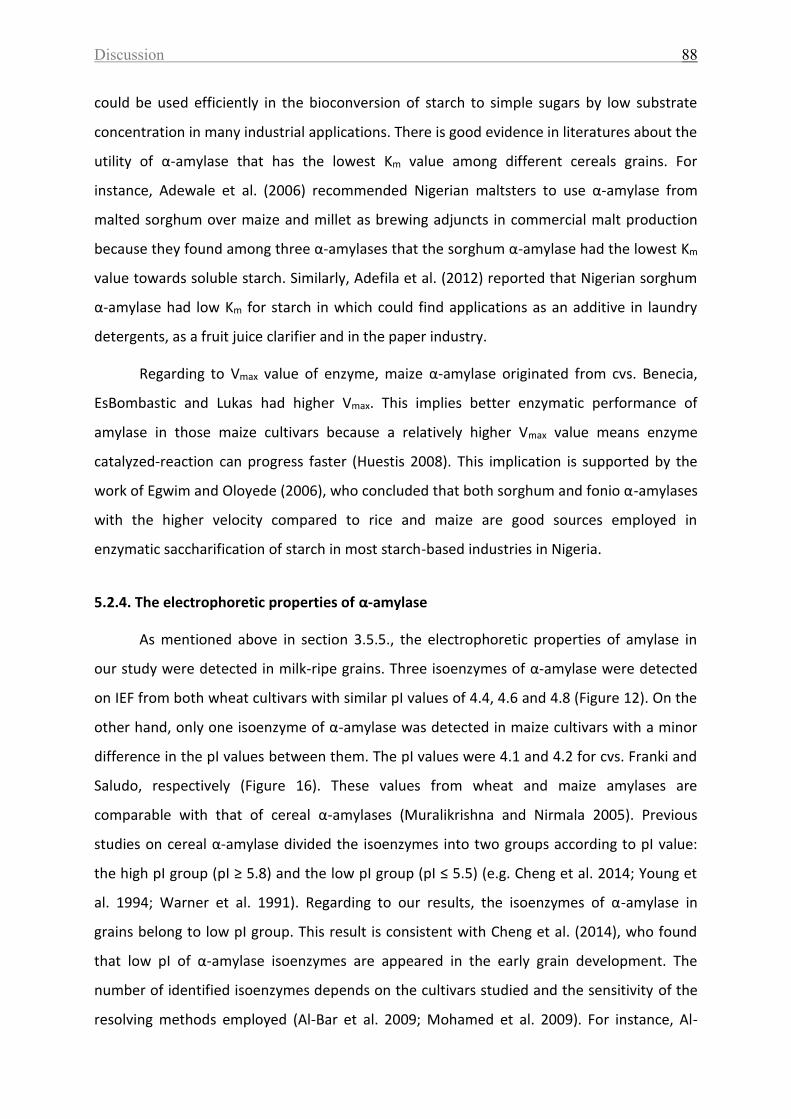
Discussion 88
could be used efficiently in the bioconversion of starch to simple sugars by low substrate
concentration in many industrial applications. There is good evidence in literatures about the
utility of α-amylase that has the lowest Km value among different cereals grains. For
instance, Adewale et al. (2006) recommended Nigerian maltsters to use α-amylase from
malted sorghum over maize and millet as brewing adjuncts in commercial malt production
because they found among three α-amylases that the sorghum α-amylase had the lowest Km
value towards soluble starch. Similarly, Adefila et al. (2012) reported that Nigerian sorghum
α-amylase had low Km for starch in which could find applications as an additive in laundry
detergents, as a fruit juice clarifier and in the paper industry.
Regarding to Vmax value of enzyme, maize α-amylase originated from cvs. Benecia,
EsBombastic and Lukas had higher Vmax. This implies better enzymatic performance of
amylase in those maize cultivars because a relatively higher Vmax value means enzyme
catalyzed-reaction can progress faster (Huestis 2008). This implication is supported by the
work of Egwim and Oloyede (2006), who concluded that both sorghum and fonio α-amylases
with the higher velocity compared to rice and maize are good sources employed in
enzymatic saccharification of starch in most starch-based industries in Nigeria.
5.2.4. The electrophoretic properties of α-amylase
As mentioned above in section 3.5.5., the electrophoretic properties of amylase in
our study were detected in milk-ripe grains. Three isoenzymes of α-amylase were detected
on IEF from both wheat cultivars with similar pI values of 4.4, 4.6 and 4.8 (Figure 12). On the
other hand, only one isoenzyme of α-amylase was detected in maize cultivars with a minor
difference in the pI values between them. The pI values were 4.1 and 4.2 for cvs. Franki and
Saludo, respectively (Figure 16). These values from wheat and maize amylases are
comparable with that of cereal α-amylases (Muralikrishna and Nirmala 2005). Previous
studies on cereal α-amylase divided the isoenzymes into two groups according to pI value:
the high pI group (pI ≥ 5.8) and the low pI group (pI ≤ 5.5) (e.g. Cheng et al. 2014; Young et
al. 1994; Warner et al. 1991). Regarding to our results, the isoenzymes of α-amylase in
grains belong to low pI group. This result is consistent with Cheng et al. (2014), who found
that low pI of α-amylase isoenzymes are appeared in the early grain development. The
number of identified isoenzymes depends on the cultivars studied and the sensitivity of the
resolving methods employed (Al-Bar et al. 2009; Mohamed et al. 2009). For instance, Al-
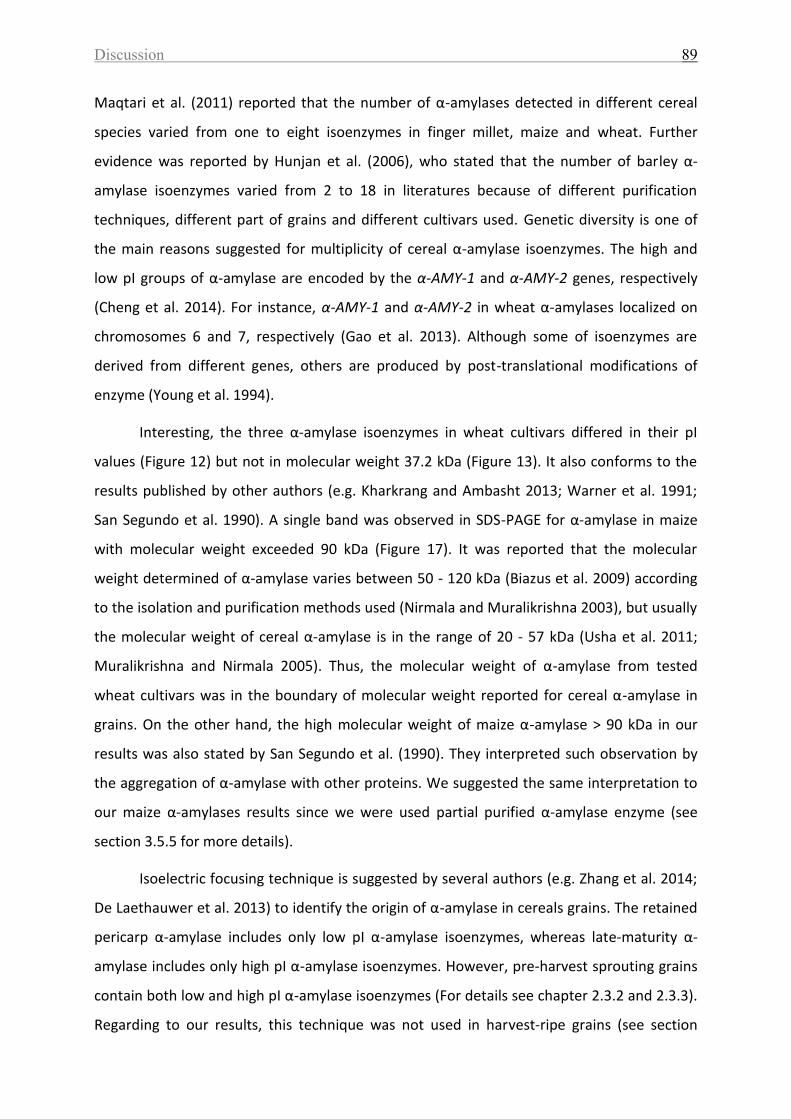
Discussion 89
Maqtari et al. (2011) reported that the number of α-amylases detected in different cereal
species varied from one to eight isoenzymes in finger millet, maize and wheat. Further
evidence was reported by Hunjan et al. (2006), who stated that the number of barley α-
amylase isoenzymes varied from 2 to 18 in literatures because of different purification
techniques, different part of grains and different cultivars used. Genetic diversity is one of
the main reasons suggested for multiplicity of cereal α-amylase isoenzymes. The high and
low pI groups of α-amylase are encoded by the α-AMY-1 and α-AMY-2 genes, respectively
(Cheng et al. 2014). For instance, α-AMY-1 and α-AMY-2 in wheat α-amylases localized on
chromosomes 6 and 7, respectively (Gao et al. 2013). Although some of isoenzymes are
derived from different genes, others are produced by post-translational modifications of
enzyme (Young et al. 1994).
Interesting, the three α-amylase isoenzymes in wheat cultivars differed in their pI
values (Figure 12) but not in molecular weight 37.2 kDa (Figure 13). It also conforms to the
results published by other authors (e.g. Kharkrang and Ambasht 2013; Warner et al. 1991;
San Segundo et al. 1990). A single band was observed in SDS-PAGE for α-amylase in maize
with molecular weight exceeded 90 kDa (Figure 17). It was reported that the molecular
weight determined of α-amylase varies between 50 - 120 kDa (Biazus et al. 2009) according
to the isolation and purification methods used (Nirmala and Muralikrishna 2003), but usually
the molecular weight of cereal α-amylase is in the range of 20 - 57 kDa (Usha et al. 2011;
Muralikrishna and Nirmala 2005). Thus, the molecular weight of α-amylase from tested
wheat cultivars was in the boundary of molecular weight reported for cereal α-amylase in
grains. On the other hand, the high molecular weight of maize α-amylase > 90 kDa in our
results was also stated by San Segundo et al. (1990). They interpreted such observation by
the aggregation of α-amylase with other proteins. We suggested the same interpretation to
our maize α-amylases results since we were used partial purified α-amylase enzyme (see
section 3.5.5 for more details).
Isoelectric focusing technique is suggested by several authors (e.g. Zhang et al. 2014;
De Laethauwer et al. 2013) to identify the origin of α-amylase in cereals grains. The retained
pericarp α-amylase includes only low pI α-amylase isoenzymes, whereas late-maturity α-
amylase includes only high pI α-amylase isoenzymes. However, pre-harvest sprouting grains
contain both low and high pI α-amylase isoenzymes (For details see chapter 2.3.2 and 2.3.3).
Regarding to our results, this technique was not used in harvest-ripe grains (see section
Discussion 90
3.5.5.) and it did not give us any evidence to the origin of α-amylase activity measured by
Ceralpha assay in mature grain at harvest time (Figure 5 for wheat and Table 11 for maize).
Therefore, there is a clear need to use such method in mature-harvest stage of grain, in
order to investigate the source of amylase activity, particularly in the presence of α-amylase
activity in the absence of visual sprouting. Modern resolving techniques are also
recommended to purify the α-amylase protein from grains at harvest stage to obtain clear
results by IEF method. In addition, Kondhare et al. (2012) suggested the isoelectric
separation of both α-amylase i.e. high vs. low pI α-amylase on agarose gel may beneficial
tool in order to understand the effect of exogenous ABA and GA to particular α-amylase
isoenzymes in regulating late-maturity α-amylase formation in wheat grains.
Conclusion 91
6. CONCLUSION
The present results contributed to the characterization of α-amylase from different
cereals cultivars and environments (locations and years), and its relationship with the
chemical composition of the grain.
In the first experiment, both cultivars and locations had significantly influence on α-
amylase activity and all studied chemical components of wheat grains throughout the grain
development period. Regarding to the cultivars factor, cv. Amaretto were characterized by
higher α-amylase activity, starch and sugars content compared to cv. Cubus at dough and
mature stage, regardless of the locations. On the other hand, grains in each cultivar collected
from Torland showed higher α-amylase activity than those from Gladebeck at dough and
mature stage. In the second experiment, α-amylase activity and all studied chemical
components of mature maize kernels differed significantly (p ≤ 0.05) among two years,
irrespective of cultivars. Mature kernels harvested in 2011 contained higher α-amylase
activity, starch and sugars content except sucrose than those in 2010 among cultivars and
regardless of the cultivars. It can be concluded that the weather conditions in both field
experiments contributed to differences in α-amylase activity of cereals grains mainly
between both locations and years, and partly between cultivars. For instance, the high
precipitation rate and low temperature before and at harvest-mature time enhanced the α-
amylase activity in wheat grains grown in Torland, which leads to suppose that pre-harvest
sprouting may incipient in grains, although visible sprouting was absent. The involvement of
late maturity α-amylase activity in mature sound grains cannot be ruled out, particularly this
phenomenon has now been documented in German bread wheat germplasm.
Differences in α-amylase activity due to cultivars are important in breeding cereal
cultivars tolerant to pre-harvest sprout damage as well as late maturity α-amylase since such
differences in enzyme activity present as a valuable source of germplasm. From our results,
the low enzyme activity of cv. Cubus promotes the utility of such cultivar as parent, and that
characteristic in combination with other physiological mechanisms, e.g. insensitivity to GA
and ABA sensitivity, can be selected for pre-harvest sprouting breeding program. On the
other hand, the origin of high α-amylase activity detected in harvest-mature stage of wheat
Conclusion 92
cv. Amaretto and maize cv. EsBombastic was not definitely obvious, since there were no
sprouting symptoms.
Difference in α-amylase activity of cereal grains in different locations and years was
due to climate condition, mainly precipitation. Using cv. Cubus in Torland, where high
precipitation during harvest period expected may suggest to avoid or reduce weathering
damage. Furthermore, collecting wheat and maize grain earlier than harvest-mature stage
and stored grains at low temperature ~10 °C to preserve dormancy are management options
to avoid or reduce pre-harvest sprouting damage.
The significant correlation (p ≤ 0.05) between α-amylase activity and starch, maltose
and sucrose was detected in wheat and maize, while a strong significant correlation (p ≤
0.05) between α-amylase activity and protein was observed only in wheat across all grain
development stages
In our study, although broadly similar properties of α-amylases from both cereals
were detected, α-amylase of a particular cereal cultivar did differ. The characteristics of α-
amylase from different cultivars differ and so many have different level of usefulness in food
industires regarding to desired attributes of enzyme in a specific purpose.
Regarding to wheat experiment, α-amylase from cv. Amaretto was more active and
stable at 70 °C than that of cv. Cubus. Thus, the use of cv. Amaretto as a source of α-amylase
in breadbaking industry may lead to excess dexterinzation during baking process and a
deterioration of bread quality upon overdosing. This is true in the case of using amylase of
cv. Amaretto as processing aid in flour standardization. However, in the case of using tested
wheat cvs. Amaretto and Cubus, as a flour from a minor sprouted damage, acid treatment of
flour may suggest in order to ameliorate the deleterious effects of high α-amylase of wheat
flour. This solution is based on the acid lability of amylase from wheat cultivars at pH 4.
Regarding to maize experiment, α-amylase from cvs. Benecia, EsBombastic, Franki
and PR39F58 shows promoising characteristics for application in food industries such as
beers, beverages, bakeries, syrups, formulation of paediatric food and others. This work
shows optimal conditions of using maize amylase from mentioned cultivars depends on
three superior properties as following: 1﴿ broad pH optimum of amylase 4 - 6, 2﴿
temperature stability of amylase ≥ 50 °C and 3﴿ good kinetic capability of enzyme by either

Conclusion 93
low Km and/or high Vmax . Additionally, the thermal activity of amylase (~ 60 %) from cv. Fanki
at 70 °C could be an added advantage.
Summary 94
7. Summary
Alpha-amylase is a starch-hydrolyzing enzyme and its characterization is an important
quality parameter in cereal grains. In breadmaking, adequate α-amylase activity is required
to produce bread of good quality. High α-amylase activity degrades the flour quality because
it hydrolyses excessive amounts of flour starch and lowers flour viscosity which results in a
sticky loaf and poor texture. The primary cause of high α-amylase activity is pre-harvest
sprouting when the mature grains attached on the ear germinate in the field under wet and
cold conditions. Moreover, some cereal cultivars produce unacceptable high α-amylase
activity in the absence of pre-harvest sprouting as well. Therefore, α-amylase is influenced
by both cultivar and environment factors. This study investigated the influence of cultivar
and environment on α-amylase characterization during grain development stages in wheat
and maize, and the relationship between α-amylase characterization and chemical
composition of grains in both cereals.
The results in wheat and maize experiments showed that α-amylase activity changed
considerably during grain development stages, with the highest activity was at milk-ripe
grains. Regarding to wheat experiment, the grains of cv. Amaretto exhibited higher α-
amylase activity than those of cv. Cubus at three grain development stages, irrespective of
locations. The α-amylase activity of cultivars grown in Torland was significantly higher (p ≤
0.05) at dough-ripe and mature-harvest stages than those in Gladebeck, irrespective of
cultivars. Regarding to maize experiment, α-amylase activity in mature-harvest grains
cultivated in 2011 was significantly (p ≤ 0.05) higher than those in 2010, irrespective of
cultivars and within a cultivar except cv. PR39F58. Our results indicate that the difference in
the activity of α‐amylase was mainly attributed to environments, although the effect of
different cultivars was also highly significant.
The results of biochemical and kinetic characterization of α‐amylase from both wheat
and maize have practical uses in the hydrolysis process of starch by food industries such as
breadmaking, beers, beverages, syrups and others. This work shows the applicability of four
investigated maize cultivars cvs. Benecia, EsBombastic, Franki and PR39F58 for use as a
source of α‐amylase in starch hydrolysis process. On other hand, thermal activity of amylase

Summary 95
isolated from cv. Amaretto is not a desirable feature in the case of using that cultivar as a
source of exogenous amylase in order to optimize flour in breadmanking industry.
Bibliography 96
8. Bibliography
Abe, R., Chiba, Y. and Nakajima, T. (2002). Characterization of the functional module responsible for the low temperature optimum of a rice alpha-amylase (Amy 3E). Biologia, Bratislava, 57, 197-202.
Adefila, O. A., Bakare, M. K. and Adewale, I. O. (2012). Characterization of an α‐amylase from sorghum (Sorghum bicolor) obtained under optimized conditions. Journal of the Institute of Brewing, 118, 63-69.
Adewale, I. O., Agumanu, E. N. and Otih-Okoronkwo, F. I. (2006). Comparative studies on α-amylases from malted maize (Zea mays), millet (Eleusine coracana) and sorghum (Sorghum bicolour). Carbohydrate Polymers, 66, 71-74.
Ahmadi, A. and Baker, D. A. (2001). The effect of water stress on grain filling processes in wheat. The Journal of Agricultural Science, 136, 257-269.
Al-Bar, O. A. (2009). Screening of α-amylase in the Barley Hordium vulgare during germination: Characterisation of α-amylase. Journal of Applied Sciences Research, 5, 2546-2552.
Al-Maqtari, M. A. A., Nagi, K. M. and Al Hazmi, S. M. (2011). Identification and Characterization of α-Amylase from Yemeni bean (Dolichos Lablab L.) seeds. Jordan Journal of Chemistry, 6, 219-229.
Altenbach, S. B., DuPont, F. M., Kothari, K. M., Chan, R., Johnson, E. L. and Lieu, D. (2003). Temperature, water and fertilizer influence the timing of key events during grain development in US spring wheat. Journal of Cereal Science, 37, 9-20.
Aslam, M., Zamir, M. S. I., Afzal, I., Yaseen, M., Mubeen, M. and Shoaib, A. (2013). Drought stress, its effects on maize productionand development of drought tolerance throughout potassium application. Cercetari Agronomice în Moldova, 46, 99-114.
Asthir, B., Rai, P. K., Bains, N. S. and Sohu, V. S. (2012). Genotypic variation for high temperature tolerance in relation to carbon partitioning and grain sink activity in wheat. American Journal of Plant Sciencesm, 3, 381-390.
Awoyinka, O. A. and Adebawo, O. O. (2008). Quality assessment and potential utilization of high amylolytic Nigerian maize cultivars. African Journal of Biotechnology, 7, 4331-4335.
Ba, K., Aguedo, M., Tine, E., Paquot, M., Destain, J. and Thonart, P. (2013). Hydrolysis of starches and flours by sorghum malt amylases for dextrins production. European Food Research and Technology, 236, 905-918.
Bibliography 97
Baks, T., Janssen, A. E. and Boom, R. M. (2006). The effect of carbohydrates on α-amylase activity measurements. Enzyme and Microbial Technology, 39, 114-119.
Balconi, C., Hartings, H., Lauria, M., Pirona, R., Rossi, V. and Motto, M. (2007). Gene discovery to improve maize grain quality traits. Maydica, 52, 357.
Barbeau, W.E., Griffey, C.A. and Yan, Z. (2006). Evidence that minor sprout damage can lead to significant reductions in gluten strength of winter wheat. Cereal Chemistry, 83, 306-310.
Barnabas, B., Jäger, K. and Fehér, A. (2008). The effect of drought and heat stress on reproductive processes in cereals. Plant, Cell and Environment, 31, 11-38.
Barnard , A., Van Deventer, C. S. and Maartens, H. (2005). Genetic variability of preharvest sprouting - the South African situation. Euphytica, 143, 291-296.
Barnard, A. and Smith, M. F. (2009). The effect of rainfall and temperature on the preharvest sprouting tolerance of winter wheat in the dry land production areas of the Free State Province. Field Crops Research 112, 158-164.
Barnard, A. and Smith, M. F. (2012). Determination of the influence of climate on falling number of winter wheat in the dryland production areas of the Free State Province of South Africa. Euphytica, 188, 15-24.
Barrero, J. M., Mrva, K., Talbot, M. J., White, R. G., Taylor, J., Gubler, F. and Mares, D. J. (2013). Genetic, hormonal, and physiological analysis of late maturity α-amylase in wheat. Plant Physiology, 161, 1265-1277.
Basinskiene, L., Juodeikiene, G., Kalvaityte, V., Ceseviciene, J. and Leistrumaite, A. (2011). Enzyme activity of different cereals grown using organic and conventional agricultural practices. FoodBalt, 2011, 27-32.
Beckles, D. M. and Thitisaksakul, M. (2014). How environmental stress affects starch composition and functionality in cereal endosperm. Starch‐Stärke, 66, 58-71.
Belitz, H.D., Grosch. W. And Schieberle,P. (Eds.). (2009). Food Chemistry. 4th Edition, Springer-Verlag Berlin.
Bernfeld, P. (1955). Amylases alpha and beta. Methods in Enzymology, 1, 149-158.
Bewley, J. D., Bradford, K., Hilhorst, H. W and Nonogaki, H. (Eds.). (2013). Seeds: Physiology of Development, Germination and Dormancy. 3rd Edition, Springer-Verlag New York.
Bhandari, D. (2002). Development of blue starch/agarose gel method for rapid intake and field testing for cereal alpha-amylase activity. Project report No. 271, Home Grown Cereals Authority (HGCA).
Bibliography 98
Biazus, J. P. M., Souza, R. R. D., Márquez, J. E., Franco, T. T., Santana, J. C. C. and Tambourgi, E. B. (2009). Production and characterization of amylases from Zea mays malt. Brazilian Archives of Biology and Technology, 52, 991-1000.
Biddulph, T. B., Mares, D. J., Plummer, J. A. and Setter, T. L. (2005). Drought and high temperature increases preharvest sprouting tolerance in a genotype without grain dormancy. Euphytica, 143, 277-283.
Biddulph, T. B., Plummer, J. A., Setter, T. L. and Mares, D. J. (2008). Seasonal conditions influence dormancy and preharvest sprouting tolerance of wheat (Triticum aestivum L.) in the field. Field Crops Research, 107, 116-128.
Bio-Rad protocol. Molecular weight by SDS-PAGE. Bulletin 3133 http://www.bio-rad.com/webroot/web/pdf/lsr/literature/Bulletin_3133.pdf. [Accessed on April 2012].
Bio-Rad protein assay protocol. http://www.biorad.com/LifeScience/pdf/Bulletin_9004.pdf. [Accessed on December 2011].
Black, M., Bewley, J. D. and Halmer, P. (Eds.). (2006). The Encyclopedia of Seeds: Science, Technology and Uses. CAB International, Wallingford.
Brena, B. M., Pazos, C., Franco-Fraguas, L. and Batista-Viera, F. (1996). Chromatographic methods for amylases. Journal of Chromatography B: Biomedical Sciences and Applications, 684, 217-237.
Bringezu, T. G. G., Sharbel, T. F. and Weber, W. E. (2011). Grain development and endoreduplication in maize and the impact of heat stress. Euphytica, 182, 363-376.
Britz, W. and Delzeit, R. (2013). The impact of German biogas production on European and global agricultural markets, land use and the environment. Energy Policy, 62 ,1268-1275.
BSA, (2012). Beschreibende Sortenliste Getreide, Mais Öl- und Faserpflanzen Leguminosen Rüben Zwischenfrüchte, Hannovar. Deautscher Landwirstschaftsverlag (German language). http://www.bundessortenamt.de/internet30/fileadmin/Files/PDF/bsl_getreide_2012.pdf. [Accessed on May 2013].
Buckow, R., Weiss, U., Heinz, V. and Knorr, D. (2007). Stability and catalytic activity of α‐amylase from barley malt at different pressure–temperature conditions. Biotechnology and bioengineering, 97, 1-11.
Buresova, I., Sedláèková, I., Famìra, O. and Lipavský, J. (2010). Effect of growing conditions on starch and protein content in triticale grain and amylose content in starch. Plant Soil Environment, 56, 99-104.
Bibliography 99
Cato, L. (2005). The effect of selected enzymes on the quality and structural attributes of white salted and yellow alkaline Asian noodles, PhD thesis, RMIT University, Melbourne, Australia.
Chakraborty, S. and Newton, A. C. (2011). Climate change, plant diseases and food security: an overview. Plant Pathology 60, 2-14.
Cheng, C. R., Oldach, K., Mrva, K. and Mares, D. (2014). Analysis of high pI α-Amy-1 gene family members expressed in late maturity α-amylase in wheat (Triticum aestivum L.). Molecular Breeding, 33, 519-529.
Cisse, M Zoue L. T., Soro, Y. R., Megnanou R-M. and Nimke, S. (2013). Physicochemical and functional properties of starches of two quality protein maize (QPM) grown in Côte d’Ivoire. Journal of Applied Biosciences, 66, 5130–5139.
Copeland, R. A. (Ed). (2004). Enzymes: A Practical Introduction to Structure, Mechanism, and Data Analysis. John Wiley and Sons.
Csiszar, J., Guóth, A., Kolbert, Z., Gallé, Á., Tari, I., Ciulca, S. and Erdei, L. (2010). Starch to protein ratio and α-amylase activities in grains of different wheat cultivars. Acta Biologica Szegediensis, 54, 19-23.
Curtis, B. C., Rajaram, S. and Macpherson, G. H. (Eds.). (2002). Bread Wheat Improvement and Production. FAO: Plant Production and Protection Series, No. 30.
Curvelo-Santana, J. C., Ferreira, G. B., Biazus, J. P. M., De Souza, R. R. and Tambourgi, E. B. (2008). Biochemistry characterization of α- and β- amylases from Zea mays malt and statistical analysis approach of the degradation of manioc starch. Journal of Food Process Engineering, 31, 694-710.
Dai, Z., Yin, Y. and Wang, Z. (2009). Comparison of starch accumulation and enzyme activity in grains of wheat cultivars differing in kernel type. Plant Growth Regulation, 57, 153-162.
Daniel, R. M., Danson, M. J., Eisenthal, R., Lee, C. K. and Peterson, M. E. (2008). The effect of temperature on enzyme activity: new insights and their implications. Extremophiles, 12, 51-59.
Daussant, J. and Renard, H. A. (1987). Development of different α-amylase isozymes, having high and low isoelectric points, during early stages of kernel development in wheat. Journal of Cereal Science, 5, 13-21.
Daussant, J. and Renard, H. A. (1976). Immunochemical identification of a-amylases indeveloping and germinating wheat seeds. Cereal Research Communication, 4, 201-212.
Day, L., Augustin, M. A., Batey, I. L. and Wrigley, C. W. (2006). Wheat-gluten uses and industry needs. Trends in Food Science and Technology, 17, 82-90.
Bibliography 100
De Laethauwer, S., De Riek, J., Stals, I., Reheul, D. and Haesaert, G. (2013). α-Amylase gene expression during kernel development in relationto pre-harvest sprouting in wheat and triticale. Acta Physiol Plant, 35, 2927-2938.
Dencic, S., Mladenov, N. and Kobiljski, B. (2011). Effects of genotype and environment on breadmaking quality in wheat. International Journal of Plant Production, 5, 71-82.
Dencic, S., De Pauw, R., Kobiljski, B. and Momcilovic, V. (2013). Hagberg Falling Number and rheological properties of wheat cultivars in wet and dry preharvest periods. Plant Production Science, 16, 342-351.
Deutsches Maiskomitee (2014) Maisanbauflächen in Deutschland für die Jahre 2009 bis 2013. http://www.maiskomitee.de/web/public/Fakten.aspx/Statistik/Deutschland/Gesamtflächen-_entwicklung. [Accessed January 2014].
Diallo, A. O., Ali-Benali, M. A., Badawi, M., Houde, M. and Sarhan, F. (2012). Expression of vernalization responsive genes in wheat is associated with histone H3 trimethylation. Molecular Genetics and Genomics, 287, 575-590.
Dicko, Mamoudou H., Gruppen, H., Traore, A. S., Voragen, A. G. and Van Berkel, W. J. (2006). Review: Sorghum grain as human food in Africa: relevance of starch content and amylase activities. African Journal of Biotechnology, 5, 384-395.
Distelfeld, A., Li, C. and Dubcovsky, J. (2009). Regulation of flowering in temperate cereals. Current Opinion in Plant Biology, 12, 178-184.
Divashuk, M., Mayer, N., Kroupin, P., Rubets, V., Pylnev, V., Lin, N. T. T. and Karlov, G. (2012). The association between the allelic state of Vp-1B and pre-harvest sprouting tolerance in red-seeded hexaploid triticale. Open Journal of Genetics, 2, 51-55.
Goertz, A., Zuehlke, S., Spiteller, M., Steiner, U., Dehne, H. W., Waalwijk, C. and Oerke, E. C. (2010). Fusarium species and mycotoxin profiles on commercial maize hybrids in Germany. European Journal of Plant Pathology, 128, 101-111.
Dornez, E. (2007). Insight into the distribution and variability of endoxylanases in wheat and their functionality during bread making (PhD thesis). Katholieke Universiteit Leuven, Leuven, Belgium.
Drapron, R. and Godon, B. (1987). Role of enzymes in baking. In: J. E. Kruger and D. R. Lineback (Eds.). Enzymes and Their Role in Cereal Technology. pp. 117-138. AACC monograph series, USA.
Dupont, F. M. and Altenbach, S. B. (2003). Molecular and biochemical impacts of environmental factors on wheat grain development and protein synthesis. Journal of Cereal Science, 38, 133-146.
Bibliography 101
DWD (2010). Deutsche Wetterdienst. www.dwd.de/WESTE. [Accessed on May 2013].
DWD (2011). Deutscher Wetterdienst - Zentrum für Agrarmeteorologische Forschung Braunschweig http://www.dwd.de/bvbw/appmanager/bvbw/dwdwwwDesktop?_nfpb=trueand_pageLabel=dwdwww_result_pageandgsbSearchDocId=703364. [Accessed on January 2013].
Edwards, M. A. (2010). Morphological features of wheat grain and genotype affecting flour yield (PhD thesis). PhD thesis, Southern Cross University, Lismore, Australia.
Egli, D. B. (2004). Seed-fill duration and yield of grain crops. Advances in Agronomy, 83, 243-279.
Egli, D. B. (2006).The role of seed in the determination of yield of grain crops. Crop and Pasture Science, 57, 1237-1247.
Egwim, E. C. and Oloyede, O. B. (2006). Comparison of α-amylase activity in some sprouting Nigerian cereals. Biokemistri, 18, 15-20.
El Nour, M. E. and Yagoub, S. O. (2010). Partial purification and characterization of α and β-amylases isolated from Sorghum bicolor cv. (Feterita) malt. Journal of Applied Sciences, 10, 1314-1319.
El Nour, M. E., Yagoub, S. O. and AL Jarbough, A. (2013). Purification and characterization of α and β-amylases isolated from millet (Pennisetum glaucum) malt. America Journal of Scienctific and Industrial Research, 4, 183-190.
Emanuelsson, J., Wollenweber, B., Jørgensen, J. R., Andersen, S. B. and Jensen, C. R. (2003). Wheat grain composition and implications for bread quality. DIAS report. Plant Production, No. 92.
Encyclopaedia Britannica Online. (2014). http://www.britannica.com, [Accessed January 2014].
Encyclopaedia Britannica Online. (2014). http://www.britannica.com, [Accessed January 2014].
Young, T. W. (2014). Beer, alcoholic beverage in Encyclopaedia Britannica Online http://www.britannica.com/topic/beer, [Accessed April 2014].
Evers, A.D., Flintham and J. Kotecha, K. (1995). Alpha-amylase and grain size in wheat. Journal of Cereal Science, 21, 1–3.
Evers, A. D., O'Brien, L. and Blakeney, A. B. (1999). Cereal structure and composition. Crop and Pasture Science, 50, 629-650.
Bibliography 102
Evers, T. and Millar, S. (2002). Cereal grain structure and development: some implications for quality. Journal of Cereal Science, 36, 261-284.
Every, D., Simmons, L., Al-Hakkak, J., Hawkins, S. and Ross, M. (2002). Amylase, falling number, polysaccharide, protein and ash relationships in wheat millstreams. Euphytica, 126, 135-142.
Faltermaier, A., Waters, D., Becker, T., Arendt, E. and Gastl, M. (2014). Common wheat (Triticum aestivum L.) and its use as a brewing cereal–a review. Journal of the Institute of Brewing, 120, 1-15.
FAO (2002). Harvest and storage management of wheat. http://www.fao.org/docrep/006/y4011e/y4011e0u.htm. [Accessed on Febraury 2014].
FAOSTAT (2013). Available online at http://faostat3.fao.org/faostat-gateway/go/to/download/Q/QC/E. [Accessed on March 2013].
Farooq, M., Bramley, H., Palta, J. A. and Siddique, K. H. (2011). Heat stress in wheat during reproductive and grain-filling phases. Critical Reviews in Plant Sciences 30, 491-507.
Farrell, A. D. and Kettlewell, P. S. (2009). The relationship between grain weight and alpha-amylase in winter wheat: varietal comparison from UK field experiments. Euphytica, 168, 395-402.
Farrer, D., Weisz, R., Heiniger, R., Murphy, J. P. and Pate, M. H. (2006). Delayed harvest effect on soft red winter wheat in the southeastern USA. Agronomy Journal, 98, 588-595.
Fernandes, P. (2010). Enzymes in food processing: a condensed overview on strategies for better biocatalysts. Enzyme Research, 2010, 1-19.
Finkelstein, R., Reeves, W., Ariizumi, T. and Steber, C. (2008). Molecular Aspects of Seed Dormancy. Plant Biology, 59, 387-415.
Fox, G. and Manley, M. (2009). Hardness methods for testing maize kernels. Journal of Agricultural and Food Chemistry, 57, 5647-5657.
Frinke, C., Moeller, K., Schlink, S., Gerowitt, B. and Isselstein, J. (1999). The environmental impact of maize cultivation in the European Unioin: Practical options for the improvement of the environmental impact-case staudy Germany. Research Centre for Agriculture and Environment in cooperation with the Department of Forage and Grass Research of the Institute for Agronomy and Plant Breeding, Georg-August-University of Göttinge. http://ec.europa.eu/environment/agriculture/pdf/mais_allemange.pdf. [Accessed on January 2013]
Gabor, R., Täufel, A., Behnke, U. and Heckel, J. (1991). Studies on the germination specific α-amylase and its inhibitor of rye (Secale cereale). Zeitschrift für Lebensmittel-Untersuchung und Forschung, 192, 230-233.
Bibliography 103
Gani A., Wani SM., Masoodi, FA. and Hameed, G. (2012). Whole-grain cereal bioactive compounds and their health benefits: A review. Journal of Food Processing and Technology, 3, 146-156.
Gao, X., Hu, C. H., Li, H. Z., Yao, Y. J., Meng, M., Dong, J. and Li, X. Y. (2013). Factors affecting pre-harvest sprouting resistance in wheat (Triticum aestivum, L): A review. The Journal of Animal and Plant Sciences, 23, 556-565.
Gatford, K. T. (2004). Seed dormancy mechanisms in diploid wheat (Triticum tauschii (Coss.) Schmalh.) (PhD thesis), University of Melbourne, Australia.
Gelin, J. R., Elias, E. M. and Kianian, S. F. (2006). Evaluation of two durum wheat (Triticum turgidum L. var.durum) crosses for pre-harvest sprouting resistance. Field Crops Research, 97, 188-196.
Gimbi, D. M. and Kitabatake, N. (2002). Changes in alpha-and beta-amylase activities during seed germination of African finger millet. International Journal of Food Sciences and Nutrition, 53, 481-488.
Goesaert, H., Brijs, K., Veraverbeke, W. S., Courtin, C. M., Gebruers, K. and Delcour, J. A. (2005). Wheat flour constituents: how they impact bread quality, and how to impact their functionality. Trends in Food Science and Technology, 16, 12-30.
Greenwood, C. T. and Milne, E. (1968). Studies on starch‐degrading enzymes. Part VII. properties and action‐pattern of the α‐amylases from barley, oats, rye and wheat. Starch‐Stärke, 20, 101-107.
Grieder, C., Dhillon, B. S., Schipprack, W. and Melchinger, A. E. (2012). Breeding maize as biogas substrate in Central Europe: I. Quantitative-genetic parameters for testcross performance. Theoretical and Applied Genetics, 124, 971-980.
Gooding, M. J., Ellis, R. H., Shewry, P. R. and Schofield, J. D. (2003). Effects of restricted water availability and increased temperature on the grain filling, drying and quality of winter wheat. Journal of Cereal Science, 37, 295-309.
Goggin, D. E. and Powles, S. B. (2012). Selection for low dormancy in annual ryegrass (Lolium rigidum) seeds results in high constitutive expression of a glucose-responsive α-amylase isoform. Annals of botany, 110, 1641-1650.
Groos, C., Gay, G., Perretant, M. R., Gervais, L., Bernard, M., Dedryver, F. and Charmet, G. (2002). Study of the relationship between pre-harvest sprouting and grain color by quantitative trait loci analysis in a white× red grain bread-wheat cross. Theoretical and Applied Genetics, 104, 39-47.
Gupta, R., Gigras, P., Mohapatra, H., Goswami, V. K. and Chauhan, B. (2003). Microbial α-amylases: a biotechnological perspective. Process Biochemistry, 38, 1599-1616.

Bibliography 104
Guerra, N. P. and Pastrana Castro, L. (2012). Modelling the effects of ageing time of starch on the enzymatic activity of three amylolytic enzymes. The Scientific World Journal, 2012, 1-13.
Gujjaiah, S. and Kumari, C. (2013). Evaluation of changes in α-amylase, β-amylase and proptease during germination of cereals. International Journal of Agricultural Science and Research, 3, 55-61.
Guoth, A., Tari, I., Gallé, Á., Csiszár, J., Pécsváradi, A., Cseuz, L. and Erdei, L. (2009). Comparison of the drought stress responses of tolerant and sensitive wheat cultivars during grain filling: changes in flag leaf photosynthetic activity, ABA levels, and grain yield. Journal of Plant Growth Regulation, 28, 167-176.
Gwirtz, J. A. and Garcia‐Casal, M. N. (2013). Processing maize flour and corn meal food products. Annals of the New York Academy of Sciences, 1312, 1-10.
Halford, N. G., Curtis, T. Y., Muttucumaru, N., Postles, J. and Mottram, D. S. (2011). Sugars in crop plants. Annals of Applied Biology, 158, 1-25.
Helland, M. H., Wicklund, T. and Narvhus, J. A. (2002). Effect of germination time on alpha amylase production and viscosity of maize porridge. Food Research International, 35, 315-321.
Hollins, P. D., Kettlewell, P. S. and Peltonen-Sainio, P. (2004). Relationships between climate and winter cereal grain quality in Finland and their potential for forecasting. Agricultural and Food Science, 13, 295-308.
Hunjan, G. K. (2006). Presence of an alpha-amylase isozyme with high temperature optima in the wheat variety tolerant to high temperature at juvenile plant stage. Acta Physiologiae Plantarum, 28, 205-215.
Hurkman, W. J., McCue, K. F., Altenbach, S. B., Korn, A., Tanaka, C. K., Kothari, K. Mand DuPont, F. M. (2003). Effect of temperature on expression of genes encoding enzymes for starch biosynthesis in developing wheat endosperm. Plant Science, 164, 873-881.
Huestis, D. L. (2008). Ecological Genetics of Adaptive Life-history Phenotypes in the Cricket Allonemobius Socius. (PhD thesis), The University of Texas, USA.
Hussain, I., Siddique, F., Mahmood, M. S. and Ahmed, S. I. (2013). A review of the microbiological aspect of α-amylase production. International Journal of Agriculture and Biology, 15, 1029-1034.
ICC Standard booklet (1999). Standard methods of the International Associaition for Cereal Science and Technology. Vienna, ICC.
Illanes, A. (Ed.). (2008). Enzyme Biocatalysis Principles and Applications. 1st Edition, Springer Netherlands.
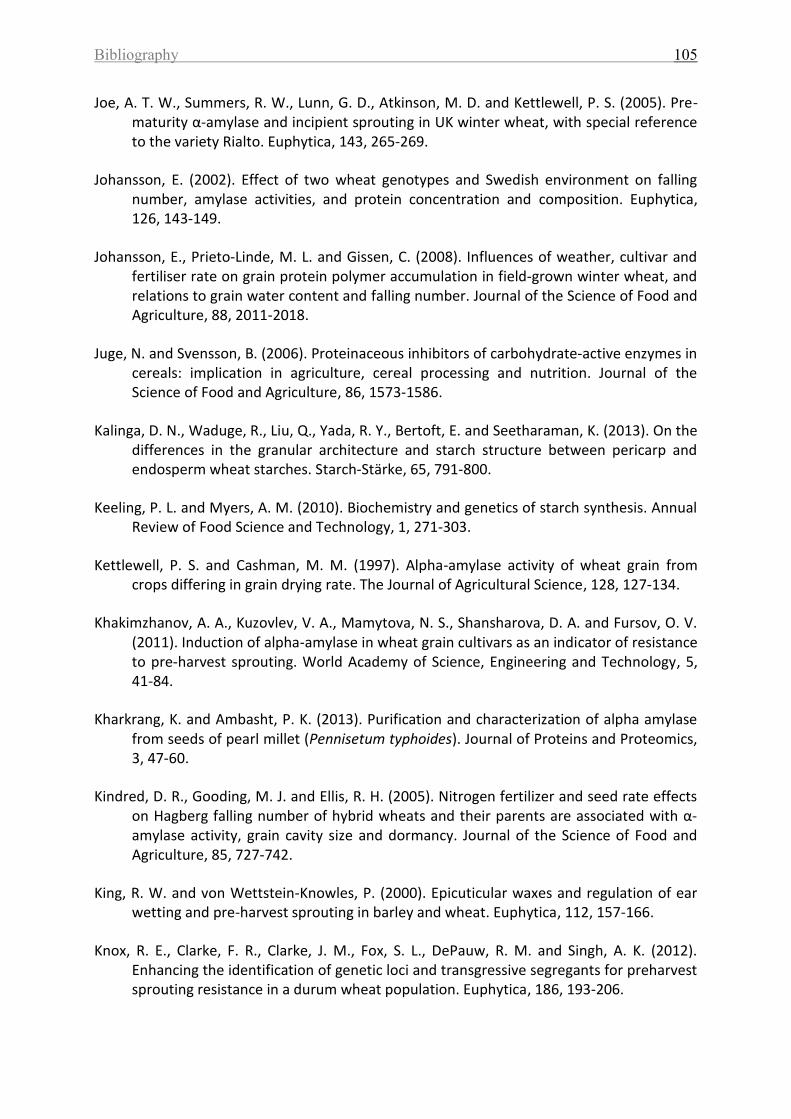
Bibliography 105
Joe, A. T. W., Summers, R. W., Lunn, G. D., Atkinson, M. D. and Kettlewell, P. S. (2005). Pre-maturity α-amylase and incipient sprouting in UK winter wheat, with special reference to the variety Rialto. Euphytica, 143, 265-269.
Johansson, E. (2002). Effect of two wheat genotypes and Swedish environment on falling number, amylase activities, and protein concentration and composition. Euphytica, 126, 143-149.
Johansson, E., Prieto‐Linde, M. L. and Gissen, C. (2008). Influences of weather, cultivar and fertiliser rate on grain protein polymer accumulation in field‐grown winter wheat, and relations to grain water content and falling number. Journal of the Science of Food and Agriculture, 88, 2011-2018.
Juge, N. and Svensson, B. (2006). Proteinaceous inhibitors of carbohydrate‐active enzymes in cereals: implication in agriculture, cereal processing and nutrition. Journal of the Science of Food and Agriculture, 86, 1573-1586.
Kalinga, D. N., Waduge, R., Liu, Q., Yada, R. Y., Bertoft, E. and Seetharaman, K. (2013). On the differences in the granular architecture and starch structure between pericarp and endosperm wheat starches. Starch‐Stärke, 65, 791-800.
Keeling, P. L. and Myers, A. M. (2010). Biochemistry and genetics of starch synthesis. Annual Review of Food Science and Technology, 1, 271-303.
Kettlewell, P. S. and Cashman, M. M. (1997). Alpha-amylase activity of wheat grain from crops differing in grain drying rate. The Journal of Agricultural Science, 128, 127-134.
Khakimzhanov, A. A., Kuzovlev, V. A., Mamytova, N. S., Shansharova, D. A. and Fursov, O. V. (2011). Induction of alpha-amylase in wheat grain cultivars as an indicator of resistance to pre-harvest sprouting. World Academy of Science, Engineering and Technology, 5, 41-84.
Kharkrang, K. and Ambasht, P. K. (2013). Purification and characterization of alpha amylase from seeds of pearl millet (Pennisetum typhoides). Journal of Proteins and Proteomics, 3, 47-60.
Kindred, D. R., Gooding, M. J. and Ellis, R. H. (2005). Nitrogen fertilizer and seed rate effects on Hagberg falling number of hybrid wheats and their parents are associated with α‐amylase activity, grain cavity size and dormancy. Journal of the Science of Food and Agriculture, 85, 727-742.
King, R. W. and von Wettstein-Knowles, P. (2000). Epicuticular waxes and regulation of ear wetting and pre-harvest sprouting in barley and wheat. Euphytica, 112, 157-166.
Knox, R. E., Clarke, F. R., Clarke, J. M., Fox, S. L., DePauw, R. M. and Singh, A. K. (2012). Enhancing the identification of genetic loci and transgressive segregants for preharvest sprouting resistance in a durum wheat population. Euphytica, 186, 193-206.
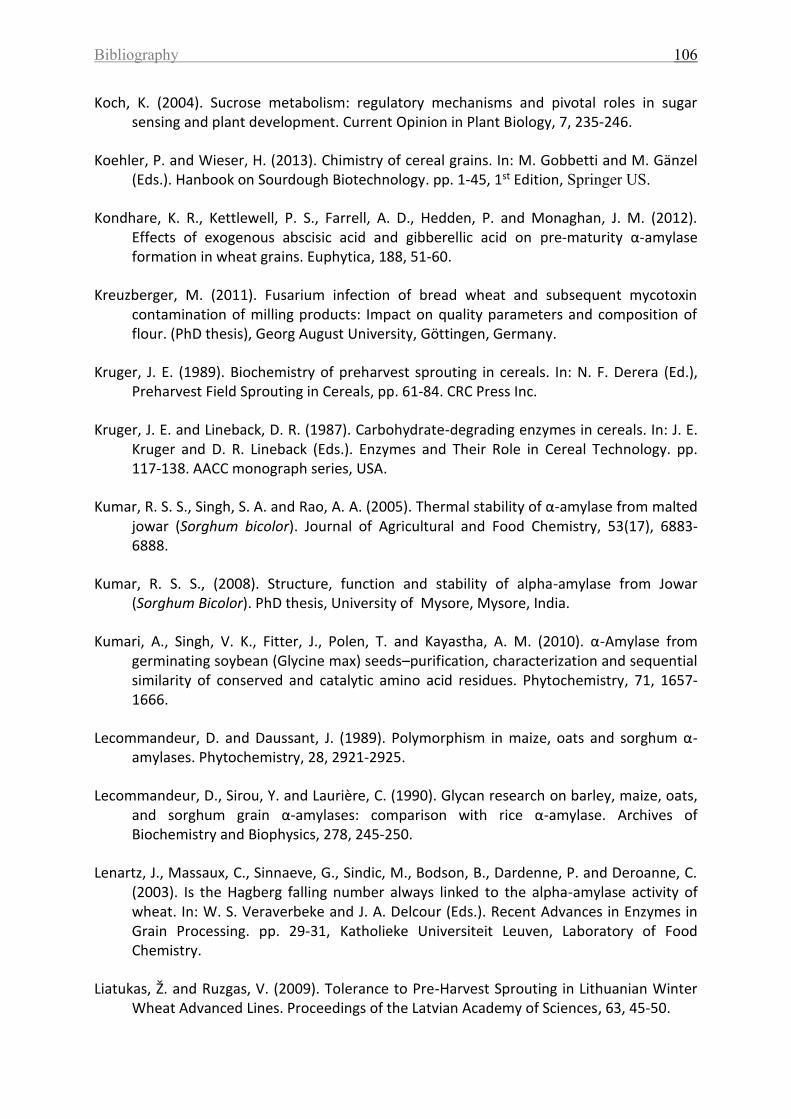
Bibliography 106
Koch, K. (2004). Sucrose metabolism: regulatory mechanisms and pivotal roles in sugar sensing and plant development. Current Opinion in Plant Biology, 7, 235-246.
Koehler, P. and Wieser, H. (2013). Chimistry of cereal grains. In: M. Gobbetti and M. Gänzel (Eds.). Hanbook on Sourdough Biotechnology. pp. 1-45, 1st Edition, Springer US.
Kondhare, K. R., Kettlewell, P. S., Farrell, A. D., Hedden, P. and Monaghan, J. M. (2012). Effects of exogenous abscisic acid and gibberellic acid on pre-maturity α-amylase formation in wheat grains. Euphytica, 188, 51-60.
Kreuzberger, M. (2011). Fusarium infection of bread wheat and subsequent mycotoxin contamination of milling products: Impact on quality parameters and composition of flour. (PhD thesis), Georg August University, Göttingen, Germany.
Kruger, J. E. (1989). Biochemistry of preharvest sprouting in cereals. In: N. F. Derera (Ed.), Preharvest Field Sprouting in Cereals, pp. 61-84. CRC Press Inc.
Kruger, J. E. and Lineback, D. R. (1987). Carbohydrate-degrading enzymes in cereals. In: J. E. Kruger and D. R. Lineback (Eds.). Enzymes and Their Role in Cereal Technology. pp. 117-138. AACC monograph series, USA.
Kumar, R. S. S., Singh, S. A. and Rao, A. A. (2005). Thermal stability of α-amylase from malted jowar (Sorghum bicolor). Journal of Agricultural and Food Chemistry, 53(17), 6883-6888.
Kumar, R. S. S., (2008). Structure, function and stability of alpha-amylase from Jowar (Sorghum Bicolor). PhD thesis, University of Mysore, Mysore, India.
Kumari, A., Singh, V. K., Fitter, J., Polen, T. and Kayastha, A. M. (2010). α-Amylase from germinating soybean (Glycine max) seeds–purification, characterization and sequential similarity of conserved and catalytic amino acid residues. Phytochemistry, 71, 1657-1666.
Lecommandeur, D. and Daussant, J. (1989). Polymorphism in maize, oats and sorghum α-amylases. Phytochemistry, 28, 2921-2925.
Lecommandeur, D., Sirou, Y. and Laurière, C. (1990). Glycan research on barley, maize, oats, and sorghum grain α-amylases: comparison with rice α-amylase. Archives of Biochemistry and Biophysics, 278, 245-250.
Lenartz, J., Massaux, C., Sinnaeve, G., Sindic, M., Bodson, B., Dardenne, P. and Deroanne, C. (2003). Is the Hagberg falling number always linked to the alpha-amylase activity of wheat. In: W. S. Veraverbeke and J. A. Delcour (Eds.). Recent Advances in Enzymes in Grain Processing. pp. 29-31, Katholieke Universiteit Leuven, Laboratory of Food Chemistry.
Liatukas, Ž. and Ruzgas, V. (2009). Tolerance to Pre-Harvest Sprouting in Lithuanian Winter Wheat Advanced Lines. Proceedings of the Latvian Academy of Sciences, 63, 45-50.
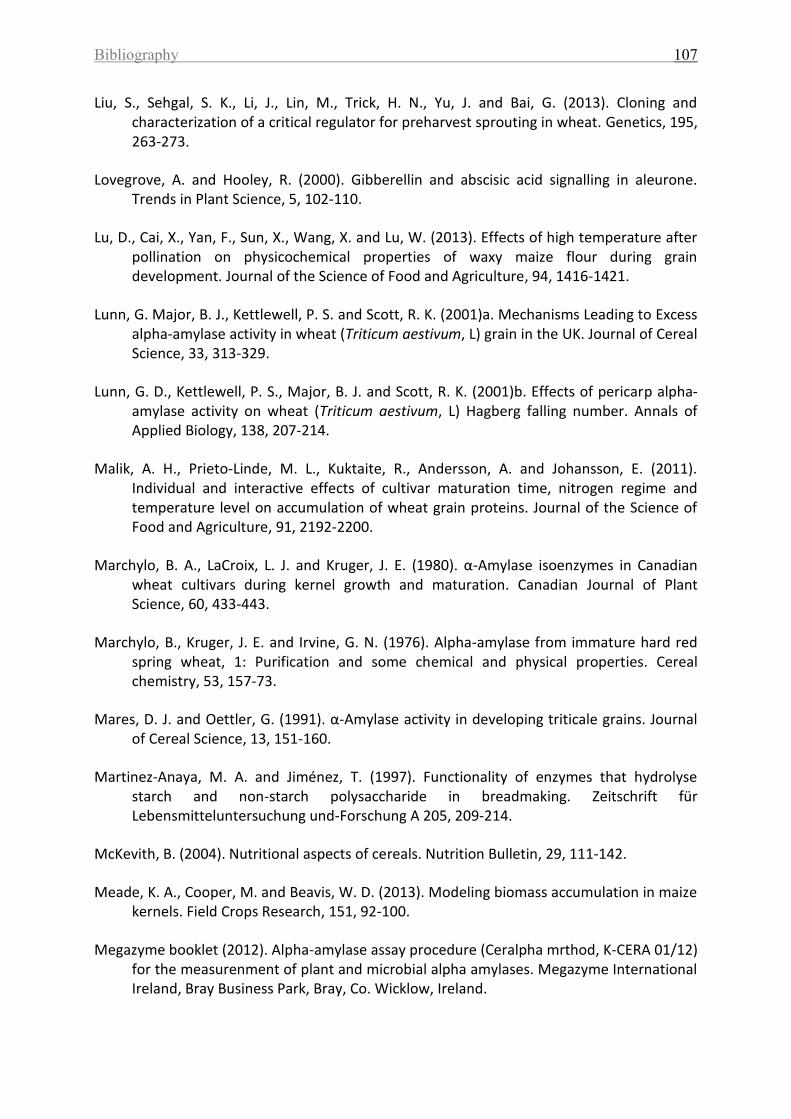
Bibliography 107
Liu, S., Sehgal, S. K., Li, J., Lin, M., Trick, H. N., Yu, J. and Bai, G. (2013). Cloning and characterization of a critical regulator for preharvest sprouting in wheat. Genetics, 195, 263-273.
Lovegrove, A. and Hooley, R. (2000). Gibberellin and abscisic acid signalling in aleurone. Trends in Plant Science, 5, 102-110.
Lu, D., Cai, X., Yan, F., Sun, X., Wang, X. and Lu, W. (2013). Effects of high temperature after pollination on physicochemical properties of waxy maize flour during grain development. Journal of the Science of Food and Agriculture, 94, 1416-1421.
Lunn, G. Major, B. J., Kettlewell, P. S. and Scott, R. K. (2001)a. Mechanisms Leading to Excess alpha-amylase activity in wheat (Triticum aestivum, L) grain in the UK. Journal of Cereal Science, 33, 313-329.
Lunn, G. D., Kettlewell, P. S., Major, B. J. and Scott, R. K. (2001)b. Effects of pericarp alpha‐amylase activity on wheat (Triticum aestivum, L) Hagberg falling number. Annals of Applied Biology, 138, 207-214.
Malik, A. H., Prieto‐Linde, M. L., Kuktaite, R., Andersson, A. and Johansson, E. (2011). Individual and interactive effects of cultivar maturation time, nitrogen regime and temperature level on accumulation of wheat grain proteins. Journal of the Science of Food and Agriculture, 91, 2192-2200.
Marchylo, B. A., LaCroix, L. J. and Kruger, J. E. (1980). α-Amylase isoenzymes in Canadian wheat cultivars during kernel growth and maturation. Canadian Journal of Plant Science, 60, 433-443.
Marchylo, B., Kruger, J. E. and Irvine, G. N. (1976). Alpha-amylase from immature hard red spring wheat, 1: Purification and some chemical and physical properties. Cereal chemistry, 53, 157-73.
Mares, D. J. and Oettler, G. (1991). α-Amylase activity in developing triticale grains. Journal of Cereal Science, 13, 151-160.
Martinez-Anaya, M. A. and Jiménez, T. (1997). Functionality of enzymes that hydrolyse starch and non-starch polysaccharide in breadmaking. Zeitschrift für Lebensmitteluntersuchung und-Forschung A 205, 209-214.
McKevith, B. (2004). Nutritional aspects of cereals. Nutrition Bulletin, 29, 111-142.
Meade, K. A., Cooper, M. and Beavis, W. D. (2013). Modeling biomass accumulation in maize kernels. Field Crops Research, 151, 92-100.
Megazyme booklet (2012). Alpha-amylase assay procedure (Ceralpha mrthod, K-CERA 01/12) for the measurenment of plant and microbial alpha amylases. Megazyme International Ireland, Bray Business Park, Bray, Co. Wicklow, Ireland.
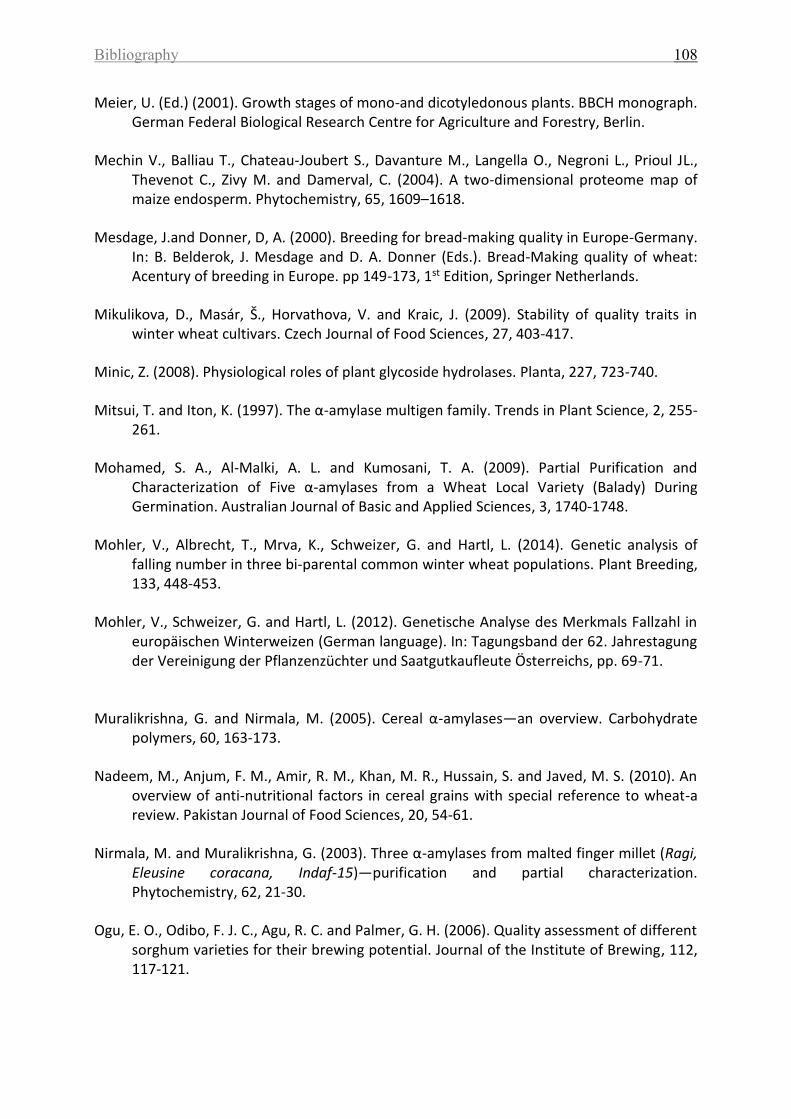
Bibliography 108
Meier, U. (Ed.) (2001). Growth stages of mono-and dicotyledonous plants. BBCH monograph. German Federal Biological Research Centre for Agriculture and Forestry, Berlin.
Mechin V., Balliau T., Chateau-Joubert S., Davanture M., Langella O., Negroni L., Prioul JL., Thevenot C., Zivy M. and Damerval, C. (2004). A two-dimensional proteome map of maize endosperm. Phytochemistry, 65, 1609–1618.
Mesdage, J.and Donner, D, A. (2000). Breeding for bread-making quality in Europe-Germany. In: B. Belderok, J. Mesdage and D. A. Donner (Eds.). Bread-Making quality of wheat: Acentury of breeding in Europe. pp 149-173, 1st Edition, Springer Netherlands.
Mikulikova, D., Masár, Š., Horvathova, V. and Kraic, J. (2009). Stability of quality traits in winter wheat cultivars. Czech Journal of Food Sciences, 27, 403-417.
Minic, Z. (2008). Physiological roles of plant glycoside hydrolases. Planta, 227, 723-740.
Mitsui, T. and Iton, K. (1997). The α-amylase multigen family. Trends in Plant Science, 2, 255-261.
Mohamed, S. A., Al-Malki, A. L. and Kumosani, T. A. (2009). Partial Purification and Characterization of Five α-amylases from a Wheat Local Variety (Balady) During Germination. Australian Journal of Basic and Applied Sciences, 3, 1740-1748.
Mohler, V., Albrecht, T., Mrva, K., Schweizer, G. and Hartl, L. (2014). Genetic analysis of falling number in three bi‐parental common winter wheat populations. Plant Breeding, 133, 448-453.
Mohler, V., Schweizer, G. and Hartl, L. (2012). Genetische Analyse des Merkmals Fallzahl in europäischen Winterweizen (German language). In: Tagungsband der 62. Jahrestagung der Vereinigung der Pflanzenzüchter und Saatgutkaufleute Österreichs, pp. 69-71.
Muralikrishna, G. and Nirmala, M. (2005). Cereal α-amylases—an overview. Carbohydrate polymers, 60, 163-173.
Nadeem, M., Anjum, F. M., Amir, R. M., Khan, M. R., Hussain, S. and Javed, M. S. (2010). An overview of anti-nutritional factors in cereal grains with special reference to wheat-a review. Pakistan Journal of Food Sciences, 20, 54-61.
Nirmala, M. and Muralikrishna, G. (2003). Three α-amylases from malted finger millet (Ragi, Eleusine coracana, Indaf-15)—purification and partial characterization. Phytochemistry, 62, 21-30.
Ogu, E. O., Odibo, F. J. C., Agu, R. C. and Palmer, G. H. (2006). Quality assessment of different sorghum varieties for their brewing potential. Journal of the Institute of Brewing, 112, 117-121.
Bibliography 109
Osanai, S. I., Amano, Y. and Mares, D. (2005). Development of highly sprouting tolerant wheat germplasm with reduced germination at low temperature. Euphytica, 143, 301-307.
Panesar, P. S., Marwaha, S. S. and Chopra. H. K. (2010). Fundamentals of enzymes. In: P.S. Panesar, S. S. Marwaha and H. K. Chopra (Eds.), Enzymes in Food Processing: Fundamentals and Potential Applications. pp 1-50. K. International Pvt Ltd.
Piasecka-Kwiatkowska, D., Madaj, D. and Warchalewski, J. R. (2007). The biological activity of wheat, rye and triticale varieties harvested in four consecutive years. Acta Scientiarum Polonorum, Technologia Alimentaria, 5, 55-66.
Plaut, Z., Butow, B. J., Blumenthal, C. S. and Wrigley, C. W. (2004). Transport of dry matter into developing wheat kernels and its contribution to grain yield under post-anthesis water deficit and elevated temperature. Field Crops Research, 86, 185-198.
Prakash, O. and Jaiswal, N. (2010). α-Amylase: an ideal representative of thermostable enzymes. Applied Biochemistry and Biotechnology, 160, 2401-2414.
Ranaldi, F., Vanni, P. and Giachetti, E. (1999). What students must know about the determination of enzyme kinetic parameters. Biochemical Education, 27, 87-91.
Rogers, A. and Gibon, Y. (2009). Enzyme kinetics: theory and practice. In: J. V. Shanks and J. Schwender (Eds.). Plant Metabolic Networks. pp. 71-103, 1st Edition, Springer-Verlag New York.
Rosa, M., Prado, C., Podazza, G., Interdonato, R., González, J. A., Hilal, M. and Prado, F. E. (2009). Soluble sugars: Metabolism, sensing and abiotic stress: A complex network in the life of plants. Plant Signaling and Behavior, 4, 388-393.
Rosell, C. M., Haros, M., Escrivá, C. and Benedito de Barber, C. (2001). Experimental approach to optimize the use of α-amylases in breadmaking. Journal of Agricultural and Food Chemistry, 49, 2973-2977.
Sala, R. G., Andrade, F. H. and Westgate, M. E. (2007). Maize kernel moisture at physiological maturity as affected by the source–sink relationship during grain filling. Crop Science, 47, 711-714.
San Segundo, B., Ma Casacuberta, J. and Puigdomènech, P. (1990). Hormonal and light regulation of the multiple amylase isozymes during seed germination and in vegetative tissues of Zea mays. Plant Science, 69, 167-177.
Santos, C. T. D., Dalpasquale, V. A., Scapim, C. A. and Krzyzanowski, F. C. (2005). Milk line as an indicator of the harvesting time of three hybrid seeds of corn (Zea mays L.). Brazilian Archives of Biology and Technology, 48, 161-170.
Sanwo, M. M. and DeMason, D. A. (1992). Characteristics of α-amylase during germination of two high-sugar sweet corn cultivars of Zea mays L. Plant Physiology, 99, 1184-1192.
Bibliography 110
Schramm, E. C., Nelson, S. K., Kidwell, K. K. and Steber, C. M. (2013). Increased ABA sensitivity results in higher seed dormancy in soft white spring wheat cultivar ‘Zak’. Theoretical and Applied Genetics, 126, 791-803.
Serva Electrophoresis protocol. Instruction manual FocusGel. http://www.serva.de/www_root/documents/FocusGel.pdf. [Accessed on Febraury 2014].
Sharma, A. and Gupta, M. N. (2001). Three phase partitioning as a large-scale separation method for purification of a wheat germ bifunctional protease/amylase inhibitor. Process Biochemistry, 37, 193-196.
She, M., Ye, X., Yan, Y., Howit, C., Belgard, M. and Ma, W. (2011). Gene networks in the synthesis and deposition of protein polymers during grain development of wheat. Functional and Integrative Genomics, 11, 23-35.
Shewry, P. R. (2006). Improving protein content and quality of temperate cereals: Wheat, barley andrye. In: R.M. Welch, I. Çakmak (Eds.), Impacts of Agriculture on Human Health and Nutrition, Encyclopedia Of Life Support Systems (EOLSS), Developed under the Auspices of the UNESCO, Eolss Publishers, Oxford ,UK, [http://www.eolss.net].
Shewry, P. R. (2009). Wheat. Journal of Experimental Botany, 60, 1537-1553.
Sidhu, P. and Singh, R. (2002). Bioregulation of carbohydrate metabolism in relation to source-sink operation during grain-filling phase of growth in wheat. Indian Journal of Experimental Biology, 40, 1060-1066.
Sinha, P. (Ed.). (2004). Modern Plant Physiology. pp. 145-175, 1st Edition, CRC Press.
Sigma-Aldrich protocol (2010). Enzymatic Assay of α-amylase (EC 3.2.1.1). http://www.sigmaaldrich.com/technical-documents/protocols/biology/enzymatic-assay-of-a-amylase.html. [Accessed on March 2014].
Sigma-Aldrich (2014). Carbohyrate analysis, α-amylase. http://www.sigmaaldrich.com/life science/metabolomics/enzyme-explorer/learning-center/carbohydrate-analysis.html. [Accessed on June 2014].
Silvanovich, M. P. and Hill, R. D. (1977). α- amylase from triticale 6Al90: purification and characterization . Cereal Chem, 54, 1270-1281.
Simsek, S., Ohm, J. B., Lu, H., Rugg, M., Berzonsky, W., Alamri, M. S. and Mergoum, M. (2014). Effect of pre‐harvest sprouting on physicochemical changes of proteins in wheat. Journal of the Science of Food and Agriculture, 94, 205-212.
Singh, C. B., Jayas, D.S., Paliwal, J. and White, N. D. (2008). Detection of sprouted and midge-damage wheat kernel using near-infrared hyperspectral imagaing. Biosystems. The Canadian Society for Bioengeneering. Paper No. 198.
Bibliography 111
Smith, G. P. and Gooding, M. J. (1999). Models of wheat grain quality considering climate, cultivar and nitrogen effects. Agricultural and Forest Meteorology, 94, 159-170.
Sramkova, Z., Gregová, E. andŠturdík, E. (2009). Chemical composition and nutritional quality of wheat grain. Acta Chimica Slovaca, 2, 115-138.
Sridhar, G., Nath, V., Srivastava, G. C. and Kumari, S. (2005). Carbohydrate accumulation in developing grains of wheat genotypes. Indian Journal of Plant Physiology, 10, 199-201.
Stanley, D., Farnden, K. J. and MacRae, E. A. (2005). Plant α-amylases: functions and roles in carbohydrate metabolism. Biologia, Bratislava, 60, 65-71.
Stevenson, L., Phillips, F., O'sullivan, K. and Walton, J. (2012). Wheat bran: its composition and benefits to health, a European perspective. International Journal of Food Sciences and Nutrition, 63, 1001-1013.
Taylor, J., Dlamini, B. C. and Kruger, J. (2013). 125th Anniversary Review: The science of the tropical cereals sorghum, maize and rice in relation to lager beer brewing. Journal of the Institute of Brewing, 19, 1-14.
Terashima, M., Kubo, A., Suzawa, M., Itoh, Y. and Katoh, S. (1994). The Roles of the N‐linked Carbohydrate Chain of Rice α‐Amylase in Thermostability and Enzyme Kinetics. European Journal of Biochemistry, 226, 249-254.
Tetlow, I. J. (2011). Starch biosynthesis in developing seeds. Seed Science Research, 21, 5-32.
Thakur, P., Kumar, S., Malik, J. A., Berger, J. D. and Nayyar, H. (2010). Cold stress effects on reproductive development in grain crops: an overview. Environmental and Experimental Botany, 67, 429-443.
Thevenot ,C., Lauriere, C., Mayer, C., Simond-Cote, E. and Daussant, J. (1992). α-Amylase changes during development and germination of maize kernels. Journal of Plant Physiology, 140, 61-65.
Tillmann, M. (2013). Fusarium-Artenspektren an Halmbasis und Körnern von Weizen in unterschiedlichen Weizenfruchtfolgen. (PhD thesis) in German language, Georg August University, Göttingen, Germany.
Triboi, E. and Triboi-Blondel, A. M. (2002). Productivity and grain or seed composition: a new approach to an old problem—invited paper. European Journal of Agronomy, 16, 163-186.
Usha, B., Krishna Veni G., Muni Kumar D. and Hemalatha K.P.J. (2011). Partial characterization of α-amylase from germinating little millets (Panicum sumatrense). Journal of Phytology, 3, 1-8
Bibliography 112
Wahl, Y. I. and O’Rourke, A. D. (1994). The economic of sprout damage in Wheat. In: M. K. Walker-Simmons and J. L. Ried (Eds.). Preharvest Sprouting in Cereals. pp. 10-17, American Association of Cereal Chemists.
Wang, J., Pawelzik, E., Weinert, J., Zhao, Q. and Wolf, G. A. (2008). Factors influencing falling number in winter wheat. European Food Research and Technology, 226, 1365-1371.
Warner, D. A., Grove, M. J. and Knutson, C. A. (1991). Isolation and characterization of alpha-amylases from endosperm of germinating maize. Cereal chemistry, 68, 383-390.
Watson, S. A. and Ramstad, P. E. (Eds). (1994). Corn: Chemistry and Technology. American Association of Cereal Chemists, St. Paul, Minnesota, USA.
Weichert, N., Saalbach, I., Weichert, H., Kohl, S., Erban, A., Kopka, J. and Weber, H. (2010). Increasing sucrose uptake capacity of wheat grains stimulates storage protein synthesis. Plant Physiology, 152, 698-710.
Weidner, S., Amarowicz, R., Karamać, M. and Dąbrowski, G. (1999). Phenolic acids in caryopses of two cultivars of wheat, rye and triticale that display different resistance to pre-harvest sprouting. European Food Research and Technology, 210, 109-113.
Weidner, S., Krupa, U., Amarowicz, R., Karamac, M. and Abe, S. (2002). Phenolic compounds in embryos of triticale caryopses at different stages of development and maturation in normal environment and after dehydration treatment. Euphytica, 126, 115-122.
Williams, R. M., O'Brien, L., Eagles, H. A., Solah, V. A. andJayasena, V. (2008). The influences of genotype, environment, and genotype × environment interaction on wheat quality. Crop and Pasture Science, 59, 95-111.
Wrigley, C. W., Khan, K. and Shewry, P. R. (2009). Wheat: a unique grain for the world. In: K. Khan and P. R. Shewry (Eds). Wheat: Chemistry and Technology. pp. 1-17, American Association of Cereal Chemists, St. Paul, Minnesota, USA.
Wu, F. and Guclu, H. (2013).Global maize trade and food security: implicationsfrom a social network model. Risk Analysis, 33, 2168–2178.
Xia, L. Q., Yang, Y., Ma, Y. Z., Chen, X. M., He, Z. H., Röder, M. S. and Shewry, P. R. (2009). What can the Viviparous-1 gene tell us about wheat pre-harvest sprouting? Euphytica, 168, 385-394.
Xing, J., Van Hung, P., Symons, S., Shahin, M. and Hatcher, D. (2009). Using a Short Wavelength Infrared (SWIR) hyperspectral imaging system to predict alpha amylase activity in individual Canadian western wheat kernels. Sensing and Instrumentation for Food Quality and Safety, 3, 211-218.
Xiao, Z., Storms, R. and Tsang, A. (2006). A quantitative starch–iodine method for measuring alpha-amylase and glucoamylase activities. Analytical Biochemistry, 351, 146-148.
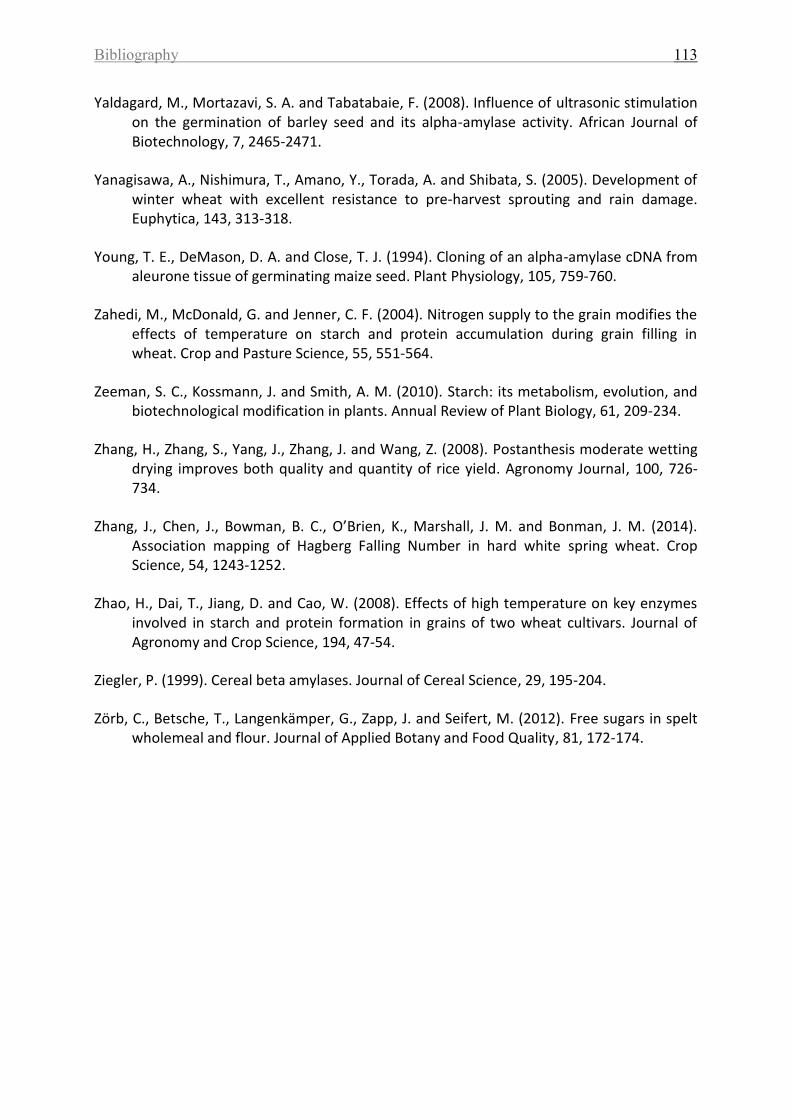
Bibliography 113
Yaldagard, M., Mortazavi, S. A. and Tabatabaie, F. (2008). Influence of ultrasonic stimulation on the germination of barley seed and its alpha-amylase activity. African Journal of Biotechnology, 7, 2465-2471.
Yanagisawa, A., Nishimura, T., Amano, Y., Torada, A. and Shibata, S. (2005). Development of winter wheat with excellent resistance to pre-harvest sprouting and rain damage. Euphytica, 143, 313-318.
Young, T. E., DeMason, D. A. and Close, T. J. (1994). Cloning of an alpha-amylase cDNA from aleurone tissue of germinating maize seed. Plant Physiology, 105, 759-760.
Zahedi, M., McDonald, G. and Jenner, C. F. (2004). Nitrogen supply to the grain modifies the effects of temperature on starch and protein accumulation during grain filling in wheat. Crop and Pasture Science, 55, 551-564.
Zeeman, S. C., Kossmann, J. and Smith, A. M. (2010). Starch: its metabolism, evolution, and biotechnological modification in plants. Annual Review of Plant Biology, 61, 209-234.
Zhang, H., Zhang, S., Yang, J., Zhang, J. and Wang, Z. (2008). Postanthesis moderate wetting drying improves both quality and quantity of rice yield. Agronomy Journal, 100, 726-734.
Zhang, J., Chen, J., Bowman, B. C., O’Brien, K., Marshall, J. M. and Bonman, J. M. (2014). Association mapping of Hagberg Falling Number in hard white spring wheat. Crop Science, 54, 1243-1252.
Zhao, H., Dai, T., Jiang, D. and Cao, W. (2008). Effects of high temperature on key enzymes involved in starch and protein formation in grains of two wheat cultivars. Journal of Agronomy and Crop Science, 194, 47-54.
Ziegler, P. (1999). Cereal beta amylases. Journal of Cereal Science, 29, 195-204.
Zörb, C., Betsche, T., Langenkämper, G., Zapp, J. and Seifert, M. (2012). Free sugars in spelt wholemeal and flour. Journal of Applied Botany and Food Quality, 81, 172-174.
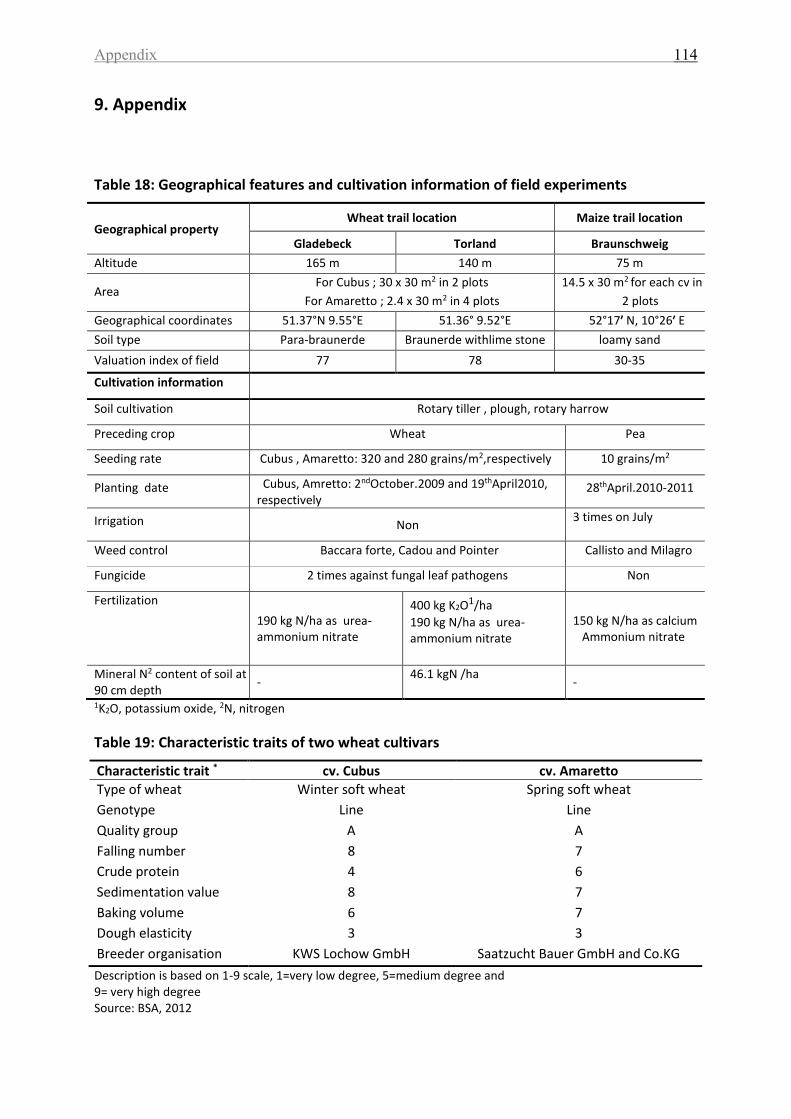
Appendix 114
9. Appendix
Table 18: Geographical features and cultivation information of field experiments
Geographical property Wheat trail location Maize trail location
Gladebeck Torland Braunschweig
Altitude 165 m 140 m 75 m
Area For Cubus ; 30 x 30 m2 in 2 plots
For Amaretto ; 2.4 x 30 m2 in 4 plots
14.5 x 30 m2 for each cv in
2 plots
Geographical coordinates 51.37°N 9.55°E 51.36° 9.52°E 52°17′ N, 10°26′ E
Soil type Para-braunerde Braunerde withlime stone loamy sand
Valuation index of field 77 78 30-35
Cultivation information
Soil cultivation Rotary tiller , plough, rotary harrow
Preceding crop Wheat Pea
Seeding rate Cubus , Amaretto: 320 and 280 grains/m2,respectively 10 grains/m2
Planting date Cubus, Amretto: 2ndOctober.2009 and 19thApril2010, respectively
28thApril.2010-2011
Irrigation Non 3 times on July
Weed control Baccara forte, Cadou and Pointer Callisto and Milagro
Fungicide 2 times against fungal leaf pathogens Non
Fertilization
190 kg N/ha as urea- ammonium nitrate
400 kg K2O1/ha
190 kg N/ha as urea- ammonium nitrate
150 kg N/ha as calcium Ammonium nitrate
Mineral N2 content of soil at 90 cm depth
- 46.1 kgN /ha
-
1K2O, potassium oxide, 2N, nitrogen
Table 19: Characteristic traits of two wheat cultivars
Characteristic trait * cv. Cubus cv. Amaretto
Type of wheat Winter soft wheat Spring soft wheat
Genotype Line Line
Quality group A A
Falling number 8 7
Crude protein 4 6
Sedimentation value 8 7
Baking volume 6 7
Dough elasticity 3 3
Breeder organisation KWS Lochow GmbH Saatzucht Bauer GmbH and Co.KG
Description is based on 1-9 scale, 1=very low degree, 5=medium degree and 9= very high degree Source: BSA, 2012
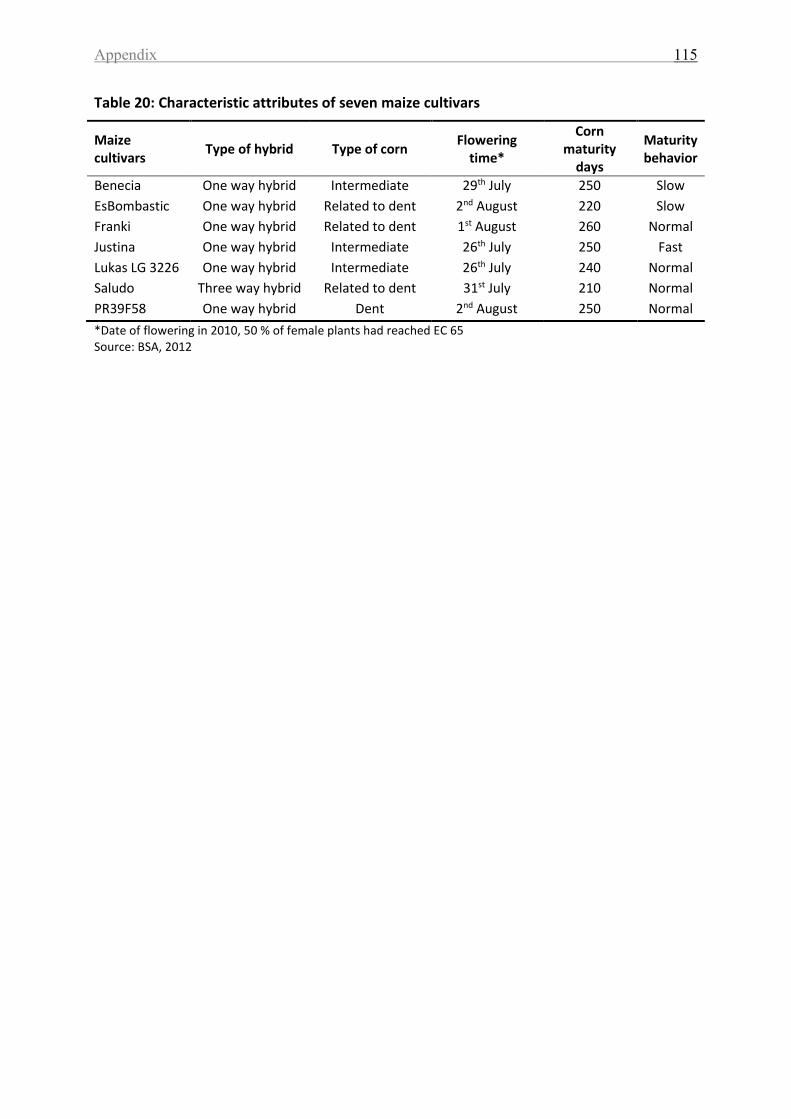
Appendix 115
Table 20: Characteristic attributes of seven maize cultivars
Maize cultivars
Type of hybrid Type of corn Flowering
time*
Corn maturity
days
Maturity behavior
Benecia One way hybrid Intermediate 29th July 250 Slow
EsBombastic One way hybrid Related to dent 2nd August 220 Slow
Franki One way hybrid Related to dent 1st August 260 Normal
Justina One way hybrid Intermediate 26th July 250 Fast
Lukas LG 3226 One way hybrid Intermediate 26th July 240 Normal
Saludo Three way hybrid Related to dent 31st July 210 Normal
PR39F58 One way hybrid Dent 2nd August 250 Normal
*Date of flowering in 2010, 50 % of female plants had reached EC 65 Source: BSA, 2012
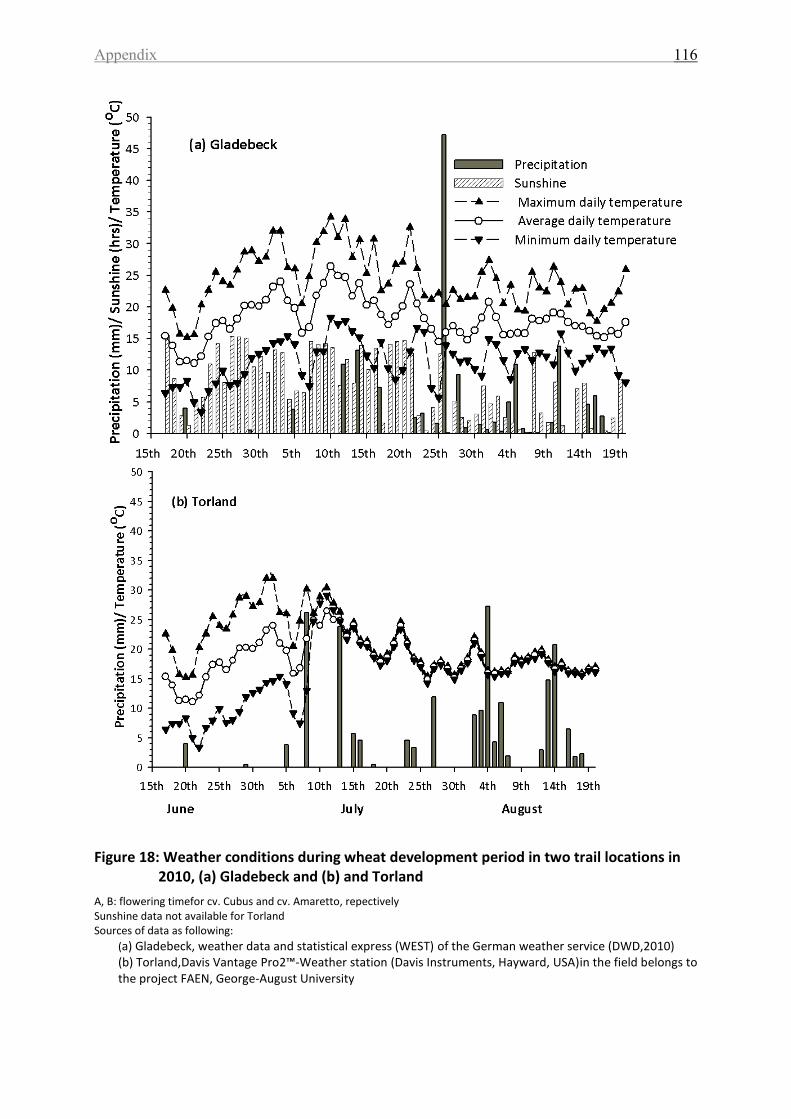
Appendix 116
Figure 18: Weather conditions during wheat development period in two trail locations in 2010, (a) Gladebeck and (b) and Torland
A, B: flowering timefor cv. Cubus and cv. Amaretto, repectively Sunshine data not available for Torland Sources of data as following:
(a) Gladebeck, weather data and statistical express (WEST) of the German weather service (DWD,2010) (b) Torland,Davis Vantage Pro2™-Weather station (Davis Instruments, Hayward, USA)in the field belongs to the project FAEN, George-August University
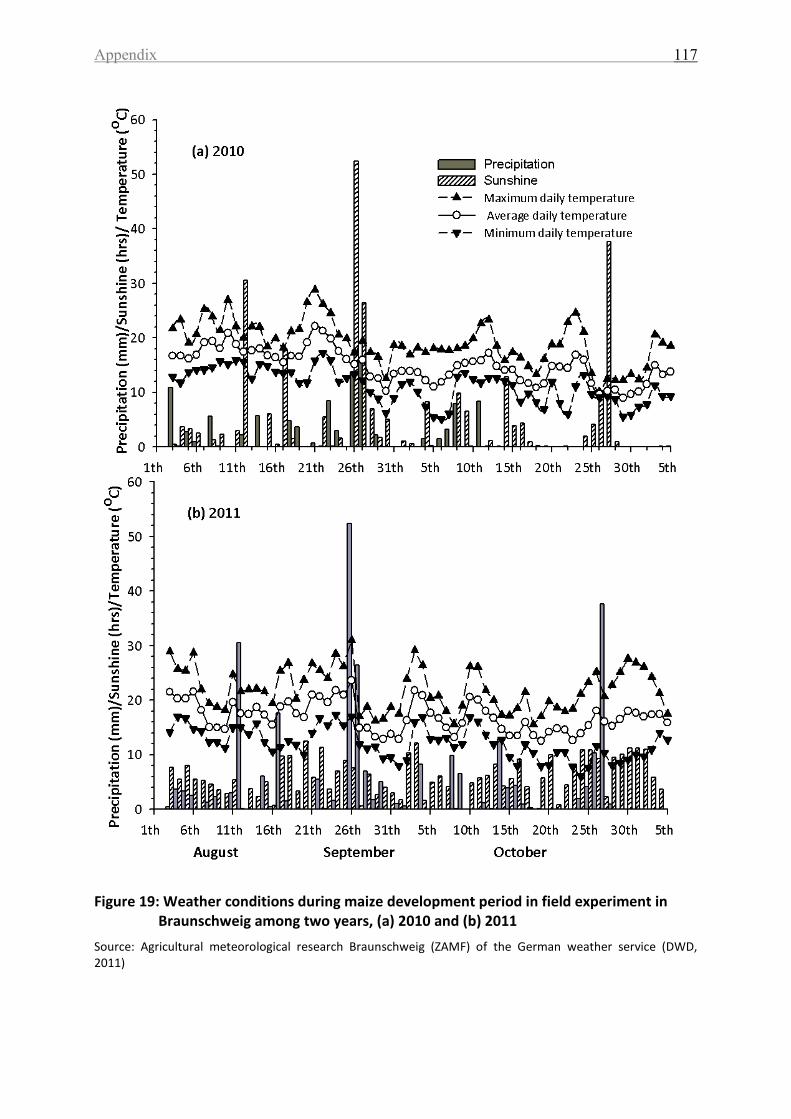
Appendix 117
Figure 19: Weather conditions during maize development period in field experiment in Braunschweig among two years, (a) 2010 and (b) 2011
Source: Agricultural meteorological research Braunschweig (ZAMF) of the German weather service (DWD, 2011)
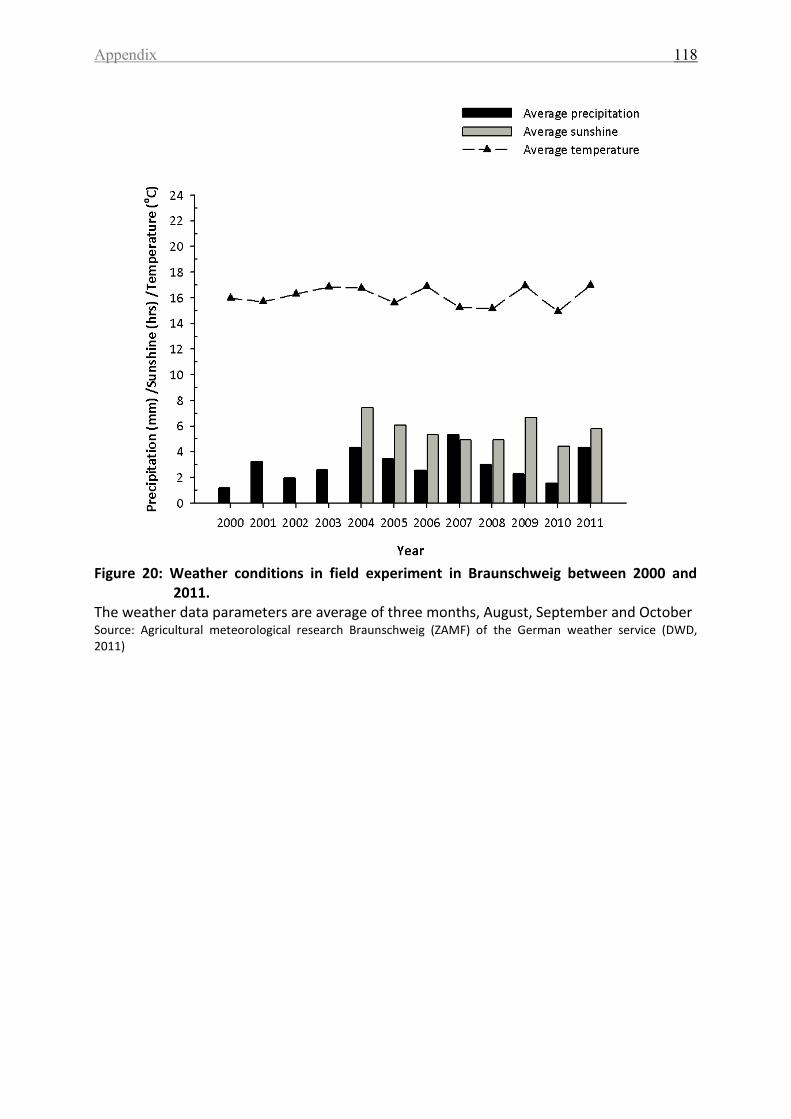
Appendix 118
Figure 20: Weather conditions in field experiment in Braunschweig between 2000 and
2011. The weather data parameters are average of three months, August, September and October Source: Agricultural meteorological research Braunschweig (ZAMF) of the German weather service (DWD, 2011)
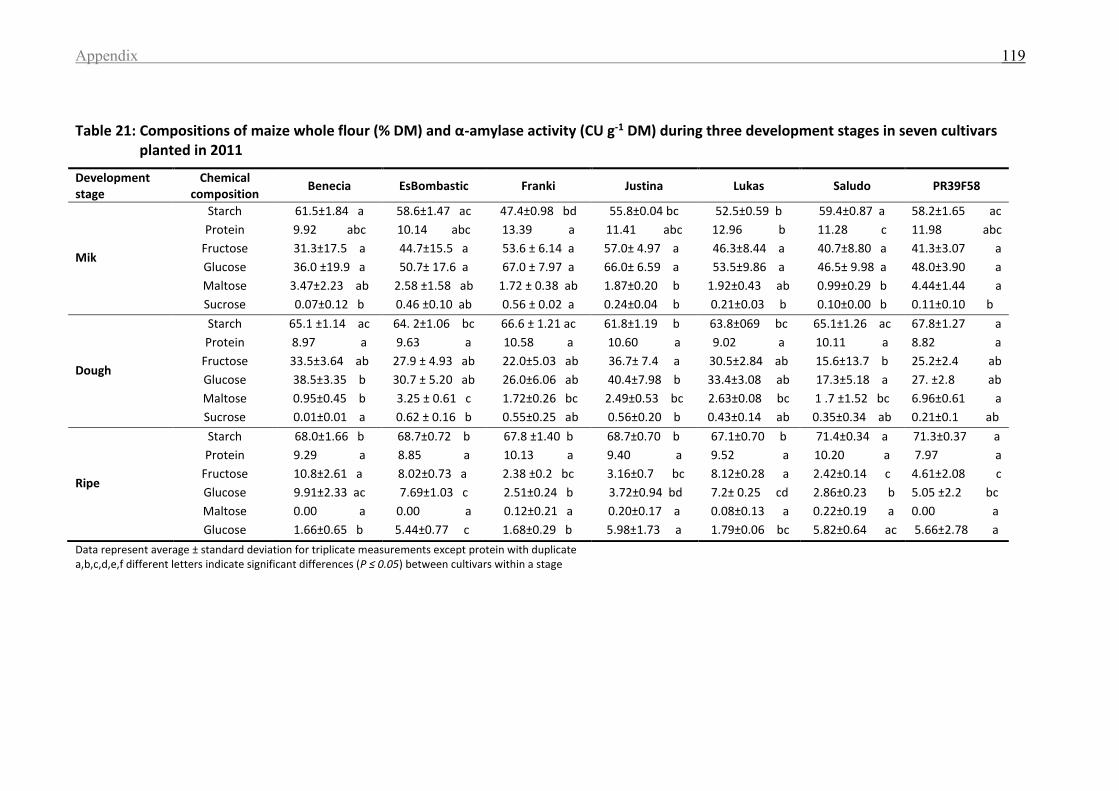
Appendix 119
Table 21: Compositions of maize whole flour (% DM) and α-amylase activity (CU g-1 DM) during three development stages in seven cultivars planted in 2011
Development stage
Chemical composition
Benecia EsBombastic Franki Justina Lukas Saludo PR39F58
Mik
Starch
Protein
Fructose
Glucose
Maltose
Sucrose
61.5±1.84 a
9.92 abc
31.3±17.5 a
36.0 ±19.9 a
3.47±2.23 ab
0.07±0.12 b
58.6±1.47 ac
10.14 abc
44.7±15.5 a
50.7± 17.6 a
2.58 ±1.58 ab
0.46 ±0.10 ab
47.4±0.98 bd
13.39 a
53.6 ± 6.14 a
67.0 ± 7.97 a
1.72 ± 0.38 ab
0.56 ± 0.02 a
55.8±0.04 bc
11.41 abc
57.0± 4.97 a
66.0± 6.59 a
1.87±0.20 b
0.24±0.04 b
52.5±0.59 b
12.96 b
46.3±8.44 a
53.5±9.86 a
1.92±0.43 ab
0.21±0.03 b
59.4±0.87 a
11.28 c
40.7±8.80 a
46.5± 9.98 a
0.99±0.29 b
0.10±0.00 b
58.2±1.65 ac
11.98 abc
41.3±3.07 a
48.0±3.90 a
4.44±1.44 a
0.11±0.10 b
Dough
Starch
Protein
Fructose
Glucose
Maltose
Sucrose
65.1 ±1.14 ac
8.97 a
33.5±3.64 ab
38.5±3.35 b
0.95±0.45 b
0.01±0.01 a
64. 2±1.06 bc
9.63 a
27.9 ± 4.93 ab
30.7 ± 5.20 ab
3.25 ± 0.61 c
0.62 ± 0.16 b
66.6 ± 1.21 ac
10.58 a
22.0±5.03 ab
26.0±6.06 ab
1.72±0.26 bc
0.55±0.25 ab
61.8±1.19 b
10.60 a
36.7± 7.4 a
40.4±7.98 b
2.49±0.53 bc
0.56±0.20 b
63.8±069 bc
9.02 a
30.5±2.84 ab
33.4±3.08 ab
2.63±0.08 bc
0.43±0.14 ab
65.1±1.26 ac
10.11 a
15.6±13.7 b
17.3±5.18 a
1 .7 ±1.52 bc
0.35±0.34 ab
67.8±1.27 a
8.82 a
25.2±2.4 ab
27. ±2.8 ab
6.96±0.61 a
0.21±0.1 ab
Ripe
Starch
Protein
Fructose
Glucose
Maltose
Glucose
68.0±1.66 b
9.29 a
10.8±2.61 a
9.91±2.33 ac
0.00 a
1.66±0.65 b
68.7±0.72 b
8.85 a
8.02±0.73 a
7.69±1.03 c
0.00 a
5.44±0.77 c
67.8 ±1.40 b
10.13 a
2.38 ±0.2 bc
2.51±0.24 b
0.12±0.21 a
1.68±0.29 b
68.7±0.70 b
9.40 a
3.16±0.7 bc
3.72±0.94 bd
0.20±0.17 a
5.98±1.73 a
67.1±0.70 b
9.52 a
8.12±0.28 a
7.2± 0.25 cd
0.08±0.13 a
1.79±0.06 bc
71.4±0.34 a
10.20 a
2.42±0.14 c
2.86±0.23 b
0.22±0.19 a
5.82±0.64 ac
71.3±0.37 a
7.97 a
4.61±2.08 c
5.05 ±2.2 bc
0.00 a
5.66±2.78 a
Data represent average ± standard deviation for triplicate measurements except protein with duplicate a,b,c,d,e,f different letters indicate significant differences (P ≤ 0.05) between cultivars within a stage
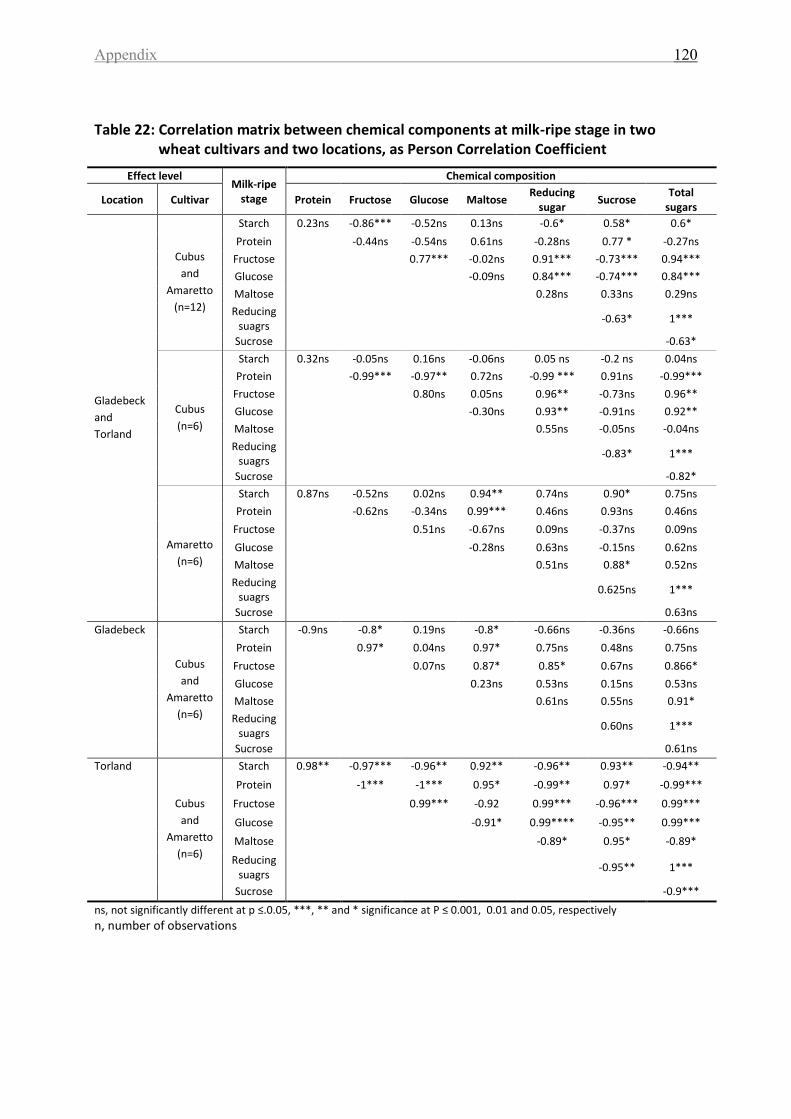
Appendix 120
Table 22: Correlation matrix between chemical components at milk-ripe stage in two wheat cultivars and two locations, as Person Correlation Coefficient
Effect level Milk-ripe
stage
Chemical composition
Location Cultivar Protein Fructose Glucose Maltose Reducing
sugar Sucrose
Total sugars
Gladebeck
and
Torland
Cubus
and
Amaretto
(n=12)
Starch 0.23ns -0.86*** -0.52ns 0.13ns -0.6* 0.58* 0.6*
Protein -0.44ns -0.54ns 0.61ns -0.28ns 0.77 * -0.27ns
Fructose 0.77*** -0.02ns 0.91*** -0.73*** 0.94***
Glucose -0.09ns 0.84*** -0.74*** 0.84***
Maltose 0.28ns 0.33ns 0.29ns
Reducing suagrs
-0.63* 1***
Sucrose -0.63*
Cubus
(n=6)
Starch 0.32ns -0.05ns 0.16ns -0.06ns 0.05 ns -0.2 ns 0.04ns
Protein -0.99*** -0.97** 0.72ns -0.99 *** 0.91ns -0.99***
Fructose 0.80ns 0.05ns 0.96** -0.73ns 0.96**
Glucose -0.30ns 0.93** -0.91ns 0.92**
Maltose 0.55ns -0.05ns -0.04ns
Reducing suagrs
-0.83* 1***
Sucrose -0.82*
Amaretto
(n=6)
Starch 0.87ns -0.52ns 0.02ns 0.94** 0.74ns 0.90* 0.75ns
Protein -0.62ns -0.34ns 0.99*** 0.46ns 0.93ns 0.46ns
Fructose 0.51ns -0.67ns 0.09ns -0.37ns 0.09ns
Glucose -0.28ns 0.63ns -0.15ns 0.62ns
Maltose 0.51ns 0.88* 0.52ns
Reducing suagrs
0.625ns 1***
Sucrose 0.63ns
Gladebeck
Cubus
and
Amaretto
(n=6)
Starch -0.9ns -0.8* 0.19ns -0.8* -0.66ns -0.36ns -0.66ns
Protein 0.97* 0.04ns 0.97* 0.75ns 0.48ns 0.75ns
Fructose 0.07ns 0.87* 0.85* 0.67ns 0.866*
Glucose 0.23ns 0.53ns 0.15ns 0.53ns
Maltose 0.61ns 0.55ns 0.91*
Reducing suagrs
0.60ns 1***
Sucrose 0.61ns
Torland
Cubus
and
Amaretto
(n=6)
Starch 0.98** -0.97*** -0.96** 0.92** -0.96** 0.93** -0.94**
Protein -1*** -1*** 0.95* -0.99** 0.97* -0.99***
Fructose 0.99*** -0.92 0.99*** -0.96*** 0.99***
Glucose -0.91* 0.99**** -0.95** 0.99***
Maltose -0.89* 0.95* -0.89*
Reducing suagrs
-0.95** 1***
Sucrose -0.9***
ns, not significantly different at p ≤.0.05, ***, ** and * significance at P ≤ 0.001, 0.01 and 0.05, respectively n, number of observations
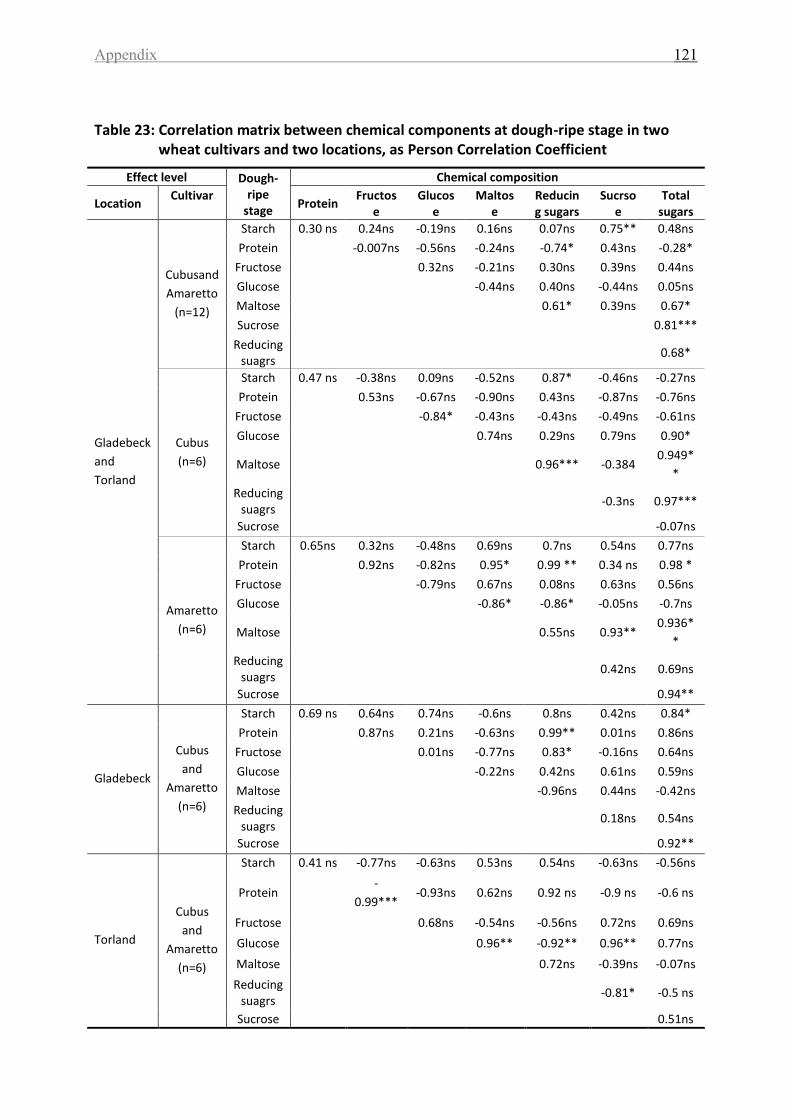
Appendix 121
Table 23: Correlation matrix between chemical components at dough-ripe stage in two wheat cultivars and two locations, as Person Correlation Coefficient
Effect level Dough-ripe
stage
Chemical composition
Location Cultivar
Protein Fructos
e Glucos
e Maltos
e Reducing sugars
Sucrsoe
Total sugars
Gladebeck
and
Torland
Cubusand
Amaretto
(n=12)
Starch 0.30 ns 0.24ns -0.19ns 0.16ns 0.07ns 0.75** 0.48ns
Protein -0.007ns -0.56ns -0.24ns -0.74* 0.43ns -0.28*
Fructose 0.32ns -0.21ns 0.30ns 0.39ns 0.44ns
Glucose -0.44ns 0.40ns -0.44ns 0.05ns
Maltose 0.61* 0.39ns 0.67*
Sucrose 0.81***
Reducing suagrs
0.68*
Cubus
(n=6)
Starch 0.47 ns -0.38ns 0.09ns -0.52ns 0.87* -0.46ns -0.27ns
Protein 0.53ns -0.67ns -0.90ns 0.43ns -0.87ns -0.76ns
Fructose -0.84* -0.43ns -0.43ns -0.49ns -0.61ns
Glucose 0.74ns 0.29ns 0.79ns 0.90*
Maltose 0.96*** -0.384 0.949*
*
Reducing suagrs
-0.3ns 0.97***
Sucrose -0.07ns
Amaretto
(n=6)
Starch 0.65ns 0.32ns -0.48ns 0.69ns 0.7ns 0.54ns 0.77ns
Protein 0.92ns -0.82ns 0.95* 0.99 ** 0.34 ns 0.98 *
Fructose -0.79ns 0.67ns 0.08ns 0.63ns 0.56ns
Glucose -0.86* -0.86* -0.05ns -0.7ns
Maltose 0.55ns 0.93** 0.936*
*
Reducing suagrs
0.42ns 0.69ns
Sucrose 0.94**
Gladebeck
Cubus
and
Amaretto
(n=6)
Starch 0.69 ns 0.64ns 0.74ns -0.6ns 0.8ns 0.42ns 0.84*
Protein 0.87ns 0.21ns -0.63ns 0.99** 0.01ns 0.86ns
Fructose 0.01ns -0.77ns 0.83* -0.16ns 0.64ns
Glucose -0.22ns 0.42ns 0.61ns 0.59ns
Maltose -0.96ns 0.44ns -0.42ns
Reducing suagrs
0.18ns 0.54ns
Sucrose 0.92**
Torland
Cubus
and
Amaretto
(n=6)
Starch 0.41 ns -0.77ns -0.63ns 0.53ns 0.54ns -0.63ns -0.56ns
Protein -
0.99*** -0.93ns 0.62ns 0.92 ns -0.9 ns -0.6 ns
Fructose 0.68ns -0.54ns -0.56ns 0.72ns 0.69ns
Glucose 0.96** -0.92** 0.96** 0.77ns
Maltose 0.72ns -0.39ns -0.07ns
Reducing suagrs
-0.81* -0.5 ns
Sucrose 0.51ns

Appendix 122
For symbol explanation see legend of Table 22
Table 24: Correlation matrix between chemical components at mature-harvest stage in two wheat cultivars and two locations, as Person Correlation Coefficient
Effect level Mature-harvest stage
Chemical composition
Location Cultivar Protein Fructose Glucose Maltose Reducing
sugars Sucrose
Total sugars
Gladebeck
and
Torland
Cubus
and
Amaretto
(n=12)
Starch -0.5ns 0.63* 0.38ns 0.91*** 0.8 *** 0.07 ns 0.8***
Protein -0.19ns 0.18ns -0.63ns -0.49 ns 0.66ns -0.41ns
Fructose 0.91*** 0.71** 0.84*** 0.43ns 0.87***
Glucose 0.43ns 0.62* 0.64* 0.68*
Maltose 0.97*** -0.08ns 0.95***
Reducing suagrs
0.99***
Sucrose 0.18 ns
Cubus
(n=6)
Starch -0.87* -0.52ns 0.02ns 0.94** 0.74ns -0.90* 0.75ns
Protein -0.62ns -0.3ns 0.99** -0.46ns 0.93ns 0.46ns
Fructose 0.51ns -0.67ns 0.09ns -0.37ns 0.09ns
Glucose -0.28ns 0.63ns -0.15ns 0.62ns
Maltose 0.51ns 0.88* 0.52ns
Reducing suagrs
-0.6 ns 0.99***
Sucrose 0.63ns
Amaretto
(n=6)
Starch 0.97 * 0.45ns 0.39ns 0.82* 0.69ns 0.77ns 0.70 ns
Protein 0.44ns 0.57ns 0.91ns 0.81ns 0.89ns 0.82ns
Fructose 0.96** 0.69ns 0.89* 0.84* 0.89*
Glucose 0.67ns 0.89* 0.85* 0.89*
Maltose 0.93*** 0.95** 0.93**
Reducing suagrs
0.98*** 1***
Sucrose 0.99*
Gladebeck
Cubus
and
Amaretto
(n=6)
Starch 0.03ns -0.37ns -0.31ns 0.37ns -0.13ns 0.21ns -0.05ns
Protein 0.41ns 0.58ns -0.38ns 0.52 ns 0.82 ns 0.62 ns
Fructose 0.97*** 0.22ns 0.91* 0.73ns 0.91*
Glucose 0.29ns 0.94** 0.78ns 0.95**
Maltose 0.59ns 0.172ns 0.52ns
Reducing suagrs
0.72ns 0.98 ***
Sucrose 0.82*
Torland
Cubusand
Amaretto
(n=6)
Starch 0.98* 0.94** 0.26ns 0.74ns 0.73ns -0.53ns 0.79ns
Protein -0.98* 0.54ns -0.92ns -0.93ns 0.87 ns -0.9ns
Fructose 0.14ns 0.91* 0.91** -0.66ns 0.92*
Glucose 0.06ns 0.12ns -0.17ns 0.12ns
Maltose 0.99*** -0.82* 0.99***
Reducing suagrs
-0.83* 0.99 ***
Sucrose -0.79ns
For symbol explanation see legend of Table 22
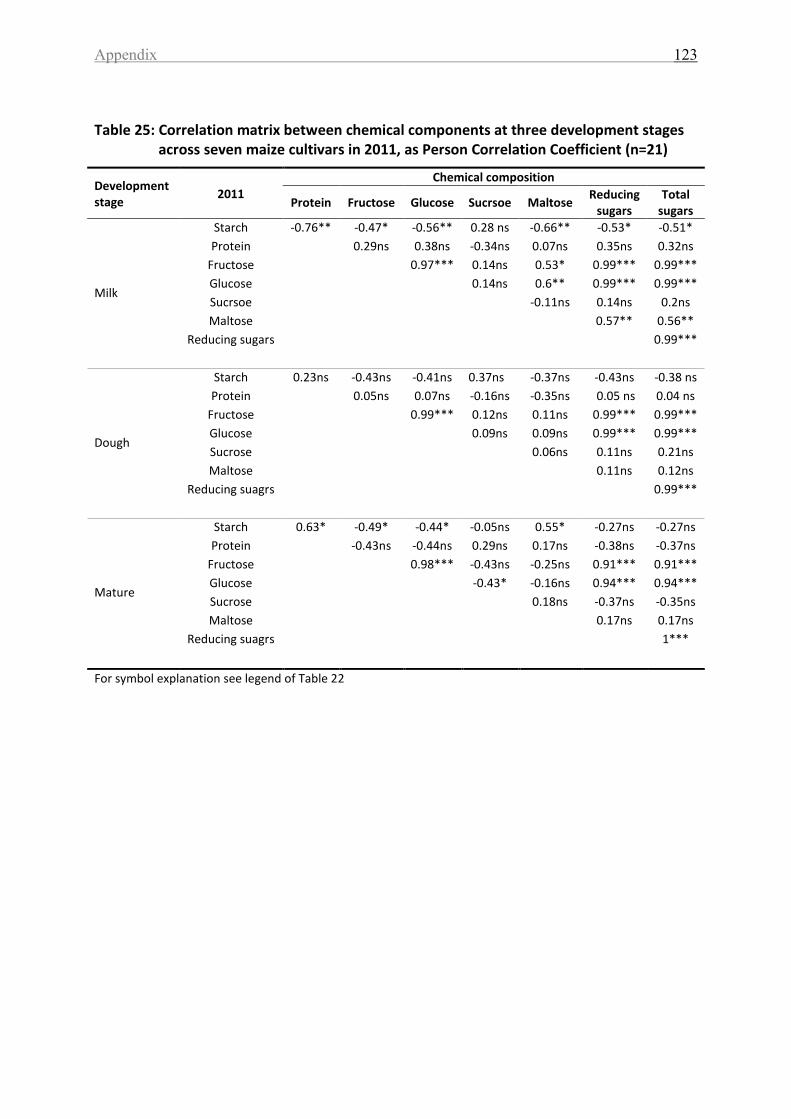
Appendix 123
Table 25: Correlation matrix between chemical components at three development stages across seven maize cultivars in 2011, as Person Correlation Coefficient (n=21)
Development stage
2011
Chemical composition
Protein Fructose Glucose Sucrsoe Maltose Reducing
sugars Total
sugars
Milk
Starch -0.76** -0.47* -0.56** 0.28 ns -0.66** -0.53* -0.51*
Protein 0.29ns 0.38ns -0.34ns 0.07ns 0.35ns 0.32ns
Fructose 0.97*** 0.14ns 0.53* 0.99*** 0.99***
Glucose 0.14ns 0.6** 0.99*** 0.99***
Sucrsoe -0.11ns 0.14ns 0.2ns
Maltose 0.57** 0.56**
Reducing sugars 0.99***
Dough
Starch 0.23ns -0.43ns -0.41ns 0.37ns -0.37ns -0.43ns -0.38 ns
Protein 0.05ns 0.07ns -0.16ns -0.35ns 0.05 ns 0.04 ns
Fructose 0.99*** 0.12ns 0.11ns 0.99*** 0.99***
Glucose 0.09ns 0.09ns 0.99*** 0.99***
Sucrose 0.06ns 0.11ns 0.21ns
Maltose 0.11ns 0.12ns
Reducing suagrs 0.99***
Mature
Starch 0.63* -0.49* -0.44* -0.05ns 0.55* -0.27ns -0.27ns
Protein -0.43ns -0.44ns 0.29ns 0.17ns -0.38ns -0.37ns
Fructose 0.98*** -0.43ns -0.25ns 0.91*** 0.91***
Glucose -0.43* -0.16ns 0.94*** 0.94***
Sucrose 0.18ns -0.37ns -0.35ns
Maltose 0.17ns 0.17ns
Reducing suagrs 1***
For symbol explanation see legend of Table 22
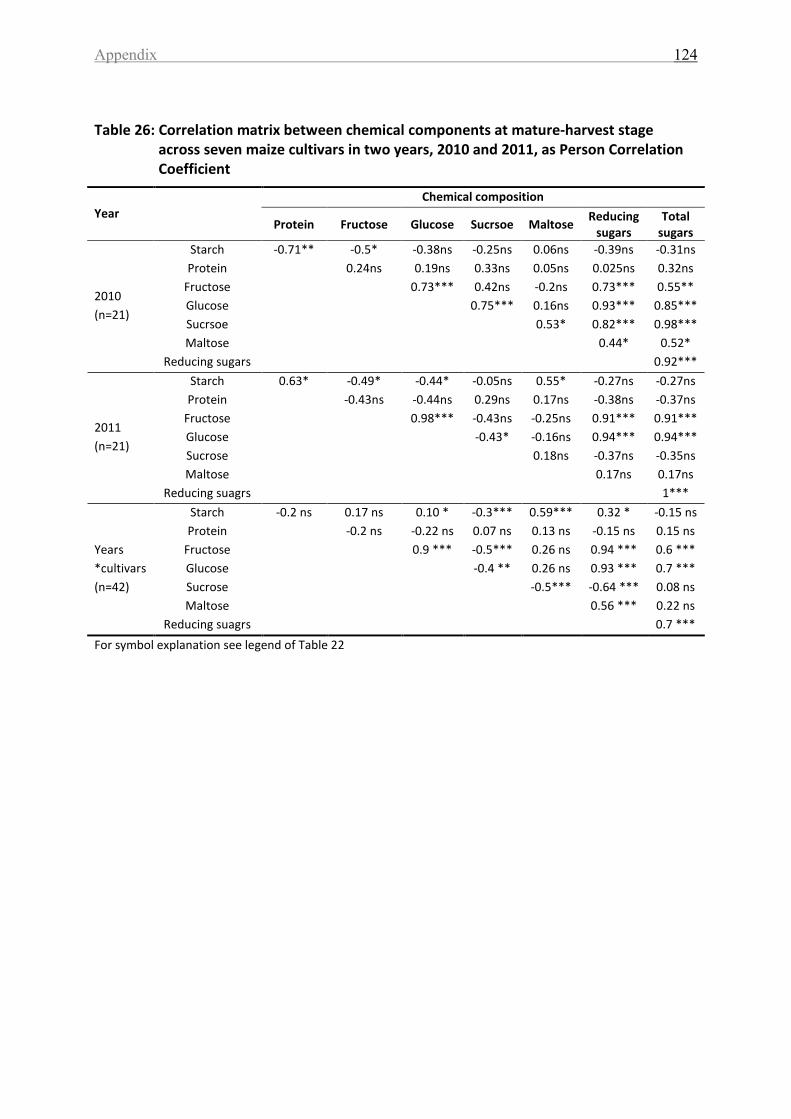
Appendix 124
Table 26: Correlation matrix between chemical components at mature-harvest stage across seven maize cultivars in two years, 2010 and 2011, as Person Correlation Coefficient
Year Chemical composition
Protein Fructose Glucose Sucrsoe Maltose Reducing
sugars Total
sugars
2010
(n=21)
Starch -0.71** -0.5* -0.38ns -0.25ns 0.06ns -0.39ns -0.31ns
Protein 0.24ns 0.19ns 0.33ns 0.05ns 0.025ns 0.32ns
Fructose 0.73*** 0.42ns -0.2ns 0.73*** 0.55**
Glucose 0.75*** 0.16ns 0.93*** 0.85***
Sucrsoe 0.53* 0.82*** 0.98***
Maltose 0.44* 0.52*
Reducing sugars 0.92***
2011
(n=21)
Starch 0.63* -0.49* -0.44* -0.05ns 0.55* -0.27ns -0.27ns
Protein -0.43ns -0.44ns 0.29ns 0.17ns -0.38ns -0.37ns
Fructose 0.98*** -0.43ns -0.25ns 0.91*** 0.91***
Glucose -0.43* -0.16ns 0.94*** 0.94***
Sucrose 0.18ns -0.37ns -0.35ns
Maltose 0.17ns 0.17ns
Reducing suagrs 1***
Years
*cultivars
(n=42)
Starch -0.2 ns 0.17 ns 0.10 * -0.3*** 0.59*** 0.32 * -0.15 ns
Protein -0.2 ns -0.22 ns 0.07 ns 0.13 ns -0.15 ns 0.15 ns
Fructose 0.9 *** -0.5*** 0.26 ns 0.94 *** 0.6 ***
Glucose -0.4 ** 0.26 ns 0.93 *** 0.7 ***
Sucrose -0.5*** -0.64 *** 0.08 ns
Maltose 0.56 *** 0.22 ns
Reducing suagrs 0.7 ***
For symbol explanation see legend of Table 22
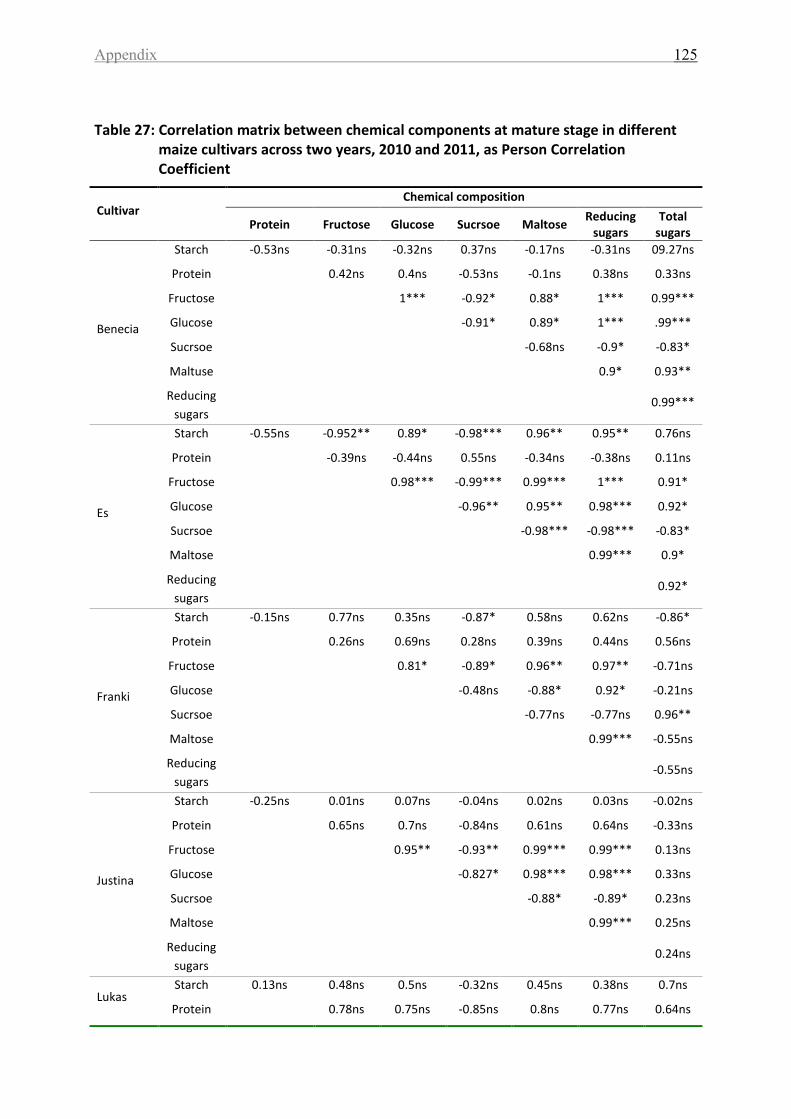
Appendix 125
Table 27: Correlation matrix between chemical components at mature stage in different maize cultivars across two years, 2010 and 2011, as Person Correlation Coefficient
Cultivar Chemical composition
Protein Fructose Glucose Sucrsoe Maltose Reducing
sugars Total
sugars
Benecia
Starch -0.53ns -0.31ns -0.32ns 0.37ns -0.17ns -0.31ns 09.27ns
Protein 0.42ns 0.4ns -0.53ns -0.1ns 0.38ns 0.33ns
Fructose 1*** -0.92* 0.88* 1*** 0.99***
Glucose -0.91* 0.89* 1*** .99***
Sucrsoe -0.68ns -0.9* -0.83*
Maltuse 0.9* 0.93**
Reducing
sugars 0.99***
Es
Starch -0.55ns -0.952** 0.89* -0.98*** 0.96** 0.95** 0.76ns
Protein -0.39ns -0.44ns 0.55ns -0.34ns -0.38ns 0.11ns
Fructose 0.98*** -0.99*** 0.99*** 1*** 0.91*
Glucose -0.96** 0.95** 0.98*** 0.92*
Sucrsoe -0.98*** -0.98*** -0.83*
Maltose 0.99*** 0.9*
Reducing
sugars 0.92*
Franki
Starch -0.15ns 0.77ns 0.35ns -0.87* 0.58ns 0.62ns -0.86*
Protein 0.26ns 0.69ns 0.28ns 0.39ns 0.44ns 0.56ns
Fructose 0.81* -0.89* 0.96** 0.97** -0.71ns
Glucose -0.48ns -0.88* 0.92* -0.21ns
Sucrsoe -0.77ns -0.77ns 0.96**
Maltose 0.99*** -0.55ns
Reducing
sugars -0.55ns
Justina
Starch -0.25ns 0.01ns 0.07ns -0.04ns 0.02ns 0.03ns -0.02ns
Protein 0.65ns 0.7ns -0.84ns 0.61ns 0.64ns -0.33ns
Fructose 0.95** -0.93** 0.99*** 0.99*** 0.13ns
Glucose -0.827* 0.98*** 0.98*** 0.33ns
Sucrsoe -0.88* -0.89* 0.23ns
Maltose 0.99*** 0.25ns
Reducing
sugars 0.24ns
Lukas Starch 0.13ns 0.48ns 0.5ns -0.32ns 0.45ns 0.38ns 0.7ns
Protein 0.78ns 0.75ns -0.85ns 0.8ns 0.77ns 0.64ns
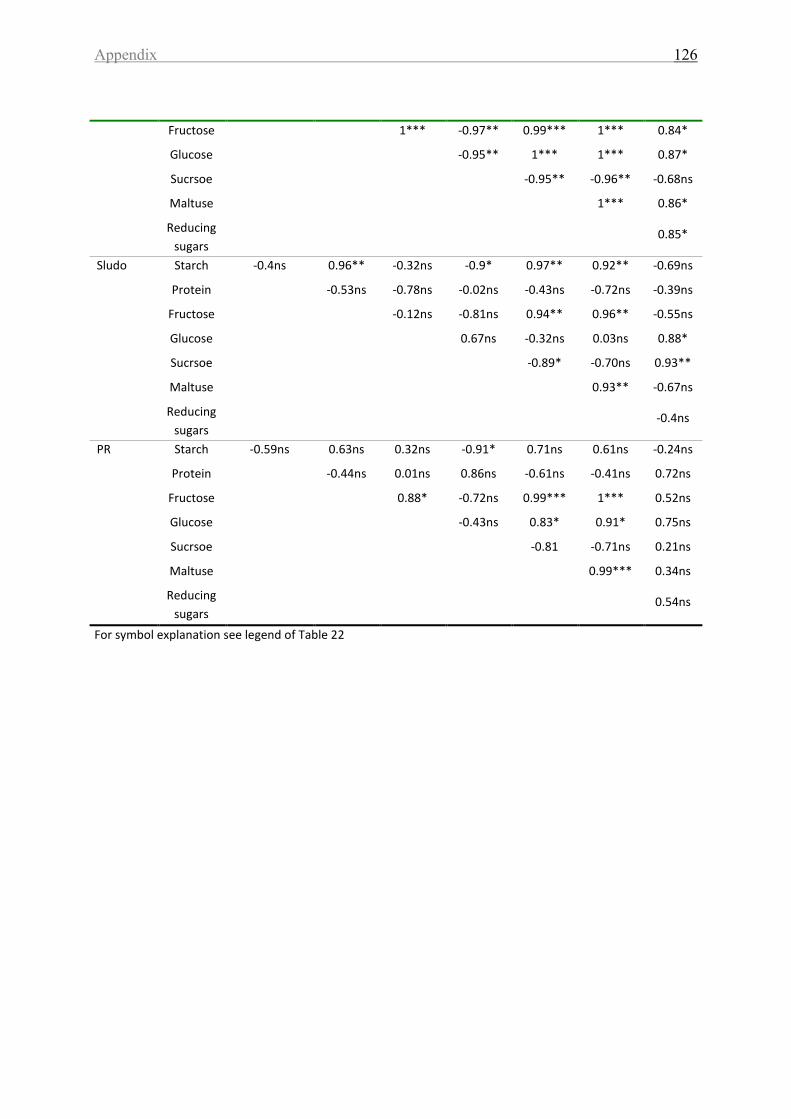
Appendix 126
Fructose 1*** -0.97** 0.99*** 1*** 0.84*
Glucose -0.95** 1*** 1*** 0.87*
Sucrsoe -0.95** -0.96** -0.68ns
Maltuse 1*** 0.86*
Reducing
sugars 0.85*
Sludo Starch -0.4ns 0.96** -0.32ns -0.9* 0.97** 0.92** -0.69ns
Protein -0.53ns -0.78ns -0.02ns -0.43ns -0.72ns -0.39ns
Fructose -0.12ns -0.81ns 0.94** 0.96** -0.55ns
Glucose 0.67ns -0.32ns 0.03ns 0.88*
Sucrsoe -0.89* -0.70ns 0.93**
Maltuse 0.93** -0.67ns
Reducing
sugars -0.4ns
PR Starch -0.59ns 0.63ns 0.32ns -0.91* 0.71ns 0.61ns -0.24ns
Protein -0.44ns 0.01ns 0.86ns -0.61ns -0.41ns 0.72ns
Fructose 0.88* -0.72ns 0.99*** 1*** 0.52ns
Glucose -0.43ns 0.83* 0.91* 0.75ns
Sucrsoe -0.81 -0.71ns 0.21ns
Maltuse 0.99*** 0.34ns
Reducing
sugars 0.54ns
For symbol explanation see legend of Table 22