CHAPTER 6: PROCESS CAPABILITY - University of Windsorweb4.uwindsor.ca/users/b/baki...
9
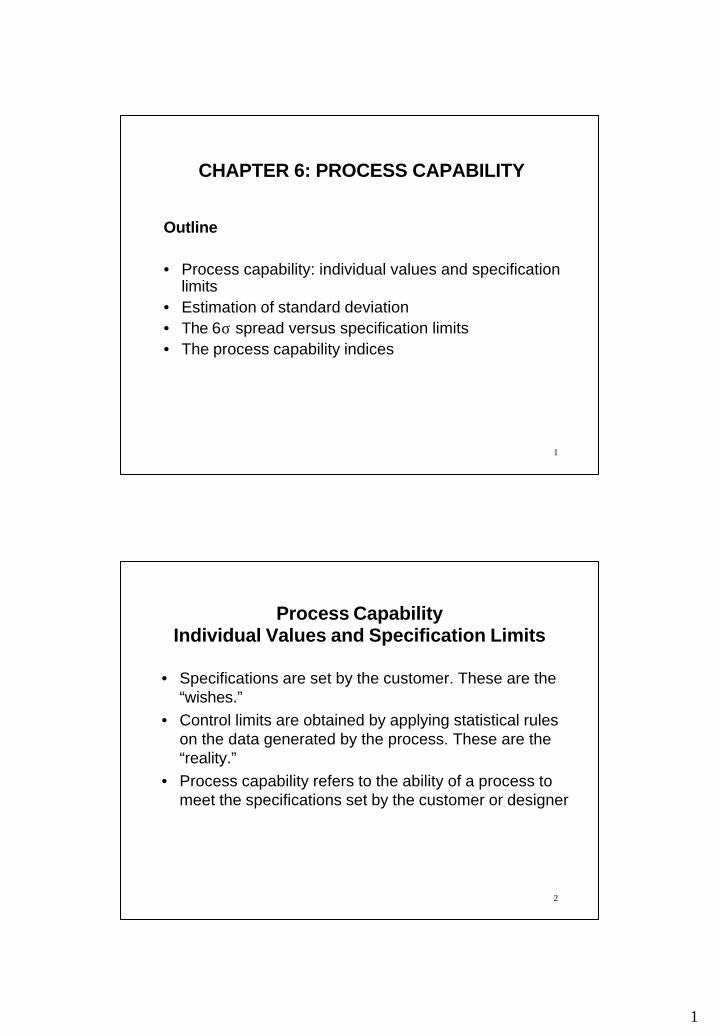
1 1 CHAPTER 6: PROCESS CAPABILITY Outline • Process capability: individual values and specification limits • Estimation of standard deviation • The 6σ spread versus specification limits • The process capability indices 2 Process Capability Individual Values and Specification Limits • Specifications are set by the customer. These are the “wishes.” • Control limits are obtained by applying statistical rules on the data generated by the process. These are the “reality.” • Process capability refers to the ability of a process to meet the specifications set by the customer or designer
Transcript of CHAPTER 6: PROCESS CAPABILITY - University of Windsorweb4.uwindsor.ca/users/b/baki...
1
1
CHAPTER 6: PROCESS CAPABILITY
Outline
• Process capability: individual values and specification limits
• Estimation of standard deviation• The 6σ spread versus specification limits• The process capability indices
2
Process CapabilityIndividual Values and Specification Limits
• Specifications are set by the customer. These are the “wishes.”
• Control limits are obtained by applying statistical rules on the data generated by the process. These are the “reality.”
• Process capability refers to the ability of a process to meet the specifications set by the customer or designer
2
3
Process CapabilityIndividual Values and Specification Limits
• Process capability is based on the performance of individual products or services (not the subgroup averages) against specifications set by the customer or designer (not the statistically computed control limits)
• Process capability is different from the state of process control which is determined by control charts and based on the average performances of subgroups against statistically computed control limits
4
• The difference between process capability and the state of process control– When measurement of an individual item does not meet
specification, the item is called defective– When subgroup averages are compared with control limits
and the comparison shows some unpredictable amount of variation, an out-of-control state is assumed
– A process in statistical control does not necessarily follow specifications. A capable process is not necessarily in control. A process may be out of control and within specification or under control and out of specification.
Process CapabilityIndividual Values and Specification Limits
3
5
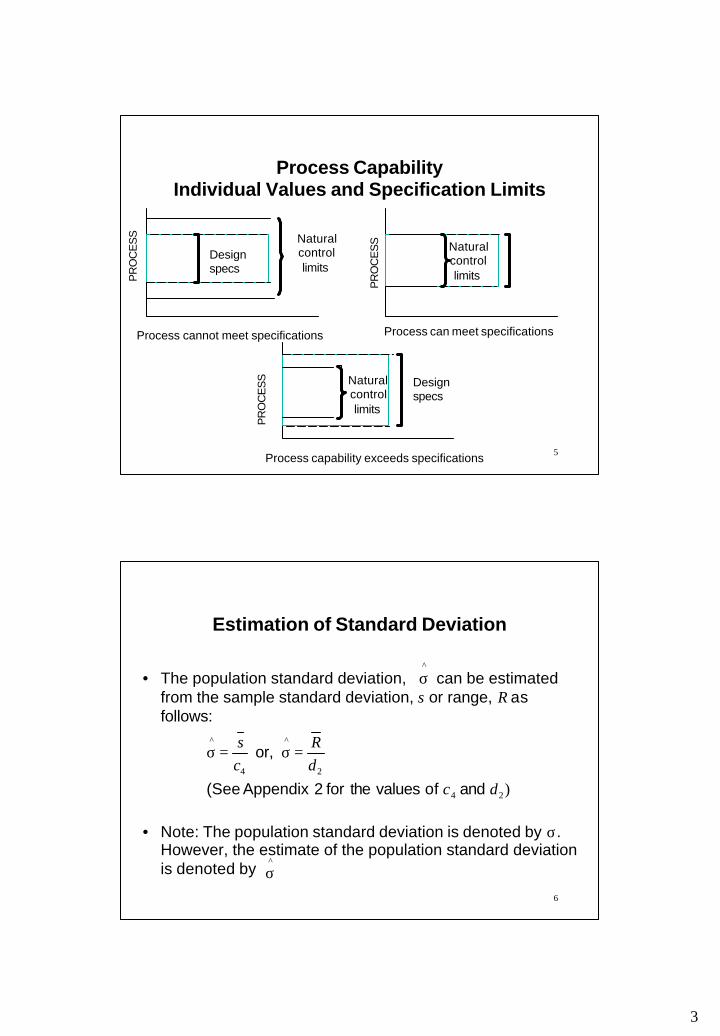
Process cannot meet specifications Process can meet specifications
Process capability exceeds specifications
PR
OC
ES
S
PR
OC
ES
S
PR
OC
ES
SNaturalcontrollimits
Naturalcontrollimits
Naturalcontrollimits
Designspecs
Designspecs
Process CapabilityIndividual Values and Specification Limits
6
Estimation of Standard Deviation
• The population standard deviation, can be estimated from the sample standard deviation, s or range, R as follows:
• Note: The population standard deviation is denoted by σ. However, the estimate of the population standard deviation is denoted by
)24
2
^
4
^
dcdR
cs
and of values the for 2 Appendix (See
or, =σ=σ
^
σ
^σ
4
7
Estimation of Standard Deviation
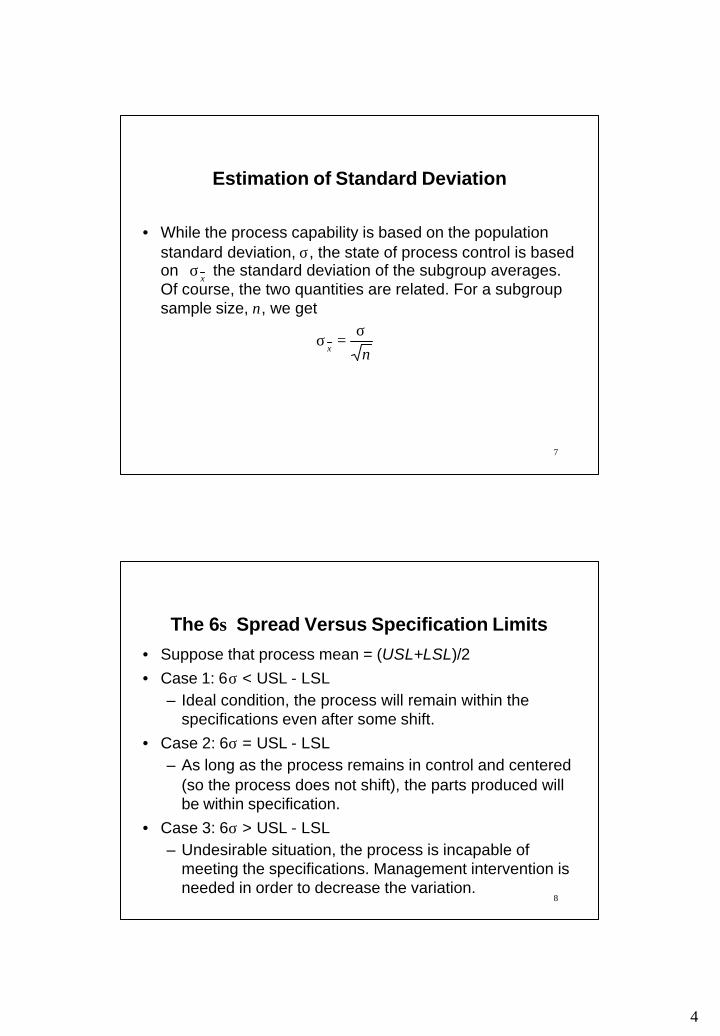
• While the process capability is based on the population standard deviation, σ, the state of process control is based on the standard deviation of the subgroup averages. Of course, the two quantities are related. For a subgroup sample size, n, we get
xσ
nx
σ=σ
8
The 6σ Spread Versus Specification Limits
• Suppose that process mean = (USL+LSL)/2 • Case 1: 6σ < USL - LSL
– Ideal condition, the process will remain within the specifications even after some shift.
• Case 2: 6σ = USL - LSL– As long as the process remains in control and centered
(so the process does not shift), the parts produced will be within specification.
• Case 3: 6σ > USL - LSL– Undesirable situation, the process is incapable of
meeting the specifications. Management intervention is needed in order to decrease the variation.
5
9
The 6σ Spread Versus Specification Limits
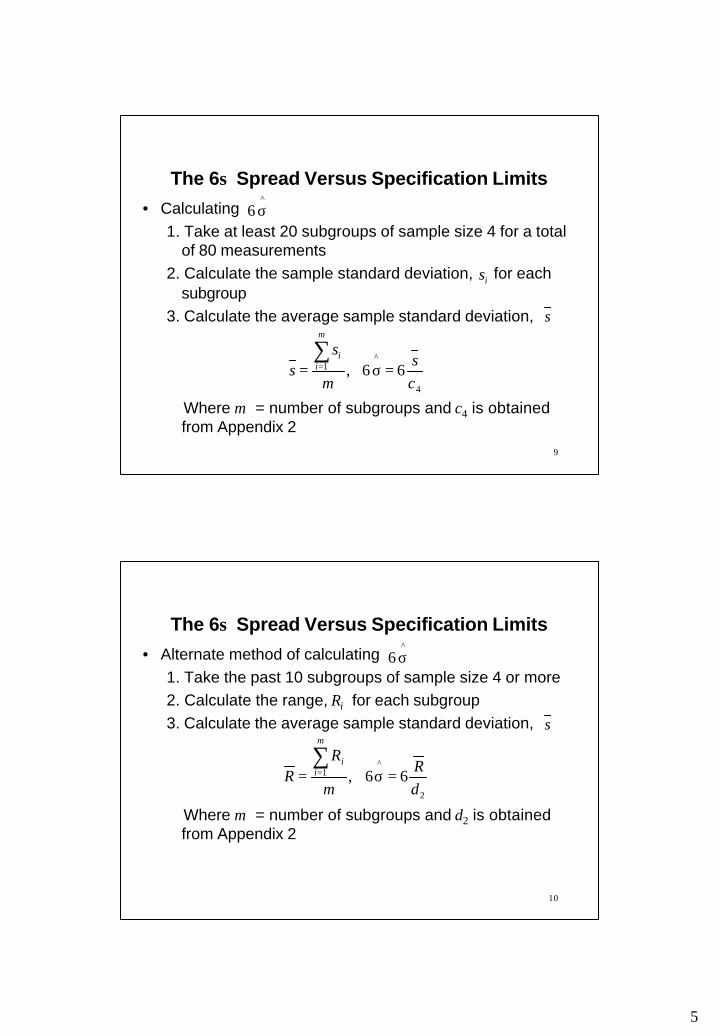
• Calculating 1. Take at least 20 subgroups of sample size 4 for a total
of 80 measurements2. Calculate the sample standard deviation, for each
subgroup3. Calculate the average sample standard deviation,
Where m = number of subgroups and c4 is obtained from Appendix 2
^6 σ
is
s
4
^1 66,
cs
m
ss
m
ii
=σ=∑
=
10
The 6σ Spread Versus Specification Limits
• Alternate method of calculating 1. Take the past 10 subgroups of sample size 4 or more2. Calculate the range, Ri for each subgroup3. Calculate the average sample standard deviation,
Where m = number of subgroups and d2 is obtained from Appendix 2
^6 σ
s
2
^1 66,
dR
m
RR
m
ii
=σ=∑
=
6
11
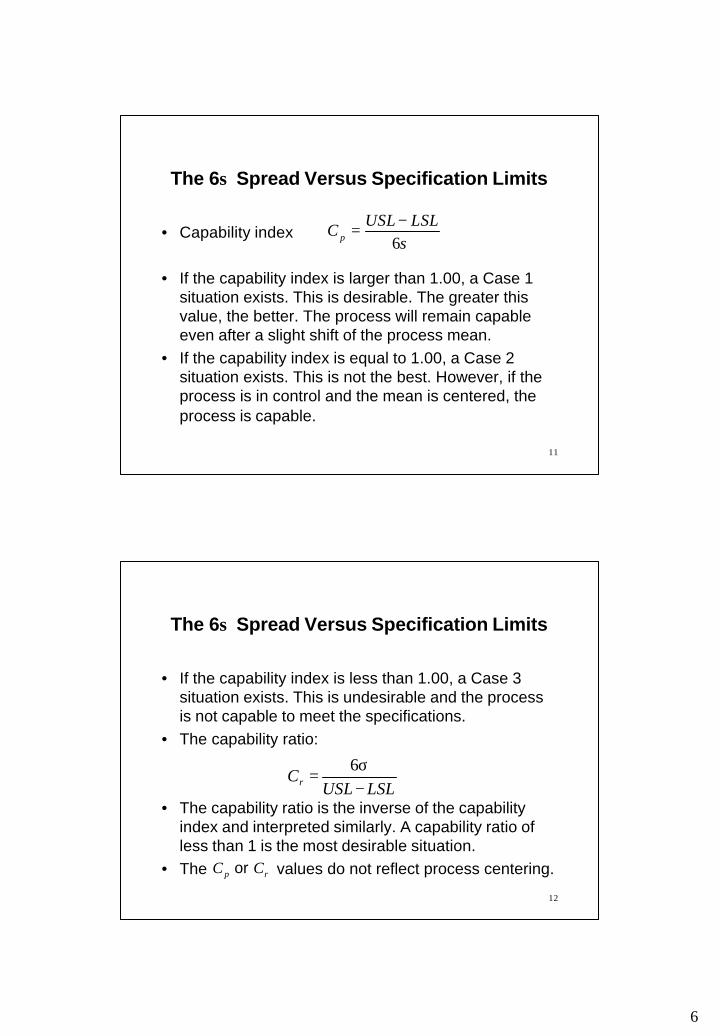
• Capability index
• If the capability index is larger than 1.00, a Case 1 situation exists. This is desirable. The greater this value, the better. The process will remain capable even after a slight shift of the process mean.
• If the capability index is equal to 1.00, a Case 2 situation exists. This is not the best. However, if the process is in control and the mean is centered, the process is capable.
σ6LSLUSLC p
−=
The 6σ Spread Versus Specification Limits
12
• If the capability index is less than 1.00, a Case 3 situation exists. This is undesirable and the process is not capable to meet the specifications.
• The capability ratio:
• The capability ratio is the inverse of the capability index and interpreted similarly. A capability ratio of less than 1 is the most desirable situation.
• The values do not reflect process centering.
The 6σ Spread Versus Specification Limits
LSLUSLCr −
σ=
6
rp CC or
7
13
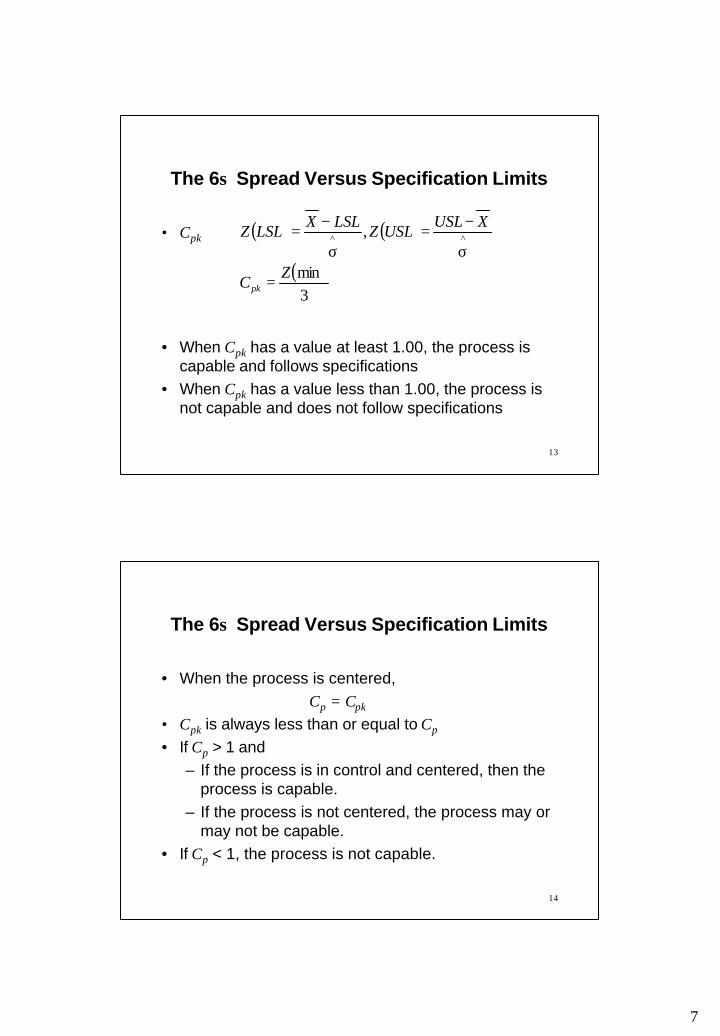
• Cpk
• When Cpk has a value at least 1.00, the process is capable and follows specifications
• When Cpk has a value less than 1.00, the process is not capable and does not follow specifications
( ) ( )
( )3min
, ^^
ZC
XUSLUSLZ
LSLXLSLZ
pk =
σ
−=σ
−=
The 6σ Spread Versus Specification Limits
14
• When the process is centered, Cp = Cpk
• Cpk is always less than or equal to Cp
• If Cp > 1 and– If the process is in control and centered, then the
process is capable. – If the process is not centered, the process may or
may not be capable.• If Cp < 1, the process is not capable.
The 6σ Spread Versus Specification Limits
8
15
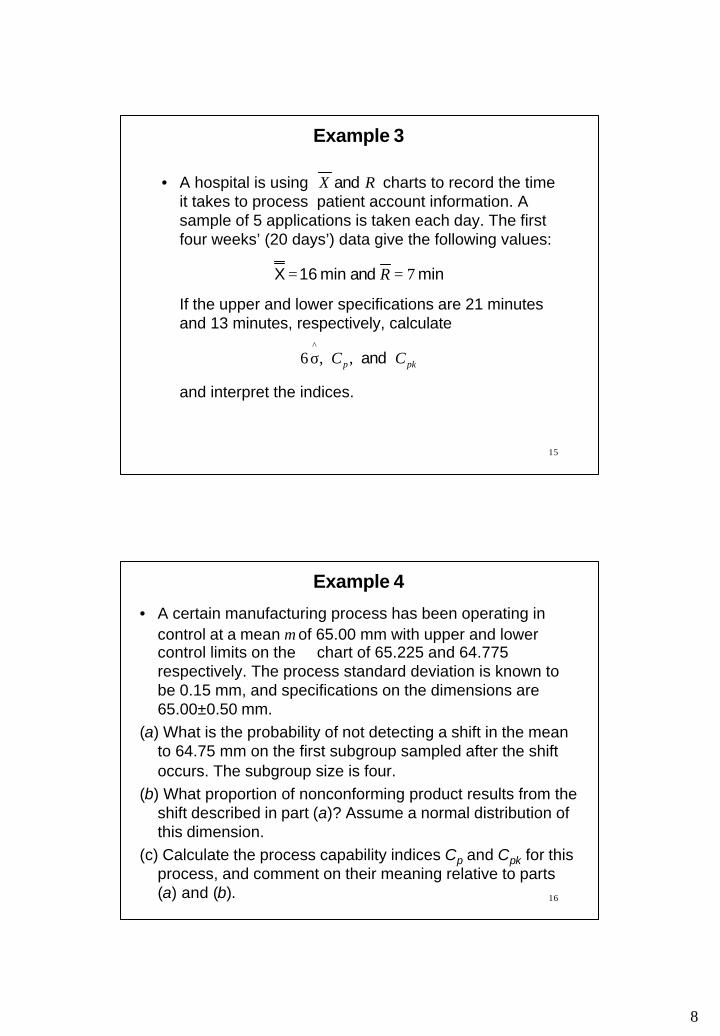
• A hospital is using charts to record the time it takes to process patient account information. A sample of 5 applications is taken each day. The first four weeks’ (20 days’) data give the following values:
If the upper and lower specifications are 21 minutes and 13 minutes, respectively, calculate
and interpret the indices.
RX and
min and min 16X 7== R
pkp CC and ,,6^
σ
Example 3
16
Example 4
• A certain manufacturing process has been operating in control at a mean µ of 65.00 mm with upper and lower control limits on the chart of 65.225 and 64.775 respectively. The process standard deviation is known to be 0.15 mm, and specifications on the dimensions are 65.00±0.50 mm.
(a) What is the probability of not detecting a shift in the mean to 64.75 mm on the first subgroup sampled after the shift occurs. The subgroup size is four.
(b) What proportion of nonconforming product results from the shift described in part (a)? Assume a normal distribution of this dimension.
(c) Calculate the process capability indices Cp and Cpk for this process, and comment on their meaning relative to parts (a) and (b).
9
17
Reading and Exercises
• Chapter 6– Reading pp. 280-303, Exercises 3, 4, 11, 13 (2nd ed.)– Reading pp. 286-309, Exercises 3, 4, 9, 13 (3rd ed.)