CHAPTER 3 MATERIALS AND METHODS -...
36
CHAPTER 3 MATERIALS AND METHODS 3.1 Equipment The equipment used in the present study are listed in Appendix A. 3.2 Materials Few materials have been used are as follows: Glass column: 2” x 40”, Columns, Borosil, India. Sieves: Osaw Industries (size 2 mm), Ambala, India Amberlite XAD-16 Resin: Amberlite XAD-16 resin is polymeric adsorbent, white translucent beads and nonionic macro reticular resin that adsorbs and releases ionic species through hydrophobic and polar interactions; usually used under isocratic condition. This resin can adsorbs hydrophobic compounds up to 40000 MW. It can be reused up to 100 times by regeneration with methanol, acetone, and isopropanol addition with water after each uses. Syringe filter membranes: Polytetrafluroethylene (PTFE) (0.45 μm) nylon membrane, Nupore; 0.45 μm multipurpose membrane, Pall Life Sciences, New York, USA. 52
Transcript of CHAPTER 3 MATERIALS AND METHODS -...
CHAPTER 3
MATERIALS AND METHODS
3.1 Equipment
The equipment used in the present study are listed in Appendix A.
3.2 Materials
Few materials have been used are as follows:
Glass column: 2” x 40”, Columns, Borosil, India.
Sieves: Osaw Industries (size 2 mm), Ambala, India
Amberlite XAD-16 Resin: Amberlite XAD-16 resin is polymeric adsorbent, white
translucent beads and nonionic macro reticular resin that adsorbs and releases ionic species
through hydrophobic and polar interactions; usually used under isocratic condition. This
resin can adsorbs hydrophobic compounds up to 40000 MW. It can be reused up to 100
times by regeneration with methanol, acetone, and isopropanol addition with water after
each uses.
Syringe filter membranes: Polytetrafluroethylene (PTFE) (0.45 μm) nylon membrane,
Nupore; 0.45 μm multipurpose membrane, Pall Life Sciences, New York, USA.
52
Packaging materials: Low density polyethylene (LDPE) pouches, gelatin coated empty
capsule, Polyethylene terephthalate (PET) screw cap bottles and HDPE screw cap bottles
(Procured from Sadar Market, New Delhi, India).
3.2.1 Chemicals and reagents
Cf. Appendix B
3.2.2 Microorganism
Aspergilus niger MTCC 281, Bacillus subtilis MTCC 1305, Staphylococcus aureus MTCC
3160, Pseudomonas aeruginosa MTCC 1688, Salmonella typhimurium MTCC 98 and
Escherichia coli MTCC 452 was obtained from the Microbial Type Culture Collection,
Institute of Microbial Technology, Chandigarh, India
3.2.3 Fresh Pomegranate Fruit
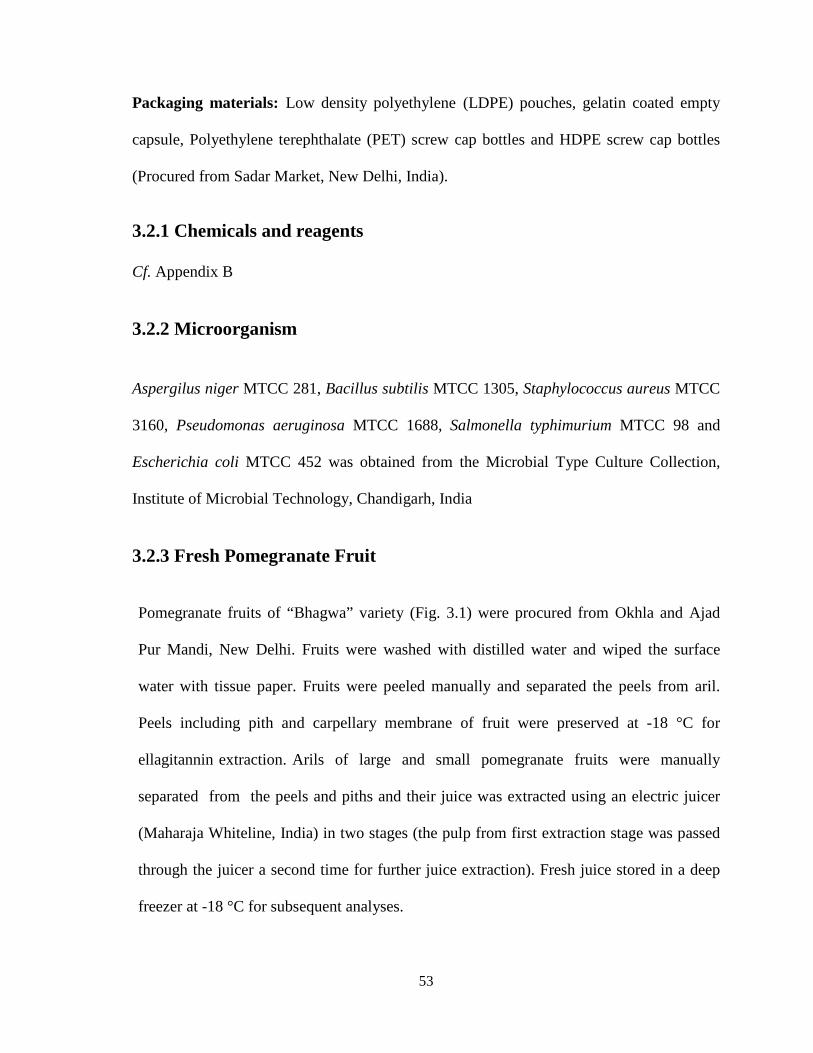
Pomegranate fruits of “Bhagwa” variety (Fig. 3.1) were procured from Okhla and Ajad
Pur Mandi, New Delhi. Fruits were washed with distilled water and wiped the surface
water with tissue paper. Fruits were peeled manually and separated the peels from aril.
Peels including pith and carpellary membrane of fruit were preserved at -18 °C for
ellagitannin extraction. Arils of large and small pomegranate fruits were manually
separated from the peels and piths and their juice was extracted using an electric juicer
(Maharaja Whiteline, India) in two stages (the pulp from first extraction stage was passed
through the juicer a second time for further juice extraction). Fresh juice stored in a deep
freezer at -18 °C for subsequent analyses.
53
Figure 3.1 Fresh Pomegranate fruit of “Bhagwa” variety
3.3 Methods
In this section sample preparation, analytical methods, kinetics equations, physicochemical
characterization, bacterial inhibition and cytotoxicity has been mentioned.
3.3.1 Sample preparation
The obtained fresh pomegranate peels (FPP) were crushed in mixer grinder. The ground
peel were passed through 2 mm pore size sieve to ensure uniform particle size. The ground
peel was stored at -18 oC in deep freezer for further utilization.
3.3.2 Preparation of fresh and detanninated peel powder
The ground peel was taken in to two equal parts and one part was percolated in distilled
water (1:1 w/v) and kept at ambient condition for 12 h then whole material squeezed and
54
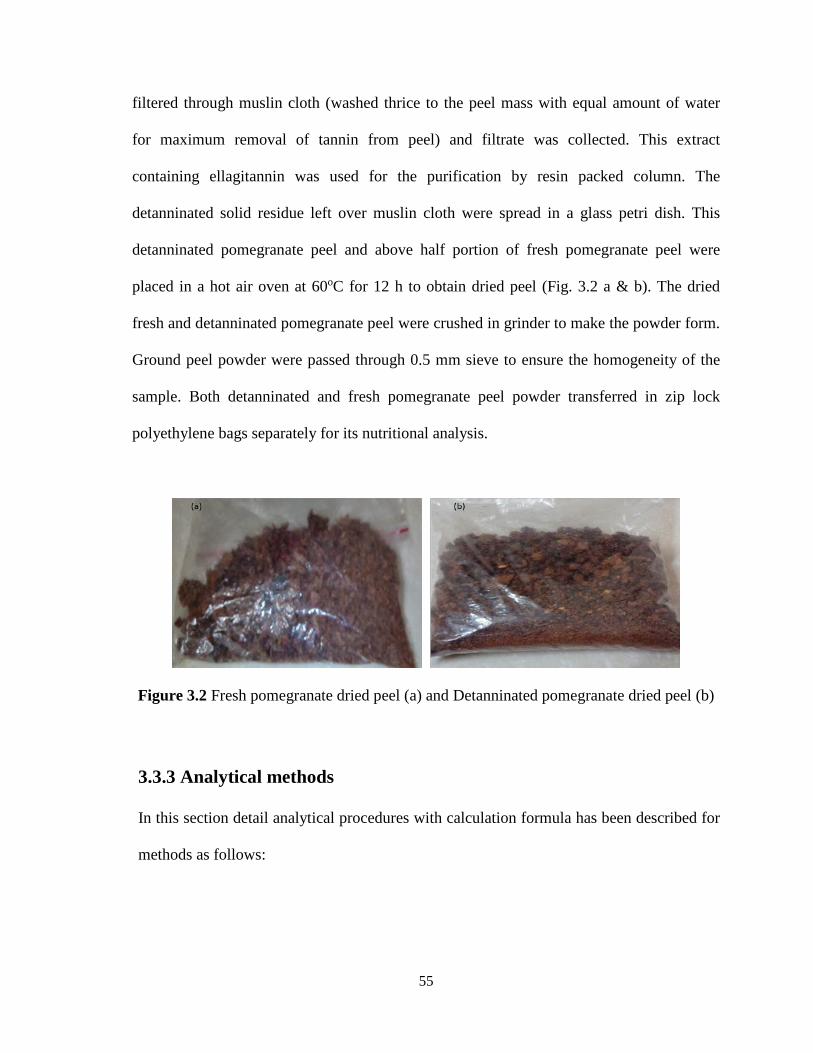
filtered through muslin cloth (washed thrice to the peel mass with equal amount of water
for maximum removal of tannin from peel) and filtrate was collected. This extract
containing ellagitannin was used for the purification by resin packed column. The
detanninated solid residue left over muslin cloth were spread in a glass petri dish. This
detanninated pomegranate peel and above half portion of fresh pomegranate peel were
placed in a hot air oven at 60oC for 12 h to obtain dried peel (Fig. 3.2 a & b). The dried
fresh and detanninated pomegranate peel were crushed in grinder to make the powder form.
Ground peel powder were passed through 0.5 mm sieve to ensure the homogeneity of the
sample. Both detanninated and fresh pomegranate peel powder transferred in zip lock
polyethylene bags separately for its nutritional analysis.
Figure 3.2 Fresh pomegranate dried peel (a) and Detanninated pomegranate dried peel (b)
3.3.3 Analytical methods
In this section detail analytical procedures with calculation formula has been described for
methods as follows:
55
3.3.3.1 Total ellagitannin content
Total ellagitannin content (TEC) in the peel and peel extract was determined by using
Folin-Denis ciocalteu reagent as described in AOAC method 952.03 with slight
modification. 250 µl of extract was diluted with distilled water to 10 ml. Aliquots of 1 ml of
diluted extract were mixed with 5 ml of 10 fold diluted Folin-Denis ciocalteu reagent. After
3 min, 4 ml of 7.5% sodium carbonate was added. The mixtures were allowed to stand for
30 min at 30 oC in incubator before the absorbance was measured at 734 nm using UV-Vis
spectrophotometer. The total polyphenol content in the extract was calculated and
expressed as gallic acid equivalent (GAE; g/100 g on dry basis) using a standard gallic acid
(0-120 mg/l) curve (Appendix C.1)
3.3.3.2 Antioxidant activity
The antioxidant activity of different samples was measured in term of hydrogen donating or
radical scavenging ability using stable DPPH method according to the method proposed by
Brand-Williams et al, (1995). Aliquot of 250 µl of the extract was diluted with distilled
water to 10 ml. Aliquot of 200 µl of samples were mixed with 2 ml of 100 µM DPPH
methanolic solution. The mixture was placed in dark at room temperature for 60 min. The
absorbance of resulting solution was then read at 520 nm using UV-Vis spectrophotometer
(Shimadzu UV-Vis-2600, Singapore). The antiradical activity was expressed in terms of
percentage reduction of the DPPH. The ability to scavenge the DPPH radical was
calculated using the following formula:
% Radical scavenging activity as DPPH = ((A0-A1)/A0) x100
Where, A0 is the absorbance of the control, and A1 is the absorbance of the sample
56
3.3.3.3 Dry Matter content
Pre dried aluminum pans with lids in hot air oven at 105°C for 30 min. Pans was cooled in
desiccator, weighed and record empty pan weight (W1). Added 2 g samples and recorded
the weight of pan plus sample (W2). Dried the pan plus sample in oven at 105°C for 4 h.
Cooled in desiccator, weighed, and recorded the weight up to constant weight (W3).
(AOAC, 2005)
% DM = (W2 - W3) x 100 / (W2 – W1)
3.3.3.4 Ash content
Pre dried the silica crucible in muffle furnace at 500 °C for 30 min. crucible was cooled in
desiccator, weighed and record empty crucible weight (W1). Added 2 g samples and
recorded the weight of crucible plus sample (W2). Incinerated the sample on hot plate up to
carbon free fume and then placed the crucible in muffle furnace at 500 °C for 5 h. Cooled
the crucible in desiccator, weighed, and recorded the weight up to constant weight. (W3).
(AOAC, 2005)
% Ash = (W3 – W1) x 100 / (W2 – W1)
3.3.3.5 Crude fat or ether extract (EE)
Round flat bottom flask (250 ml) dried at 100°C for approximately 15 min, cooled in
desiccator and weighed (W1). Weighed the prepared sample (5 g) in extraction thimble and
thimble was cotton plugged on thimble opening. Put the thimble in extractor siphon tube of
thimble assembly and added 150 ml of anhydrous ether. Attached with condenser and turn
on heating mantle. The sample was extracted at a rate of 2 to 3 drops/second for 16 h. The
57
ether was evaporated and placed the flask was placed in oven at 100°C for 30 min, cooled
the flask in desiccator and weight (W2) (AOAC, 2005)
Ether extract (% crude fat) = (W2- W1) x 100 / sample weight
3.3.3.6 Crude Protein (CP)
About 1 g sample was transferred into ash less filter paper, folded to prevent loss of
sample, also taken 0.1 g of urea standard and treated as sample. Added 10 g of Na2SO4
and 0.30 g of CuSO4 as catalyst. Kjeldahl reagents generally contain small amounts of
nitrogen, which had been measured and corrected for in calculations. Added 25 ml
concentrated H2SO4 to the digestion tube and digested until the samples have a clear,
blue-green appearance. After digestion tubes w e r e cooled t o room temperature.
Placed the distillation vessel with digested sample on the apparatus, twisting the tube to
ensure a complete seal. Inserted receiver 250 ml Erlenmeyer flask containing 25 ml of
2.9% boric acid, making sure that the delivery tube is fully submerged. Added
approximately 50 ml of 40% NaOH by control panel, steam generated for 8 min and
collected approximately 175 ml of distillate in the receiver flask. Titrated the received
solution with 0.1 N standardized Hydrochloric acid solution. Blank test also carried out
simultaneously (AOAC, 2005).
CP (% w/w) = (TVblank -TVtest) x Nacid x 1400 x 6.25/sample weight
3.3.3.7 Crude Fiber (CF)
The procedure basically involves boiling a fat-free sample of feed with weak acid followed
by weak alkali. The loss in weight on ignition of the residue is crude fiber. About 2 g of
ground sample was taken in 600 ml beaker, avoiding. Added approximately l g of
58
prepared asbestos and 200 ml of boiling 1.25% H2SO4, and 1 drop of antifoam (Parafin
oil). Placed the beaker on digestion apparatus with pre-adjusted hot plate and boiled
for 30 min then filter through Buchner (pre coated with asbestos), rinsed the beaker with
50 to 75 ml of boiling water, and washed through Buchner. Washing was done thrice with
50 ml portions of water and sample was dried then 200 ml of boiling 1.25% w/w NaOH,
was added and boiled for 30 min and filtered. Washed with 25 ml of boiling 1.25% w/w
H2SO4, 50 ml portions of H2O thrice and then with 25 ml of alcohol. Removed the mat and
residue, and transferred to ashing dish. Dried the mat and residue for 2 h at 130 +_ 2°C.
Cooled in desiccator and weighed. Ignited at 600°C, cooled in desiccator and reweighed
(AOAC, 2005).
% CF = (Loss in weight on ignition/weight of sample) x 100
3 .3 .3 .8 Nitrogen Free Extract (NFE)
Poorly digestible materials (hemicellulose, cellulose) and indigestible material (lignin)
are classified as nitrogen free extract. Nitrogen free extract (NFE) was calculated by
using following equation (Le Houerou, 1980).
NFE (% dm) = 100 - (CP + CF + EE + Ash)
3.3.3.9 Acid Detergent Fiber (ADF)
Transferred 1 g sample to Berzelius beaker. Added 100 ml acid detergent solution (27.84
ml of H2SO4 + 20 g of Hexa decyl tri methyl ammonium Bromide to the 1 l with distilled
water). Heated to boil (5 to 10 min), and boiled for 60 min. Filtered with light suction into
previously tared crucibles (W1). Washed with hot water 2 to 3 times. Washed thoroughly
59
with acetone until no further color is removed. Then the sample was dried in drying oven at
100°C for 24 h. Cooled in desiccator. Weighed and recorded the weight (W2) (AOAC,
2005).
ADF (% w/w) = (W2 -W1)*100/sample weight
3.3.3.10 Lignin
Lignin has been shown to be a major factor influencing the digestibility of forages. From
ADF test, dried fiber with crucible was treated with 72% H2SO4, stir with glass rod and
filtered, repeated the acid treatment process and vacuum filtered subsequent washing with
hot water was carried up to acid free residue in crucible. Dried the crucible at 100 °C for
constant weight (W1). Ignited the crucible with residue in furnace at 500 °C until carbon
free and weighed (W2) (AOAC, 2005)
Lignin (% w/w) = (W1-W2)*100/sample weight
3.3.3.11 Neutral Detergent Fiber (NDF)
NDF solution: To 1 L of H2O added 30 g of sodium lauryl sulfate. Placed 0.5 to 1.0 g
sample in 600-ml Berzelius beaker. Added 100 ml of neutral detergent fiber solution.
Boiled for 60 min. and filtered contents into preweighed Whatman filter paper (W1) under
vacuum. Rinsed contents with hot water, filtered, and repeated twice. Washed twice with
acetone. Folded and placed in pre weighed aluminum pan. Dried overnight at 100°C and
cooled in desiccator. Weighed (W2) yield was calculated by subtracting paper and dish
weight (AOAC, 2005)
NDF (%w/w) = (W2-W1) x 100/sample weight
60
3.3.3.12 Total Carbohydrate
The total carbohydrate was calculated by using following formula:
Total Carbohydrate (%, w/w) = 100 – (%MC - % Ash - %CP - %EE)
3.3.3.13 Gross Energy (GE)
This is accomplished by multiplying the percentage of each proximate component wi th
its energy value followed by summation of these products. Garrett (1980) report the
following formula for computation of GE from proximate components:
GE (kcal/g) = 5.72 x CP + 9.5 x EE + 4.79 x CF + 4.03 x NFE
3.3.3.14 Analysis of sodium (Na) and Potassium (K) by flame photometer
The samples were incinerated and dissolved in HCl and diluted with distilled water,
aspirated and analyzed under flame photometer and the readings were noted. Standard
solutions of 0, 20, 40, 60, 80, 100 ppm from the stock solution of Na and K were prepared.
Calibrated by aspirating the standards. Distilled water was used as blank. The
concentrations of the respective solutions for Na and K were multiplied by the respective
dilution factors to get the mean concentration of Na and K standard which gives the
original concentration in test solution (AOAC, 2005).
3.3.3.15 Analysis of minerals by Atomic Absorption Spectrometer
Peel powder samples were ignited under high temperature (450±50oC) and dissolved in 6N
HCl, dried the acid and reconstituted the residue in 0.1 N HNO3 (100 ml). Mg, Fe, Cu, Zn
and Se in prepared sample solution were analyzed using atomic absorption
61
spectrophotometer equipped with flame and graphite furnace. Air-acetylene flame was used
for determination of metal content. The instrument was operated with the following
conditions in flame mode: acetylene 1.8 L/min, air 15 L/min, the inert argon gas flow and
the temperature parameters were followed as recommended by manufacturer. Hollow
cathode lamps were used as a source. Operating wavelength for the determination of Mg,
Fe, Cu and Zn were 285.2, 248.3, 324.8, 213.9 and 196 nm respectively (AOAC, 2005)
3.3.3.16 Analysis of Calcium (Ca)
Weighed approx. 2 g sample in silica crucible and ignited in furnace to make carbon free
ash. Boiled the residue in 40 ml HCl (1+3) and few drops of HNO3 was added. Diluted to
100 ml and mixed thoroughly. Aliquot of 20 ml was taken in to a beaker and diluted to 100
ml and 2 drops of methyl red was added as indicator. Ammonia solution wasadded drop
wise to brownish orange. Added few drops of HCl and colour became pink (pH 2.5-3.0).
Then 10 ml saturated di ammonium oxalate was added and ensured the final colour was
pink. Kept for overnight for settling of precipitate. Filtered the precipitate through filter
paper and washed with hot water. Filter paper was placed in beaker and 125 ml water and 5
ml sulphuric acid were added. Then heated to 70oC and titrated with 0.05 M KMnO4 to first
slight pink end point (AOAC, 2005).
Ca (mg/kg) = Vol. make up x TV x M x 0.02004 x 1000/ sample weight x aliquot x 0.05
Where,
TV= Titre value M= Molarity of KMNO4
62
3.3.3.17 Analysis of Phosphorus (P)
Weighed about 2 g sample and was incinerated with magnesium oxide in furnace to make
carbon free ash. The ash was dissolved in HCl (1+3) and few drops of HNO3 and boiled.
Volume makeup to 100 ml. prepared the standard solution of phosphorus of 0.5, 1, 5, 10
and 15 ppm were prepared and carried out with sample for taking the UV reading. Aliquot
of test and standard samples (20 ml) used for the colour development with 20 ml of
molybdovanadate reagent and diluted to 50 ml with water. Then kept for 10 min and read
the absorbance at 400 nm using UV-Vis spectrophotometer (AOAC, 2005)
P (%) = mg P in Aliquot /g test portion in aliquot x 10
3.3.3.18 Analysis of Vitamin A
Weighed about 10 g sample and added with 50 mg butylhydroxy toluene (BHT) and 30 ml
of methanolic KOH (50% w/v). Refluxed under dim light for 1 h, cooled and added with 30
ml water and extracted thrice with 50 ml of ether. Discarded the aqueous layer and washed
the extract with water till it was alkali free. Dried under steam and reconstituted the residue
in 10 ml isopropanol. Reading was noted using UV spectrophotometer at different
wavelength of 310, 325 and 334 nm against isopropanol as a blank (IS: 5886 -1970
reaffirmed: 2005).
A325 (corrected) = 6.815.A325 – 2.555.A310 – 4.260.A334
Vitamin A as retinol (IU/100 g) = A325 (corrected) x 10 x 1830 x 100/ sample weight
63
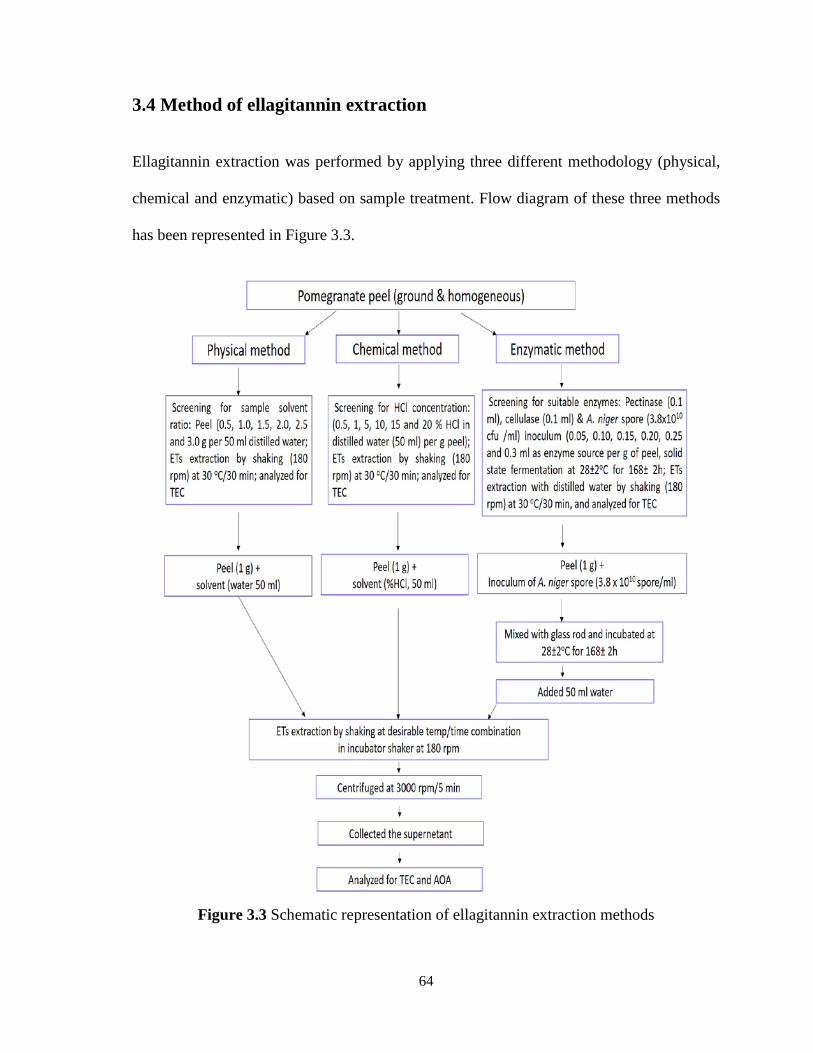
3.4 Method of ellagitannin extraction
Ellagitannin extraction was performed by applying three different methodology (physical,
chemical and enzymatic) based on sample treatment. Flow diagram of these three methods
has been represented in Figure 3.3.
Figure 3.3 Schematic representation of ellagitannin extraction methods
64
3.4.1 Physical method
Initially an experiment was conducted to know the appropriate sample solvent ratio to
produce higher content of total ellagitannin. For that 50 ml of distilled water (used as
solvent) was percolated on 0.5, 1.0, 1.5, 2.0, 2.5 and 3.0 g of ground FPP to produce the
sample/solvent ratio of 0.5/50, 1/50, 1.5/50, 2/50, 2.5/50 and 3/50 in 250 ml conical flask.
The flasks were shaken at 30 oC at 180 rpm for 30 min in shaker incubator (Kuhner,
Switzerland). The content of each conical flask was centrifuged at 3000 rpm for 5 min by a
centrifuge machine (Sigma-vsi, Germany) to get a clear supernatant. Supernatant was then
tested for its total ellagitannin content. The process was performed in triplicate and the
average of three values was reported.
3.4.2 Chemical method
In hydrochloric acid (HCl) based hydrolysis process, the low pH enhances the release of
hydrolysable tannins from FPP. In this method HCl concentration was varried in distilled
water as solvent at 0.5 %, 1.0 %, 5.0 %, 10.0 % 15.0 % and 20.0 % to find an effective
concentration of HCl in water to get a higher extractability of ellagitannin from
pomegranate peel. Here only HCl in water is used as solvent because HCl is a low cost
commercially available chemical. About 1 g of ground FPP was taken for each
concentration of HCl in to 250 ml conical flasks and added 50 ml solvent (HCl in water) of
0.5 %, 1.0 %, 5.0 %, 10.0 %, 15.0 % and 20.0 %, the conical flask were shaked in shaker
incubator at 30 oC, 180 rpm for 30 min. The content of each conical flask was centrifuged
at 3000 rpm for 5 min by a laboratory centrifuge to get a clear supernatant. Each
65
supernatant liquid was tested for its total ellagitannin content (TEC). The process was
performed in triplicate and the average of three values was reported.
3.4.3 Enzymatic method
3.4.3.1 Maintenance of the fungal culture and preparation of spore
inoculums Aspergilus niger strain MTCC 281 was procured from Institute of Microbial Technology
(CSIR), Chandigarh, India and used in the study. Potato dextrose agar slants were used for
the maintenance of A. niger. Fully sporulated slants were stored at 4 oC for further use,
followed by sub culturing. Fungal spore inoculum was prepared by adding 2.5 ml sterilized
water containing 0.1 % tween 80 to a fully sporulated culture. The spores were dislodged
by using a sterile inoculum loop under laminar air flow. The number of viable spores in the
suspension was determined using the plate count method. 1 ml of the prepared spore
suspension contain about of 3.8 x 10¹⁰ spores/ml. This concentration was used in further
studies of ellagitannin extraction.
3.4.3.2 Enzymatic treatment
In enzymatic method of ellagitannin extraction, pectinase and cellulase were used at
concentration of 0.1 ml and A. niger spore inoculum (3.8 x 10¹⁰ spores per ml of inoculum)
was employed as enzyme source. About 1 g of ground fresh pomegranate peel (FPP) taken
in three conical flasks and was mixed with 50 ml acetate buffer of pH 4.5 followed with 0.1
ml pectinase enzyme, in second conical flask 0.1 ml cellulase and third flask kept without
any enzyme as control and shaken in shaker incubator at 30 oC, 180 rpm for 30 min. The
flask’s content was centrifuged at 3000 rpm for 10 min to get the clear supernatant extract
66
containing ellagitannin compound and analyzed for their TEC. Simultaneously a study also
carried out to know the suitable volume of A. niger spore inoculums for one gram of fresh
pomegranate peel (FPP) ground to obtain higher amount of ellagitannin extract. In seven
conical flasks 1 g ground FPP was taken and added with 0.05, 0.10, 0.15, 0.20, 0.25 and 0.3
ml of A. niger spore inoculums (3.8 x 10¹⁰ spores per ml of inoculum) and one flask with
sample kept without spore inoculums as a control and the contents were thoroughly mixed
and incubated at 28±2 ºC for 168±2 h. This process termed as solid state fermentation
(SSF) in which mycelium of A. niger strain grows on the surface of peel. The organism
releases tannin hydrolase enzyme, which hydrolyses the complex compound of tannin into
simpler compounds. After incubation, 50 ml distilled water was added in each flask and
shaked in shaker incubator at 30 oC, 180 rpm for 30 min. Each flask’s contents were
centrifuged at 3000 rpm for 10 min to get the clear supernatant extract containing
ellagitannin compound and were analyzed for TEC.
In the above study it was observed that A. niger is producing higher TEC, hence it was
selected as enzyme source for extraction of ellagitannin from FPP at different time
temperature combination. For this ground FPP (100 g) fermented with 25 ml inoculum
(3.8x10¹⁰ spores) of A. niger strain at 28±2 ºC for 168±2 h in an incubator. After
incubation, whole fermented pomegranate peel was utilized for extraction of ellagitannin
and analyzed for TEC and AOA of extract.
3.5 Screening experiments for study the kinetics of ellagitannin extraction
The sample solvent ratio (1g/50ml) was used for the kinetics study of ellagitannin
extraction at temperature 30, 60 and 90oC. Extraction kinetics was observed for three
ellagitannin extraction methods (Figure 3.1) i.e. physical (pTEC), chemical (cTEC) and
67
enzymatic (eTEC) method at different extraction time i.e. 1, 10, 20, 40, 60, 90 and 120 min.
the particle size of sample was less than 2 mm which was obtained by grinding the fresh
peel subsequently passed through 2 mm size sieve. Total ellagitannin concentration (TEC)
(% w/w, db) was measured by following the method 3.3.4 at each temperature and time
points for all three extraction method.
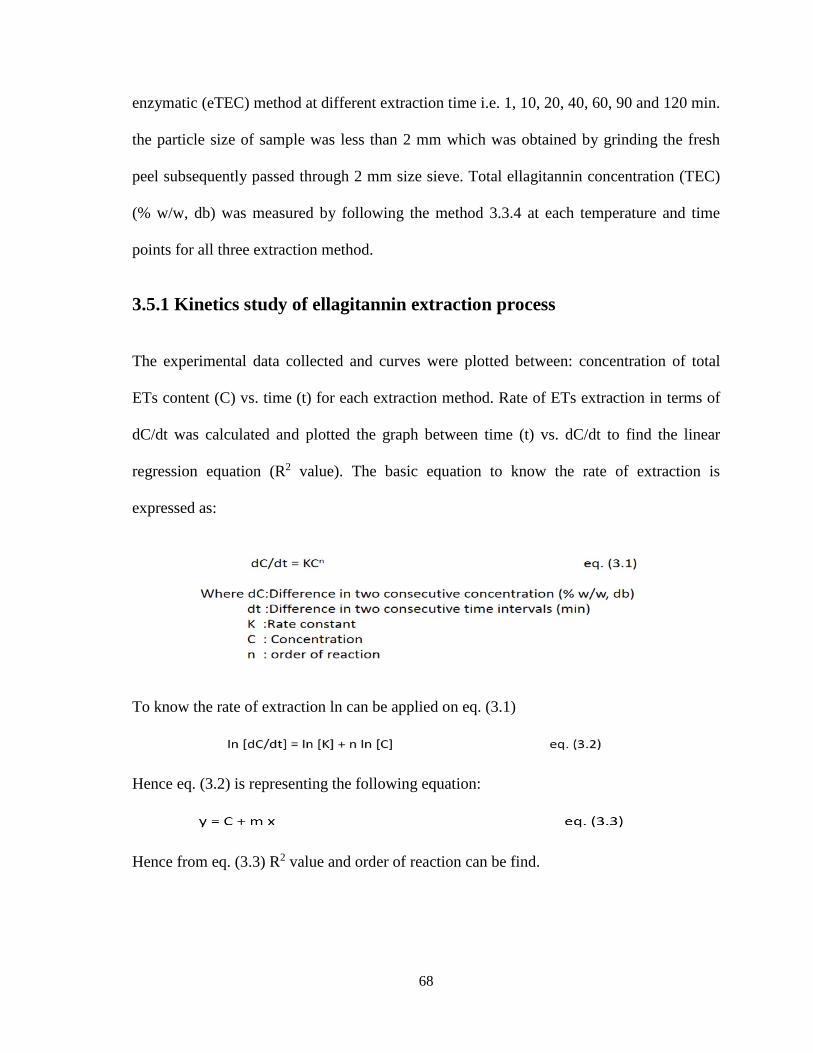
3.5.1 Kinetics study of ellagitannin extraction process
The experimental data collected and curves were plotted between: concentration of total
ETs content (C) vs. time (t) for each extraction method. Rate of ETs extraction in terms of
dC/dt was calculated and plotted the graph between time (t) vs. dC/dt to find the linear
regression equation (R2 value). The basic equation to know the rate of extraction is
expressed as:
To know the rate of extraction ln can be applied on eq. (3.1)
Hence eq. (3.2) is representing the following equation:
Hence from eq. (3.3) R2 value and order of reaction can be find.
68
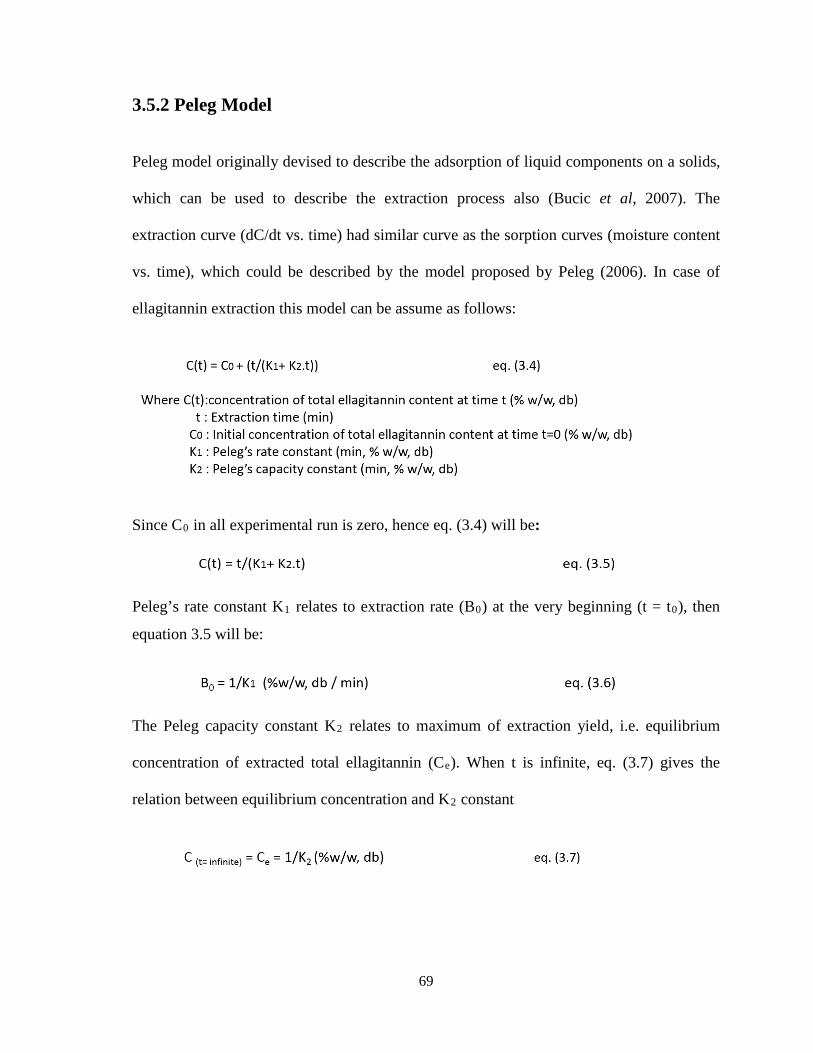
3.5.2 Peleg Model
Peleg model originally devised to describe the adsorption of liquid components on a solids,
which can be used to describe the extraction process also (Bucic et al, 2007). The
extraction curve (dC/dt vs. time) had similar curve as the sorption curves (moisture content
vs. time), which could be described by the model proposed by Peleg (2006). In case of
ellagitannin extraction this model can be assume as follows:
Since C0 in all experimental run is zero, hence eq. (3.4) will be:
Peleg’s rate constant K1 relates to extraction rate (B0) at the very beginning (t = t0), then
equation 3.5 will be:
The Peleg capacity constant K2 relates to maximum of extraction yield, i.e. equilibrium
concentration of extracted total ellagitannin (Ce). When t is infinite, eq. (3.7) gives the
relation between equilibrium concentration and K2 constant
69
3.6 Optimization study of ellagitannin extraction
To find out the optimum condition (temperature and time) for ETs extraction from
pomegranate peel, the RSM (Response Surface Methodology) has applied on all three
extraction method.
3.6.1 Response Surface methodology (RSM)
Experimental design
Response surface optimization is more advantageous than the traditional single parameter
optimization as it saves time and raw material. RSM was applied by using Design Expert
software (Trial version 9.0.3.1) to design the experiment by employing the central
composite design (CCD). Temperature range (30-80oC) and time (30-90 min) were selected
as (+1) and (-1) values of independent variables. Total ellagitannin content (TEC) as
%GAE (db) and antioxidant activity (AOA) as % RSA as DPPH were responses in
physical, chemical and enzymatic extraction method. The dependent variables TEC and
AOA for physical method coded as pTEC & pAOA, for chemical method coded as cTEC &
cAOA and for enzymatic method coded as eTEC & eAOA. As per CCD thirteen run of
experiment at different time and temperature combination were conducted (Table 3.1)
The ellagitannin extraction was carried out by following physical, chemical and enzymatic
methods at varying extraction temperature (19.6, 30.0, 55.0, 80.0 and 90.4 oC) and time
(17.6, 30, 60, 90 and 102.4 min). All experiments carried out randomly in order to
minimize the effect of unexplained variability in the observed responses due to systematic
errors.
70
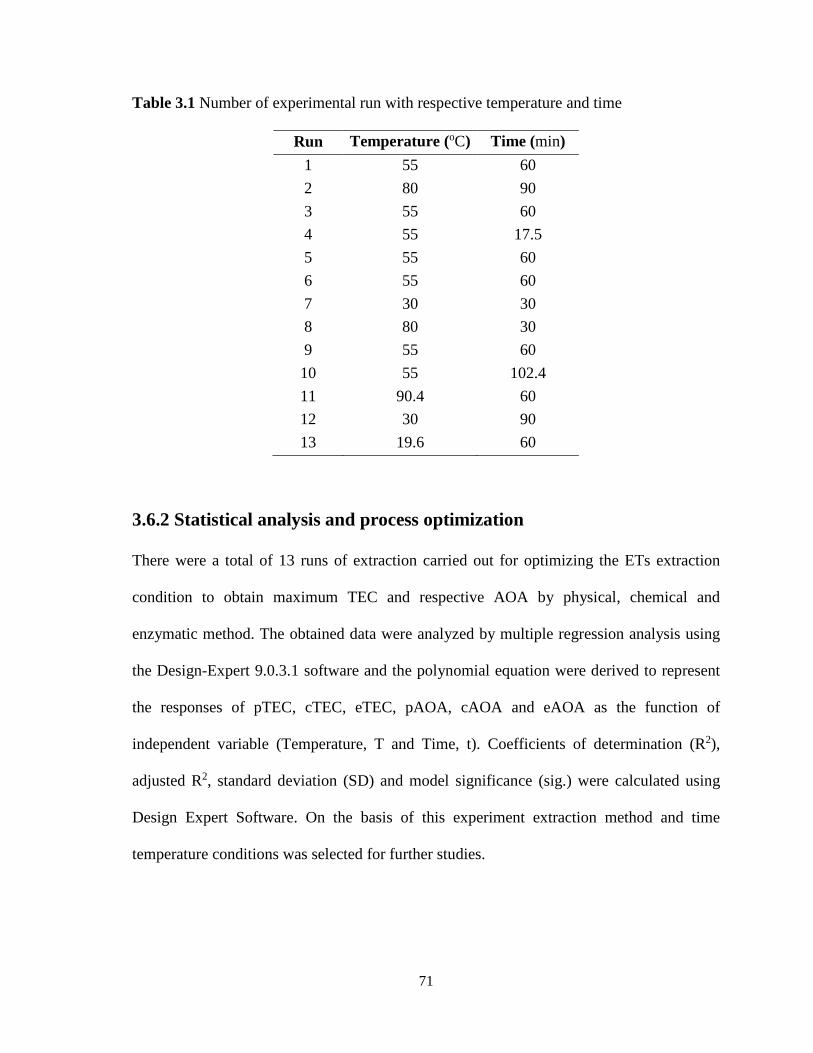
Table 3.1 Number of experimental run with respective temperature and time
Run Temperature (oC) Time (min) 1 55 60 2 80 90 3 55 60 4 55 17.5 5 55 60 6 55 60 7 30 30 8 80 30 9 55 60 10 55 102.4 11 90.4 60 12 30 90 13 19.6 60
3.6.2 Statistical analysis and process optimization
There were a total of 13 runs of extraction carried out for optimizing the ETs extraction
condition to obtain maximum TEC and respective AOA by physical, chemical and
enzymatic method. The obtained data were analyzed by multiple regression analysis using
the Design-Expert 9.0.3.1 software and the polynomial equation were derived to represent
the responses of pTEC, cTEC, eTEC, pAOA, cAOA and eAOA as the function of
independent variable (Temperature, T and Time, t). Coefficients of determination (R2),
adjusted R2, standard deviation (SD) and model significance (sig.) were calculated using
Design Expert Software. On the basis of this experiment extraction method and time
temperature conditions was selected for further studies.
71
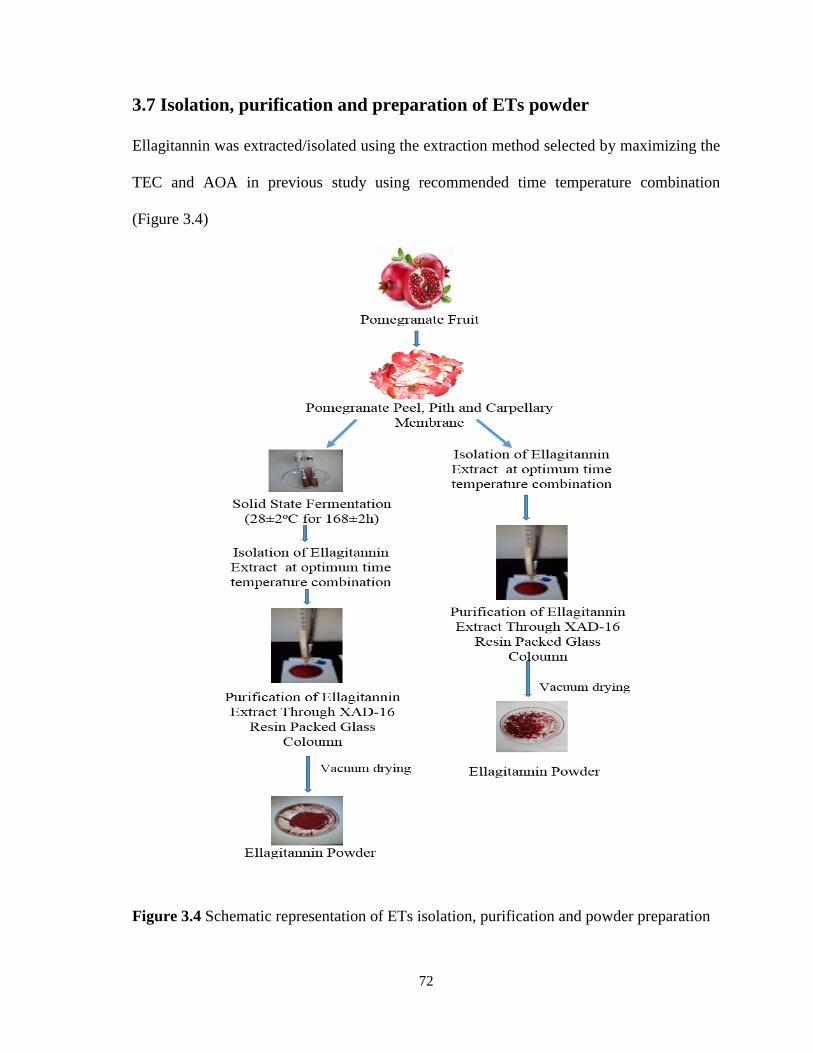
3.7 Isolation, purification and preparation of ETs powder
Ellagitannin was extracted/isolated using the extraction method selected by maximizing the
TEC and AOA in previous study using recommended time temperature combination
(Figure 3.4)
Figure 3.4 Schematic representation of ETs isolation, purification and powder preparation
72
3.7.1 Purification of ellagitannin extract
Amberlite XAD-16 resin was used as an ellagitannin adsorbing material (Seeram et al,
2004). Glass column (2”x40”) packed with XAD-16 resin (bed height 10”) and it was pre-
washed with methanol. Packed column equilibrated with distilled water for 12 h and
vacuum aspirated. Isolated ellagitannin extract from pomegranate peel passed through
separate prepared column. The optimal loading volume of ellagitannin extract was 100±10
ml per column. Each loaded column were eluted with copious amount (1 Liter) of distilled
water until the sugary pale yellow elute was clear in color. Remaining water was removed
from the resin by vacuum aspiration. Adsorbed ellagitannin in resin was eluted with 100 ml
solvent (Ethanol:Acetone: 80:20) to yield a dark brown color eluate (first few drops of elute
was rejected to avoid the sugar molecules contamination). To complete one cycle of elution
per column was 5-6 min. Elution was repeated with extra 25ml of elution solvent. All
purified ellagitannin extract were collected in pre weighed glass petri dishes for subsequent
vacuum drying. The XAD-16 resin packed columns were regenerated by washing with
distilled water and reused for purification of extract.
3.7.2 Drying of purified ellagitannin extract
Purified ellagitannin extracts were placed in a vacuum tray dryer. Then residual solvent was
removed under vacuum (-18 to -22 mbar pressure) and at 45±2oC to yield ellagitannin
powder (ETP). Total ellagitannin powder was weighed and yield was calculated.
73
3.8 Characterization of ellagitannin Powder
Purified ellagitannin powder (ETP) prepared pomegranate peel were characterized by FTIR
(for functional groups composition), UV-Vis spectrophotometer (to know the lambda
maxima of aqueous solution), HPLC (to identify the major polyphenolic compounds i.e.
ellagic acid, gallic acid and punicalagin) and LCMS (to identify the molecular composition
on the basis of mass/ion ratio)
3.8.1 Characterization of functional group by FTIR
Fourier Transform Infra-Red (FTIR) spectroscopy performed in ETP obtained from
pomegranate peel and FrPP along with ellagic acid and gallic acid standard. FTIR spectrum
recorded at room temperature (22ºC) using a FTIR (Bruker, USA) scanning over the
frequency range of 4000-400 cm-1 at a resolution of 4 cm-1. Spectra were collected after
baseline and background noise correction by using software (OPUS). Spectrum of each
sample was taken twice. Spectrum of standards and tests were compared with relevant peak
numbers. The positions of the different bond stretching and vibration were identified by
comparison with standard spectra.
3.8.2 Characterization of absorption maxima wavelength (λmax) by UV-Visible Spectrophotometry
UV–visible spectrum of ETP along with commercial standard of GA, EA and PU were
recorded on a UV-Visible spectrophotometer (Shimadzu UV- 2600 series) at room
temperature. The wavelength region ranges from 200–800 nm was employed for scanning.
Concentration of sample and standards 10 mg/l (solvent: methanol and water 1:1) was used
for recording the spectrum.
74
3.8.3 Characterization and quantification of major phenolic compounds by HPLC
HPLC analysis was performed as described by Seeram et al, (2004). HPLC system consists
of a binary pump, a photodiode array (PDA) detector and a column temperature controller.
System control and data analysis were processed with Waters Empower2 software. The
temperature of column was maintained at 30°C and the injection volume of sample and
standard solution was 20 µl. The chromatographic separation was performed on a Waters
C18 column (5 µm, 4.6 x 250 mm) using Potassium dihydrogen phosphate buffer (A)
0.12% w/v in HPLC grade water; of pH 2.5 and acetonitrile HPLC grade (B) as mobile
phase at a flow rate of 0.8 ml/min. The gradient program was set as follows: 0-15 min,
95 % A and 5% B; 15-20 min, 45 % A and 55% B, 20-21 min, 30% A and 70 % B, 21-25
min, 95% A and 5 % B and at 28 min stop. The chromatogram was monitored at a wave
length of 250 and 360 nm throughout the experiment. The HPLC mobile phase filtered
through a 0.45 µm membrane filter and then degassed. Commercial standard of gallic acid,
ellagic acid and punicalagin were used for quantification of these compounds in ETP under
same conditions of HPLC. Initially punicalagin (1 mg) was dissolved in MeOH:Water (1:1
v/v, 5 ml) then serially diluted to afford 0.025, 0.05, 0.10 and 0.20 mg/ml concentration.
Gallic acid (GA) (10 mg) was dissolved in MeOH:Water (1:1 v/v, 10 ml) and serially
diluted to afford 0.005. 0.010, 0.050, 0.10 and 0.20 mg/ml concentrations respectively.
Similarly ellagic acid (10 mg) was dissolved in MeOH:Water (1:1 v/v, 10 ml) with 0.1 ml 1
N NaOH and serially diluted to afford 0.0025. 0.005, 0.01 and 0.02 mg/ml concentrations
respectively. Each sample and standard were injected in duplicate and concentrations were
determined from the peak area by using the equation for linear regression obtained from the
75
calibration curves. The mean area percentages of the standards (PU, GA and PU) were used
for quantification.
3.8.4 Mass/ion characterization by LCMS
Liquid chromatography and mass spectrometry (LCMS) was used to detect and find the
mass ion ratio of polyphenolic compounds present in ETP. MS scan spectra of ETP from
infusion at full mass range were obtained under parameters: ionization mode, electron spray
(ES) negative mode; scan range: 100-1200 amu; scan rate: 1 scan/s. Peak identities were
obtained by matching their molecular ions (M-H+) obtained by ES/MS with the expected
theoretical molecular weight from literature data.
3.9 Physicochemical properties of ETP
Physicochemical properties viz. color, odor, pH, solubility, density, wettability,
hygroscopicity, water activity, moisture content, inorganic matter and antioxidant activity
of ETP were analyzed.
3.9.1 Colour, odour and pH
The color of ETP was measured using Hunter LAB color scale (L, a, b) in Minolta chroma
meter CR-400 (Minolta Corp, Osaka, Japan). The odour was judged by a semi trained panel
(n=15) and responses were recorded. The pH of ETP (1%, solution) measured by pH meters
(Lab India, India) at 25oC.
76
3.9.2 Solubility
Accurately 0.1 g of ETP was mixed by vortex with buffer solution of different pH (2, 4, 6,
8 and 10) as described by Cano-Chauca et al, (2005). Whole content was centrifuged at
3000 rpm for 5 min. An aliquot of 5 ml of supernatant was transferred to previously
weighed petri dish and dried at 103±2oC up to constant weight in hot air oven. Solubility
(g/100 ml) of ETP was calculated.
3.9.3 Density
Density of ETP was measured by using dry graduated measuring cylinder (10 ml).
Approximately 2 g ETP gently introduced in measuring cylinder, without compacting and
leveled. Volume noted to the nearest graduated unit. Density was calculated in g/ml.
3.9.4 Wettability
Wettability of ETP were determined by the using the method of Fuchs et al, (2006) with
slight modifications. The ETP (50 mg) were sprinkled over the surface of 50 ml distilled
water at 20oC without agitation. The time it took until the last powder particles submerged
was recorded.
3.9.5 Hygroscopicity
Hygroscopicity of ETP was determined by the method reported by Cai and Corke, (2000).
About 1 g ETP placed in aluminum moisture dish and equilibrated over a saturated NaCl
solution (75% RH) in a desiccator at 25ºC. After seven days, weighed the dishes with
sample and calculated the hygroscopicity in terms of g moisture/100 g solids.
77
3.9.6 Water activity
Water activity of ETP were measured using a water activity meter. Measurement performed
in triplicate and average value was reported.
3.9.7 Moisture content
Moisture content of ETP was estimated by using KF auto titrator (Metrohom E547). The
titrator had equipped with multi dosimat motor, driven piston burette with drum counter
indicator utilizing a dead stop end point method. About 100 mg ETP was incorporated in to
titration vessel and dispersed in to the middle of vessels solution. The titration was
monitored up to end point. KF factor also calculated for Karl Fischer reagent by using
known amount of distilled water as standard. Water content calculated as follows:
% water content= KF Factor*Titre Value*100/sample weight
3.9.8 Total inorganic matters in ETP
Total inorganic matter in ETP was analyzed by incinerating the ETP (1 g) in silica crucible
at 550ºC in muffle furnace (Alfa Instruments, India) and calculated by gravimetric
difference as mentioned in AOAC (2005).
3.9.9 Measurement of Antioxidant Activity in ETP
The antioxidant activity of ETP was measured in terms of radical scavenging ability using
DPPH as proposed by Brand-Williams et al, (1995). 10 mg ETP diluted with distilled water
and methanol (1:1; 10 ml). Aliquot of 100 µL of samples were mixed with 5 ml of 100 µM
DPPH methanolic solution. The mixture was placed in dark at room temperature for 60
min. The absorbance of resulting solution was read at 520 nm using UV-VIS
spectrophotometer. The antioxidative activity was expressed in terms of % radical
78
scavenging activity as DPPH. The ability to scavenge the DPPH radical was calculated
using the following equation:
Antioxidant activity as DPPH (%) = ((A0-A1)/A0) x100
Where A0 is the absorbance of the control, and A1 is the absorbance of the sample
3.10 Thermal properties of ETP
Thermal properties i.e. mass change during heating, of ETP was analyzed by Thermo
Gravimetric Analyzer (TGA) and glass transition temperature (Tg) and heat capacity of
ETP was analyzed by Differential Scanning Calorimeter (DSC)
3.10.1 Measurement of mass loss by TGA
Thermo gravimetric analysis was performed to find the mass loss when thermal degradation
occurs in ETP. A TGA was used to analyze about 20 mg of ETPs at a heating rate of 20ºC
per min from 20 to 500ºC with a high response function at 4ºC per min in regions of rapid
mass loss. The software (NETZSCH Proteus) was used to compute the mass change curve.
3.10.2 Measurement of glass transition temperature and heat capacity by DSC
Calorimetric measurement was performed as described by Sessler et al, (2013) by
differential scanning calorimetry using a Differential Scanning Calorimeter (DSC) coupled
with heating and cooling system. Its aluminum pan was filled with 15 mg of ETs and
sealed. An empty pan was used as reference and nitrogen was used as purge gas. Sample
was heated from RT to 500ºC at a rate of 10ºC per min. Thermogram obtained was
analyzed using software (NETZSCH Proteus).
79
3.11 Antibacterial properties of ellagitannin powder
Antibacterial activity of ETP were evaluated against food pathogenic bacteria to know the
capacity of growth inhibition of bacteria in-vitro. The minimum inhibitory concentration
(MIC) of ETP were also found.
3.11.1 In-vitro antibacterial activity
In-vitro antibacterial activity was determined using agar well diffusion assay method
proposed by Al-Zoreky (2009), against the pathogenic bacterium (Bacillus subtilis,
Staphylococcus aureus, Pseudomonas aeruginosa, Salmonella typhimurium and
Escherichia coli). One ml of freshly grown cultures were inoculated into 99 ml of the
Muller Hinton agar solution (106 cfu/ml). The 25 ml inoculated agar medium immediately
mixed and poured in agar plate aseptically. The solidified agar media was bored with sterile
borer of diameter 6mm and filled with 50 µL of ellagitannin solution (5 mg/ml). The
ampicillin solution of 0.05 mg/ml was used as a positive control. The solution kept for
diffusion and then incubated at 37oC for 48 h. The antibacterial activity was measured in
terms of the diameter of zone of inhibition. All the experiments conducted in triplicates.
3.11.2 Minimum inhibitory concentration (MIC) of ETP
MIC of the ETPs were examined as per method of Al-Zoreky (2009). Series of dilutions (0
to 10 mg/ml) were made of the ETP with Muller Hinton agar solution and poured 5µL of
test bacterium containing approximately 104 cfu were spotted. The plates were incubated at
37oC for 48 h. The MIC was determined as the lowest concentration of solution required to
inhibit the visible growth of each organism in agar plate.
80
3.12 In-Vitro Cytotoxicity test of ETP
Cytotoxic effect of any compound can be measured in terms of percent cell viability/cell
death (apoptosis) of healthy mammalian cells. Primary cultures (PBMCs/HUVEC) or
laboratory established cell lines (HeLa/HEK) was treated with the various concentrations of
the given compound and apoptosis is measured by MTT assay/Alamar Blue assay/Anexin
V based cell sorting.
Alamar Blue assay
Alamar Blue is a useful non-toxic and more sensitive alternative assay to the commonly
used MTT assay (3-(4, 5-dimethylthiazol-2-yl)-2, 5-diphenyl-tetrazolium bromide (O’Brien
et al., 2000). Alamar Blue is chemically known as resazurin (IUPAC name: 7-hydroxy-10-
oxidophenoxazin-10-ium-3-one) which is a cell permeable, non-toxic and weakly
fluorescent blue indicator dye and can be easily dissolved at physiological pH. Resazurin
works as a redox indicator that undergoes colorimetric change in response to cellular
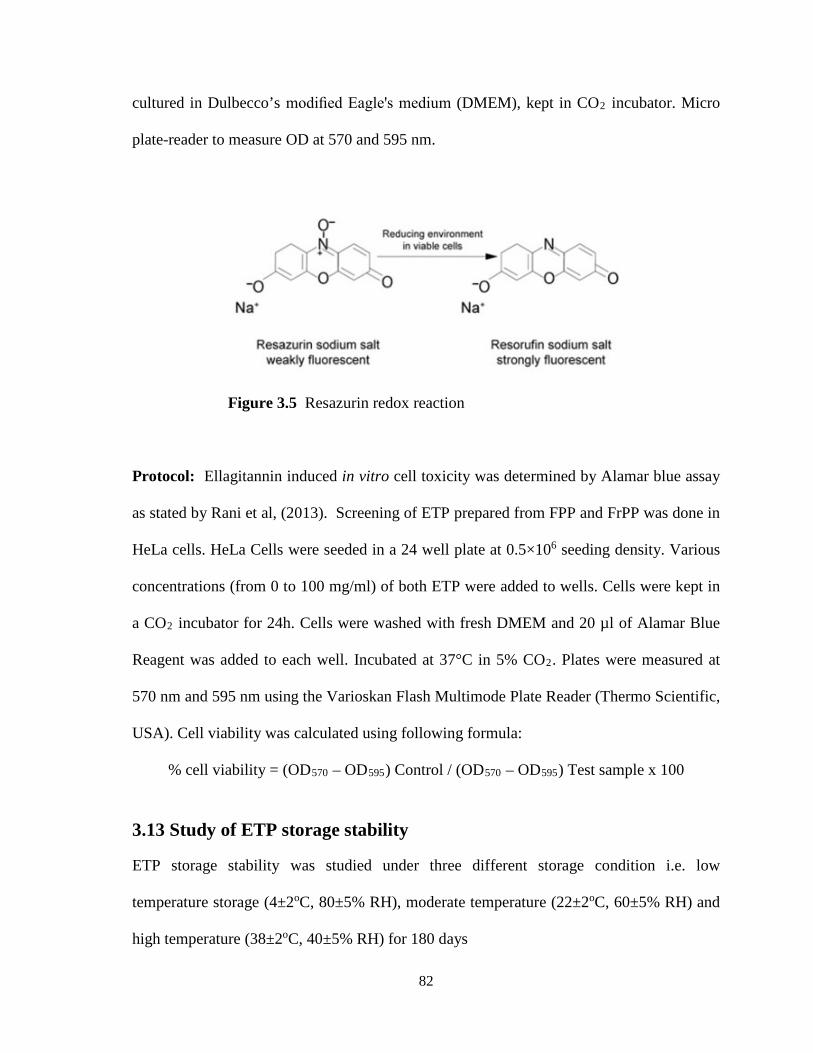
metabolic activity. The reduced form of resaruzin is called resorufin which is pink and
highly fluorescent (Figure 3.5). The amount of resorufin produced is proportional to the
number of viable cells which is measured using a microplate reader with 570 nm and 595
nm. Since resorufin is produced in response to active metabolic processes, this assay
provides a direct measurement of cell viability. Further, cell viability is correlated to cell
death or cytotoxic effect of compound when assayed with proper control conditions.
Materials/reagents: Resazurin was dissolved in phosphate buffer solution (PBS) (pH 7.4) to prepare 0.15 mg/ml
solution. Filtered to the resazurin solution through a 0.2 μm filter and kept in light protected
container. Similarly, ETP stock solution (100 mg/ml) was prepared in PBS. HeLa cells
81
cultured in Dulbecco’s modified Eagle's medium (DMEM), kept in CO2 incubator. Micro
plate-reader to measure OD at 570 and 595 nm.
Figure 3.5 Resazurin redox reaction
Protocol: Ellagitannin induced in vitro cell toxicity was determined by Alamar blue assay
as stated by Rani et al, (2013). Screening of ETP prepared from FPP and FrPP was done in
HeLa cells. HeLa Cells were seeded in a 24 well plate at 0.5×10⁶ seeding density. Various
concentrations (from 0 to 100 mg/ml) of both ETP were added to wells. Cells were kept in
a CO2 incubator for 24h. Cells were washed with fresh DMEM and 20 µl of Alamar Blue
Reagent was added to each well. Incubated at 37°C in 5% CO2. Plates were measured at
570 nm and 595 nm using the Varioskan Flash Multimode Plate Reader (Thermo Scientific,
USA). Cell viability was calculated using following formula:
% cell viability = (OD570 – OD595) Control / (OD570 – OD595) Test sample x 100
3.13 Study of ETP storage stability
ETP storage stability was studied under three different storage condition i.e. low
temperature storage (4±2oC, 80±5% RH), moderate temperature (22±2oC, 60±5% RH) and
high temperature (38±2oC, 40±5% RH) for 180 days
82
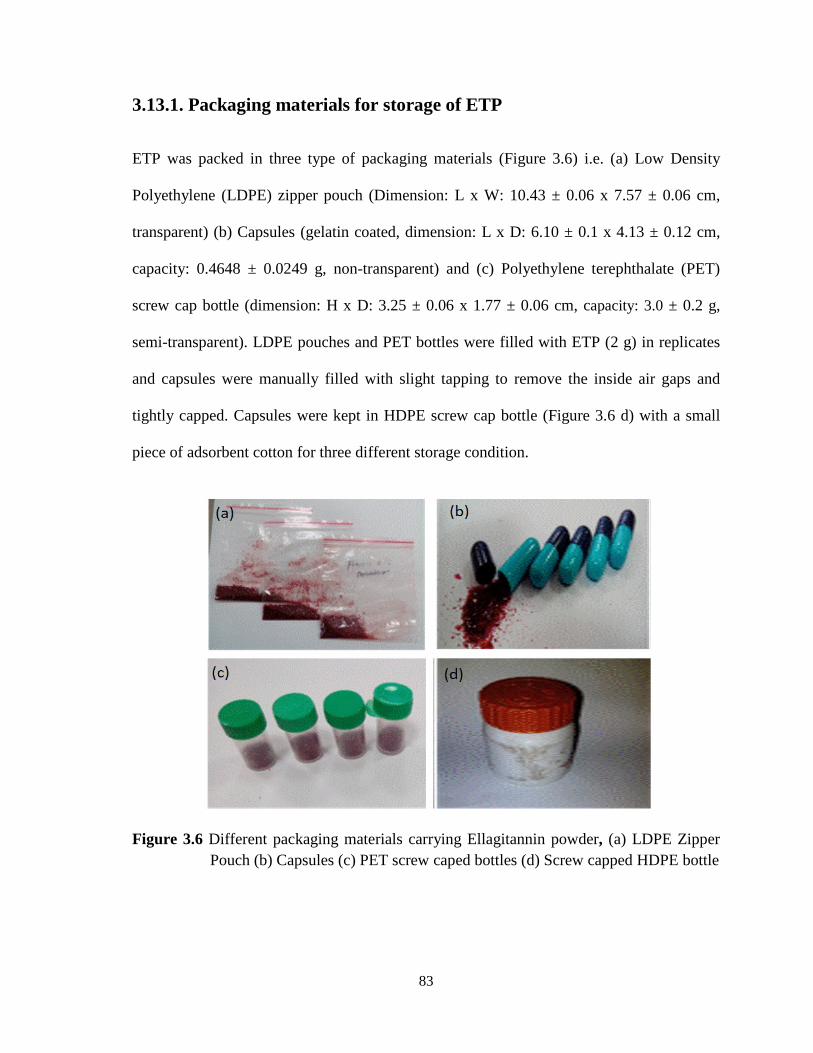
3.13.1. Packaging materials for storage of ETP
ETP was packed in three type of packaging materials (Figure 3.6) i.e. (a) Low Density
Polyethylene (LDPE) zipper pouch (Dimension: L x W: 10.43 ± 0.06 x 7.57 ± 0.06 cm,
transparent) (b) Capsules (gelatin coated, dimension: L x D: 6.10 ± 0.1 x 4.13 ± 0.12 cm,
capacity: 0.4648 ± 0.0249 g, non-transparent) and (c) Polyethylene terephthalate (PET)
screw cap bottle (dimension: H x D: 3.25 ± 0.06 x 1.77 ± 0.06 cm, capacity: 3.0 ± 0.2 g,
semi-transparent). LDPE pouches and PET bottles were filled with ETP (2 g) in replicates
and capsules were manually filled with slight tapping to remove the inside air gaps and
tightly capped. Capsules were kept in HDPE screw cap bottle (Figure 3.6 d) with a small
piece of adsorbent cotton for three different storage condition.
Figure 3.6 Different packaging materials carrying Ellagitannin powder, (a) LDPE Zipper Pouch (b) Capsules (c) PET screw caped bottles (d) Screw capped HDPE bottle
83
3.13.2 Response parameters during storage
During storage, color, moisture and antioxidant activity of ETP were monitored at 15 days
interval up to 180 days, as response parameters. Color was analyzed as described in method
3.9.1, moisture was analyzed as described in method 3.9.7, AOA was analyzed as % RSA
as DPPH described in method 3.9.9. Major polyphenolic compounds (EA, GA and PU)
were quantified by HPLC as described in method 3.8.3 at the initial and last day of storage.
3.14 Application of ellagitannin powder
Prepared ellagitannin powder was applied in preparation of sharbet or cognate to syrup
flavored with lemon extract as well as plain sharbet.
3.14.1 Lemon extract
Lemon extract was purchased from Relience fresh store, New Delhi. The brand name is
Lemoneej manufactured by Dabur India Ltd. The Lemoneej was analyzed for its chemical
properties i.e. pH, colour, Total Soluble Solids (TSS), acidity and ascorbic acid.
3.14.2 Chemical analysis of lemon extract
pH and colour of lemon extract were analyzed by using method 3.9.1, measurement of total
soluble solid (TSS) by using a digital refractometer calibrated by using distilled water. The
instrument was set to measure %TSS. (Shwartz et al, 2009)
84
3.14.2.1 Titrable acidity (TA)
TA was analyzed by auto titration unit equipped with a titration assembly. About 5 ml
sample was diluted with 10 ml distilled water and titrated with 0.1 N NaOH to pH 8.2.
Titrable acidity was expressed %, w/v as citric acid. (Shwartz et al, 2009)
3.14.2.2 Measurement of Ascorbic acid (Vitamin C)
Ascorbic acid was analyzed in lemon extract by 2, 6 dichlorophenol indophenol dye.
Phosphoric acid solution: 15 g HPO4 + 40 ml acetic acid + 200 ml water and volume was
makeup to 500 ml, Ascorbic acid standard: 50 mg ascorbic acid volume makeup 50 ml with
phosphoric acid solution, Titrant dye: 50 mg of 2, 6 dichlorophenol indophenol + 42 mg
sodium bicarbonate dissolved and volume madeup to 200 ml with distilled water.
Standardization of dye: taken 3 ml of standard ascorbic acid solution in 100 ml conical
flask was taken added with 5 ml phosphoric acid solution and titrated with titrant dye up to
a light pink colour end point and calculated the dye factor as follows:
Dye factor (vitamin C, mg/ml) = weight of ascorbic acid x aliquot/ Volume make up x TV
Sample titration: 2 ml of sample + 5 ml of phosphoric acid solution taken in 100 ml conical
flask and titrated with dye till light pink colour end point. Simultaneously a blank test
without sample was also carried out as above. (AOAC, 2005)
Vitamin C (% w/v) = TVtest – TVblank x Dye factor x 100/ volume of sample
3.14.3 Preparation of sugar syrup
Sugar syrup was prepared by dissolving 650 g sugar to 1 litre of water and heated to boil
then cooled to room temperature and adjusted the TSS to 65 oBrix
85

3.14.4 Preparation of ellagitannin based plain sharbet (EPS)
Plain sharbet was prepared from sugar syrup and ellagitannin powder. Sugar syrup (TSS
65%) diluted four times with water and maintained the TSS 15 ± 0.5 % either with water or
sugar syrup. In six set of 100 ml of diluted syrup, ellagitannin powder was added at
different concentration (2, 10, 20, 30, 40 and 50 mg) and coded as EPS2, EPS10, EPS20,
EPS30, EPS40, and EPS50 for sensory and chemical analysis.
3.14.5 Preparation of ellagitannin based lemon flavored sharbet (ELS)
Lemon flavored sharbet was prepared from sugar syrup, ellagitannin powder and lemon
extract. Sugar syrup (TSS 65%) diluted four times with water and maintained the TSS 15 ±
0.5 % either with water or sugar syrup. In six set of 100 ml of diluted syrup ellagitannin
powder was added at different concentration (2, 10, 20, 30, 40 and 50 mg) and lemon
extract (0.4 ml) and coded as ELS2, ELS10, ELS20, ELS30, ELS40, ELS50 for sensory
and chemical analysis.
3.14.6 Chemical analysis of Sharbet
Both type of Sharbet were analyzed for pH, color (method 3.9.1), titrable acidity, TSS
(method 3.15.2) and AOA (method 3.9.9).
3.14.7 Sensory analysis of Sharbet
Plain sharbet (EPS2, EPS10, EPS20, EPS30, EPS40, and EPS50) and lemon flavored
sharbet (ELS2, ELS10, ELS20, ELS30, ELS40, and ELS50) were analyzed for colour
odour, taste and over all acceptability by sensory panel on hedonic scale (1 (Dislike
extremely) to 9 (Like Extremely)) (Table 3.2). Sensory panel was constituted by involving
the food technologists (n=24). They were having sufficient knowledge about the technical
86
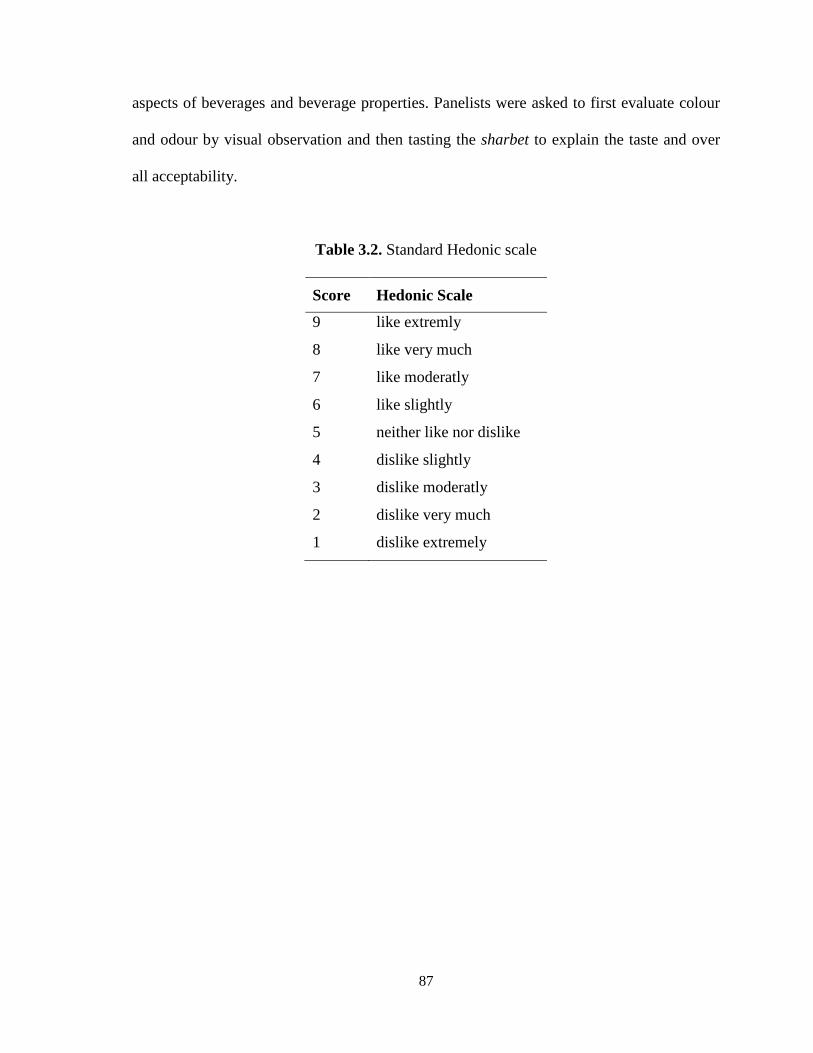
aspects of beverages and beverage properties. Panelists were asked to first evaluate colour
and odour by visual observation and then tasting the sharbet to explain the taste and over
all acceptability.
Table 3.2. Standard Hedonic scale
Score Hedonic Scale
9 like extremly
8 like very much
7 like moderatly
6 like slightly
5 neither like nor dislike
4 dislike slightly
3 dislike moderatly
2 dislike very much
1 dislike extremely
87