Census of Chemists and Chemical Engineers
2
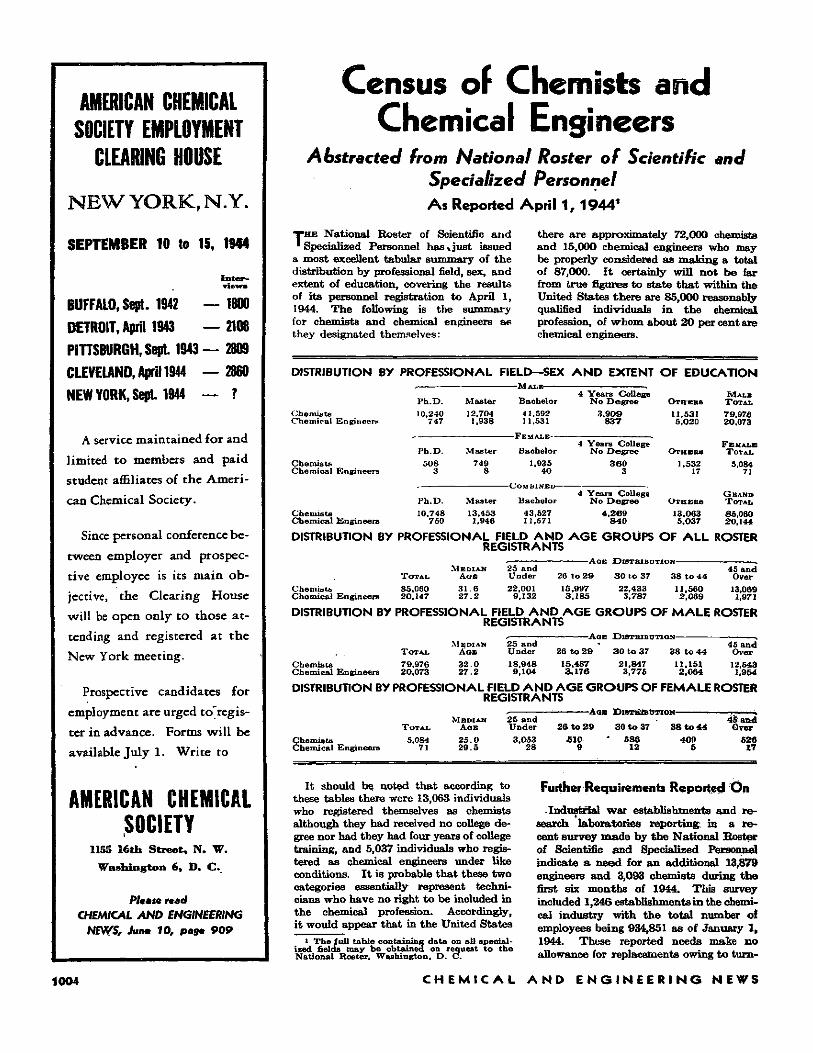
AMERICAN CHEMICAL SOCIETY EMPLOYMENT CLEARING HOUSE NEW YORK, Ν. Y. SEPTEMBER 10 to 15, 1944 Inter- views - 1800 -2108 -2809 -2860 . ? BUFFALO, Sept. 1942 DETROIT, April 1943 PITTSBURGH, Sept. 1943 CLEVELAND, April 1944 NEW YORK, Sept. 1944 A service maintained for and limited to members and paid student affiliates of the Ameri- can Chemical Society. Since personal conference be- tween employer and prospec- tive employee is its main ob- jective, the Clearing House will be open only to those at- tending and registered at the New York meeting. Prospective candidates for employment are urged to regis- ter in advance. Forms will be available July 1. Write to AMERICAN CHEMICAL SOCIETY 1155 16th Street, N. W. Washington 6, D. C. Phase read CHEMICAL AND ENGINEERING NEWS, June 10, page 909 Census of Chemists and Chemical Engineers Abstracted from National Roster of Scientific and Specialized Personnel As Reported April 1,1944 1 THE National Roster of Scientific and Specialized Personnel has just issued a most excellent tabular summary of the distribution by professional field, sex, and extent of education, covering the results of its personnel registration to April 1, 1944. The following is the summary for chemists and chemical engineers as they designated themselves: there are approximately 72,000 chemists and 15,000 chemical engineers who may be properly considered as making a total of 87,000. It certainly will not be far from true figures to state that within the United States there are 85,000 reasonably qualified individuals in the chemical profession, of whom about 20 per cent are chemical engineers. DISTRIBUTION BY PROFESSIONAL FIELD—SEX AND EXTENT OF EDUCATION . MALE- Chemists Chemical Engineers Chemists Chemical Engineers Chemists Chemical Engineers Ph.D. 10,240 747 Master 12.704 1.938 Bachelor 41,592 11.531 4 Years College No Degree 3.909 837 -FEMALB- Ph.D. 508 3 749 8 Bachelor 1.935 40 4 Years College No Degree 360 3 Ph.D. 10.748 750 Master 13.453 1.946 -COMBINED— Bachelor 43,527 11.571 4 Years College No Degree 4,269 840 OTHERS 11,531 5,020 ΟTHERS 1.532 17 13,063 5.037 MALE TOT AL 79,976 20,073 FEMALE TOTAL 5,084 71 GRAND TOTAL 85,060 20,144 DISTRIBUTION BY PROFESSIONAL FIELD A N D AGE GROUPS OF ALL ROSTER REGISTRANTS Chemists Chemical Engineers TOTAL 85,060 20,147 MEDIAN AGE 31.6 27.2 25 and Under 22.001 9,132 -AGE DlSTRlBUTION- 45 and 26 t o 2 9 3 0 t o 3 7 3 8 t o 4 4 Over 15.997 3,185 22.433 3,787 11,560 2,069 13,069 1,971 DISTRIBUTION BY PROFESSIONAL FIELD A N D AGE GROUPS OF M A L E ROSTER REGISTRANTS Chemists Chemical Engineers TOTAL 79,976 20,073 MEDIAN ÀGE 32.0 27.2 25 and Under 18,948 9,104 -AGE DISTRIBUTION- 45 and 26 to 29 30 to 37 38 to 44 Over 15,487 3,176 21,847 3,775 11,151 2,064 12,543 1,954 DISTRIBUTION BY PROFESSIONAL FIELD A N D AGE GROUPS OF FEMALE ROSTER REGISTRANTS Chemists Chemical Engineers TOTAL 5,084 71 MEDIAN AGE 25.0 29.5 25 and Under 3,053 28 -AGE DISTRIBUTION- 45 and 26 t o 2 9 3 0 t o 3 7 3 8 t o 4 4 Over 510 9 586 12 409 5 526 17 It should be noted that according to these tables there were 13,063 individuals who registered themselves as chemists although they had received no college de- gree nor had they had four years of college training, and 5,037 individuals who regis- tered as chemical engineers under like conditions. It is probable that these two categories essentially represent techni- cians who have no right to be included in the chemical profession. Accordingly, it would appear that in the United States 1 The full table containing data on all special- ized fields may be obtained on request to the National Roster, Washington, D. C. Further Requirements Reported On Industrial war establishments and re- search laboratories reporting in a re- cent survey made by the National Roster of Scientific and Specialized Personnel indicate a need for an additional 13,879 engineers and 3,093 chemists during the first six mouths of 1944. This survey included 1,246 establishments in the chemi- cal industry with the total number of employees being 934,851 as of January 1, 1944. These reported needs make no allowance for replacements owing to turn- 1004 CHEMICAL AND ENGINEERING NEWS Master OTHERS
Transcript of Census of Chemists and Chemical Engineers
AMERICAN CHEMICAL SOCIETY EMPLOYMENT
CLEARING HOUSE
N E W YORK, Ν. Y.
SEPTEMBER 10 to 15, 1944
Interviews
- 1800 -2108 -2809 -2860 . ?
BUFFALO, Sept. 1942 DETROIT, April 1943 PITTSBURGH, Sept. 1943 CLEVELAND, April 1944 NEW YORK, Sept. 1944
A service maintained for and
limited to members and paid
student affiliates of the Ameri
can Chemical Society.
Since personal conference be
tween employer and prospec
tive employee is its main ob
jective, the Clearing House
will be open only t o those at
tending and registered at the
New York meeting.
Prospective candidates for
employment are urged to regis-
ter in advance. Forms wi l l be
available July 1. Write to
AMERICAN CHEMICAL SOCIETY
1155 16th Street, N. W. Washington 6, D. C.
Phase read CHEMICAL AND ENGINEERING
NEWS, June 10, page 909
Census of Chemists and Chemical Engineers
Abstracted from National Roster of Scientific and Specialized Personnel As Reported April 1,19441
THE National Roster of Scientific and Specialized Personnel has just issued
a most excellent tabular summary of the distribution by professional field, sex, and extent of education, covering the results of its personnel registration to April 1, 1944. The following is the summary for chemists and chemical engineers as they designated themselves:
there are approximately 72,000 chemists and 15,000 chemical engineers who may be properly considered as making a total of 87,000. It certainly will not be far from true figures to state that within the United States there are 85,000 reasonably qualified individuals in the chemical profession, of whom about 20 per cent are chemical engineers.
DISTRIBUTION BY PROFESSIONAL FIELD—SEX A N D EXTENT OF EDUCATION . M A L E -
C h e m i s t s C h e m i c a l Eng ineers
C h e m i s t s C h e m i c a l Eng ineers
C h e m i s t s C h e m i c a l E n g i n e e r s
P h . D . 10,240
747
M a s t e r 12.704
1.938
B a c h e l o r 4 1 , 5 9 2 11.531
4 Y e a r s Co l l ege N o D e g r e e
3 . 9 0 9 8 3 7
- F E M A L B -
P h . D . 5 0 8
3 7 4 9
8
B a c h e l o r 1.935
4 0
4 Y e a r s Col lege N o D e g r e e
3 6 0 3
P h . D . 10 .748
7 5 0
M a s t e r 13 .453
1.946
-COMBINED—
Bache lor 4 3 , 5 2 7 11 .571
4 Y e a r s Col lege N o D e g r e e
4 , 2 6 9 8 4 0
O T H E R S
11 ,531 5,020
ΟTHERS 1.532
17
1 3 , 0 6 3 5 . 0 3 7
M A L E T O T AL
79 ,976 20 ,073
F E M A L E TOTAL
5,084 71
GRAND TOTAL 8 5 , 0 6 0 2 0 , 1 4 4
DISTRIBUTION BY PROFESSIONAL FIELD AND AGE GROUPS OF A L L ROSTER REGISTRANTS
Chemists C h e m i c a l E n g i n e e r s
TOTAL 8 5 , 0 6 0 2 0 , 1 4 7
M E D I A N AGE 3 1 . 6 2 7 . 2
2 5 a n d U n d e r 22 .001
9 , 1 3 2
-AGE DlSTRlBUTION-4 5 a n d
26 t o 2 9 3 0 t o 37 3 8 t o 4 4 Over 15 .997
3 , 1 8 5 22.433 3,787
11,560 2,069
13,069 1,971
DISTRIBUTION BY PROFESSIONAL FIELD AND AGE GROUPS OF MALE ROSTER REGISTRANTS
C h e m i s t s C h e m i c a l E n g i n e e r s
TOTAL
7 9 , 9 7 6 2 0 , 0 7 3
M E D I A N ÀGE
32.0 27.2
25 and Under
18,948 9,104
- A G E DISTRIBUTION-45 and
26 to 29 30 to 37 38 to 44 Over
15,487 3,176
21,847 3,775
11,151 2,064
12,543 1,954
DISTRIBUTION BY PROFESSIONAL FIELD A N D AGE GROUPS OF FEMALE ROSTER REGISTRANTS
C h e m i s t s C h e m i c a l Eng ineers
TOTAL
5,084 71
M E D I A N AGE
2 5 . 0 2 9 . 5
2 5 a n d U n d e r
3 , 0 5 3 2 8
- A G E DISTRIBUTION-4 5 a n d
2 6 t o 2 9 3 0 t o 37 3 8 t o 4 4 Over
5 1 0 9
586 1 2
409 5
526 17
It should be noted that according to these tables there were 13,063 individuals who registered themselves as chemists although they had received no college degree nor had they had four years of college training, and 5,037 individuals who registered as chemical engineers under like conditions. It is probable that these two categories essentially represent technicians who have no right to be included in the chemical profession. Accordingly, it would appear that in the United States
1 The full table containing data on all specialized fields may be obtained on request to the National Roster, Washington, D . C.
Further Requirements Reported On
Industrial war establishments and research laboratories reporting in a recent survey made by the National Roster of Scientific and Specialized Personnel indicate a need for an additional 13,879 engineers and 3,093 chemists during the first six mouths of 1944. This survey included 1,246 establishments in the chemical industry with the total number of employees being 934,851 as of January 1, 1944. These reported needs make no allowance for replacements owing to turn-
1004 C H E M I C A L A N D E N G I N E E R I N G N E W S
Master
OTHERS
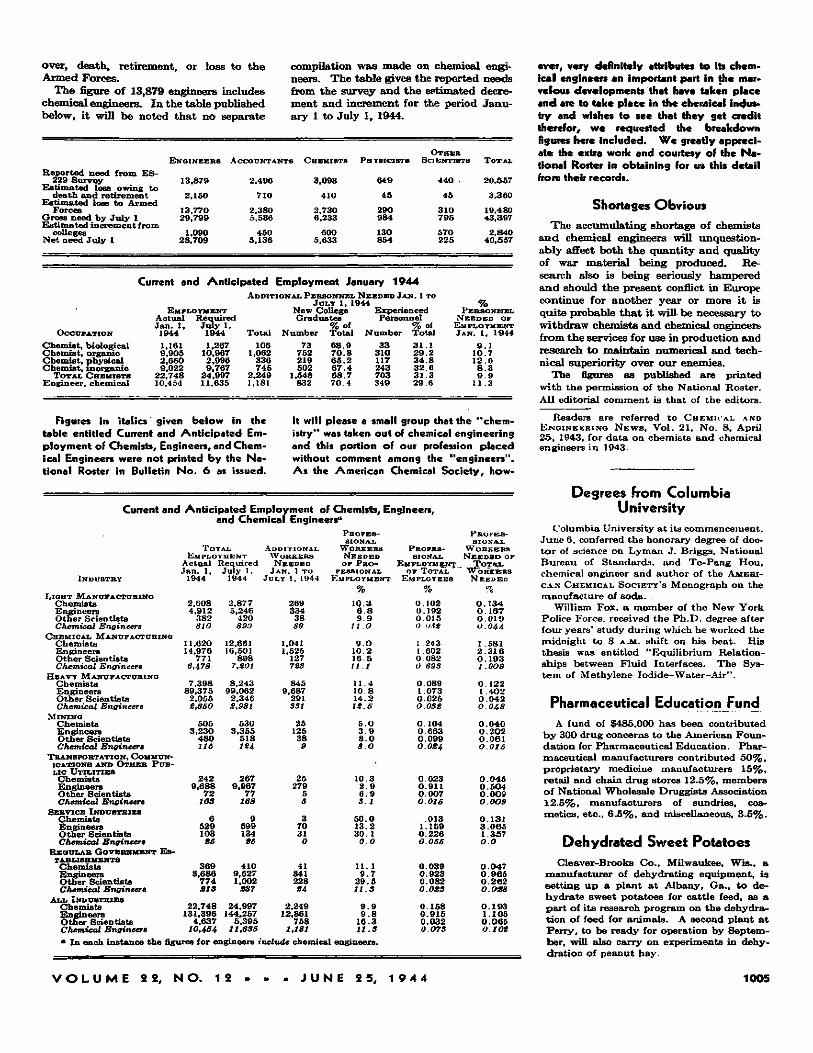
over, death, retirement, or loss to the Armed Forces.
The figure of 13,879 engineers includes chemical engineers. In the table published below, it will be noted that no separate
Figures in italics given below in the table entitled Current and Anticipated Employment of Chemists, Engineers, and Chemical Engineers were not printed by the N a tional Roster in Bulletin N o . 6 as issued.
compilation was made on chemical engineers. The table gives the reported needs from the survey and the estimated decrement and increment for the period January 1 to July 1, 1944.
It will please a small group that the "chemistry" was taken out of chemical engineering and this portion of our profession placed without comment among the "engineers". A s the American Chemical Society, how
ever, very definitely attributes to its chemical engineers an important part in the marvelous developments that have taken place and are to take place in the chemical industry and wishes to see that they get credit therefor, we requested the breakdown figures here included. W e greatly appreciate the extra work and courtesy of the N a tional Roster in obtaining for us this detail from their records.
Shortages Obvious The accumulating shortage of chemists
and chemical engineers will unquestionably affect both the quantity and quality of war material being produced. Research also is being seriously hampered and should the present conflict in Europe continue for another year or more it is quite probable that it will be necessary to withdraw chemists and chemical engineers from the services for use in production and research to maintain numerical and technical superiority over our enemies.
The figures as published are printed with the permission of the National Roster. All editorial comment is that of the editors.
Headers are referred to CHEMICAL AND ENGINEERING N E W S , Vol. 21, No. 8, April 25, 1943, for data on chemists and chemical engineers in 1943.
Degrees from Columbia University
Columbia University at its commencement, June 6, conferred the honorary degree of doctor of science on Lyman J. Briggs, National Bureau of Standards, and Te-Pang Hou, chemical engineer and author of the AMERICAN CHEMICAL SOCIETY'S Monograph on the manufacture of soda. .
William Fox, a member of the New York Police Force, received the Ph.D. degree after four years' study during which he worked the midnight to 8 A.M. shift on his beat. His thesis was entitled "Equilibrium Relationships between Fluid Interfaces. The System of Methylene Iodide-Water-Air".
Pharmaceutical Education Fund A fund of $485,000 has been contributed
by 300 drug concerns to the American Foundation for Pharmaceutical Education. Pharmaceutical manufacturers contributed 50%, proprietary medicine manufacturers 15%, retail and chain drug stores 12.5%, members of National Wholesale Druggists Association 12.5%, manufacturers of sundries, cosmetics, etc., 6.5%, and miscellaneous, 3.5%.
Dehydrated Sweet Potatoes Cleaver-Brooks Co., Milwaukee, Wis., a
manufacturer of dehydrating equipment, is setting up a plant at Albany, Ga., to dehydrate sweet potatoes for cattle feed, as a part of its research program on the dehydration of feed for animals. A second plant at Perry, to be ready for operation by September, will also carry on experiments in dehydration of peanut hay.
Reported need from ES-229 Survey
Estimated loss owing to death and retirement
Estimated loss to Armed Forces
Gross need by July 1 Estimated increment from
colleges Net need July 1
ENGINEERS
13,879 2,150
13,770 29,799
1,090 28,709
ACCOUNTANTS
2,496 7 1 0
2.380 5.586
450 5,136
CHEMISTS
3,093 4 1 0
2,730 6,233
600 5,633
PHYSICISTS
6 4 9
4 5
290 984 130 854
OTHER SCIENTISTS
440 . 4 5
310 795 570 225
TOTAL
20,557 3,360
19,480 43,397
2,840 40,557
Current and Anticipated Employment January 1 9 4 4
OCCUPATION Chemist, biological Chemist, organic Chemist, physical Chemist, inorganic
TOTAL CHEMISTS Engineer, chemical
ADDITIONAL PERSONNEL NEEDED JAN. 1 TO
V O L U M E 2 2, N O . 1 2 » » . J U N E 2 5, 1 9 4 4 1005
Current and Anticipated Employment of Chemists, Engineers, and Chemical Engineers
PROFES- PROFES-SIONAL SIONAL
TOTAL ADDITIONAL WORKERS PROFES- WORKERS EMPLOYMENT WORKERS NE E DE D SIONAL N E E D E D OF
Actual Required N E E D E D OF PRO- EMPLOYMENT TOTAL Jan. 1, July 1, JAN. 1 TO FESSIONAL OF TOTAL W O R K E R S
1944 1944 JULY 1, 1944 EMPLOYMENT EMPLOYEES N E E D E D INDUSTRY % % %
LIGHT MANUFACTURING Chemists 2,608 2.877 269 10.3 0.102 0 .134 Engineers 4.912 5,246 334 6 . 8 0.192 0 .167 Other Scientists 382 420 38 9 . 9 0 0 1 5 0 .019 Chemical Engineers 810 899 89 11.0 0 032 0.044
CHEMICAL MANUFACTURING Chemists 11,620 12,661 1.041 9 . 0 1 243 1.581 Engineers 14.976 16.501 1.525 10.2 1.602 2 .316 Other Scientists 771 898 127 16.5 0.082 0 .193 Chemical Engineers 6,478 7,201 723 11 .1 0 693 1.009
HEAVY MANUFACTURING Chemists 7,398 8.243 845 11.4 0.089 0 .122 Engineers 89.375 99.062 9.687 10.8 1.073 1.402 Other Scientists 2.055 2.346 291 14.2 0.025 0 .042 Chemical Engineers 2,650 2,981 331 12.5 0.032 0.048
MINING Chemists 505 530 25 5 . 0 0.104 0 .040 Engineers 3.230 3.355 125 3 . 9 0.663 0 .202 Other Scientists 480 518 38 8 . 0 0.099 0.061 Chemical Engineers 116 124 9 8.0 0.024 0.016
TRANSPORTATION, COMMUNICATIONS AND OTHER P U B LIC UTILITIES
Chemists 242 267 25 10.3 0.023 0 .045 Engineers 9,688 9,967 279 2 . 9 0.911 0.504 Other Scientists 72 77 5 6 . 9 0.007 0.009 Chemical Engineers 163 168 δ 3.1 0.015 0.009
SERVICE INDUSTRIES Chemists 6 9 3 50 .0 .013 0.131 Engineers 529 599 70 13.2 1.159 3 .065 Other Scientists 103 134 31 30 .1 0.226 1.357 Chemical Engineers 26 26 0 0.0 0.055 0.0
REGULAR GOVERNMENT E S TABLISHMENTS
Chemists 369 410 41 11.1 0.039 0.047 Engineers 8,686 9,527 841 9 .7 0.923 0 .965 Other Scientists 774 1.002 228 29 .5 0.082 0 .262 Chemical Engineers 213 237 24 11.3 0.023 0.028
ALL INDUSTRIES Chemists 22.748 24.997 2.249 9 . 9 0.158 0 .193 Engineers 131,396 144,257 12,861 9 . 8 0.915 1.105 Other Scientists 4,637 5,395 758 16 .3 0.032 0 .065 Chemical Engineers 10,454 11,635 1.181 11.3 0.073 0.102 β In each instance the figures for engineers include chemical engineers.
EMPLOYMENT Actual Jan. 1, 1944 1,161 9,905 2,660 9.022
22,748 10.454
Required July 1,
1944 1,267
10,967 2,996 9,767
24,997 11.635
Total 106
1,062 3 3 6 7 4 5
2,249 1.181
New College Graduates
Number 7 3
7 5 2 2 1 9 5 0 2
1,546 8 3 2
% o f Total 68 .9 70 .8 65 .2 67 .4 68 .7 70.4
Experienced Personnel
Number 3 3
3 1 0 117 2 4 3 7 0 3 3 4 9
% oi Total 31.1 29 .2 34 .8 32.6 31 .3 29.6
PERSONNEL N E E D E D OP
EMPLOYMEÎÎT JAN. 1, 1944
9 . 1 10.7 12.6
8 . 3 9 . 9
11.3