Cell Survival after Low Doses of Radiation - uni-muenchen.de · The initial slope of the gamma-ray...
14
Cell Survival after Low Doses of Radiation: theoretical and clinical implications Proceedings of the Sixth L Η Gray Conference, held at Bedford College, London 16-21 September 1974 Edited by Tikvah Alper THE INSTITUTE OF PHYSICS JOHN WILEY & SONS
Transcript of Cell Survival after Low Doses of Radiation - uni-muenchen.de · The initial slope of the gamma-ray...
Cell Survival after Low Doses of Radiation: theoretical and clinical implications
Proceedings of the Sixth L Η Gray Conference, held at Bedford College, London 16-21 September 1974
Edited by Tikvah Alper
T H E I N S T I T U T E O F PHYSICS JOHN W I L E Y & SONS
Contents
Preface ν
Glossary i x
1. DIRECT MEASUREMENTS I N I N I T I A L REGIONS: B I O L O G I C A L A N D STATISTICAL PROBLEMS
Survival-curve characteristics in a desmid A Howard and F G Come 3
Biological problems in the measurement of survival at low doses Ε J Hall 13
Survival of x-irradiated hamster cells: analysis in terms of the Chadwick-Leenhouts model C J Gillespie, J D Chapman, A Ρ Reuvers and D L Dugle 25 The estimation of survival at low doses and the limits of resolution of the single-cell-plating technique J S Bedford and Η G Griggs 34
The statistical treatment of cell survival data J W Boag 40
2. M A T H E M A T I C A L M O D E L S A N D SOME M O D E L F I T T I N G
The effect of an asynchronous population of cells on the initial slope of dose-effect curves Κ Η Chadwick and Η Ρ Leenhouts 57
The associated inactivation model Ε W Emery 64
Statistical and biophysical aspects of the survival curve A Μ Kellerer 69
The initial slope of the gamma-ray survival curve in the theory of RBE R Katz and S C Sharma 78 The 'pool ' and the initial slope of survival curves for high- and low-LET radiation J S Orr, J Laurie, J Kirk and J F Malone 86
Fitting curves by computer programs C W Gilbert 89
xi
x i i Contents
Response of HeLa and Chinese hamster cells to low doses of photons and neutrons AH W Nias and C W Gilbert 93
Discussion 100
3. M O D I F I C A T I O N OF THE I N I T I A L REGIONS BY O X Y G E N A N D C H E M I C A L SENSITIZERS
Survival-curve shape and oxygen enhancement ratio at low doses for Chlamydomonas Ρ Ε Bryant and I Lansley 107
Oxygen enhancement ratio for small x-ray doses measured in Vicia faba roots Β Μ Winston, R J Berry and R Oliver 115
The effect of repeated small doses of radiation on recovery from sublethal damage by Chinese hamster cells irradiated in oxic or hypoxic conditions in the plateau phase of growth Ν J McNally 119
Effects of the radiosensitizer 'diamide' on parameters of the anoxic survival curve J W Harris 126
Radioprotectors, radiosensitizers, and the shape of the mammalian cell survival curve J D Chapman, C J Gillespie, A Ρ Reuvers and DLDugle 135
Oxygen effects in the shoulder region of cell survival curves L Revesz, Β Littbrand, J Midander and 0 C A Scott 141
Effects of oxygen and T M P N on the initial part of the dose-effect curves of human cells in culture Ε 0 Rettersen, Ε Wibe, D Lovhaug, R Oftebro and Τ Brustad 150
The effect of hypoxia and dose rate on the shape of survival curves for EMT6 tumour and B14FAF cells in vitro Τ L Phillips, Κ Κ Fu and L J Kane 158
Measurement of very low oxygen tensions in liquids: does the extrapolation number for mammalian survival curves decrease after x-irradiation under anoxic conditions? C J Koch 167
Discussion 174
4. VARIOUS FACTORS T H A T AFFECT THE I N I T I A L REGIONS
Prediction of bacterial survival after ultraviolet radiation D R Miller, A D Glazebrook, Β Μ Mullen and L Bramall 179
The shape of dose-effect curves for diploid yeast cells irradiated with ionizing particles W Pohlit 190
The influence of repair processes on radiobiological survival curves R Η Haynes 197
Contents
Genetic damage and mammalian cell survival curves Η J Burki X-ray survival curves of cultured human diploid fibroblasts R Cox and W Κ Masson
Contribution to discussion: measurements in vitro with three cell lines derived from melanomas Ε Ρ Malaise, J Weininger, A-M Joly and Μ Guichard Relation of intracellular cyclic A M P to the shape of mammalian cell survival curves S Lehnen Intercellular contact: its influence on the Dq of mammalian survival curves R Ε Durand and R Μ Sutherland
5. OBSERVATIONS O N T U M O U R S
The influence of growth and irradiation conditions on the radiation response of the EMT6 tumour Κ Κ Fu, Τ L Phillips, Μ D Wharam Jr and L J Kane
Effects of protracted gamma irradiation on cells from a rat rhabdomyosarcoma treated in vitro and in vivo Η Β Kai Characteristics of cell survival curves for different radiations in relation to iso-effect curves for fractionated treatments of a rat rhabdomyosarcoma G W Barendsen
The efficacy of hyperbaric oxygen in modifying the response of tissue to irradiation in doses of 200-400 rad per fraction Η D Suit and L Orsi Sparing effect of x-ray fractionation in mammary tumours and skin reactions of mice J F Fowler, J Denekamp, Ρ W Sheldon, A Μ Smith, A C Begg, S R Harris and A L Page Discussion
6. M U L T I P L E - F R A C T I O N EXPERIMENTS O N N O R M A L TISSUES, A N D THEIR INTERPRETATION
Deductions about survival-curve parameters from iso-effect radiation regimes: observations on lethality after whole-body irradiation of mice R Η Mole Response of mouse bone marrow to low dose rates, split acute doses, and multiple daily fractions J Η Hendry and L G Lajtha Prediction of the initial shape of survival curves when direct measurement is not possible J F Mahne, I A Kinsella and J Η Hendry Cumulative radiation effect: some qualitative predictions J Kirk Time-dose factors in fatal post-irradiation nephritis W L Caldwell
xiv Contents
Cell survival curves deduced from non-quantitative reactions of skin, intestinal mucosa and lung J Dutreix and A Wambersie 335
The response of mouse skin to multiple small doses of radiation J Denekamp and S R Harris 342
The effect of multiple small fractions of x-rays on skin reactions in the mouse Β G Douglas, J F Fowler, J Denekamp, S R Harris, S Ε Ayres, S Fairman, S A Hill, Ρ W Sheldon and F A Stewart 351
The response of mouse skin and lung to fractionated x-rays S Β Field and S Hornsey 362
Responses of some normal tissues to low doses of y-radiation Η R Withers 369
A summary and review of the conference Μ Μ Elkind 376
Discussion 389
Author index 393
Subject index 395
6th LH Gray Conf. © 1975
Statistical and biophysical aspects of the survival curvef
A Μ Kellerer Radiological Research Laboratory, Department of Radiology, Columbia University, College of Physicians and Surgeons, 630 West 168th Street, New York, N Y 10032, USA
Abstract. Statistical fluctuations in a series of repeated x-ray survival curves of non-synchronized V79 hamster cells are considered. Within each experiment the fluctuations are close to those theoretically expected on the basis of Poisson statistics. Between successive experiments however sensitivity fluctuations of the order of 10% occur. The mean and the variance of the survival curves in nine repeated experiments are analysed and are compared to the conventional parameters η and q. A normalization utilizing the observed mean values for each experiment leads to an idealized x-ray survival curve. This curve corresponds only in its lower dose range to a mathematical expression in which the logarithm of the survival curve is proportional to a linear and a square term in absorbed dose. For V79 cells in late S-phase however one obtains full agreement with such an equation.
Microdosimetric considerations are used to derive the distances over which radiation products or sublesions must interact to cause a nonlinear component in absorbed dose. It is found that for interaction distances of the order of 10 to 100 nm the linear component must always be predominant up to doses of 1000 rad or more. A higher-order term in absorbed dose which is comparable to the linear term at doses of a few hundred rad implies interaction distances close to a micrometre.
1. Introduction
The study of survival curves has long been one of the essential objects of quantitative radiobiology. However it involves certain difficulties connected with the statistical evaluation of observed data, with the choice of suitable models, and with the use of radiation physics for the interpretation of such models. The following remarks are concerned with the statistics
tThis investigation was supported by Contract AT-(1 l-l)-3243 for the US Atomic Energy Commission and Public Health Service Research Grant No. C A 12536 from the National Cancer Institute.
69
70 A Μ Kellerer
of survival curves and with certain facts of radiation physics which permit rather general conclusions concerning the spatial interaction of sublesions in the cell.
2. Statistics of the survival curve
Most survival curves, and this is true for dose-effect relations in general, can within the experimentally obtainable statistical accuracy be fitted by a variety of analytical expressions containing three free parameters. Such a fit is therefore by itself no proof for the validity of any model associated with the expressions. On the other hand, a survival curve may be inconsistent with an equation which contains only two free parameters such as:
S(D) = exp(-aZ)- j8D 2 ) . (1)
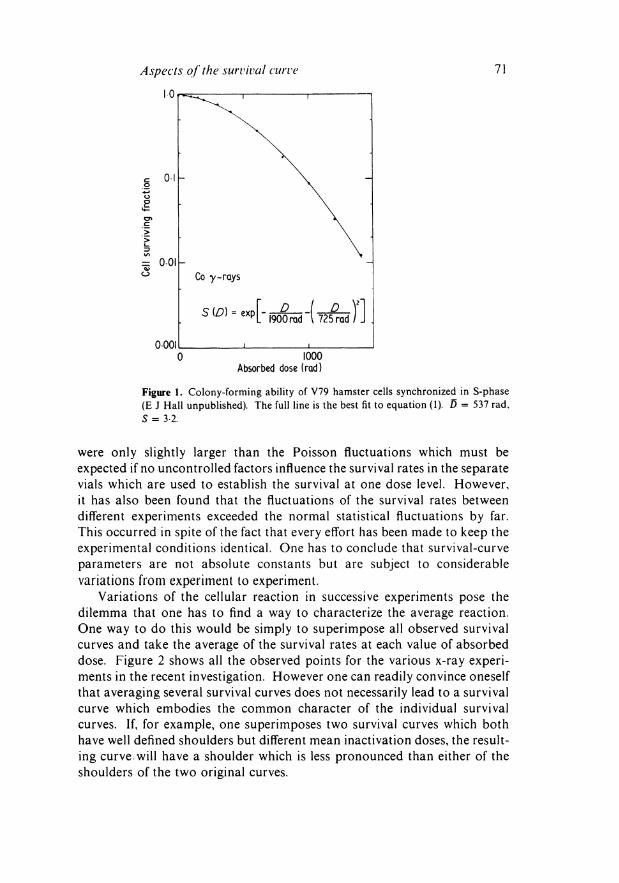
However this, in itself, is not sufficient proof that a model associated with the equation must be rejected. Equation (1), for example, could, as we have reason to believe (Kellerer and Rossi 1972), be valid for cells of a given age, but it cannot then be valid for a non-synchronized population. The reason is that the superposition of two or more equations of this type with different values of α and β leads to a curve with a tail which is somewhat too shallow to be described by this type of equation. An example will be seen in figure 3 which deals with a series of x-ray survival curves obtained by Hall et al(\975) in an extensive study of neutron RBE. However, in a curve obtained with considerable accuracy for hamster cells synchronized in S-phase (E J Hall unpublished) one finds full agreement with equation (1). This is shown in figure 1.
Section 3 will deal with conclusions to be drawn from such a curve. First, however, it is of interest to ask whether in addition to obtaining accurate data in one experiment one can also obtain precisely repeatable data. We cannot at present answer this question for synchronized cell populations, as sufficient data are not yet available. However the recent investigation of neutron RBE on mammalian cells by Hall et al includes an extensive set of repeated x-ray curves and offers therefore the possibility of answering the question for non-synchronized cultures.
In the course of the investigation nine independent experiments with neutrons of different energies were performed, and in each experiment a separate x-ray survival curve has been established. The results of the neutron experiments are presented elsewhere (Hall et al 1975): in the present context it is of interest to compare the various x-ray survival curves which have been obtained in this investigation.
One conclusion of the detailed statistical analysis of the data for x-rays has been that within each experiment the observed statistical fluctuations
Aspects of the survival curve
I 0 ,
71
c 0 1 - \
ο \ & • \ c \
•- \ > \ I— \ ZD \ ΙΛ >
= 0 0 1 -° Co γ - r a y s
00011 ι ι 0 1000
Absorbed dose (rad)
Figure 1. Colony-forming ability of V79 hamster cells synchronized in S-phase (E J Hall unpublished). The full line is the best fit to equation (1). D = 537 rad, S = 3-2.
were only slightly larger than the Poisson fluctuations which must be expected if no uncontrolled factors influence the survival rates in the separate vials which are used to establish the survival at one dose level. However, it has also been found that the fluctuations of the survival rates between different experiments exceeded the normal statistical fluctuations by far. This occurred in spite of the fact that every effort has been made to keep the experimental conditions identical. One has to conclude that survival-curve parameters are not absolute constants but are subject to considerable variations from experiment to experiment.
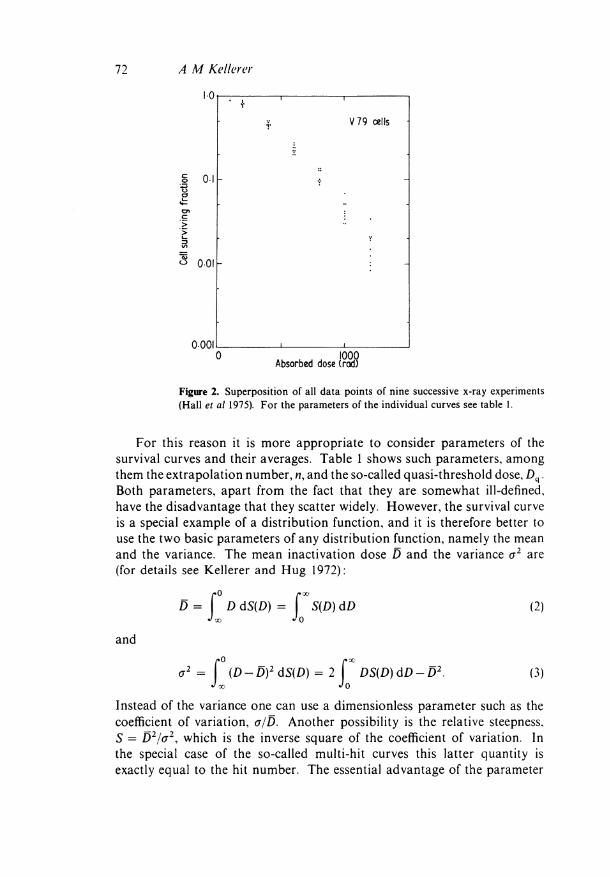
Variations of the cellular reaction in successive experiments pose the dilemma that one has to find a way to characterize the average reaction. One way to do this would be simply to superimpose all observed survival curves and take the average of the survival rates at each value of absorbed dose. Figure 2 shows all the observed points for the various x-ray experiments in the recent investigation. However one can readily convince oneself that averaging several survival curves does not necessarily lead to a survival curve which embodies the common character of the individual survival curves. If, for example, one superimposes two survival curves which both have well defined shoulders but different mean inactivation doses, the resulting curve will have a shoulder which is less pronounced than either of the shoulders of the two original curves.
72 A Μ Kellerer
Ι·Οι
O l
OOI h
0001
V79 cells
1000 Absorbed dose(rod)
Figure 2. Superposition of all data points of nine successive x-ray experiments (Hall et al 1975). For the parameters of the individual curves see table 1.
For this reason it is more appropriate to consider parameters of the survival curves and their averages. Table 1 shows such parameters, among them the extrapolation number, n, and the so-called quasi-threshold dose, D q . Both parameters, apart from the fact that they are somewhat ill-defined, have the disadvantage that they scatter widely. However, the survival curve is a special example of a distribution function, and it is therefore better to use the two basic parameters of any distribution function, namely the mean and the variance. The mean inactivation dose D and the variance σ2 are (for details see Kellerer and Hug 1972):
D — \ D dS(D) = S(D) dD J σο JO
and
( D - D ) 2 dS(D) = 2 f Jo
DS(D) dD — D2.
(2)
(3)
Instead of the variance one can use a dimensionless parameter such as the coefficient of variation, σ/D. Another possibility is the relative steepness, S = Z)2/<72, which is the inverse square of the coefficient of variation. In the special case of the so-called multi-hit curves this latter quantity is exactly equal to the hit number. The essential advantage of the parameter
Aspects of the survival curve 73
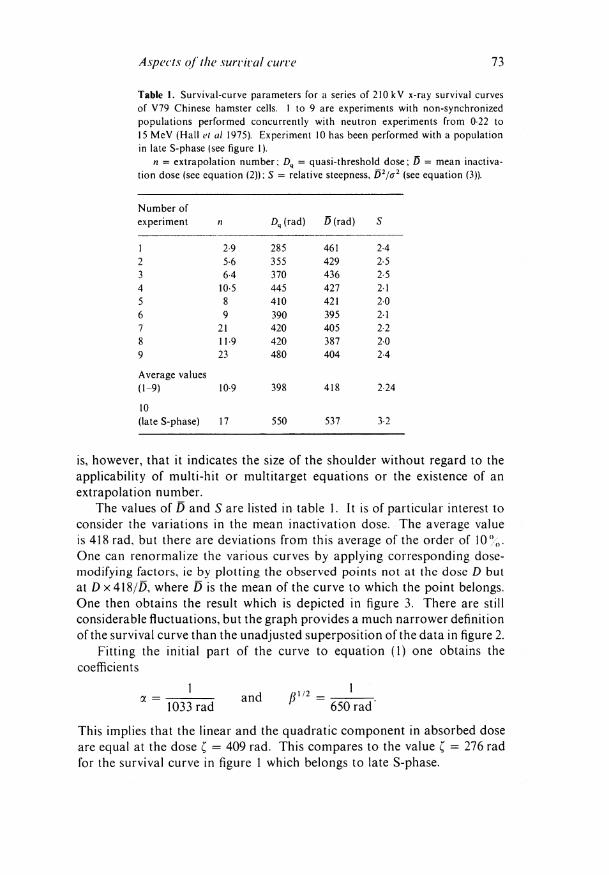
Table 1. Survival-curve parameters for a series of 210 kV x-ray survival curves of V79 Chinese hamster cells. 1 to 9 are experiments with non-synchronized populations performed concurrently with neutron experiments from 0-22 to 15 MeV (Hall et al 1975). Experiment 10 has been performed with a population in late S-phase (see figure 1).
η = extrapolation number; Dq = quasi-threshold dose; D = mean inactiva-tion dose (see equation (2)); S = relative steepness, D2/a2 (see equation (3)).
Number of experiment η Dq (rad) D (rad) S
1 2-9 285 461 2-4 2 5-6 355 429 2-5 3 6-4 370 436 2-5 4 10 5 445 427 21 5 8 410 421 20 6 9 390 395 2-1 7 21 420 405 2-2 8 11-9 420 387 20 9 23 480 404 2-4
Average values (1-9) 10-9 398 418 2-24
10 (late S-phase) 17 550 537 3-2
is, however, that it indicates the size of the shoulder without regard to the applicability of multi-hit or multitarget equations or the existence of an extrapolation number.
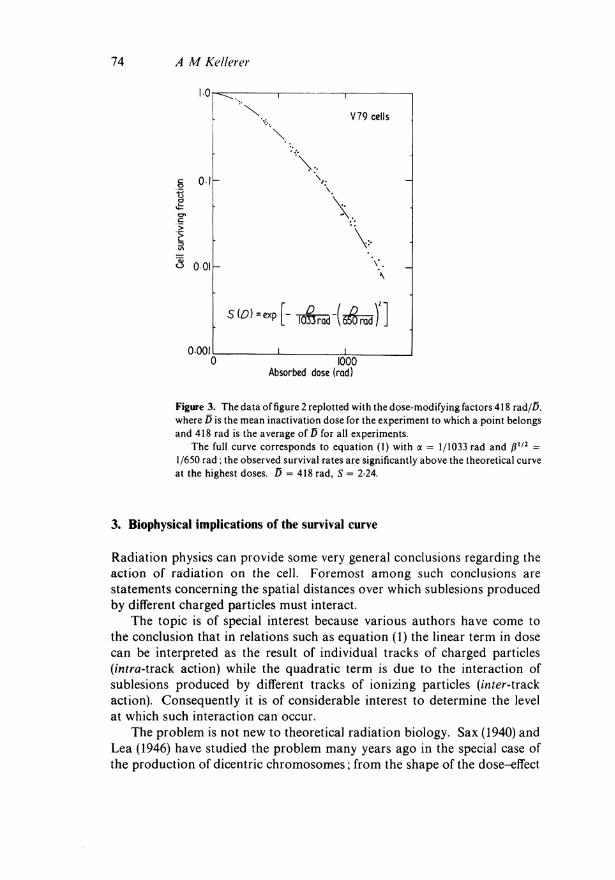
The values of D and S are listed in table 1. It is of particular interest to consider the variations in the mean inactivation dose. The average value is 418 rad, but there are deviations from this average of the order of 10%. One can renormalize the various curves by applying corresponding dose-modifying factors, ie by plotting the observed points not at the dose D but at D χ 418/D, where D is the mean of the curve to which the point belongs. One then obtains the result which is depicted in figure 3. There are still considerable fluctuations, but the graph provides a much narrower definition of the survival curve than the unadjusted superposition of the data in figure 2.
Fitting the initial part of the curve to equation (1) one obtains the coefficients
1 and ßll2= 1
1033rad ' 650rad
This implies that the linear and the quadratic component in absorbed dose are equal at the dose ζ = 409 rad. This compares to the value ζ = 276 rad for the survival curve in figure 1 which belongs to late S-phase.
74 A Μ Kellerer
10
8 0 0 1 -
0Ό0 Ι
" Χ I
V 79 cells
-\
-\ ·
V . _
\
S ( £ ) = e x p [ -
ι
° -( <ρ Υ1 S ( £ ) = e x p [ -
ι
1033 rod \ 650rad / J
ι 1000
Absorbed dose (rad)
Figure 3. The data of figure 2 replotted with the dose-modifying factors 418 rad/D, where D is the mean inactivation dose for the experiment to which a point belongs and 418 rad is the average of D for all experiments.
The full curve corresponds to equation (1) with α = 1/1033 rad and β112 = 1/650 rad; the observed survival rates are significantly above the theoretical curve at the highest doses. D = 418 rad, S = 2-24.
3. Biophysical implications of the survival curve
Radiation physics can provide some very general conclusions regarding the action of radiation on the cell. Foremost among such conclusions are statements concerning the spatial distances over which sublesions produced by different charged particles must interact.
The topic is of special interest because various authors have come to the conclusion that in relations such as equation (1) the linear term in dose can be interpreted as the result of individual tracks of charged particles (infra-track action) while the quadratic term is due to the interaction of sublesions produced by different tracks of ionizing particles (wier-track action). Consequently it is of considerable interest to determine the level at which such interaction can occur.
The problem is not new to theoretical radiation biology. Sax (1940) and Lea (1946) have studied the problem many years ago in the special case of the production of dicentric chromosomes; from the shape of the dose-effect
Aspects of the survival curve 75
relations they concluded that interactions occur over distances of the order of micrometres. In recent years microdosimetric analysis has reconfirmed these conclusions, and has led to the result that in a wide range of effects on higher organisms one has to deal with the interaction of sublesions over distances of the order of micrometres. Essential in this context has been the study of the RBE of neutrons as a function of neutron dose (Rossi 1970), and it has been concluded that the linear-quadratic dependence on absorbed dose is valid for the primary cellular lesions in a wide range of effects on higher organisms (Kellerer and Rossi 1972). Naturally one could consider the possibility that the sublesions are single-strand breaks in D N A and that their interaction leads to double breaks. But one must then ask how energy deposition due to two different charged particles separated by micrometres or fractions of micrometres can interact to produce a double break in DNA. It is difficult to conceive that diffusion of radiation products over such distances should occur in the cell or even in solution. Other processes must therefore be considered.
Rigorous microdosimetric analysis is indispensable if one wants to obtain precise values for the interaction distances in experiments with different radiation qualities. But the essential argument can also be given in a simplified form. This form of the argument is not linked to any particular model of radiation action; it merely deals with those conclusions which can be drawn from the ratio of the nonlinear term of the dose-effect relation to its linear term.
A numerical example may serve to indicate the nature of the argument. Consider a single break in D N A and assume that it has been produced by an ionization in a region of diameter 10 nm surrounding this single break. The ionization may have been produced by a fast electron or a delta ray belonging to a fast electron. Assume further that a double break can come about if another ionization in the same domain of 10 nm diameter produces another single break. The probability of a second ionization produced by an independent charged particle in this domain is approximately 10" 4 at 100 rad of sparsely ionizing radiation. It is therefore a relatively unlikely process. However it is very likely that a second ionization is produced in the region by the same particle; one can estimate this probability to be about 0-5. It follows that two sublesions which interact over the very short distance of 10 nm can be readily produced in the tracks of even sparsely ionizing radiation. Compared with this infra-track action which must be proportional to absorbed dose, the inter-track action, namely the interaction of sublesions produced by independent particle tracks which shows a higher-order dependence on absorbed dose, is entirely insignificant. Therefore if the nonlinear component in absorbed dose is substantial at a dose of 100 rad or even several 100 rad, it follows that this higher-order term cannot be due to the interaction of sublesions over very short distances.

76 A Μ Kellerer
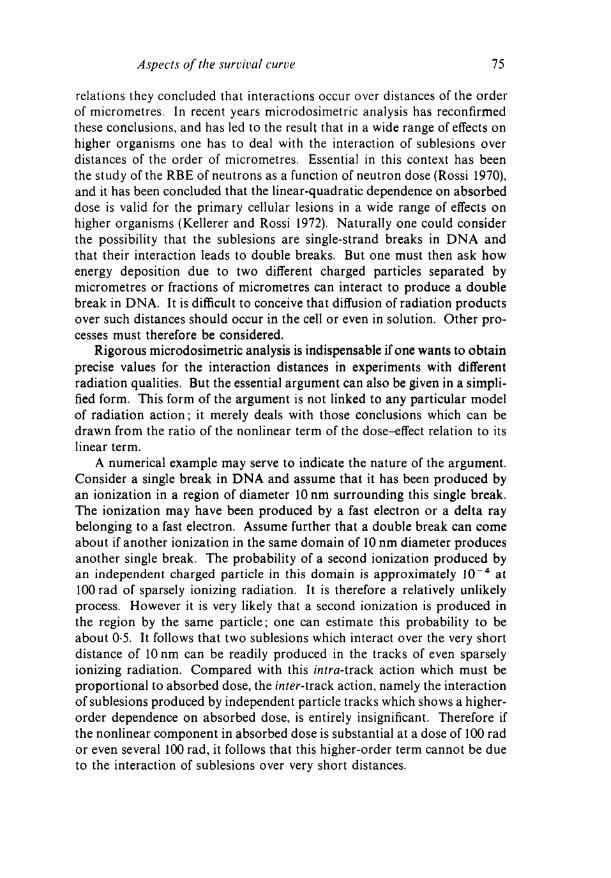
This consideration is given a quantitative form in figure 4. This graph which is based on still unpublished calculations performed in collaboration with D C Chmelevsky gives the average additional energy deposition in a domain of diameter d surrounding an ionization or excitationt- The heavy full line applies to sparsely ionizing radiation in the limiting case of very small doses, ie it represents only ions which belong to the same particle track. The more lightly drawn curves belong to the indicated values of absorbed dose, ie they include the contribution from other, statistically independent particles. For a dose of 100 rad the contribution from other particles is insignificant up to distances of the order of magnitude of 1 μιη. Even at a dose of ten thousand rad one must go to fractions of a micrometre in order to have comparable contributions of the inter-track and intra-track component. It takes doses of the order of a million rad to obtain a significant contribution from other tracks in regions of the order of tens of nanometres.
In such cases as in the survival curves obtained with x-rays which have been discussed in the preceding section equality of the linear component in
Figure 4. Mean additional energy deposited in a spherical region of diameter d around an ionization or excitation. The heavy full line is the contribution due to the same primary particle, the lighter lines give the totals for the indicated values of absorbed dose.
The graph corresponds to sparsely ionizing radiation (LD = 3 keV μ π ι - 1 ) .
I0 !
I0 2
Diameter of region (nm )
fThe data are preliminary; a more detailed analysis of random tracks which were kindly provided by Dr Η G Paretzke may lead to slightly different values. The uncertainty is however insignificant for the present argument.
Aspects of the survival curve 11
absorbed dose with the higher-order term occurs at several 100 rad. One must therefore conclude that the production of sublesions which are responsible for the higher-order term cannot occur at distances of the order of tens of nanometres. Instead one must be dealing with cumulative action produced over distances of at least fractions of micrometres.
The more rigorous microdosimetric analysis (Kellerer and Rossi 1972) has confirmed these results and has led to the conclusion that in most radiation effects on eukaryotic cells one deals with the synergism of different particles over distances of one to several micrometres.
It is a question of great interest whether such long-range interaction can be explained by the diffusion of radiation products, whether one has to consider interaction of cellular structures such as the rejoining of chromosome breaks, or whether one deals with a two-component effect perhaps involving D N A and the membrane (Alper 1969) or a membrane-DNA complex (Elkind and Chang-Liu 1972). The study of the age variation of the survival-curve parameters and of the concurrent changes of the distribution of D N A in the nucleus may provide the answer.
References
Alper Τ 1969 Proc. 2nd Symp. on Microdosimetry ed G Η Ebert (Brüssel: Euratom) 4452 d-f-e Elkind Μ Μ and Chang-Liu C-M 1972 Int. J. Radiat. Biol. 22 75-90 Hall Ε J, Novak J K , Kellerer A M, Rossi Η Η, Marino S and Goodman Leon J 1975 Radiat.
Res. in press Kellerer A Μ and Hug Ο 1972 Encyclopedia of Medical Radiology vol 3 (Berlin: Springer-
Verlag) pp 1-42 Kellerer A Μ and Rossi Η Η 1972 Curr. Topics Radiat. Res. 8 85-158 Lea D Ε 1946 Actions of Radiations on Living Cells (London: Cambridge UP) reprinted 1962
pp 249-52 Rossi Η Η 1970 Phys. Med. Biol. 15 255-62 Sax Κ 1940 Genetics 25 41-68