CardioChek® Plus Analyzer Lipid + eGLU TM Test Strips Smart Bundle TM Pack CardioChek Plus Analyzer...
14
CardioChek® Plus Analyzer Lipid + eGLU TM Test Strips Smart Bundle TM Pack CardioChek Plus Analyzer Accuracy and Precision Lipid and Glucose Testing
-
Upload
horace-carson -
Category
Documents
-
view
226 -
download
0
Transcript of CardioChek® Plus Analyzer Lipid + eGLU TM Test Strips Smart Bundle TM Pack CardioChek Plus Analyzer...
CardioChek® Plus AnalyzerLipid + eGLUTM Test Strips Smart BundleTM Pack
CardioChek Plus AnalyzerAccuracy and PrecisionLipid and Glucose Testing
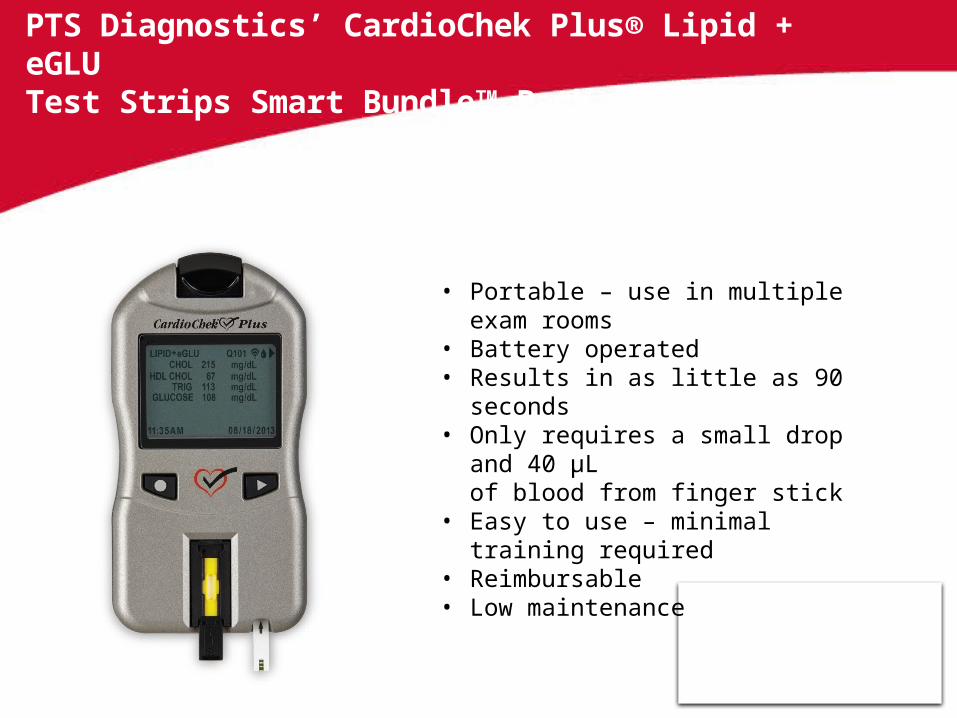
• Portable – use in multiple exam rooms• Battery operated• Results in as little as 90 seconds• Only requires a small drop and 40 μL
of blood from finger stick• Easy to use – minimal training required• Reimbursable• Low maintenance
PTS Diagnostics’ CardioChek Plus® Lipid + eGLU Test Strips Smart BundleTM Pack
Analyzer here
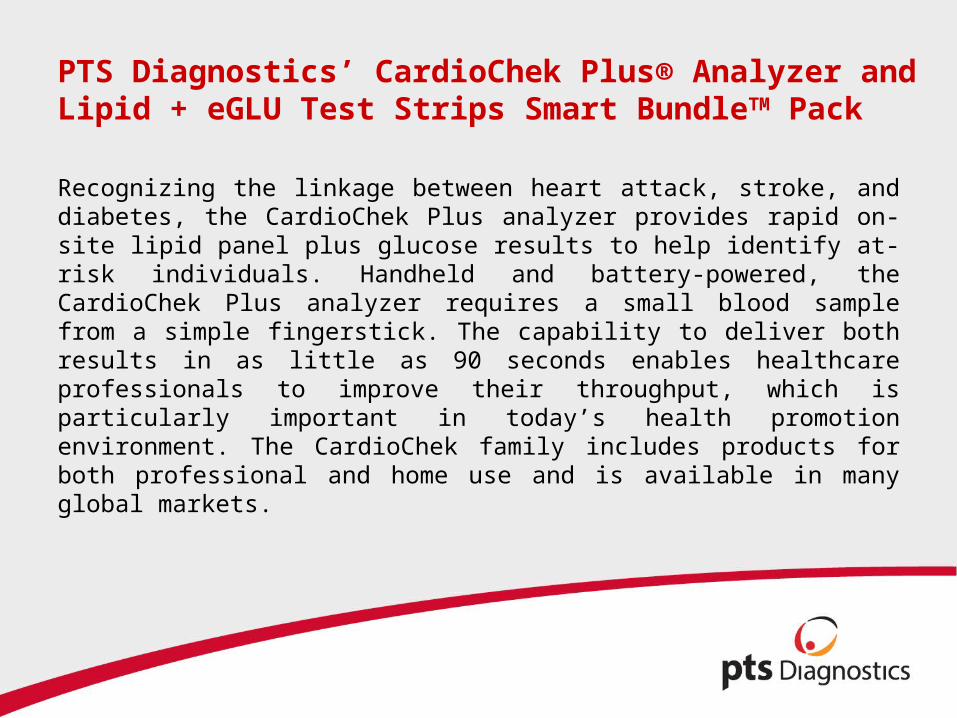
PTS Diagnostics’ CardioChek Plus® Analyzer andLipid + eGLU Test Strips Smart BundleTM Pack
Recognizing the linkage between heart attack, stroke, and diabetes, the CardioChek Plus analyzer provides rapid on-site lipid panel plus glucose results to help identify at-risk individuals. Handheld and battery-powered, the CardioChek Plus analyzer requires a small blood sample from a simple fingerstick. The capability to deliver both results in as little as 90 seconds enables healthcare professionals to improve their throughput, which is particularly important in today’s health promotion environment. The CardioChek family includes products for both professional and home use and is available in many global markets.
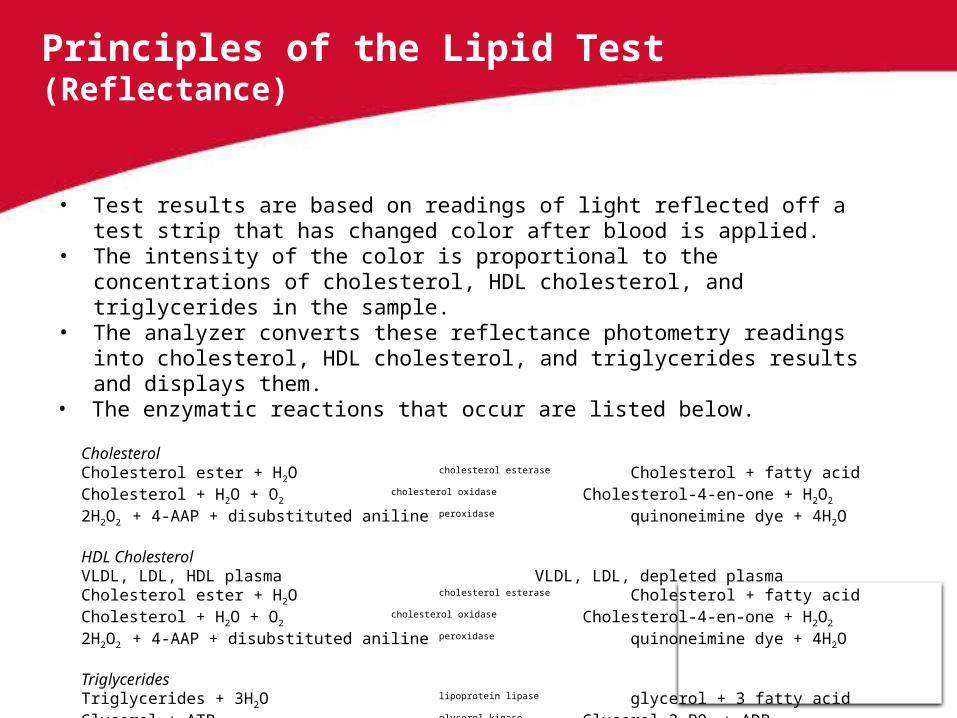
Principles of the Lipid Test (Reflectance)
• Test results are based on readings of light reflected off a test strip that has changed color after blood is applied.
• The intensity of the color is proportional to the concentrations of cholesterol, HDL cholesterol, and triglycerides in the sample.
• The analyzer converts these reflectance photometry readings into cholesterol, HDL cholesterol, and triglycerides results and displays them.
• The enzymatic reactions that occur are listed below.
CholesterolCholesterol ester + H2O cholesterol esterase Cholesterol + fatty acidCholesterol + H2O + O2
cholesterol oxidase Cholesterol-4-en-one + H2O2
2H2O2 + 4-AAP + disubstituted aniline peroxidase quinoneimine dye + 4H2O
HDL CholesterolVLDL, LDL, HDL plasma VLDL, LDL, depleted
plasmaCholesterol ester + H2O cholesterol esterase Cholesterol + fatty acidCholesterol + H2O + O2
cholesterol oxidase Cholesterol-4-en-one + H2O2
2H2O2 + 4-AAP + disubstituted aniline peroxidase quinoneimine dye + 4H2O
TriglyceridesTriglycerides + 3H2O lipoprotein lipase glycerol + 3 fatty acidGlycerol + ATP glycerol kinase Glycerol-3-
PO4 + ADPGlycerol-3-PO4 + O2
glycerophosphate oxidase Dihydroxyacetone-PO4 + H2O2
2H2O2 + 4-AAP + N,N-disubstituted aniline peroxidase quinoneimine dye + 4H2O
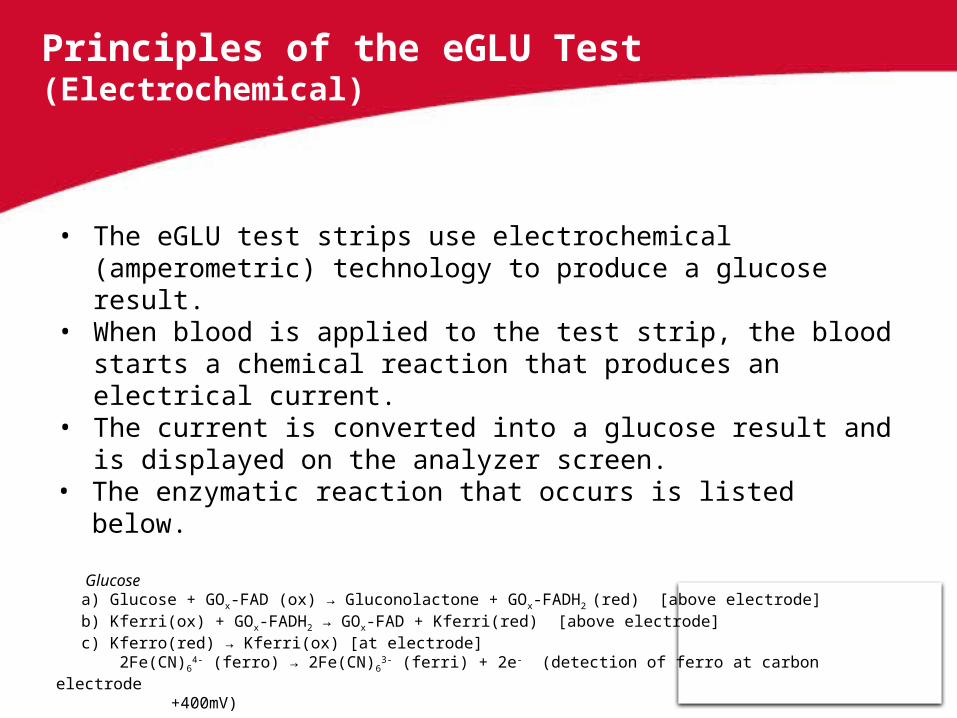
Principles of the eGLU Test (Electrochemical)
• The eGLU test strips use electrochemical (amperometric) technology to produce a glucose result.
• When blood is applied to the test strip, the blood starts a chemical reaction that produces an electrical current.
• The current is converted into a glucose result and is displayed on the analyzer screen.
• The enzymatic reaction that occurs is listed below.
Glucosea) Glucose + GOx-FAD (ox) → Gluconolactone + GOx-FADH2 (red) [above electrode] b) Kferri(ox) + GOx-FADH2 → GOx-FAD + Kferri(red) [above electrode] c) Kferro(red) → Kferri(ox) [at electrode] 2Fe(CN)6
4- (ferro) → 2Fe(CN)63- (ferri) + 2e- (detection of ferro at carbon electrode
+400mV)
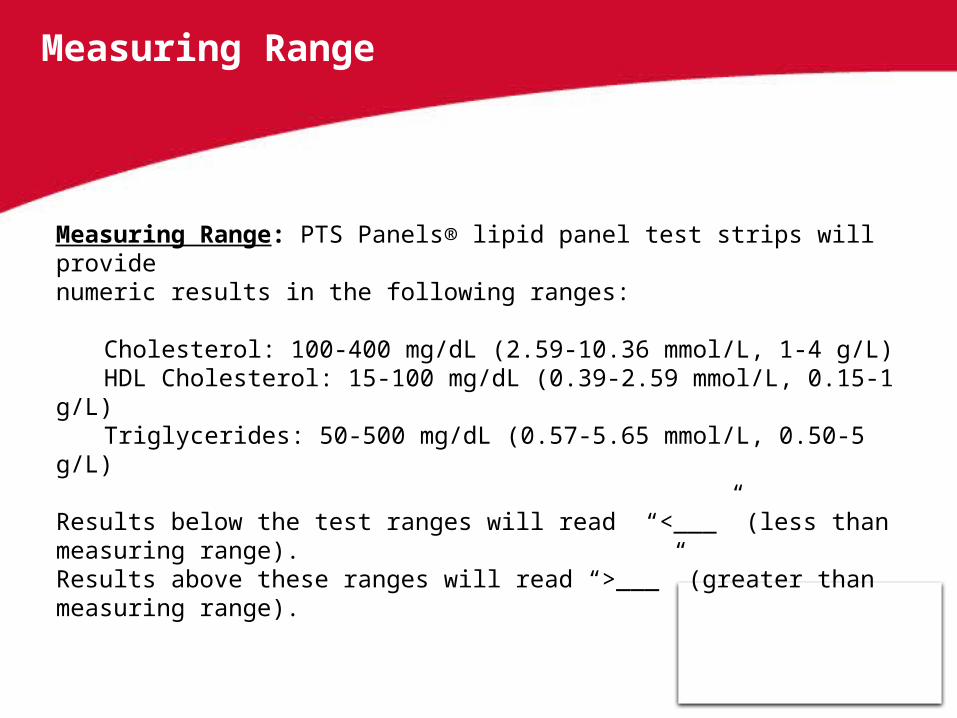
Measuring Range
Measuring Range: PTS Panels® lipid panel test strips will provide numeric results in the following ranges:
Cholesterol: 100-400 mg/dL (2.59-10.36 mmol/L, 1-4 g/L)HDL Cholesterol: 15-100 mg/dL (0.39-2.59 mmol/L, 0.15-1 g/L)Triglycerides: 50-500 mg/dL (0.57-5.65 mmol/L, 0.50-5 g/L)
Results below the test ranges will read “<___” (less than measuring range). Results above these ranges will read “>___” (greater than measuring range).
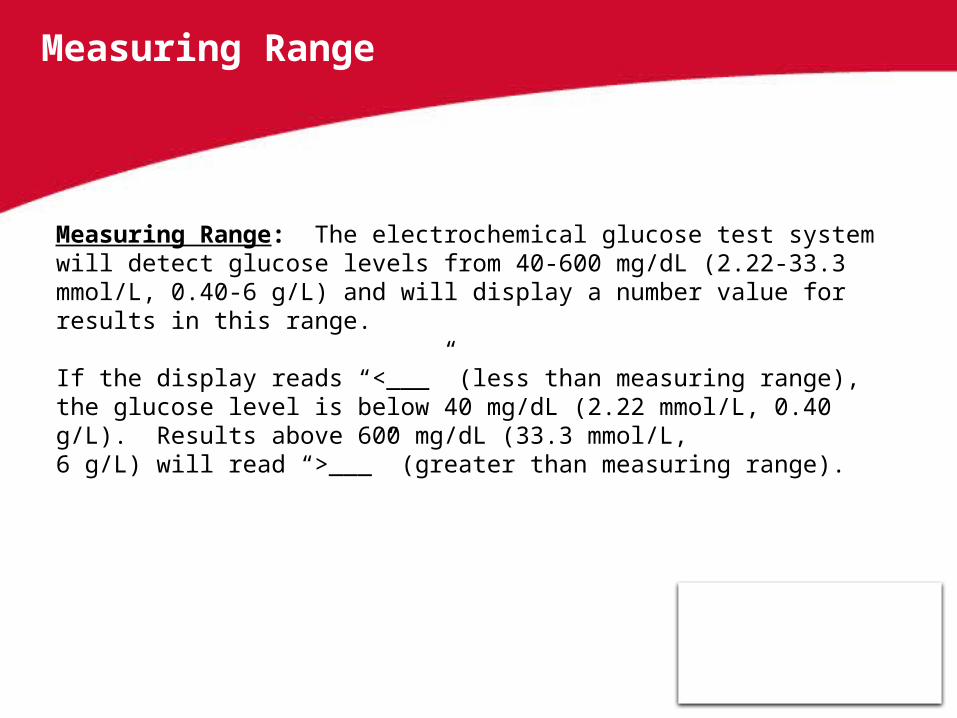
Measuring Range
Measuring Range: The electrochemical glucose test system will detect glucose levels from 40-600 mg/dL (2.22-33.3 mmol/L, 0.40-6 g/L) and will display a number value for results in this range.
If the display reads “<___” (less than measuring range), the glucose level is below 40 mg/dL (2.22 mmol/L, 0.40 g/L). Results above 600 mg/dL (33.3 mmol/L, 6 g/L) will read “>___” (greater than measuring range).
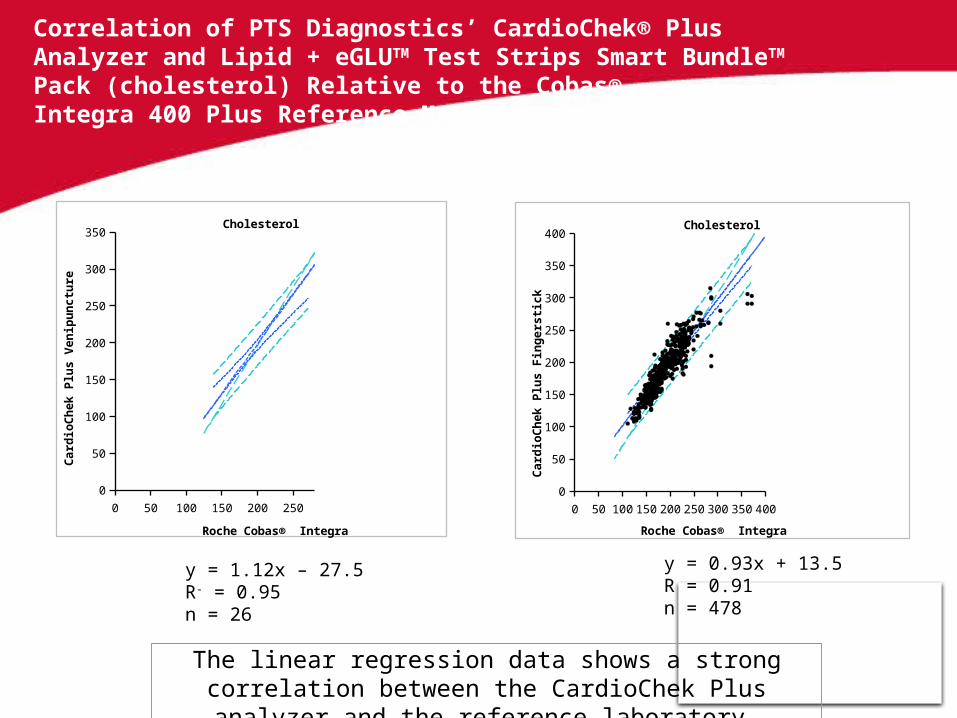
The linear regression data shows a strong correlation between the CardioChek Plus analyzer and the reference laboratory.
y = 1.12x – 27.5R- = 0.95 n = 26
y = 0.93x + 13.5R = 0.91 n = 478
0 50 100 150 200 2500
50
100
150
200
250
300
350Cholesterol
Roche Cobas® Integra
Ca
rdio
Ch
ek
Plu
s V
en
ipu
nc
ture
0 50 100 150 200 250 300 350 4000
50
100
150
200
250
300
350
400Cholesterol
Roche Cobas® IntegraC
ard
ioC
he
k P
lus
Fin
ge
rsti
ck
Correlation of PTS Diagnostics’ CardioChek® Plus Analyzer and Lipid + eGLUTM Test Strips Smart BundleTM Pack (cholesterol) Relative to the Cobas® Integra 400 Plus Reference Method
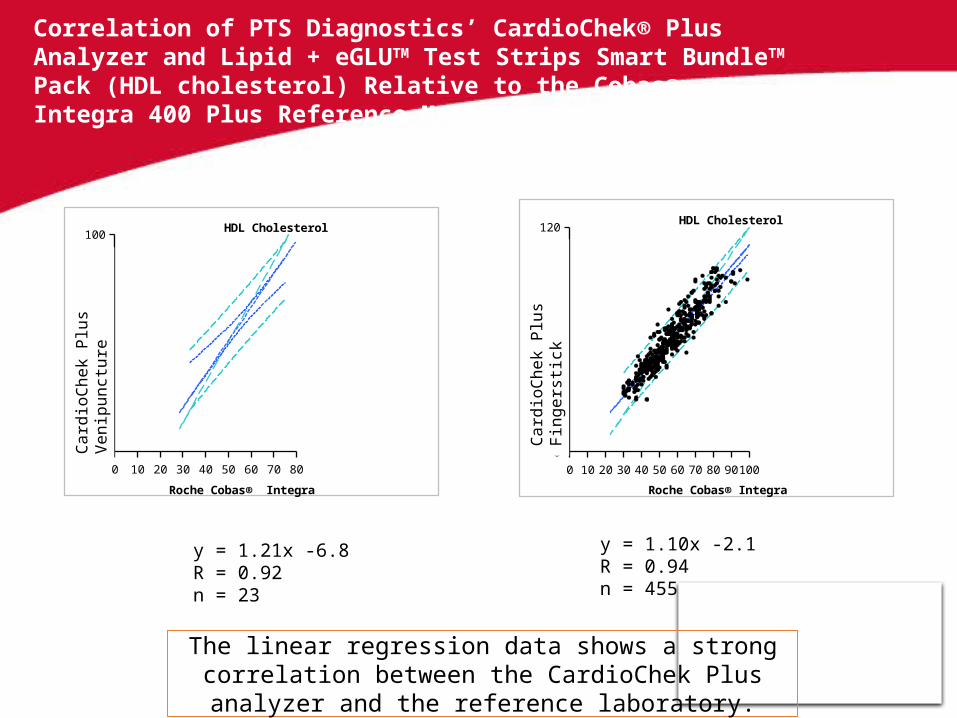
Correlation of PTS Diagnostics’ CardioChek® Plus Analyzer and Lipid + eGLUTM Test Strips Smart BundleTM Pack (HDL cholesterol) Relative to the Cobas® Integra 400 Plus Reference Method
The linear regression data shows a strong correlation between the CardioChek Plus analyzer and the reference laboratory.
y = 1.21x -6.8R = 0.92 n = 23
y = 1.10x -2.1R = 0.94n = 455
0 10 20 30 40 50 60 70 800
10
20
30
40
50
60
70
80
90
100HDL Cholesterol
Roche Cobas® Integra
CC
Plu
s V
en
ipu
nc
ture
0 10 20 30 40 50 60 70 80 901000
20
40
60
80
100
120HDL Cholesterol
Roche Cobas® Integra
CC
Plu
s F
ing
ers
tic
k
Card
ioCh
ek P
lus
Veni
punc
ture
Card
ioCh
ek P
lus
Fing
ersti
ck
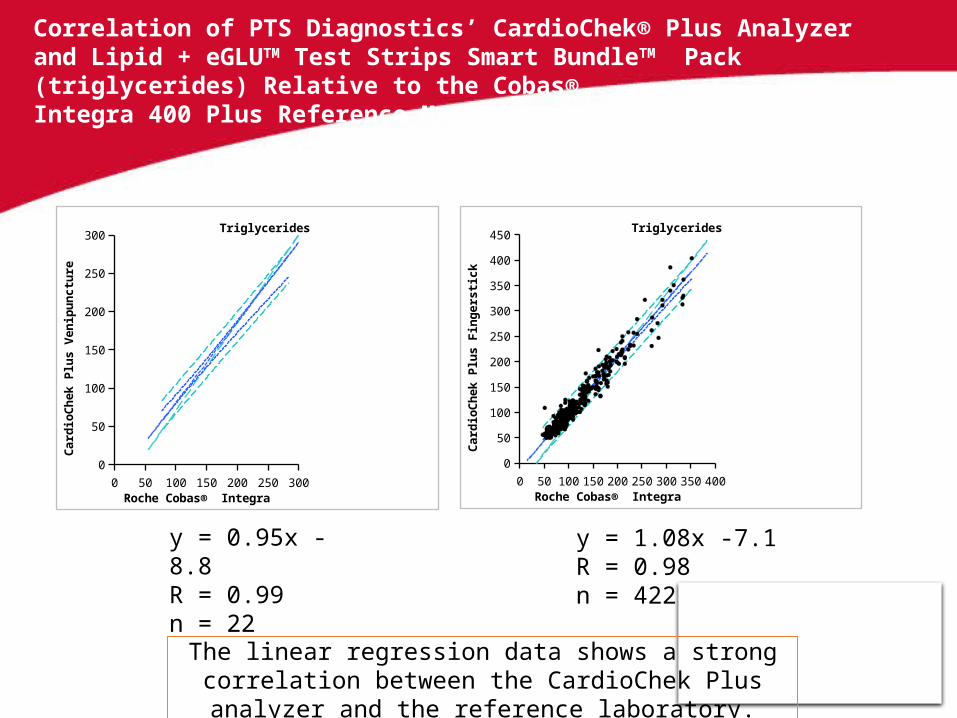
The linear regression data shows a strong correlation between the CardioChek Plus analyzer and the reference laboratory.
y = 0.95x -8.8R = 0.99 n = 22
y = 1.08x -7.1R = 0.98n = 422
0 50 100 150 200 250 3000
50
100
150
200
250
300Triglycerides
Roche Cobas® Integra
Ca
rdio
Ch
ek
Plu
s V
en
ipu
nc
ture
0 50 100 150 200 250 300 350 4000
50
100
150
200
250
300
350
400
450Triglycerides
Roche Cobas® Integra
Ca
rdio
Ch
ek
Plu
s F
ing
ers
tic
k
Correlation of PTS Diagnostics’ CardioChek® Plus Analyzer and Lipid + eGLUTM Test Strips Smart BundleTM Pack (triglycerides) Relative to the Cobas® Integra 400 Plus Reference Method
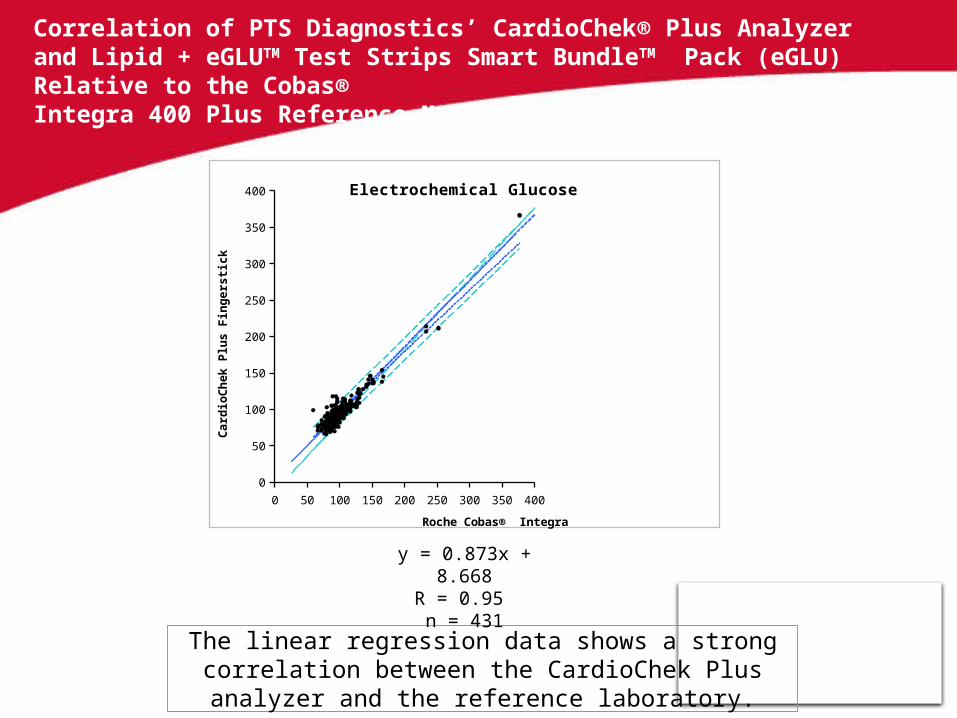
Correlation of PTS Diagnostics’ CardioChek® Plus Analyzer and Lipid + eGLUTM Test Strips Smart BundleTM Pack (eGLU) Relative to the Cobas® Integra 400 Plus Reference Method
The linear regression data shows a strong correlation between the CardioChek Plus analyzer and the reference laboratory.
y = 0.873x + 8.668R = 0.95 n = 431
0 50 100 150 200 250 300 350 4000
50
100
150
200
250
300
350
400 Electrochemical Glucose
Roche Cobas® Integra
Ca
rdio
Ch
ek
Plu
s F
ing
ers
tic
k
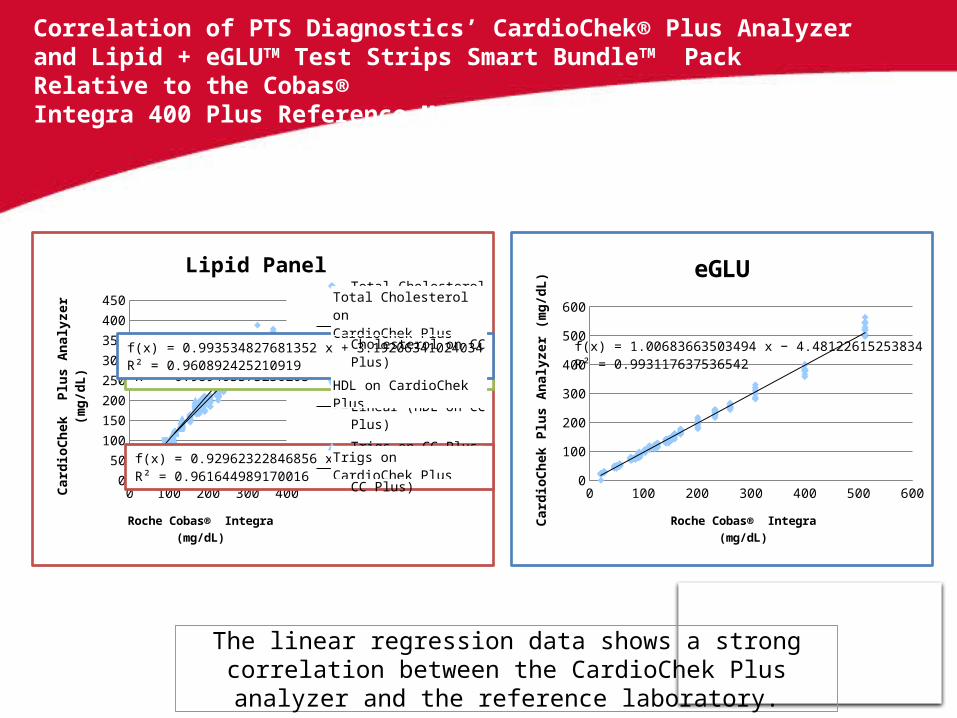
Correlation of PTS Diagnostics’ CardioChek® Plus Analyzer and Lipid + eGLUTM Test Strips Smart BundleTM Pack Relative to the Cobas® Integra 400 Plus Reference Method
The linear regression data shows a strong correlation between the CardioChek Plus analyzer and the reference laboratory.
0 100 200 300 400 500 6000
100
200
300
400
500
600
f(x) = 1.00683663503494 x − 4.48122615253834R² = 0.993117637536542
eGLU
Roche Cobas® Integra(mg/dL)
Card
ioCh
ek P
lus A
naly
zer (
mg/
dL)
0 50 1001502002503003504000
50
100
150
200
250
300
350
400
450
f(x) = 1.13029834143885 x − 11.5062959665109R² = 0.989403373236203
f(x) = 0.92962322846856 x + 5.40175401502177R² = 0.961644989170016
f(x) = 0.993534827681352 x + 3.19206341024034R² = 0.960892425210919
Lipid Panel
Total Cholesterol on CC Plus
Linear (Total Cholesterol on CC Plus)
HDL on CC Plus
Linear (HDL on CC Plus)
Trigs on CC Plus
Linear (Trigs on CC Plus)
Roche Cobas® Integra(mg/dL)
Card
ioCh
ek P
lus A
naly
zer (
mg/
dL) Total Cholesterol on
CardioChek Plus
HDL on CardioChek Plus
Trigs on CardioChek Plus
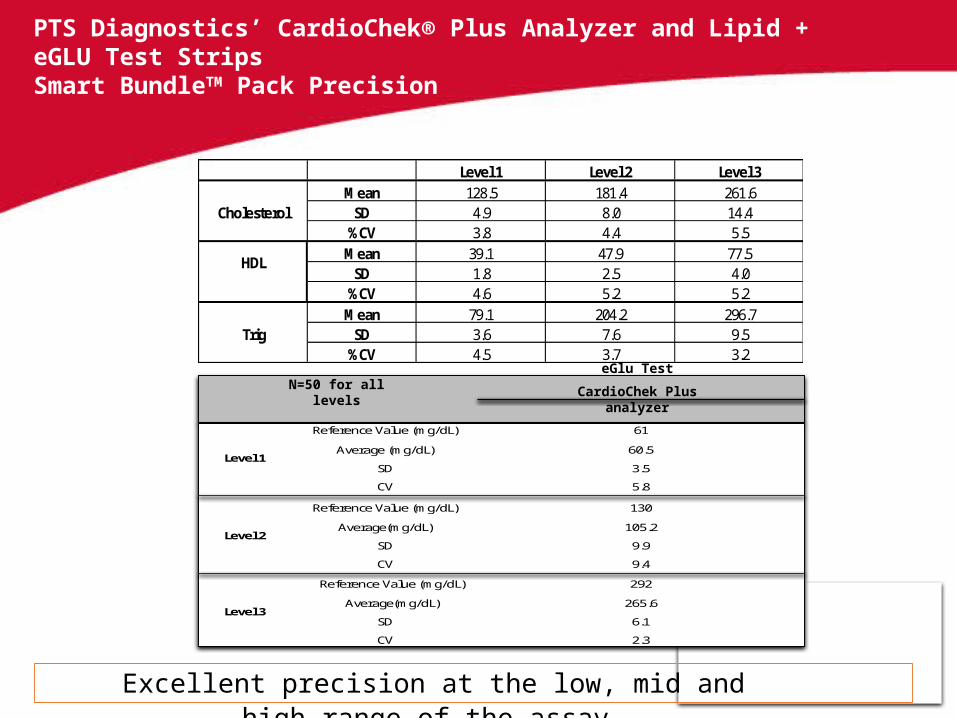
PTS Diagnostics’ CardioChek® Plus Analyzer and Lipid + eGLU Test Strips Smart BundleTM Pack Precision
Excellent precision at the low, mid and high range of the assay.
MeanSD
%CVMean
SD%CV
MeanSD
%CV7.6 9.5
Cholesterol
HDL
Trig
4.4 5.5
5.25.24.6
128.5
39.1
261.6181.4
79.1
47.9
204.2
Level 1 Level 2 Level 3
3.8
4.5 3.7 3.2
77.5
296.7
4.9 8.0 14.4
1.8 2.5 4.0
3.6
Level 1
Reference Value (mg/dL) 61
Average (mg/dL) 60.5
SD 3.5
CV 5.8
Level 2
Reference Value (mg/dL) 130
Average(mg/dL) 105.2
SD 9.9
CV 9.4
Level 3
Reference Value (mg/dL) 292
Average(mg/dL) 265.6
SD 6.1
CV 2.3
eGlu Test
CardioChek Plus analyzerN=50 for all levels
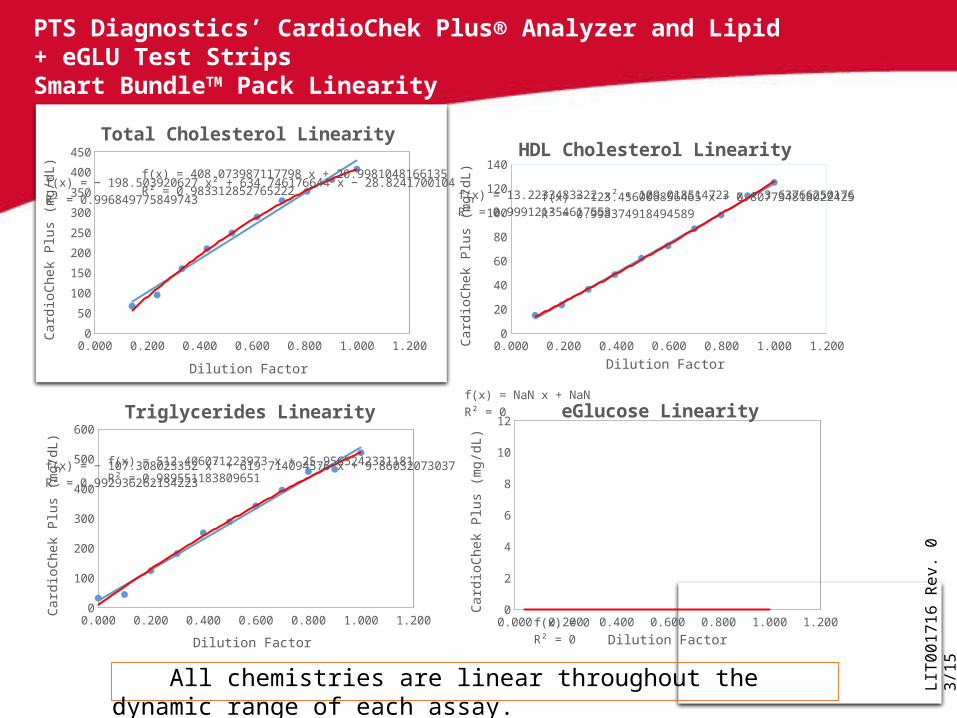
PTS Diagnostics’ CardioChek Plus® Analyzer and Lipid + eGLU Test Strips Smart BundleTM Pack Linearity
All chemistries are linear throughout the dynamic range of each assay. LIT0
0171
6 Re
v. 0
3/1
5
0.000 0.200 0.400 0.600 0.800 1.000 1.2000
2
4
6
8
10
12
f(x) = NaN x + NaNR² = 0
f(x) = 0R² = 0
eGlucose Linearity
Dilution Factor
Card
ioCh
ek P
lus (
mg/
dL)
0.000 0.200 0.400 0.600 0.800 1.000 1.2000
50
100
150
200
250
300
350
400
450
f(x) = 408.073987117798 x + 20.9981048166135R² = 0.983312852765222f(x) = − 198.503920627445 x² + 634.746176643996 x − 28.8241700104022
R² = 0.996849775849743
Total Cholesterol Linearity
Dilution Factor
Card
ioCh
ek P
lus (
mg/
dL)
0.000 0.200 0.400 0.600 0.800 1.000 1.2000
100
200
300
400
500
600
f(x) = 512.406071223973 x + 25.9565242331181R² = 0.989551183809651f(x) = − 107.308023351633 x² + 619.714094575606 x + 9.86032073037312
R² = 0.992936262134223
Triglycerides Linearity
Dilution Factor
Card
ioCh
ek P
lus (
mg/
dL)
0.000 0.200 0.400 0.600 0.800 1.000 1.2000
20
40
60
80
100
120
140
f(x) = 123.456006856465 x + 0.807734818022425R² = 0.998374918494589
f(x) = 13.2233483321936 x² + 109.018514722861 x + 3.63766250175645R² = 0.999121354617553
HDL Cholesterol Linearity
Dilution Factor
Card
ioCh
ek P
lus (
mg/
dL)


![Metabolisme Lipid [Recovered]](https://static.fdocument.org/doc/165x107/55cf98ee550346d0339a8594/metabolisme-lipid-recovered.jpg)