budynas SM ch02 - Oakland Universitylatcha/me486/SM/budynas_SM_ch02.pdf8 Solutions Manual •...
8
2-1 From Table A-20 S ut = 470 MPa (68 kpsi) , S y = 390 MPa (57 kpsi) Ans. 2-2 From Table A-20 S ut = 620 MPa (90 kpsi) , S y = 340 MPa (49.5 kpsi) Ans. 2-3 Comparison of yield strengths: S ut of G10 500 HR is 620 470 = 1.32 times larger than SAE1020 CD Ans. S yt of SAE1020 CD is 390 340 = 1.15 times larger than G10500 HR Ans. From Table A-20, the ductilities (reduction in areas) show, SAE1020 CD is 40 35 = 1.14 times larger than G10500 Ans. The stiffness values of these materials are identical Ans. Table A-20 Table A-5 S ut S y Ductility Stiffness MPa (kpsi) MPa (kpsi) R% GPa (Mpsi) SAE1020 CD 470(68) 390 (57) 40 207(30) UNS10500 HR 620(90) 340(495) 35 207(30) 2-4 From Table A-21 1040 Q&T ¯ S y = 593 (86) MPa (kpsi) at 205 ◦ C (400 ◦ F) Ans. 2-5 From Table A-21 1040 Q&T R = 65% at 650 ◦ C (1200 ◦ F) Ans. 2-6 Using Table A-5, the specific strengths are: UNS G10350 HR steel: S y W = 39.5(10 3 ) 0.282 = 1.40(10 5 ) in Ans. 2024 T4 aluminum: S y W = 43(10 3 ) 0.098 = 4.39(10 5 ) in Ans. Ti-6Al-4V titanium: S y W = 140(10 3 ) 0.16 = 8.75(10 5 ) in Ans. ASTM 30 gray cast iron has no yield strength. Ans. Chapter 2 budynas_SM_ch02.qxd 01/29/2007 17:51 Page 6
Transcript of budynas SM ch02 - Oakland Universitylatcha/me486/SM/budynas_SM_ch02.pdf8 Solutions Manual •...
2-1 From Table A-20
Sut = 470 MPa (68 kpsi) , Sy = 390 MPa (57 kpsi) Ans.
2-2 From Table A-20
Sut = 620 MPa (90 kpsi) , Sy = 340 MPa (49.5 kpsi) Ans.
2-3 Comparison of yield strengths:
Sut of G10 500 HR is 620
470= 1.32 times larger than SAE1020 CD Ans.
Syt of SAE1020 CD is 390
340= 1.15 times larger than G10500 HR Ans.
From Table A-20, the ductilities (reduction in areas) show,
SAE1020 CD is 40
35= 1.14 times larger than G10500 Ans.
The stiffness values of these materials are identical Ans.
Table A-20 Table A-5Sut Sy Ductility Stiffness
MPa (kpsi) MPa (kpsi) R% GPa (Mpsi)
SAE1020 CD 470(68) 390 (57) 40 207(30)UNS10500 HR 620(90) 340(495) 35 207(30)
2-4 From Table A-21
1040 Q&T S̄y = 593 (86) MPa (kpsi) at 205◦C (400◦F) Ans.
2-5 From Table A-21
1040 Q&T R = 65% at 650◦C (1200◦F) Ans.
2-6 Using Table A-5, the specific strengths are:
UNS G10350 HR steel:Sy
W= 39.5(103)
0.282= 1.40(105) in Ans.
2024 T4 aluminum:Sy
W= 43(103)
0.098= 4.39(105) in Ans.
Ti-6Al-4V titanium:Sy
W= 140(103)
0.16= 8.75(105) in Ans.
ASTM 30 gray cast iron has no yield strength. Ans.
Chapter 2
budynas_SM_ch02.qxd 01/29/2007 17:51 Page 6
Chapter 2 7
2-7 The specific moduli are:
UNS G10350 HR steel:E
W= 30(106)
0.282= 1.06(108) in Ans.
2024 T4 aluminum:E
W= 10.3(106)
0.098= 1.05(108) in Ans.
Ti-6Al-4V titanium:E
W= 16.5(106)
0.16= 1.03(108) in Ans.
Gray cast iron:E
W= 14.5(106)
0.26= 5.58(107) in Ans.
2-8 2G(1 + ν) = E ⇒ ν = E − 2G
2G
From Table A-5
Steel: ν = 30 − 2(11.5)
2(11.5)= 0.304 Ans.
Aluminum: ν = 10.4 − 2(3.90)
2(3.90)= 0.333 Ans.
Beryllium copper: ν = 18 − 2(7)
2(7)= 0.286 Ans.
Gray cast iron: ν = 14.5 − 2(6)
2(6)= 0.208 Ans.
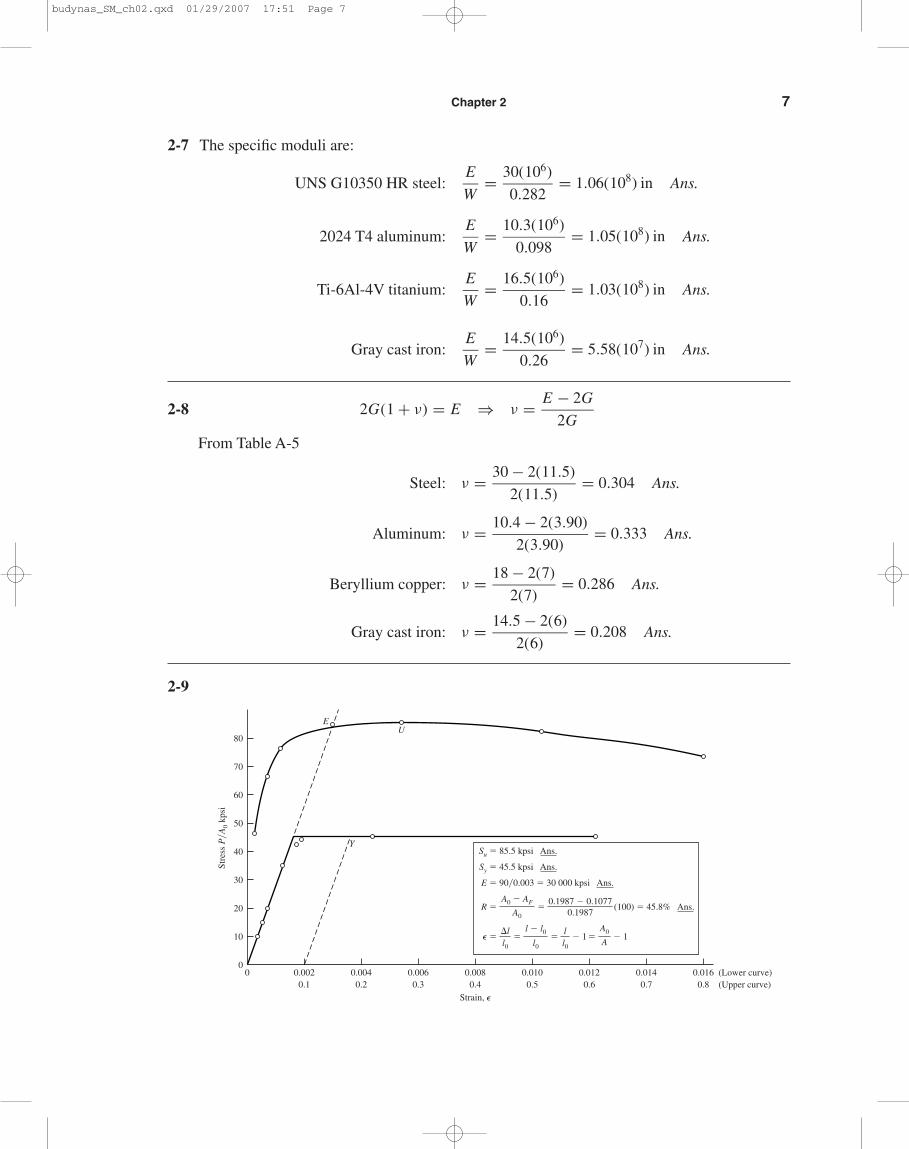
2-9
0
10
0 0.0020.1
0.0040.2
0.0060.3
0.0080.4
0.0100.5
0.0120.6
0.0140.7
0.0160.8
(Lower curve)(Upper curve)
20
30
40
50
Stre
ss P
�A0
kpsi
Strain, �
60
70
80
E
Y
U
Su � 85.5 kpsi Ans.
E � 90�0.003 � 30 000 kpsi Ans.
Sy � 45.5 kpsi Ans.
R � (100) � 45.8% Ans.A0 � AF
A0�
0.1987 � 0.10770.1987
� ��ll0
�l � l0
l0
ll0
� � 1A
A0� � 1
budynas_SM_ch02.qxd 01/29/2007 17:51 Page 7
8 Solutions Manual • Instructor’s Solution Manual to Accompany Mechanical Engineering Design
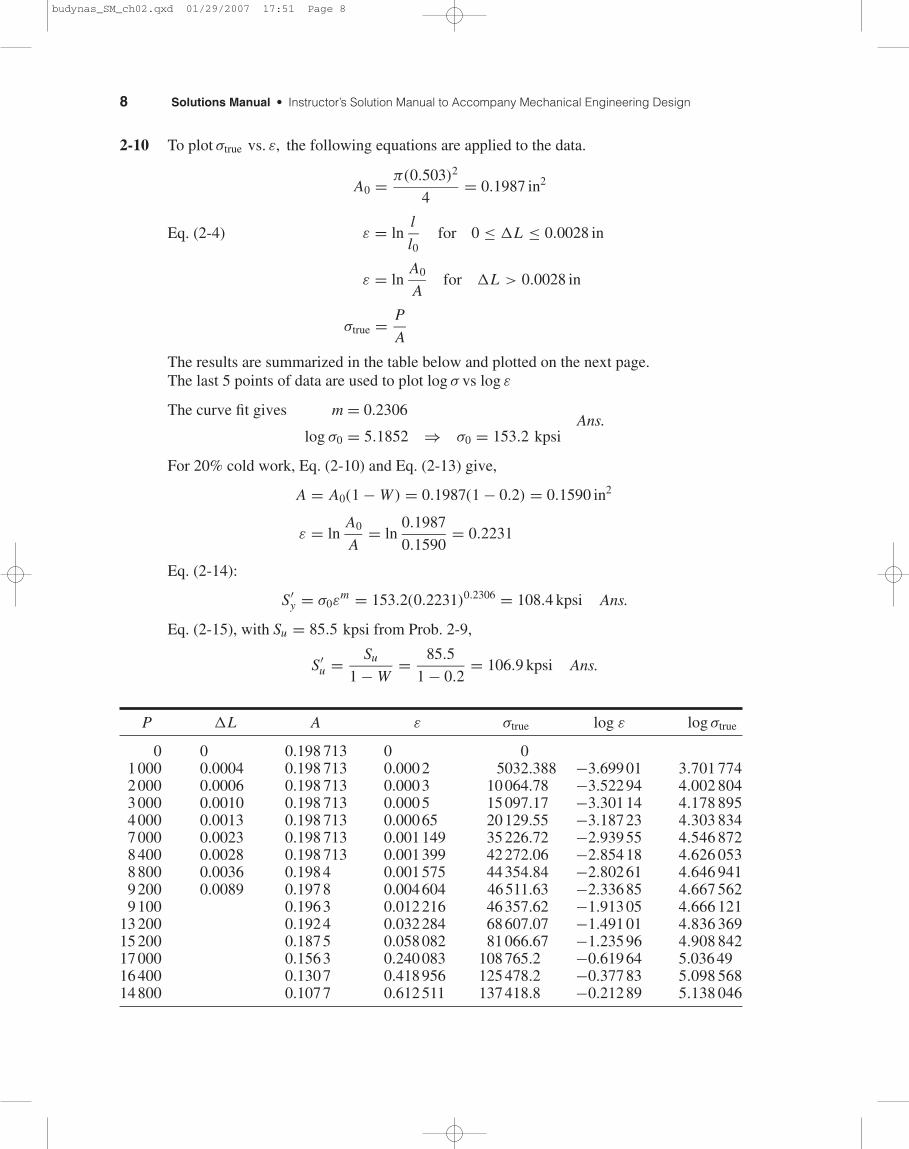
2-10 To plot σtrue vs. ε, the following equations are applied to the data.
A0 = π(0.503)2
4= 0.1987 in2
Eq. (2-4) ε = lnl
l0for 0 ≤ �L ≤ 0.0028 in
ε = lnA0
Afor �L > 0.0028 in
σtrue = P
A
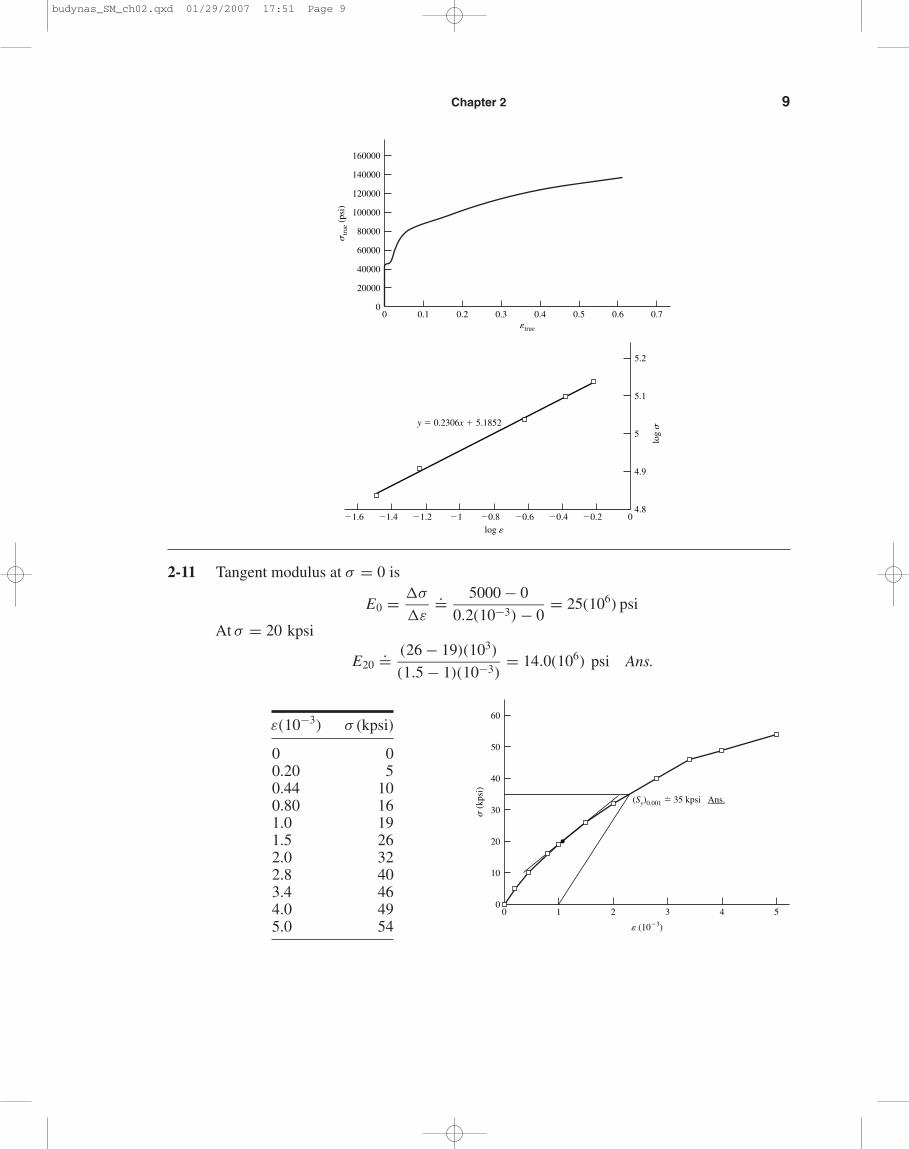
The results are summarized in the table below and plotted on the next page.The last 5 points of data are used to plot log σ vs log ε
The curve fit gives m = 0.2306
log σ0 = 5.1852 ⇒ σ0 = 153.2 kpsiAns.
For 20% cold work, Eq. (2-10) and Eq. (2-13) give,
A = A0(1 − W ) = 0.1987(1 − 0.2) = 0.1590 in2
ε = lnA0
A= ln
0.1987
0.1590= 0.2231
Eq. (2-14):
S′y = σ0ε
m = 153.2(0.2231)0.2306 = 108.4 kpsi Ans.
Eq. (2-15), with Su = 85.5 kpsi from Prob. 2-9,
S′u = Su
1 − W= 85.5
1 − 0.2= 106.9 kpsi Ans.
P �L A ε σtrue log ε log σtrue
0 0 0.198 713 0 01000 0.0004 0.198 713 0.0002 5032.388 −3.69901 3.701 7742000 0.0006 0.198 713 0.0003 10064.78 −3.52294 4.002 8043000 0.0010 0.198 713 0.0005 15097.17 −3.30114 4.178 8954000 0.0013 0.198 713 0.00065 20129.55 −3.18723 4.303 8347000 0.0023 0.198 713 0.001149 35226.72 −2.93955 4.546 8728400 0.0028 0.198 713 0.001399 42272.06 −2.85418 4.626 0538800 0.0036 0.1984 0.001575 44354.84 −2.80261 4.646 9419200 0.0089 0.1978 0.004604 46511.63 −2.33685 4.667 5629100 0.1963 0.012216 46357.62 −1.91305 4.666 121
13200 0.1924 0.032284 68607.07 −1.49101 4.836 36915200 0.1875 0.058082 81066.67 −1.23596 4.908 84217000 0.1563 0.240083 108765.2 −0.61964 5.0364916400 0.1307 0.418956 125478.2 −0.37783 5.098 56814800 0.1077 0.612511 137418.8 −0.21289 5.138 046
budynas_SM_ch02.qxd 01/29/2007 17:51 Page 8
Chapter 2 9
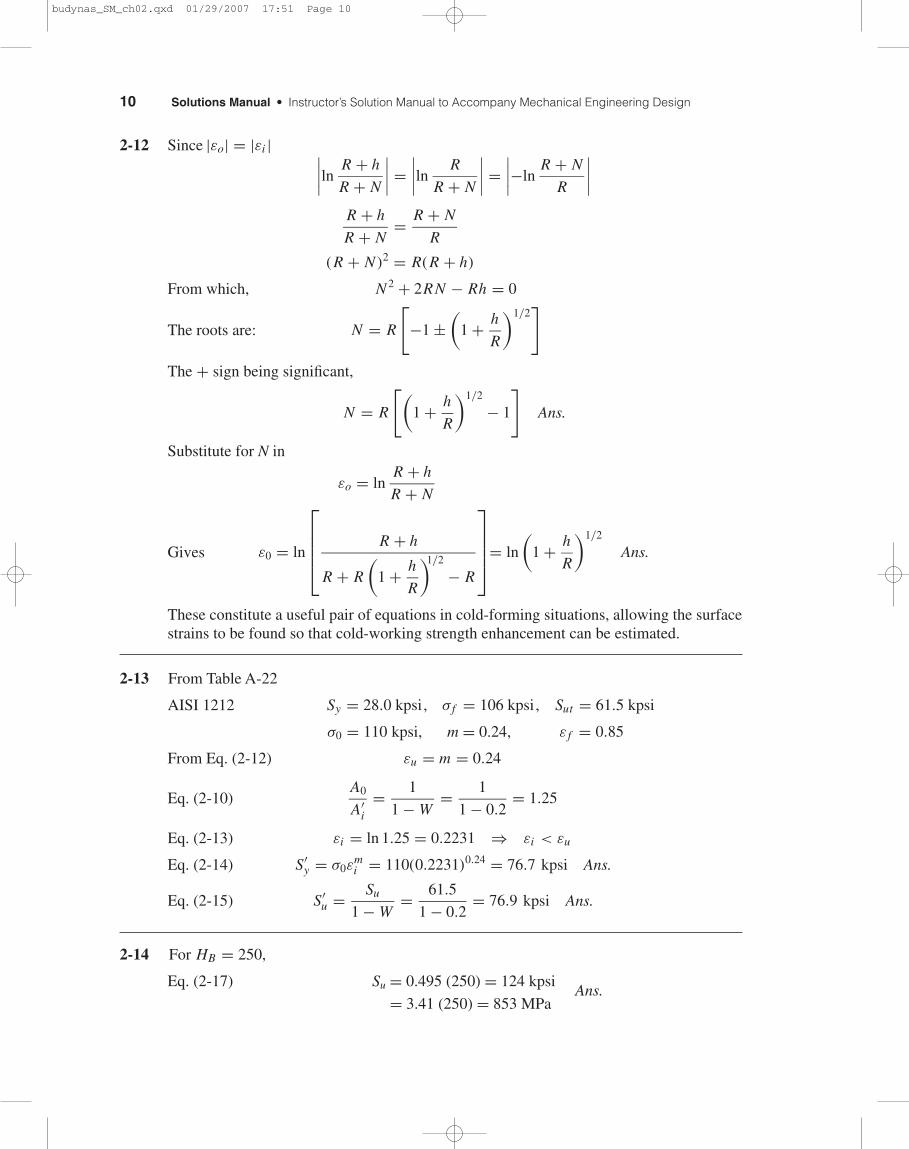
2-11 Tangent modulus at σ = 0 is
E0 = �σ
�ε
.= 5000 − 0
0.2(10−3) − 0= 25(106) psi
At σ = 20 kpsi
E20.= (26 − 19)(103)
(1.5 − 1)(10−3)= 14.0(106) psi Ans.
ε(10−3) σ (kpsi)
0 00.20 50.44 100.80 161.0 191.5 262.0 322.8 403.4 464.0 495.0 54
log �
log
�y � 0.2306x � 5.1852
4.8
4.9
5
5.1
5.2
�1.6 �1.4 �1.2 �1 �0.8 �0.6 �0.4 �0.2 0
�true
�tr
ue (
psi)
0
20000
40000
60000
80000
100000
120000
140000
160000
0 0.1 0.2 0.3 0.4 0.5 0.6 0.7
� (10�3)
(Sy)0.001 �̇ 35 kpsi Ans.
� (
kpsi
)
0
10
20
30
40
50
60
0 1 2 3 4 5
budynas_SM_ch02.qxd 01/29/2007 17:51 Page 9
10 Solutions Manual • Instructor’s Solution Manual to Accompany Mechanical Engineering Design
2-12 Since |εo| = |εi | ∣∣∣∣ln R + h
R + N
∣∣∣∣ =∣∣∣∣ln R
R + N
∣∣∣∣ =∣∣∣∣−ln
R + N
R
∣∣∣∣R + h
R + N= R + N
R
(R + N )2 = R(R + h)
From which, N 2 + 2RN − Rh = 0
The roots are: N = R
[−1 ±
(1 + h
R
)1/2]
The + sign being significant,
N = R
[(1 + h
R
)1/2
− 1
]Ans.
Substitute for N in
εo = lnR + h
R + N
Gives ε0 = ln
R + h
R + R
(1 + h
R
)1/2
− R
= ln
(1 + h
R
)1/2
Ans.
These constitute a useful pair of equations in cold-forming situations, allowing the surfacestrains to be found so that cold-working strength enhancement can be estimated.
2-13 From Table A-22
AISI 1212 Sy = 28.0 kpsi, σ f = 106 kpsi, Sut = 61.5 kpsi
σ0 = 110 kpsi, m = 0.24, ε f = 0.85
From Eq. (2-12) εu = m = 0.24
Eq. (2-10)A0
A′i
= 1
1 − W= 1
1 − 0.2= 1.25
Eq. (2-13) εi = ln 1.25 = 0.2231 ⇒ εi < εu
Eq. (2-14) S′y = σ0ε
mi = 110(0.2231)0.24 = 76.7 kpsi Ans.
Eq. (2-15) S′u = Su
1 − W= 61.5
1 − 0.2= 76.9 kpsi Ans.
2-14 For HB = 250,
Eq. (2-17) Su = 0.495 (250) = 124 kpsi
= 3.41 (250) = 853 MPaAns.
budynas_SM_ch02.qxd 01/29/2007 17:51 Page 10
Chapter 2 11
2-15 For the data given,∑HB = 2530
∑H2
B = 640 226
H̄B = 2530
10= 253 σ̂H B =
√640 226 − (2530)2/10
9= 3.887
Eq. (2-17)S̄u = 0.495(253) = 125.2 kpsi Ans.
σ̄su = 0.495(3.887) = 1.92 kpsi Ans.
2-16 From Prob. 2-15, H̄B = 253 and σ̂HB = 3.887
Eq. (2-18)
S̄u = 0.23(253) − 12.5 = 45.7 kpsi Ans.
σ̂su = 0.23(3.887) = 0.894 kpsi Ans.
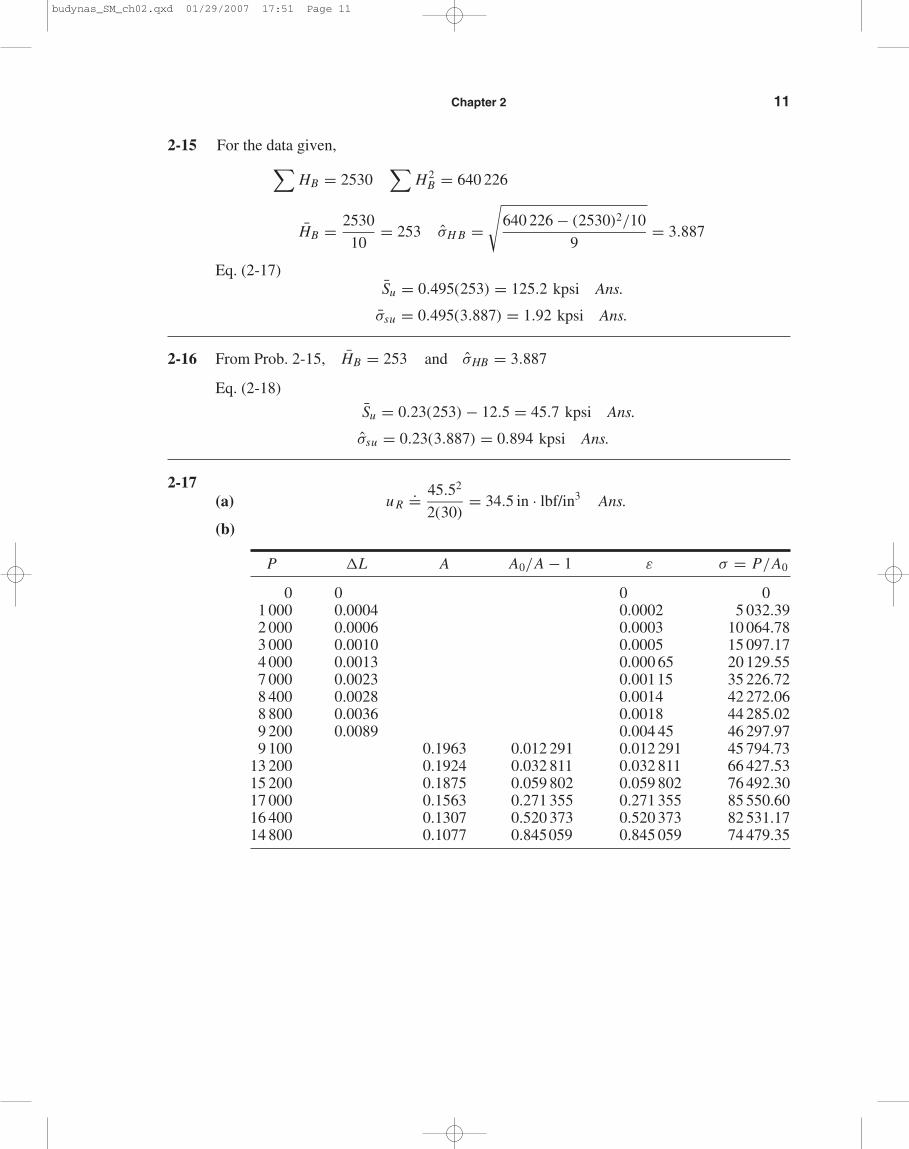
2-17 (a) u R
.= 45.52
2(30)= 34.5 in · lbf/in3 Ans.
(b)
P �L A A0/A − 1 ε σ = P/A0
0 0 0 01 000 0.0004 0.0002 5 032.392 000 0.0006 0.0003 10 064.783 000 0.0010 0.0005 15 097.174 000 0.0013 0.000 65 20 129.557 000 0.0023 0.00115 35 226.728 400 0.0028 0.0014 42 272.068 800 0.0036 0.0018 44 285.029 200 0.0089 0.004 45 46 297.979 100 0.1963 0.012 291 0.012 291 45 794.73
13 200 0.1924 0.032 811 0.032 811 66 427.5315 200 0.1875 0.059 802 0.059 802 76 492.3017 000 0.1563 0.271 355 0.271 355 85 550.6016 400 0.1307 0.520 373 0.520 373 82 531.1714 800 0.1077 0.845059 0.845 059 74 479.35
budynas_SM_ch02.qxd 01/29/2007 17:51 Page 11
12 Solutions Manual • Instructor’s Solution Manual to Accompany Mechanical Engineering Design
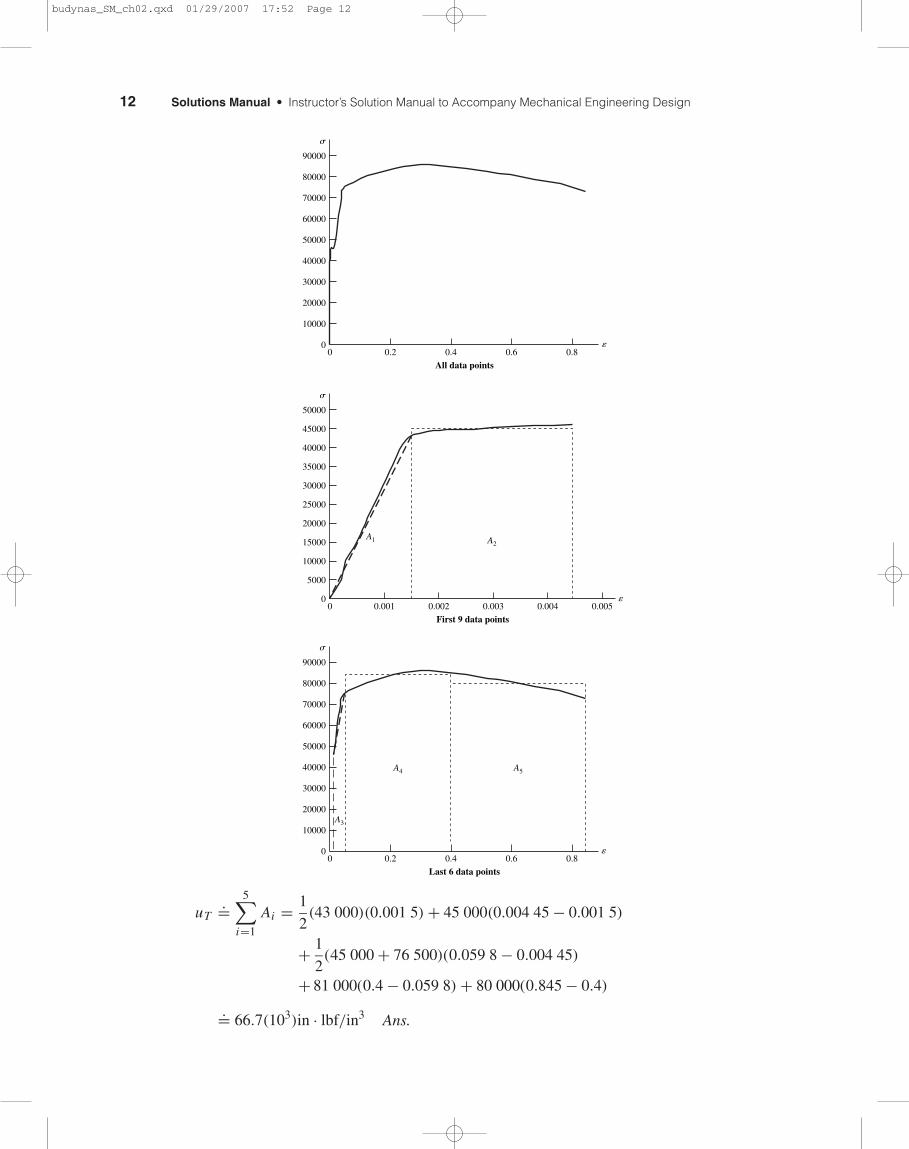
uT.=
5∑i=1
Ai = 1
2(43 000)(0.001 5) + 45 000(0.004 45 − 0.001 5)
+ 1
2(45 000 + 76 500)(0.059 8 − 0.004 45)
+ 81 000(0.4 − 0.059 8) + 80 000(0.845 − 0.4)
.= 66.7(103)in · lbf/in3 Ans.
�
�
0
20000
10000
30000
40000
50000
60000
70000
80000
90000
0 0.2 0.4 0.6 0.8
A3
A4 A5
Last 6 data points
First 9 data points
�
�
0
A1 A215000
10000
5000
20000
25000
30000
35000
40000
45000
50000
0 0.0020.001 0.003 0.004 0.005
�
�
0
20000
10000
30000
40000
50000
60000
70000
80000
90000
0 0.2 0.4
All data points0.6 0.8
budynas_SM_ch02.qxd 01/29/2007 17:52 Page 12
Chapter 2 13
2-18 to 2-21 are research problems
2-22 m = Alρ
For stiffness, k = AE/ l, or, A = kl/E .
Thus, m = kl2ρ/E , and, M = E/ρ. Therefore, β = 1
From Fig. 2-16, ductile materials include Steel, Titanium, Molybdenum, Aluminum, andComposites.
For strength, S = F/A, or, A = F/S.
Thus, m = Fl ρ/S, and, M = S/ρ.
From Fig. 2-19, lines parallel to S/ρ give for ductile materials, Steel, Nickel, Titanium, andcomposites.
Common to both stiffness and strength are Steel, Titanium, Aluminum, and Composites. Ans.
budynas_SM_ch02.qxd 01/29/2007 17:52 Page 13