Bioattenuation in Groundwater Impacted byprofdoc.um.ac.ir/articles/a/1019869.pdf · Bioattenuation...
11
Bioattenuation in Groundwater Impacted by Landfill Leachate Traced with δ 13 C by Hossein Mohammadzadeh 1 and Ian Clark 2 Abstract The impact on groundwater imparted by the infiltration of high dissolved organic carbon (DOC) leachate from capped, unlined landfills can be attenuated by biogeochemical reactions beyond the waste source, although such reactive loss in the aquifer is difficult to distinguish from conservative advective dispersion. Compound- specific measurement of δ 13 C in carbon species, including CH 4 , dissolved inorganic carbon (DIC), and the major DOC compounds (acetate, humic acid, and fulvic acid) provides a constraint in this assessment that can assist in exercises of modeling and prediction of leachate transport. The Trail Road municipal landfill near Ottawa, Ontario, Canada, hosts an unlined sector which produces a highly enriched leachate (DOC >4500 mg/L) that provides a good site to examine reactive attenuation within the receptor aquifer. Acetate, a sentinel component of leachate DOC (∼1000 mg C/L), is absent in impacted groundwater. Mass balance calculations together with reaction modeling suggest continued acetate fermentation with calcite control on DIC and δ 13 C DIC evolution. In groundwater within 50 m of the landfill, methane concentrations are elevated (∼10 mg/L), consistent with acetate fermentation, whereas δ 13 C CH4 measurements in deeper groundwater range down to −51‰ compared with −60‰ in the landfill demonstrating oxidative loss. DOC in the deep aquifer is remarkably depleted to values less than −40‰ suggesting methanotrophic bacteria selectively consume isotopically light CH 4 to fix carbon. Continued reaction of leachate DOC in groundwater is demonstrated by evolution away from conservative mixing lines on diagrams of δ 13 C vs. concentrations of DIC and DOC. Introduction Leakage of landfill leachate from legacy landfills that lack engineered liners can be a chronic source of groundwater contamination (e.g., Mackay et al. 1985; Lo 1996; El Fadel et al. 1997; Kjeldsen et al. 2002; Kurniawan et al. 2006). Although usually capped to min- imize infiltration and leachate production, this results in considerably higher concentrations of hazardous dissolved 1 Corresponding author: Groundwater Research Center, Fac- ulty of Science, Ferdowsi University of Mashhad, P.O. Box 91775- 1436, Mashhad, Iran; (98) 511 8797275; fax: (98) 511 8797275; [email protected], mohammadzadeh@alumni. uottawa.ca 2 Department of Earth Sciences, University of Ottawa, 140 Louis Pasteur, Ottawa, ON K1N 6N5, Canada; [email protected] Received November 2008, accepted December 2010. © 2011, The Author(s) Ground Water © 2011, National Ground Water Association. doi: 10.1111/j.1745-6584.2010.00790.x organic carbon (DOC) compounds (Rovers and Far- quhar 1973; El Fadel et al. 1997). Subsequent impact on groundwater can be partially mitigated by dilution dur- ing advective dispersion in groundwater but potentially by further biogeochemical reaction and degradation within the aquifer. Although estimates of dilution can be made on the basis of conservative transport modeling, demonstrat- ing the degradation of organic carbon within the plume is more challenging given the heterogeneity in leachate com- position within a landfill. Kjeldsen et al. (2002) reviewed the sequence of leachate evolution in municipal solid waste landfills in the final anaerobic stage. Hydrolysis and anaerobic degradation of cellulosic and hemicellu- losic materials in landfills contribute to the generation of labile organic components ranging from light fatty acids to high-molecular weight humic and fulvic components as well as dissolved inorganic carbon (DIC) and CH 4 (Christensen et al. 1998). Following the initial aerobic and acidic phases, fermentative bacteria hydrolyze and NGWA.org GROUND WATER 1
Transcript of Bioattenuation in Groundwater Impacted byprofdoc.um.ac.ir/articles/a/1019869.pdf · Bioattenuation...
Bioattenuation in Groundwater Impacted byLandfill Leachate Traced with δ13Cby Hossein Mohammadzadeh1 and Ian Clark2
AbstractThe impact on groundwater imparted by the infiltration of high dissolved organic carbon (DOC) leachate
from capped, unlined landfills can be attenuated by biogeochemical reactions beyond the waste source, althoughsuch reactive loss in the aquifer is difficult to distinguish from conservative advective dispersion. Compound-specific measurement of δ13C in carbon species, including CH4, dissolved inorganic carbon (DIC), and the majorDOC compounds (acetate, humic acid, and fulvic acid) provides a constraint in this assessment that can assistin exercises of modeling and prediction of leachate transport. The Trail Road municipal landfill near Ottawa,Ontario, Canada, hosts an unlined sector which produces a highly enriched leachate (DOC >4500 mg/L) thatprovides a good site to examine reactive attenuation within the receptor aquifer. Acetate, a sentinel componentof leachate DOC (∼1000 mg C/L), is absent in impacted groundwater. Mass balance calculations together withreaction modeling suggest continued acetate fermentation with calcite control on DIC and δ13CDIC evolution. Ingroundwater within 50 m of the landfill, methane concentrations are elevated (∼10 mg/L), consistent with acetatefermentation, whereas δ13CCH4 measurements in deeper groundwater range down to −51‰ compared with −60‰in the landfill demonstrating oxidative loss. DOC in the deep aquifer is remarkably depleted to values less than−40‰ suggesting methanotrophic bacteria selectively consume isotopically light CH4 to fix carbon. Continuedreaction of leachate DOC in groundwater is demonstrated by evolution away from conservative mixing lines ondiagrams of δ13C vs. concentrations of DIC and DOC.
IntroductionLeakage of landfill leachate from legacy landfills
that lack engineered liners can be a chronic source ofgroundwater contamination (e.g., Mackay et al. 1985;Lo 1996; El Fadel et al. 1997; Kjeldsen et al. 2002;Kurniawan et al. 2006). Although usually capped to min-imize infiltration and leachate production, this results inconsiderably higher concentrations of hazardous dissolved
1Corresponding author: Groundwater Research Center, Fac-ulty of Science, Ferdowsi University of Mashhad, P.O. Box 91775-1436, Mashhad, Iran; (98) 511 8797275; fax: (98) 511 8797275;[email protected], [email protected]
2Department of Earth Sciences, University of Ottawa, 140Louis Pasteur, Ottawa, ON K1N 6N5, Canada; [email protected]
Received November 2008, accepted December 2010.© 2011, The Author(s)Ground Water © 2011, National Ground Water Association.doi: 10.1111/j.1745-6584.2010.00790.x
organic carbon (DOC) compounds (Rovers and Far-quhar 1973; El Fadel et al. 1997). Subsequent impact ongroundwater can be partially mitigated by dilution dur-ing advective dispersion in groundwater but potentiallyby further biogeochemical reaction and degradation withinthe aquifer. Although estimates of dilution can be made onthe basis of conservative transport modeling, demonstrat-ing the degradation of organic carbon within the plume ismore challenging given the heterogeneity in leachate com-position within a landfill. Kjeldsen et al. (2002) reviewedthe sequence of leachate evolution in municipal solidwaste landfills in the final anaerobic stage. Hydrolysisand anaerobic degradation of cellulosic and hemicellu-losic materials in landfills contribute to the generation oflabile organic components ranging from light fatty acidsto high-molecular weight humic and fulvic componentsas well as dissolved inorganic carbon (DIC) and CH4
(Christensen et al. 1998). Following the initial aerobicand acidic phases, fermentative bacteria hydrolyze and
NGWA.org GROUND WATER 1
ferment primary organic polymers to produce carboxylicand fatty acids according to reactions such as the forma-tion of butanoic acid:
C6H12O6 → CH3CH2CH2COOH + 2CO2 + 2H2
and acetic acid:
CH3CH2CH2COOH + 2H2O → 2CH3COOH + 2H2
with net production of DOC, hydrogen gas, and CO2.Acetotrophic and hydrogenotrophic methanogens areactive at this stage, converting these end products to CH4
and CO2:
CH3COOH → CH4 + CO2
CO2 + 4H2 → CH4 + 2H2O (Klass 1984)
In this stage of maximum methanogenesis, a recalcitrantorganic reservoir of higher weight compounds includ-ing humic and fulvic and hydrophilic fractions beginsaccumulating (Christensen et al. 1998). The reservoir ofdissolved carbon is then characterized by humic and ful-vic acids, acetate, and other light-weight fatty acids plusthe dissolved methane and inorganic carbon (essentiallyHCO3
−). There is a considerable range in concentra-tions of these components of the carbon pool (Kjeldsenet al. 2002; Mohammadzadeh et al. 2005) and so assess-ing the degree of degradation following dilution with theimpacted groundwater on the basis of compound ratios isnot possible. In contrast, biogeochemical reactions associ-ated with the transformation of DIC and DOC compoundswithin the landfill environment produce characteristic 13Csignatures that serve to demonstrate attenuation throughreactive biodegradation. The fractionation of 13C duringgeneration of DOC, DIC, and CH4 within the landfillleachate has been recognized and characterized in a num-ber of studies (Liu et al. 1992; Fritz et al. 1994; Hackleyet al. 1996, 1999; Desrocher and Lollar 1998; North et al.2006). More recently, isotopic characterization of sepa-rated compounds of DOC offers greater insights into 13Cpartitioning and reactions during biodegradation in landfillleachate (Mohammadzadeh et al. 2005; North et al. 2006).In the case of the Trail Road Landfill (TRL), compound-specific isotope analysis of leachate DOC fractions showpartitioning of 13C exceeding 10‰ during leachate gener-ation (Mohammadzadeh and Clark 2008). The substantialbacterial fractionation associated with DOC degradationcan then be used to distinguish continued biodegradationof DOC in groundwater from nonreactive advective dis-persion for transport modeling. For example, continuedfermentation of elevated DOC in the proximal zones ofthe leachate plume may add 13C-enriched CO2 to the DICpool, whereas oxidation of DOC in the distal part of theplume will impart a negative shift in 13CDIC for the gainedDIC.
Compound-specific isotope (13C) analysis is under-taken here for groundwater samples collected from the
TRL site. The leachate from unlined parts of the TRL(Stages 1 and 2) and the adjacent unlined Nepean land-fill is recognized as the main source of organic carboncontamination that has been observed in the downgradi-ent groundwater. The objective of this work is to evaluatethe use of 13C in DIC, CH4, and DOC fractions, in con-junction with conservative leachate dilution pathways, torecognize continued degradation of organic compounds inleachate-impacted groundwater. Excursions from dilutionpathways can then be used to elucidate the nature andextent of continued biogeochemical reaction and degrada-tion within the leachate-impacted groundwater.
Hydrogeological and Geochemical Settingof the TRL
The TRL is owned and operated by the City ofOttawa and is located approximately 25 km west of thecity (Figure 1). The TRL is divided into Stages 1 through4. Stages 3 and 4 were opened in 1991 and feature basalleachate collection and recirculation systems underlain byan engineered barrier of clay, sand, and PVC liner. OnlyStage 4 remains uncapped and in active operation (Cityof Ottawa 2002; Dillon Consulting Ltd. 2006). Stages 1and 2 (Figure 1), which are up to 30 years old, are cappedbut unlined and without leachate collection systems andso represent the source of leachate contamination of theunderlying aquifers.
The site is underlain by both a shallow and a deepaquifer, separated by a discontinuous clay aquitard that ispresent in the northern and western portions of the site butabsent below the southern half of Stages 1 and 2. Abovethe clay aquitard, shallow groundwater flows northwardand follows the general slope of the underlying clay whichvaries approximately 20 m in elevation over the studyarea. In the deep aquifer, flow is northwest toward a dewa-tering pond (DWP). More than 200 individual and nestedpiezometers were installed by the City of Ottawa to sam-ple groundwater (Figure 1) (City of Ottawa 2002; GolderAssociates Ltd. 2003; Dillon Consulting Ltd. 2006).
Leachate impact has been identified largely on thebasis of CH4, Cl−, Br−, and NH4
+ in both shallowand deep aquifers along the north border of the unlinedparts of the TRL site (Dillon Consulting Ltd. 2006).Piezometers completed in the shallow aquifer (M4-2 andM37-3 north border of Stages 1 and 2, respectively)and in the deep aquifer (M4-1, M37-2, M39-7, andM16-2) were selected for detailed sampling and analysis(Figure 1). Review of the available geochemical data(City of Ottawa 2002; Golder Associates Ltd. 2003;Dillon Consulting Ltd. 2006) showed no evidence ofleachate indicator parameters in upgradient (M57) anddowngradient (M120) groundwater, which were sampledin this study as representative background (unimpacted)groundwater.
Field Sampling and Analytical MethodsField geochemical parameters, including tempera-
ture (T ), pH, electromotive potential (Eh), and dissolved
2 H. Mohammadzadeh and I. Clark GROUND WATER NGWA.org

Figure 1. Plan view of study area and flow direction in the deep aquifer. Geological cross section parallel to landfill border(AA′) and at groundwater flow directions in the deep aquifer (BB′) which shows both shallow and deep aquifers, separatedby a discontinuous clay aquitard. The concentrations and δ13C values of major carbon fractions for 2004 sampling (and 2005sampling between parentheses) are shown in different levels (screens) on the well logs.
NGWA.org H. Mohammadzadeh and I. Clark GROUND WATER 3
oxygen (DO) were measured in an in-line flow-throughcell through which groundwater was circulated with aperistaltic pump. Samples for major anions and cationsand δ2H and δ18O of water were filtered with 0.45-μm fil-ter disks and collected in 30-mL high-density polyethyleneplastic bottles. Cation samples were acidified with 0.1 mLultrapure nitric acid. To measure concentrations and δ13Cof DIC and DOC, 40-mL filtered samples were collectedusing amber glass bottles. Methane samples (concentra-tion and isotopes) were collected unfiltered in 125-mLWheaton glass bottles to measure the methane concentra-tion and isotopes. Bulk samples for separation of DOCcompounds, including acetate, humic acid (HA), fulvicacid (FA), and light-molecular weight dissolved carbon(LMW DOC), were collected in 4-L amber glass con-tainers and kept cool prior to lab filtering (0.45 μm) andanalysis within a 2-week period.
The δ18O and δ2H of the water samples weremeasured by routine CO2 and H2 equilibration using aGasbench and DeltaPlus XP continuous-flow isotope-ratiomass spectrometer (CF-IRMS, with an analytical precisionof ±0.15‰ and ±2.0‰, respectively). The concentrationand 13C-isotopic composition of DIC plus both bulkDOC and separated DOC compounds were measuredusing a Total Carbon Analyzer (TCA-OI InstrumentsModel 1010) interfaced with CF-IRMS. Here, samplesare initially acidified (5% H3PO4) and purged of CO2 formeasurement of DIC and δ13CDIC by advection of sampleCO2 in an He stream through a nondispersive infrareddetector and then through a ConFlow III interface for δ13Cmeasurement by IRMS (St-Jean 2003). This is followedby a DOC oxidation step (Na2S2O8) and second purge ofCO2 for measurement of DOC and δ13CDOC.
The isolation of dissolved humic compounds was car-ried out by acid precipitation of HA and column separationof remaining FA and LMW DOC. Four-liter samples werefiltered using 0.7 μm glass-microfiber filters (Whatmancat No. 1825047) and acidified to below pH 2 with con-centrated HCl to precipitate and then filter out HA. TheFA of the samples was separated from the LMW DOCfraction using Superlite DAX-8 adsorbent resin. All col-lected samples were analyzed with the TCA interfacedto the IRMS (aforementioned) to obtain carbon concen-trations and δ13C values of DOC fractions following theprotocols presented by Mohammadzadeh et al. (2005).
The carbon content and 13C in solid (precipitated) HAsamples were analyzed by flash combustion at 1800 ◦Cwith a Carlo Erba Flash Elemental Analyzer equippedwith a thermal conductivity detector and configured in-line with a Delta plus CF-IRMS. The routine analyticalprecision (2σ) is ±0.1% for concentration and ±0.15‰for 13C.
Carbon concentration and isotope mass balance calcu-lations, according to Equation 1, show that the efficiencyof the DAX-resin column for collection of organic carbonfractions shows that recoveries are >92.8%.
δ13CDOC × CDOC = (δ13CHA × CHA) + (δ13CFA × CFA)
+ (δ13CLMW DOC × CLMW DOC) (1)
Headspace samples were analyzed for methane concen-tration, δ13CCH4 and δ13CCO2 using a gas chromatography(GC) combustion system (GCC III) interfaced with a CF-IRMS. The analytical precision for δ13C was ±0.2‰ to±0.3‰. All measurements were performed in the Geo-chemistry and the G.G. Hatch Stable Isotope Laboratoryat the University of Ottawa.
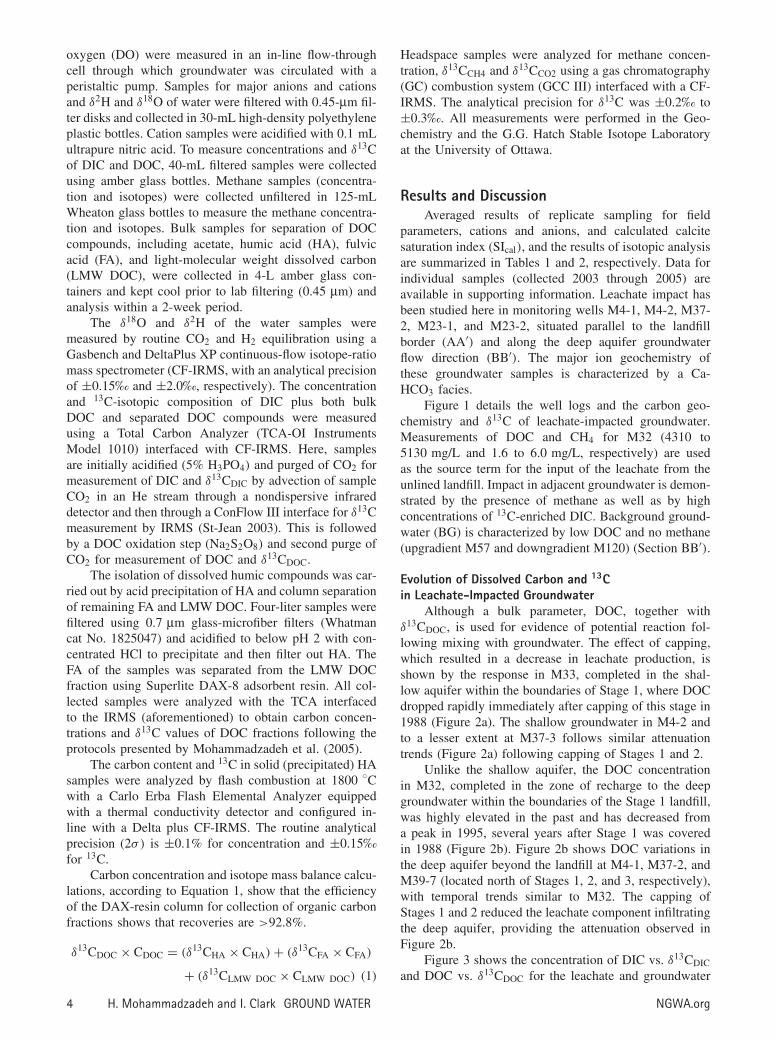
Results and DiscussionAveraged results of replicate sampling for field
parameters, cations and anions, and calculated calcitesaturation index (SIcal), and the results of isotopic analysisare summarized in Tables 1 and 2, respectively. Data forindividual samples (collected 2003 through 2005) areavailable in supporting information. Leachate impact hasbeen studied here in monitoring wells M4-1, M4-2, M37-2, M23-1, and M23-2, situated parallel to the landfillborder (AA′) and along the deep aquifer groundwaterflow direction (BB′). The major ion geochemistry ofthese groundwater samples is characterized by a Ca-HCO3 facies.
Figure 1 details the well logs and the carbon geo-chemistry and δ13C of leachate-impacted groundwater.Measurements of DOC and CH4 for M32 (4310 to5130 mg/L and 1.6 to 6.0 mg/L, respectively) are usedas the source term for the input of the leachate from theunlined landfill. Impact in adjacent groundwater is demon-strated by the presence of methane as well as by highconcentrations of 13C-enriched DIC. Background ground-water (BG) is characterized by low DOC and no methane(upgradient M57 and downgradient M120) (Section BB′).
Evolution of Dissolved Carbon and 13Cin Leachate-Impacted Groundwater
Although a bulk parameter, DOC, together withδ13CDOC, is used for evidence of potential reaction fol-lowing mixing with groundwater. The effect of capping,which resulted in a decrease in leachate production, isshown by the response in M33, completed in the shal-low aquifer within the boundaries of Stage 1, where DOCdropped rapidly immediately after capping of this stage in1988 (Figure 2a). The shallow groundwater in M4-2 andto a lesser extent at M37-3 follows similar attenuationtrends (Figure 2a) following capping of Stages 1 and 2.
Unlike the shallow aquifer, the DOC concentrationin M32, completed in the zone of recharge to the deepgroundwater within the boundaries of the Stage 1 landfill,was highly elevated in the past and has decreased froma peak in 1995, several years after Stage 1 was coveredin 1988 (Figure 2b). Figure 2b shows DOC variations inthe deep aquifer beyond the landfill at M4-1, M37-2, andM39-7 (located north of Stages 1, 2, and 3, respectively),with temporal trends similar to M32. The capping ofStages 1 and 2 reduced the leachate component infiltratingthe deep aquifer, providing the attenuation observed inFigure 2b.
Figure 3 shows the concentration of DIC vs. δ13CDIC
and DOC vs. δ13CDOC for the leachate and groundwater
4 H. Mohammadzadeh and I. Clark GROUND WATER NGWA.org
Tab
le1
Fie
ldP
aram
eter
s,C
atio
nan
dA
nion
Con
cent
rati
ons,
and
Cal
cula
ted
Cal
cite
Satu
rati
onIn
dex
(SI c
al)
for
Gro
undw
ater
Sam
ples
Fie
ldP
aram
eter
sC
atio
nsA
nion
s
Sam
ple
IDn
T(◦ C
)pH
Eh
(mV
)D
OB
Ba
Ca
Fe
KM
gM
nN
aN
H+ 4
SrF
Cl
Br
NO
2N
O3
PO
4SO
4H
CO
3SI
cal
M57
29.
67.
540
26.
50.
010.
161
bl1.
617
bl50
0.16
0.1
0.1
73bl
bl1.
80.
220
249
0.18
M12
03
12.4
7.5
344
4.6
0.01
0.1
64bl
1.8
23bl
120.
160.
20.
142
0.2
0.2
2.2
0.3
3023
40.
16D
ewat
erin
gpo
nd4
13.6
7.5
230
8.1
0.03
0.2
89bl
2.6
360.
119
0.24
0.2
0.1
550.
20.
10.
90.
148
411
0.54
Shal
low
aqui
fer
1212
.06.
725
84.
70.
310.
212
66.
514
.236
0.6
7822
.43
0.6
0.2
117
1.4
0.2
9.1
3.4
3862
5−0
.06
Upp
erde
epaq
uife
r27
12.6
6.9
223
2.9
0.09
0.6
112
5.3
4.0
470.
535
0.85
0.7
0.1
740.
30.
10.
70.
244
451
0.07
Low
erde
epaq
uife
r20
11.6
7.1
229
2.1
0.06
1.1
841.
03.
435
0.2
250.
201.
00.
254
0.4
0.1
0.1
0.5
2837
00.
06M
323
15.0
6.8
219
3.2
1.38
20.7
2115
23.2
124.
848
53.
810
7931
2.5
3.6
0.5
1088
2.8
24.9
1.6
30.9
610
400.
70
Not
e:A
llco
ncen
trat
ions
inm
g/L
,if
not
stat
ed.
The
seda
taar
eav
erag
eva
lues
.D
ata
for
indi
vidu
alw
ells
are
avai
labl
ein
supp
ortin
gin
form
atio
n.n
=nu
mbe
rof
valu
esav
erag
ed;
bl=
blow
dete
ctio
nlim
it.
from different aquifers. Mixing lines were drawn based onδ13C mass balance between two end members includingthe BG (at M57) and leachate (M32), using Equations 2and 3.
δ13CMixture =f (δ13CDC-Leachate × DCLeachate)
+ (1 − f )(δ13CDC-BG × DCBG)
f × DCLeachate + (1 − f ) × DCBG(2)
DCMixture = f × DCLeachate + (1 − f ) × DCBG (3)
in which DC represents either DOC or DIC and f is theleachate fraction.
Most data for these aquifers plot away from the con-servative mixing lines in Figure 3, indicating reactiveevolution in addition to simple dilution. Closer exami-nation shows that a series of reactions occur in theseleachate-impacted groundwater. In the deep aquifer, manyof the DIC values show an increase in δ13CDIC, which isan indication of continued methanogenesis. The excur-sions exhibited by a few samples to lower δ13CDIC valuesare clear evidence for additions of DIC from oxidation ofDOC and/or CH4.
Continued methanogenesis can account for theenrichment in 13CDIC observed for the groundwater thatplot above the mixing line. The high concentrations ofacetate measured in M32 are not present in downgradientgroundwater and so have likely been lost by continuedmethanogenesis. The δ13CDIC enrichment associated withthis reaction is modeled in Figure 4. The average acetateconcentration in M32 leachate is 1008 mg/L (Moham-madzadeh and Clark 2008). As illustrated in Figure 4, theinitial input of acetate from M32 depends on the dilutionfactor (df) and can be calculated using Equations 3 and 4.Fermentation of this acetate results in increased DIC andenrichment of 13CDIC. The final δ13CDIC values are cal-culated based on a δ13C mass balance between initial andgained DIC components, using Equation 4,
δ13CDIC-Final =
(δ13CDIC-Initial × DICInitial)
+ (δ13CDIC-Gained × DICGained)
DICInitial + DICGained(4)
in which gained DIC is obtained from percent loss ofinitial input acetate and its equivalent δ13C calculatedusing the following equation:
δ13CDIC-Gained = δ13CAcetate + ε13CCO2-CH4
2(5)
in which ε13CCO2-CH4 is calculated based on 13C fraction-ation between coexisting CH4 and CO2 (which is less thanabout 0.935; Whiticar et al. 1986).
The maximum δ13C values from this reaction donot reach the highly enriched values observed in thegroundwater, which exceed 15‰ to 20‰. Furthermore,the measured DIC concentrations are much lower thanwould be predicted by simple acetate fermentation. This
NGWA.org H. Mohammadzadeh and I. Clark GROUND WATER 5
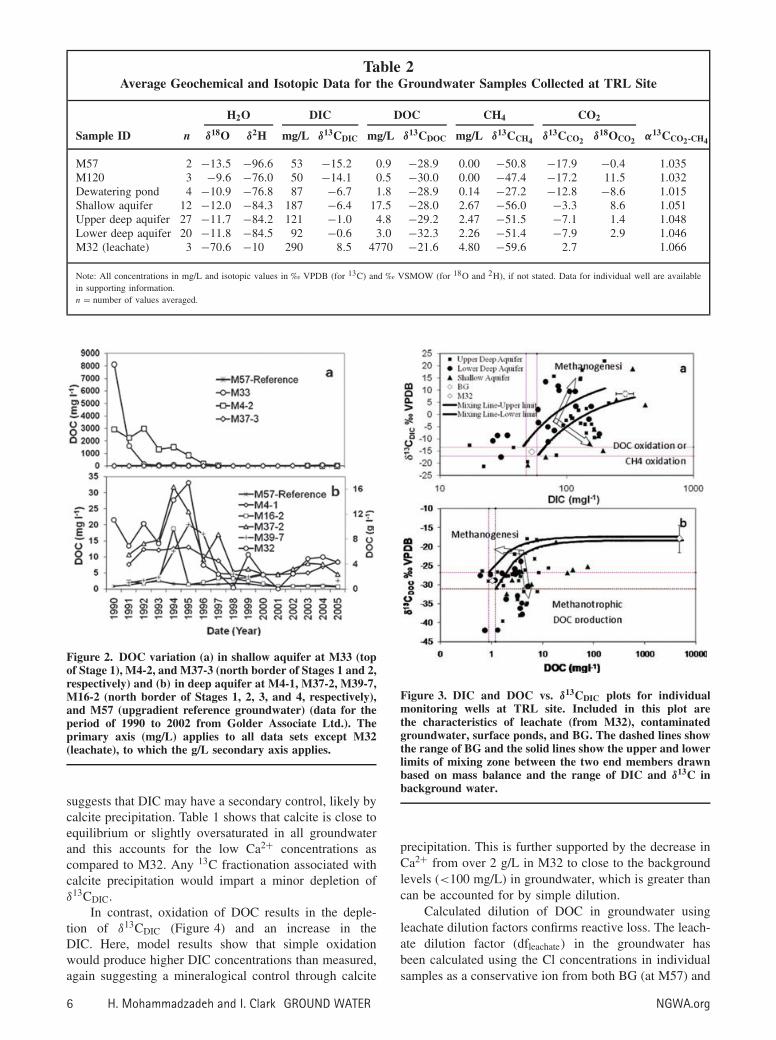
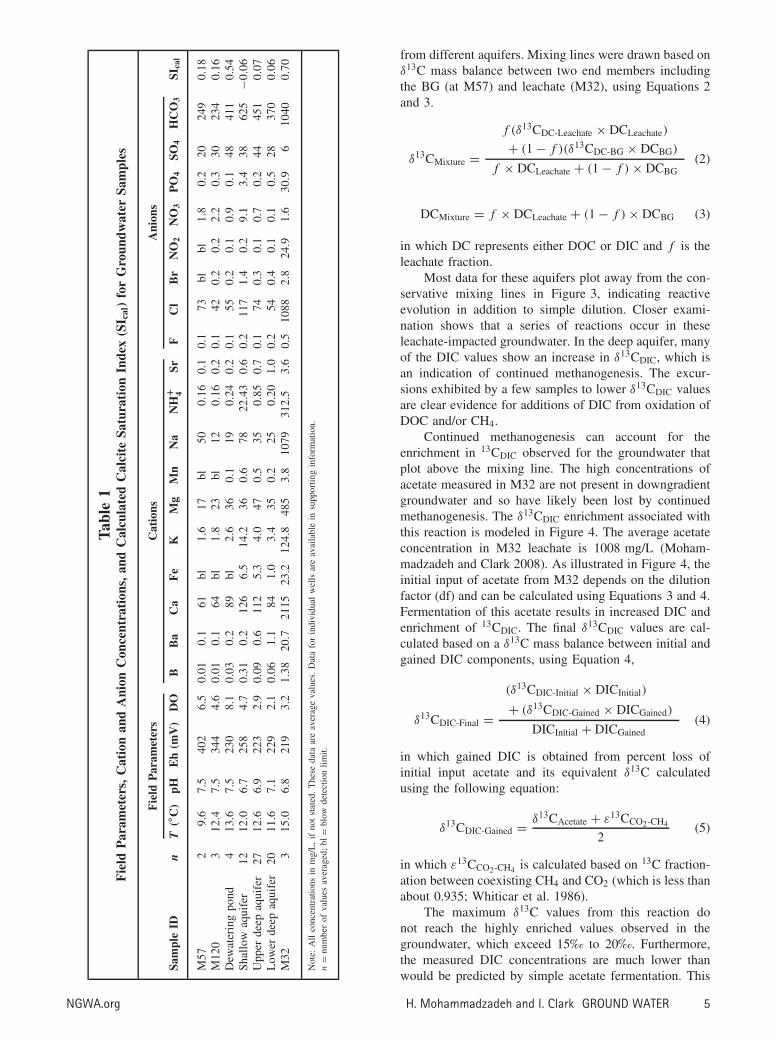
Table 2Average Geochemical and Isotopic Data for the Groundwater Samples Collected at TRL Site
H2O DIC DOC CH4 CO2
Sample ID n δ18O δ2H mg/L δ13CDIC mg/L δ13CDOC mg/L δ13CCH4 δ13CCO2 δ18OCO2 α13CCO2-CH4
M57 2 −13.5 −96.6 53 −15.2 0.9 −28.9 0.00 −50.8 −17.9 −0.4 1.035M120 3 −9.6 −76.0 50 −14.1 0.5 −30.0 0.00 −47.4 −17.2 11.5 1.032Dewatering pond 4 −10.9 −76.8 87 −6.7 1.8 −28.9 0.14 −27.2 −12.8 −8.6 1.015Shallow aquifer 12 −12.0 −84.3 187 −6.4 17.5 −28.0 2.67 −56.0 −3.3 8.6 1.051Upper deep aquifer 27 −11.7 −84.2 121 −1.0 4.8 −29.2 2.47 −51.5 −7.1 1.4 1.048Lower deep aquifer 20 −11.8 −84.5 92 −0.6 3.0 −32.3 2.26 −51.4 −7.9 2.9 1.046M32 (leachate) 3 −70.6 −10 290 8.5 4770 −21.6 4.80 −59.6 2.7 1.066
Note: All concentrations in mg/L and isotopic values in ‰ VPDB (for 13C) and ‰ VSMOW (for 18O and 2H), if not stated. Data for individual well are availablein supporting information.n = number of values averaged.
Figure 2. DOC variation (a) in shallow aquifer at M33 (topof Stage 1), M4-2, and M37-3 (north border of Stages 1 and 2,respectively) and (b) in deep aquifer at M4-1, M37-2, M39-7,M16-2 (north border of Stages 1, 2, 3, and 4, respectively),and M57 (upgradient reference groundwater) (data for theperiod of 1990 to 2002 from Golder Associate Ltd.). Theprimary axis (mg/L) applies to all data sets except M32(leachate), to which the g/L secondary axis applies.
suggests that DIC may have a secondary control, likely bycalcite precipitation. Table 1 shows that calcite is close toequilibrium or slightly oversaturated in all groundwaterand this accounts for the low Ca2+ concentrations ascompared to M32. Any 13C fractionation associated withcalcite precipitation would impart a minor depletion ofδ13CDIC.
In contrast, oxidation of DOC results in the deple-tion of δ13CDIC (Figure 4) and an increase in theDIC. Here, model results show that simple oxidationwould produce higher DIC concentrations than measured,again suggesting a mineralogical control through calcite
Figure 3. DIC and DOC vs. δ13CDIC plots for individualmonitoring wells at TRL site. Included in this plot arethe characteristics of leachate (from M32), contaminatedgroundwater, surface ponds, and BG. The dashed lines showthe range of BG and the solid lines show the upper and lowerlimits of mixing zone between the two end members drawnbased on mass balance and the range of DIC and δ13C inbackground water.
precipitation. This is further supported by the decrease inCa2+ from over 2 g/L in M32 to close to the backgroundlevels (<100 mg/L) in groundwater, which is greater thancan be accounted for by simple dilution.
Calculated dilution of DOC in groundwater usingleachate dilution factors confirms reactive loss. The leach-ate dilution factor (dfleachate) in the groundwater hasbeen calculated using the Cl concentrations in individualsamples as a conservative ion from both BG (at M57) and
6 H. Mohammadzadeh and I. Clark GROUND WATER NGWA.org
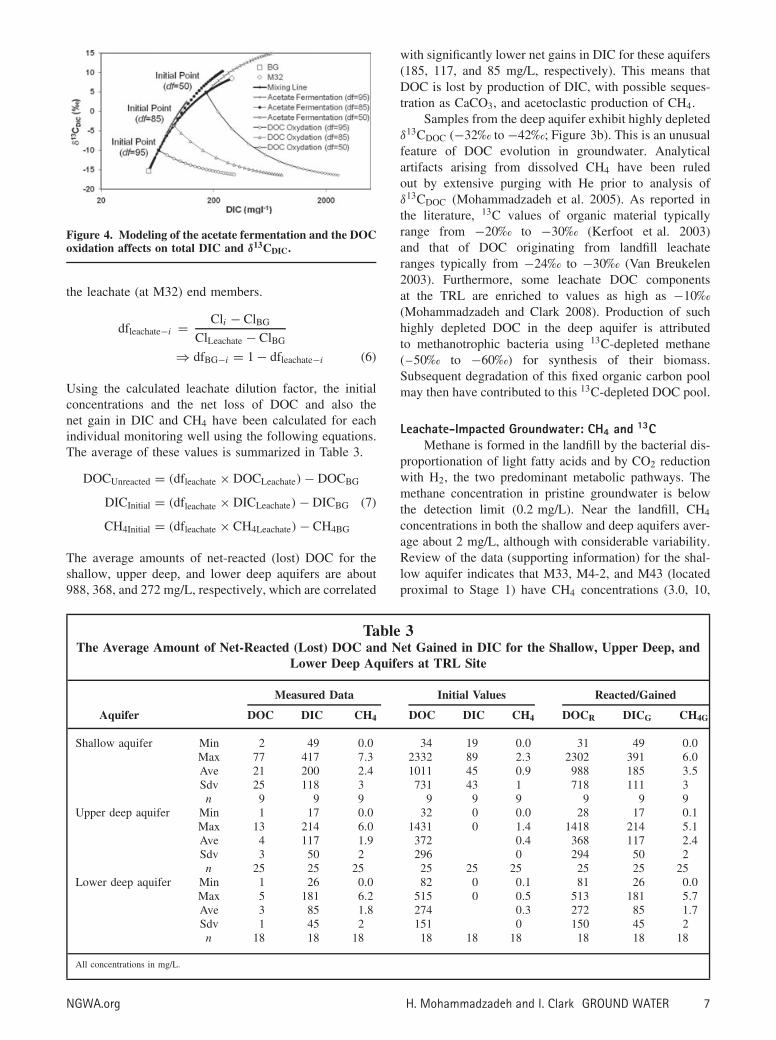
Figure 4. Modeling of the acetate fermentation and the DOCoxidation affects on total DIC and δ13CDIC.
the leachate (at M32) end members.
dfleachate−i = Cli − ClBG
ClLeachate − ClBG
⇒ dfBG−i = 1 − dfleachate−i (6)
Using the calculated leachate dilution factor, the initialconcentrations and the net loss of DOC and also thenet gain in DIC and CH4 have been calculated for eachindividual monitoring well using the following equations.The average of these values is summarized in Table 3.
DOCUnreacted = (dfleachate × DOCLeachate) − DOCBG
DICInitial = (dfleachate × DICLeachate) − DICBG (7)
CH4Initial = (dfleachate × CH4Leachate) − CH4BG
The average amounts of net-reacted (lost) DOC for theshallow, upper deep, and lower deep aquifers are about988, 368, and 272 mg/L, respectively, which are correlated
with significantly lower net gains in DIC for these aquifers(185, 117, and 85 mg/L, respectively). This means thatDOC is lost by production of DIC, with possible seques-tration as CaCO3, and acetoclastic production of CH4.
Samples from the deep aquifer exhibit highly depletedδ13CDOC (−32‰ to −42‰; Figure 3b). This is an unusualfeature of DOC evolution in groundwater. Analyticalartifacts arising from dissolved CH4 have been ruledout by extensive purging with He prior to analysis ofδ13CDOC (Mohammadzadeh et al. 2005). As reported inthe literature, 13C values of organic material typicallyrange from −20‰ to −30‰ (Kerfoot et al. 2003)and that of DOC originating from landfill leachateranges typically from −24‰ to −30‰ (Van Breukelen2003). Furthermore, some leachate DOC componentsat the TRL are enriched to values as high as −10‰(Mohammadzadeh and Clark 2008). Production of suchhighly depleted DOC in the deep aquifer is attributedto methanotrophic bacteria using 13C-depleted methane(–50‰ to −60‰) for synthesis of their biomass.Subsequent degradation of this fixed organic carbon poolmay then have contributed to this 13C-depleted DOC pool.
Leachate-Impacted Groundwater: CH4 and 13CMethane is formed in the landfill by the bacterial dis-
proportionation of light fatty acids and by CO2 reductionwith H2, the two predominant metabolic pathways. Themethane concentration in pristine groundwater is belowthe detection limit (0.2 mg/L). Near the landfill, CH4
concentrations in both the shallow and deep aquifers aver-age about 2 mg/L, although with considerable variability.Review of the data (supporting information) for the shal-low aquifer indicates that M33, M4-2, and M43 (locatedproximal to Stage 1) have CH4 concentrations (3.0, 10,
Table 3The Average Amount of Net-Reacted (Lost) DOC and Net Gained in DIC for the Shallow, Upper Deep, and
Lower Deep Aquifers at TRL Site
Measured Data Initial Values Reacted/Gained
Aquifer DOC DIC CH4 DOC DIC CH4 DOCR DICG CH4G
Shallow aquifer Min 2 49 0.0 34 19 0.0 31 49 0.0Max 77 417 7.3 2332 89 2.3 2302 391 6.0Ave 21 200 2.4 1011 45 0.9 988 185 3.5Sdv 25 118 3 731 43 1 718 111 3n 9 9 9 9 9 9 9 9 9
Upper deep aquifer Min 1 17 0.0 32 0 0.0 28 17 0.1Max 13 214 6.0 1431 0 1.4 1418 214 5.1Ave 4 117 1.9 372 0.4 368 117 2.4Sdv 3 50 2 296 0 294 50 2n 25 25 25 25 25 25 25 25 25
Lower deep aquifer Min 1 26 0.0 82 0 0.1 81 26 0.0Max 5 181 6.2 515 0 0.5 513 181 5.7Ave 3 85 1.8 274 0.3 272 85 1.7Sdv 1 45 2 151 0 150 45 2n 18 18 18 18 18 18 18 18 18
All concentrations in mg/L.
NGWA.org H. Mohammadzadeh and I. Clark GROUND WATER 7
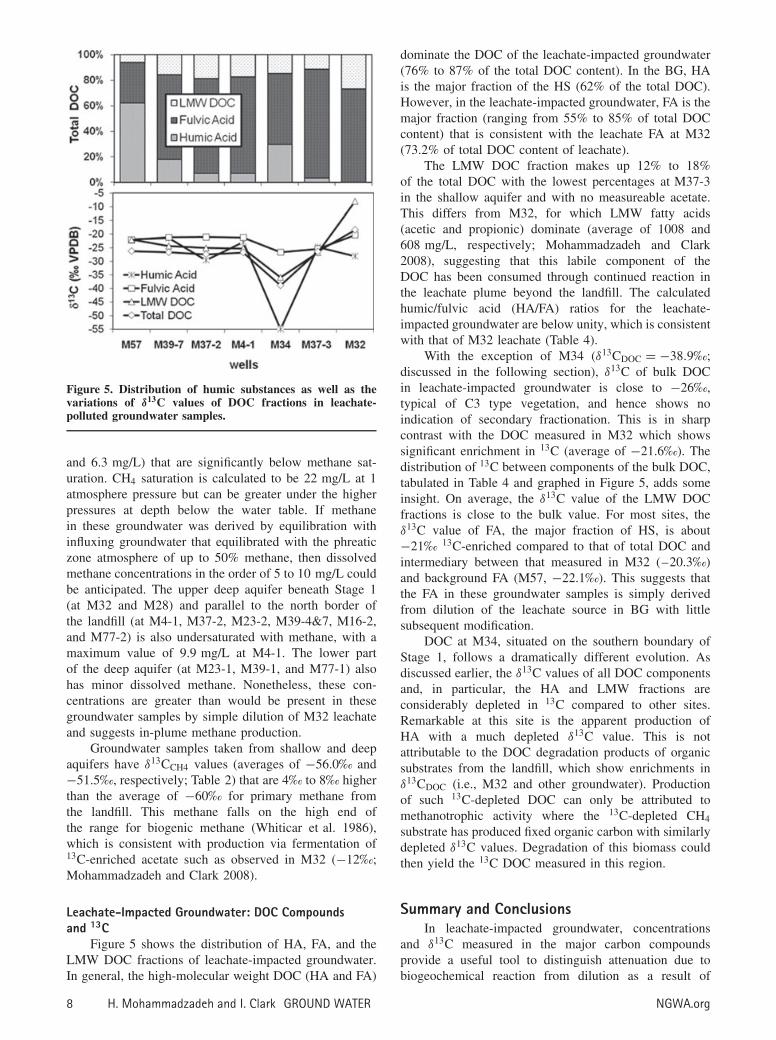
Figure 5. Distribution of humic substances as well as thevariations of δ13C values of DOC fractions in leachate-polluted groundwater samples.
and 6.3 mg/L) that are significantly below methane sat-uration. CH4 saturation is calculated to be 22 mg/L at 1atmosphere pressure but can be greater under the higherpressures at depth below the water table. If methanein these groundwater was derived by equilibration withinfluxing groundwater that equilibrated with the phreaticzone atmosphere of up to 50% methane, then dissolvedmethane concentrations in the order of 5 to 10 mg/L couldbe anticipated. The upper deep aquifer beneath Stage 1(at M32 and M28) and parallel to the north border ofthe landfill (at M4-1, M37-2, M23-2, M39-4&7, M16-2,and M77-2) is also undersaturated with methane, with amaximum value of 9.9 mg/L at M4-1. The lower partof the deep aquifer (at M23-1, M39-1, and M77-1) alsohas minor dissolved methane. Nonetheless, these con-centrations are greater than would be present in thesegroundwater samples by simple dilution of M32 leachateand suggests in-plume methane production.
Groundwater samples taken from shallow and deepaquifers have δ13CCH4 values (averages of −56.0‰ and−51.5‰, respectively; Table 2) that are 4‰ to 8‰ higherthan the average of −60‰ for primary methane fromthe landfill. This methane falls on the high end ofthe range for biogenic methane (Whiticar et al. 1986),which is consistent with production via fermentation of13C-enriched acetate such as observed in M32 (−12‰;Mohammadzadeh and Clark 2008).
Leachate-Impacted Groundwater: DOC Compoundsand 13C
Figure 5 shows the distribution of HA, FA, and theLMW DOC fractions of leachate-impacted groundwater.In general, the high-molecular weight DOC (HA and FA)
dominate the DOC of the leachate-impacted groundwater(76% to 87% of the total DOC content). In the BG, HAis the major fraction of the HS (62% of the total DOC).However, in the leachate-impacted groundwater, FA is themajor fraction (ranging from 55% to 85% of total DOCcontent) that is consistent with the leachate FA at M32(73.2% of total DOC content of leachate).
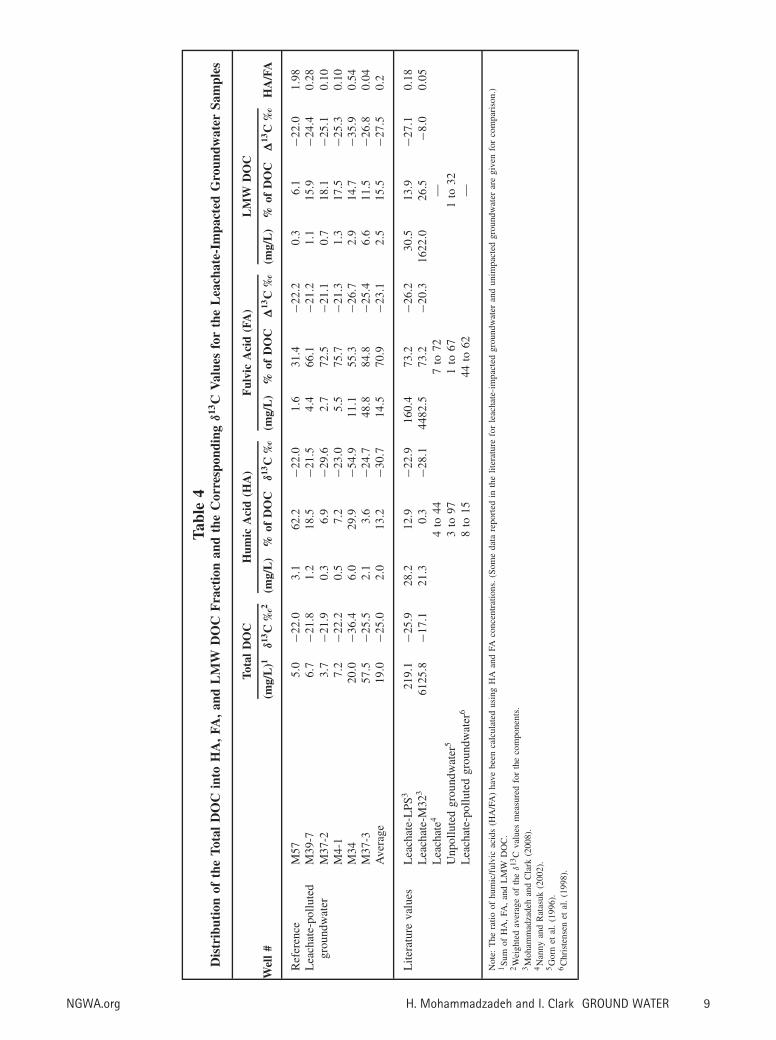
The LMW DOC fraction makes up 12% to 18%of the total DOC with the lowest percentages at M37-3in the shallow aquifer and with no measureable acetate.This differs from M32, for which LMW fatty acids(acetic and propionic) dominate (average of 1008 and608 mg/L, respectively; Mohammadzadeh and Clark2008), suggesting that this labile component of theDOC has been consumed through continued reaction inthe leachate plume beyond the landfill. The calculatedhumic/fulvic acid (HA/FA) ratios for the leachate-impacted groundwater are below unity, which is consistentwith that of M32 leachate (Table 4).
With the exception of M34 (δ13CDOC = −38.9‰;discussed in the following section), δ13C of bulk DOCin leachate-impacted groundwater is close to −26‰,typical of C3 type vegetation, and hence shows noindication of secondary fractionation. This is in sharpcontrast with the DOC measured in M32 which showssignificant enrichment in 13C (average of −21.6‰). Thedistribution of 13C between components of the bulk DOC,tabulated in Table 4 and graphed in Figure 5, adds someinsight. On average, the δ13C value of the LMW DOCfractions is close to the bulk value. For most sites, theδ13C value of FA, the major fraction of HS, is about−21‰ 13C-enriched compared to that of total DOC andintermediary between that measured in M32 (–20.3‰)and background FA (M57, −22.1‰). This suggests thatthe FA in these groundwater samples is simply derivedfrom dilution of the leachate source in BG with littlesubsequent modification.
DOC at M34, situated on the southern boundary ofStage 1, follows a dramatically different evolution. Asdiscussed earlier, the δ13C values of all DOC componentsand, in particular, the HA and LMW fractions areconsiderably depleted in 13C compared to other sites.Remarkable at this site is the apparent production ofHA with a much depleted δ13C value. This is notattributable to the DOC degradation products of organicsubstrates from the landfill, which show enrichments inδ13CDOC (i.e., M32 and other groundwater). Productionof such 13C-depleted DOC can only be attributed tomethanotrophic activity where the 13C-depleted CH4
substrate has produced fixed organic carbon with similarlydepleted δ13C values. Degradation of this biomass couldthen yield the 13C DOC measured in this region.
Summary and ConclusionsIn leachate-impacted groundwater, concentrations
and δ13C measured in the major carbon compoundsprovide a useful tool to distinguish attenuation due tobiogeochemical reaction from dilution as a result of
8 H. Mohammadzadeh and I. Clark GROUND WATER NGWA.org
Tab
le4
Dis
trib
utio
nof
the
Tot
alD
OC
into
HA
,FA
,an
dL
MW
DO
CF
ract
ion
and
the
Cor
resp
ondi
ngδ
13C
Val
ues
for
the
Lea
chat
e-Im
pact
edG
roun
dwat
erSa
mpl
es
Tota
lD
OC
Hum
icA
cid
(HA
)F
ulvi
cA
cid
(FA
)L
MW
DO
C
Wel
l#
(mg/
L)1
δ13
C‰
2(m
g/L
)%
ofD
OC
δ13
C‰
(mg/
L)
%of
DO
C�
13C
‰(m
g/L
)%
ofD
OC
�13
C‰
HA
/FA
Ref
eren
ceM
575.
0−2
2.0
3.1
62.2
−22.
01.
631
.4−2
2.2
0.3
6.1
−22.
01.
98L
each
ate-
poll
uted
grou
ndw
ater
M39
-76.
7−2
1.8
1.2
18.5
−21.
54.
466
.1−2
1.2
1.1
15.9
−24.
40.
28M
37-2
3.7
−21.
90.
36.
9−2
9.6
2.7
72.5
−21.
10.
718
.1−2
5.1
0.10
M4-
17.
2−2
2.2
0.5
7.2
−23.
05.
575
.7−2
1.3
1.3
17.5
−25.
30.
10M
3420
.0−3
6.4
6.0
29.9
−54.
911
.155
.3−2
6.7
2.9
14.7
−35.
90.
54M
37-3
57.5
−25.
52.
13.
6−2
4.7
48.8
84.8
−25.
46.
611
.5−2
6.8
0.04
Ave
rage
19.0
−25.
02.
013
.2−3
0.7
14.5
70.9
−23.
12.
515
.5−2
7.5
0.2
Lit
erat
ure
valu
esL
each
ate-
LPS
321
9.1
−25.
928
.212
.9−2
2.9
160.
473
.2−2
6.2
30.5
13.9
−27.
10.
18L
each
ate-
M32
361
25.8
−17.
121
.30.
3−2
8.1
4482
.573
.2−2
0.3
1622
.026
.5−8
.00.
05L
each
ate4
4to
447
to72
—U
npol
lute
dgr
ound
wat
er5
3to
971
to67
1to
32L
each
ate-
pollu
ted
grou
ndw
ater
68
to15
44to
62—
Not
e:T
hera
tioof
hum
ic/f
ulvi
cac
ids
(HA
/FA
)ha
vebe
enca
lcul
ated
usin
gH
Aan
dFA
conc
entr
atio
ns.
(Som
eda
tare
port
edin
the
liter
atur
efo
rle
acha
te-i
mpa
cted
grou
ndw
ater
and
unim
pact
edgr
ound
wat
erar
egi
ven
for
com
pari
son.
)1
Sum
ofH
A,
FA,
and
LM
WD
OC
.2
Wei
ghte
dav
erag
eof
the
δ13
Cva
lues
mea
sure
dfo
rth
eco
mpo
nent
s.3
Moh
amm
adza
deh
and
Cla
rk(2
008)
.4
Nan
nyan
dR
atas
uk(2
002)
.5
Gor
net
al.
(199
6).
6C
hris
tens
enet
al.
(199
8).
NGWA.org H. Mohammadzadeh and I. Clark GROUND WATER 9
advective dispersion. The Trail Road municipal solidwaste landfill site near Ontario, Canada, provides a goodsite to observe a range of reactions that can attenuate highDOC contributions in groundwater from leachate.
At the TRL site, both the shallow and deep aquifershave been impacted by leachate infiltrating from theunlined portions of the landfill (Stages 1 and 2). Althoughthe δ13C of DOC DIC and methane demonstrate impactof landfill leachate, it is not conservative during dilution.
Consumption of DOC via acetate fermentation andoxidation of DOC within the aquifers is documented by:(1) deviation of groundwater samples from mixing lines,drawn for DIC vs. δ13CDIC and DOC vs. δ13CDOC; (2) theabsence of acetate in groundwater; and (3) mass balancecalculations involving net-reacted (lost) DOC (988, 368,and 272 mg/L for the shallow, upper deep, and lower deepaquifers, respectively) and the net gains in DIC (185, 117,and 85 mg/L) for these aquifers.
Methane production by acetoclastic fermentation isreflected by the enrichment of δ13CCH4 originating in the13C-enriched leachate acetate, the absence of acetate inthese groundwater samples, and the associated enrich-ment in δ13CDIC and calcite precipitation. Elsewhere, DICexhibits significant depletion of 13C, indicating contribu-tions from oxidation of DOC and/or CH4.
In contrast, the refractory humic and fulvic com-pounds show no evidence of continued reaction. In theleachate-impacted groundwater, FA is the major fraction(55% to 85% of total DOC content), which is consistentwith the leachate FA at M32 (73.2% of total DOC con-tent of leachate) and contrasts sharply with FA contents ofunimpacted groundwater (38% of total DOC). The 13C ofFA (−21‰) indicates that the FA is simply derived fromdilution of the leachate source (13C of −20.3‰) in BG(13C of −22.1‰) with little subsequent modification.
Some groundwater from the deep aquifer have DOCthat is remarkably depleted in 13C, with values as lowas −42‰. This is not possible to be generated bythe degradation of organic carbon, which produces anenrichment in the residual DOC. These low values areattributed to methanotrophic bacteria that have generateda fixed organic carbon reservoir that retains the depletedδ13C values of the methane substrate.
In summary, the understanding of continued naturalattenuation of leachate DOC in groundwater can begreatly improved through a multicomponent approachthat emphasizes the analysis of 13C in the differentorganic and inorganic carbon species in conjunction withmeasurements of the concentrations of other inorganicand organic compounds. In the case of the TRL,characterization of the landfill leachate and comparisonwith leachate-impacted groundwater show that continuedattenuation of leachate-derived carbon compounds occursvia a series of reactions including acetate fermentation andDOC oxidation. Methanotrophic reactions are important inthe deep aquifer, where isotopically light DOC (δ13C from−30‰ to −42‰) suggests extensive biological fixation ofcarbon from landfill methane.
AcknowledgmentsField assistance was provided by A. Bourbonais
and X. Liu. Assistance with isotope and geochemicalanalysis provided by G. St-Jean, P. Middlestead, W. Abdi,P. Wickham, M. Wilk, and P. Zhang in the isotope andgeochemistry laboratories is gratefully acknowledged. Theauthors gratefully acknowledge reviews by B. Mayer,B. M. Van Breukelen, and three anonymous reviewers.Financial support was provided by NSERC (DiscoveryGrant to I.C.) from the School of Graduate and Post-Doctoral Studies at the University of Ottawa and from theMinistry of Science, Research and Technology of Iran.
Supporting InformationAdditional Supporting Information may be found in
the online version of this article:
A complete data set for the concentrations and isotopevalues of leachate and groundwater from TRL site hasbeen provided as “supporting information,” which isavailable online. The results of field parameters, cationsand anions, and calculated parameters (electron activity[pe], ionic strength [I ], and calcite saturation index[SIcal]), for all groundwater samples (collected fromTRL site in 2003 through 2005), and the results ofisotopic analysis are summarized in Tables S1 and S2,respectively. The main characteristics of the TRL leachatecollected from M32 are summarized in Table S3.
Table S1. Field parameters, cation and anion concen-trations, and calculated parameters (pe, ionic strength, andcalcite saturation index [SIcal]) for groundwater samples.All concentrations and isotopic values in mg/L and ‰VPDB, if not stated
Table S2. Geochemical and isotopic data for thegroundwater samples collected at TRL site. All concen-trations in mg/L and isotopic values in ‰ VPDB (for 13C)and ‰ VSMOW (for 18O and 2H), if not stated
Table S3. Geochemical and isotopic data for source ofcontamination (leachate from M32 located in the northernpart of unlined Stage 1). All isotopic data in ‰ VPDB(for 13C) and ‰ VSMOW (for 18O and 2H)
Please note: Wiley-Blackwell is not responsible forthe content or functionality of any supporting informationsupplied by the authors. Any queries (other than missingmaterial) should be directed to the corresponding authorfor the article.
ReferencesCity of Ottawa. 2002. Trail waste facility landfill operating/
expansion project, EA/EPA Document. Ottawa City,Ontario.
Christensen, J.B., D.L. Jensen, Z. Filip, C. Grøn, and T.H.Christensen. 1998. Characterization of the dissolved organiccarbon in landfill leachate-polluted groundwater. WaterResources 32, no. 1: 125–135.
Desrocher, S., and B.S. Lollar. 1998. Isotope constraints of off-site migration of landfill CH4. Groundwater 36, no. 5:801–809.
10 H. Mohammadzadeh and I. Clark GROUND WATER NGWA.org
Dillon Consulting Limited. 2006. Trail Road and Nepeanlandfill sites monitoring and operating reports. Report toRegional Municipality of Ottawa-Carleton. Ottawa City,Ontario.
El Fadel, M., A.N. Findikakis, and J.O. Leckie. 1997. Envi-ronmental impacts of solid waste landfilling. Journal ofEnvironmental Management 50, no. 1: 1–25.
Fritz, S.J., F.E. Bryan, F.E. Harvey, and D.I. Leap. 1994. AGeochemical and isotopic approach to delineate landfillleachates in an RCRA study. Groundwater 32, no. 5:743–750.
Golder Associates Ltd. 2003. Monitoring and operating reports,Trail Road and Nepean landfills final reports. Reportto Regional Municipality of Ottawa-Carleton. OttawaCity, Ontario.
Gron, C., L. Wassenaar, and M. Krog. 1996. Origin andstructures of groundwater humic substances from threeDanish aqiofers. Environmental International 22, no. 5:519–534.
Hackley, K.C., C.L. Liu, and D.D. Coleman. 1996. Environmen-tal isotope characteristics of landfill leachate and gases.Groundwater 34, no. 5: 827–836.
Hackley, K.C., C.L. Liu, and D. Trainor. 1999. Isotope identi-fication of the source of methane in subsurface sedimentsof an area surrounded by waste disposal facilities. AppliedGeochemistry 14, no. 1: 199–131.
Kerfoot, H.B, J.A. Baker, and D.M. Burt. 2003. The use ofisotopes to identify landfill gas effects on groundwater.Journal of Environmental Monitoring 5: 896–901.
Klass, D.L. 1984. Methane from anaerobic fermentation. Science223, no. 4640: 1021–1028.
Kjeldsen, P., M.A. Barlaz, A.P. Rooker, A. Baun, A. Ledin, andT.H. Christensen. 2002. Present and long-term compositionof MSW landfill leachate: a review. Critical Reviews inEnvironmental Science and Technology 32, no. 4: 297–336.
Kurniawan, T.A., W.H. Lo, and G.Y.S. Chan. 2006.Physico-chemical treatments for removal of recalcitrantcontaminants from landfill leachate. Journal of HazardousMaterials 129, no. 1–3: 80–100.
Liu, C.L., K.C. Hackley, and J. Baker. 1992. Application ofenvironmental isotopes to characterize landfill gases and
leachate. Geological Society of America, abstract withapplication, P. A35.
Lo, I.M.C. 1996. Characteristics and treatment of leachates fromdomestic landfills. Environmental International 22, no. 4:433–442.
Mackay, D.M., P.V. Roberts, and J.A. Cherry. 1985. Transportof organic contaminants in groundwater. EnvironmentalScience Technology 19, no. 5: 384–392.
Mohammadzadeh, H., and I.D. Clark. 2008. Degradation path-ways of dissolved carbon in landfill leachate traced withcompound-specific 13C analysis of DOC. Isotopes in Envi-ronmental and Health Studies 44, no. 3: 267–294.
Mohammadzadeh, H., I.D. Clark, M. Marschner, and G. St-Jean. 2005. Compound specific isotopic analysis (CSIA)of landfill leachate DOC Components. Chemical Geology218, no. 1–2: 3–13.
Nanny, M.A., and N. Ratasuk. 2002. Characterization andcomparison of hydrophobic neutral and hydrophobic aciddissolved organic carbon isolated from three municipallandfill leachates. Water Research 36, no. 6: 1572–1584.
North, J.C., R.D. Frew, and R. Van Hale. 2006. Can stableisotopes be used to monitor landfill leachate impact onsurface waters. Journal of Geochemical Exploration 88,no. 1–3: 49–53.
Rovers, F.A., and G.J. Farquhar. 1973. Infiltration and land-fill behavior. Journal of the Environmental EngineeringDivision, American Society of Civil Engineers 99, no. 5:671–690.
St-Jean, G. 2003. Automated quantitative and isotope (13C) anal-ysis of dissolved inorganic carbon and dissolved organiccarbon in continuous-flow using a total organic carbon anal-yser. Rapid Communication in Mass Spectrometry 17, no.5: 419–428.
Van Breukelen, B.M., W.F.M. Roling, J. Groen, J. Griffioen,and H.W. Van Verseveld. 2003. Biogeochemistry andisotope geochemistry of a landfill leachate plume. Journalof Contaminant Hyrdology 65, no. 3–4: 245–268.
Whiticar, M.J., E. Faber, and M. Schoell. 1986. Biogenicmethane formation in marine and freshwater environments:CO2 reduction vs. acetate fermentation-isotope evidence.Geochemica et Cosmochemica Acta 50, no. 5: 693–709.
NGWA.org H. Mohammadzadeh and I. Clark GROUND WATER 11