Bio-optical properties and primary production of Lake Michigan: Insights from 13-years of SeaWiFS...
8
Bio-optical properties and primary production of Lake Michigan: Insights from 13-years of SeaWiFS imagery Foad Yousef a,b, ⁎, W. Charles Kerfoot a,b , Robert Shuchman c , Gary Fahnenstiel a,b,c,d a Great Lakes Research Center, Michigan Technological University, Houghton, MI, USA b Department of Biological Sciences, Michigan Technological University, Houghton, MI, USA c Michigan Tech Research Institute, Ann Arbor, MI, USA d U-M Water Center, Graham Institute of Sustainability, Univ. of Michigan, Ann Arbor, MI, USA abstract article info Article history: Received 27 June 2013 Received in revised form 28 January 2014 Accepted 1 February 2014 Available online xxxx Communicated by Barry Lesht Keywords: Remote sensing SeaWiFS Laurentian Great Lakes Primary production Quagga mussels Dreissenid mussels PAR Chlorophyll a Thirteen years of SeaWiFS data (1998–2010) from the early spring isothermal period (March–April) were used to determine trends of water attenuation coefficient (K dPAR ), chlorophyll a (Chl a), Photosynthetic Available Radia- tion (PAR), and modeled primary production in southern Lake Michigan. Surface PAR values remained un- changed between 1998 and 2010, but there was an 18–22% drop in K dPAR during the March/April isothermal period as water clarity increased. This transparency increase was accompanied by a 41–53% decline in Chl a con- centration (μg·L -1 ) and a 42–46% decline in modeled primary production (Great Lakes Primary Production Model). These changes were most pronounced in 2001–2003 which coincided with the period of initial coloni- zation of the quagga mussels. Statistically significant spatial differences were noted in Chl a (μg·L -1 ) concentra- tions between mid-depth (z = 30–90 m deep), and offshore (z N 90 m deep) waters. Chl a concentrations in the mid-depth region (30–90 m) decreased at a higher rate compared to offshore waters (N 90 m) likely as a result of filtration activities of quagga mussel. © 2014 International Association for Great Lakes Research. Published by Elsevier B.V. All rights reserved. Introduction Many non-indigenous species have become established in Lake Michigan (Mills et al., 1993; Vanderploeg et al., 2002). Among the most significant species, zebra mussels (Dreissena polymorpha) and quagga mussels (Dreissena rostriformis bugensis) found their way from Lake Huron into northern Lake Michigan in the 1990s and early 2000s (Nalepa et al., 2010). Zebra mussels first colonized the shallow regions (rocky substrates), and then the quagga mussel populated the deep, soft-sediment profundal regions and finally replaced zebra mussel throughout the lake (Nalepa et al., 2010). At the same time, field sam- pling in the southern basin documented major changes in water trans- parency and Chl a concentrations (from 74–85% transparency in 2001 to 94–96% in 2008; from 1.1–2.6 Chl a μgL -1 in 2001 to 0.4–1.5 μgL -1 by 2008; Vanderploeg et al., 2010, Kerfoot et al., 2010). Fahnenstiel et al. (2010), using traditional field measurements, reported a 66% decline in Chl a and an average 50% decline in primary production during the spring isothermal period associated with the establishment of large quagga mussel populations in southern Lake Michigan basin. The southern Lake Michigan basin is unique in its dominant currents and spatial distribution of spring blooms. Late winter to early spring algal blooms in offshore waters of Lake Michigan occur in March and April dur- ing the isothermal period (Brooks and Torke, 1977; Kerfoot et al., 2008, 2010). In the absence of winter ice cover, a southern Lake Michigan counter-clockwise gyre forms during strong winter storms contributing to these blooms (Chen et al., 2004). The strong counter-clockwise cur- rents capture phosphorous-rich river discharges and re-suspended near- shore sediments, transporting the nutrient-rich waters into offshore regions. This process eventually forms a chlorophyll a (Chl a) ring, which resembles a “doughnut” with higher Chl a associated with the ring and lower values inside and outside the ring. This doughnut feature occurs in the mid-depth region (z = 30–90 m) of Lake Michigan (Kerfoot et al., 2008, 2010). The horizontal and vertical transfers lasts until mid- May or early-June, when thermal bar formation and summer stratifica- tion limit spatial transport. This is the same region where maximal mussel's density has been observed (Nalepa et al., 2010). Journal of Great Lakes Research xxx (2014) xxx–xxx ⁎ Corresponding author at: Great Lakes Research Center, Michigan Technological University, Houghton, MI, USA. E-mail addresses: [email protected] (F. Yousef), [email protected] (W. Charles Kerfoot), [email protected] (R. Shuchman), [email protected] (G. Fahnenstiel). JGLR-00698; No. of pages: 8; 4C: 4, 6 http://dx.doi.org/10.1016/j.jglr.2014.02.018 0380-1330/© 2014 International Association for Great Lakes Research. Published by Elsevier B.V. All rights reserved. Contents lists available at ScienceDirect Journal of Great Lakes Research journal homepage: www.elsevier.com/locate/jglr Please cite this article as: Yousef, F., et al., Bio-optical properties and primary production of Lake Michigan: Insights from 13-years of SeaWiFS imagery, J Great Lakes Res (2014), http://dx.doi.org/10.1016/j.jglr.2014.02.018
Transcript of Bio-optical properties and primary production of Lake Michigan: Insights from 13-years of SeaWiFS...
Journal of Great Lakes Research xxx (2014) xxx–xxx
JGLR-00698; No. of pages: 8; 4C: 4, 6
Contents lists available at ScienceDirect
Journal of Great Lakes Research
j ourna l homepage: www.e lsev ie r .com/ locate / jg l r
Bio-optical properties and primary production of Lake Michigan: Insights from13-years of SeaWiFS imagery
Foad Yousef a,b,⁎, W. Charles Kerfoot a,b, Robert Shuchman c, Gary Fahnenstiel a,b,c,d
a Great Lakes Research Center, Michigan Technological University, Houghton, MI, USAb Department of Biological Sciences, Michigan Technological University, Houghton, MI, USAc Michigan Tech Research Institute, Ann Arbor, MI, USAd U-M Water Center, Graham Institute of Sustainability, Univ. of Michigan, Ann Arbor, MI, USA
⁎ Corresponding author at: Great Lakes Research CeUniversity, Houghton, MI, USA.
E-mail addresses: [email protected] (F. Yousef), wkerfo(W. Charles Kerfoot), [email protected] (R. Shuchman)(G. Fahnenstiel).
http://dx.doi.org/10.1016/j.jglr.2014.02.0180380-1330/© 2014 International Association for Great Lak
Please cite this article as: Yousef, F., et al., Biimagery, J Great Lakes Res (2014), http://dx
a b s t r a c t
a r t i c l e i n f oArticle history:Received 27 June 2013Received in revised form 28 January 2014Accepted 1 February 2014Available online xxxx
Communicated by Barry Lesht
Keywords:Remote sensingSeaWiFSLaurentian Great LakesPrimary productionQuagga musselsDreissenid musselsPARChlorophyll a
Thirteen years of SeaWiFS data (1998–2010) from the early spring isothermal period (March–April)were used todetermine trends of water attenuation coefficient (KdPAR), chlorophyll a (Chl a), Photosynthetic Available Radia-tion (PAR), and modeled primary production in southern Lake Michigan. Surface PAR values remained un-changed between 1998 and 2010, but there was an 18–22% drop in KdPAR during the March/April isothermalperiod as water clarity increased. This transparency increase was accompanied by a 41–53% decline in Chl a con-centration (μg · L−1) and a 42–46% decline in modeled primary production (Great Lakes Primary ProductionModel). These changes were most pronounced in 2001–2003 which coincided with the period of initial coloni-zation of the quaggamussels. Statistically significant spatial differenceswere noted in Chl a (μg · L−1) concentra-tions between mid-depth (z= 30–90m deep), and offshore (z N 90m deep) waters. Chl a concentrations in themid-depth region (30–90m) decreased at a higher rate compared to offshorewaters (N90m) likely as a result offiltration activities of quagga mussel.
© 2014 International Association for Great Lakes Research. Published by Elsevier B.V. All rights reserved.
Introduction
Many non-indigenous species have become established in LakeMichigan (Mills et al., 1993; Vanderploeg et al., 2002). Among themost significant species, zebra mussels (Dreissena polymorpha) andquagga mussels (Dreissena rostriformis bugensis) found their way fromLake Huron into northern Lake Michigan in the 1990s and early 2000s(Nalepa et al., 2010). Zebra mussels first colonized the shallow regions(rocky substrates), and then the quagga mussel populated the deep,soft-sediment profundal regions and finally replaced zebra musselthroughout the lake (Nalepa et al., 2010). At the same time, field sam-pling in the southern basin documented major changes in water trans-parency and Chl a concentrations (from74–85% transparency in 2001 to94–96% in 2008; from 1.1–2.6 Chl a μg L−1 in 2001 to 0.4–1.5 μg L−1 by2008; Vanderploeg et al., 2010, Kerfoot et al., 2010). Fahnenstiel et al.
nter, Michigan Technological
[email protected], [email protected]
es Research. Published by Elsevier B
o-optical properties and prim.doi.org/10.1016/j.jglr.2014.02
(2010), using traditional field measurements, reported a 66% declinein Chl a and an average 50% decline in primary production during thespring isothermal period associated with the establishment of largequagga mussel populations in southern Lake Michigan basin.
The southern Lake Michigan basin is unique in its dominant currentsand spatial distribution of spring blooms. Latewinter to early spring algalblooms in offshorewaters of LakeMichigan occur inMarch andApril dur-ing the isothermal period (Brooks and Torke, 1977; Kerfoot et al., 2008,2010). In the absence of winter ice cover, a southern Lake Michigancounter-clockwise gyre forms during strong winter storms contributingto these blooms (Chen et al., 2004). The strong counter-clockwise cur-rents capture phosphorous-rich river discharges and re-suspended near-shore sediments, transporting the nutrient-rich waters into offshoreregions. This process eventually forms a chlorophyll a (Chl a) ring,which resembles a “doughnut” with higher Chl a associated with thering and lower values inside and outside the ring. This doughnut featureoccurs in themid-depth region (z= 30–90m) of LakeMichigan (Kerfootet al., 2008, 2010). The horizontal and vertical transfers lasts until mid-May or early-June, when thermal bar formation and summer stratifica-tion limit spatial transport. This is the same region where maximalmussel's density has been observed (Nalepa et al., 2010).
.V. All rights reserved.
ary production of Lake Michigan: Insights from 13-years of SeaWiFS.018
2 F. Yousef et al. / Journal of Great Lakes Research xxx (2014) xxx–xxx
The suggestion that quagga mussels were responsible for the recentdeclines in Chl a and primary productionwas based on the temporal co-herence between the observed declines and establishment of largemussel populations and comparison of mussel filtering rates and phyto-plankton growth rates (Fahnenstiel et al., 2010). However, the use ofsatellite remote sensing imagery offers much greater temporal and spa-tial resolutions and can provide a continuous record of changes andtherefore further insights into the controlling mechanisms.
In this paper, we focus on the southern basin of Lake Michigan anduse remote sensing data to examine both temporal and spatial trendsin Chl a concentration, surface PAR, and KdPAR during the spring bloomperiod (March andApril) in order to evaluate the role of quaggamusselsin causing recent changes. If mussels are responsible for the observedchanges in Chl a and primary production in southern Lake Michigan,mussels should have their greatest effect (on water quality) wherethey are most abundant; in 30–90 m depth region where the majorityof the spring production takes place. SeaWiFS remote sensing imageryoffered the temporal and spatial resolutions needed to test thishypothesis.
Methods
To characterize the winter/spring bloom SeaWiFS satellite imagesfromMarch and April for the 1998 through 2010 period were analyzed.SeaWiFS started itsmission in 1997 and produced data throughDecem-ber 2010. SeaWiFS data were downloaded from NASA's Ocean Colorwebsite (http://oceancolor.gsfc.nasa.gov). Level1 (L1) and level2 (L2)images were used for our analysis with ~1 km pixel resolution for thefinal products. SeaDAS6.2 softwarewas used to process andmap the ac-quired data to UTM (zone 16 N) projection. Using l2_CLDICE L2 flag,scenes with over 20% cloud contamination were removed from thedata set. To produce each monthly average image, all the availabledaily scenes within eachmonth were averaged. Subsequently, the aver-age value of the entire scene was calculated to produce average lake-wide estimate of the specific parameter (e.g. Chl a, KdPAR, etc.).
Three different satellite-derived products were used in our analysis;Chl a, PAR, and KdPAR. Chl a estimates were the product of NASA's OceanColor (OC) basic algorithm, OC4v4 (O'Reilly et al., 2000). This band-ratioalgorithm has proven to produce consistent estimates of Chl a for LakeMichigan, especially in mid-depth and offshore waters (Kerfoot et al.,2010, Lesht et al., 2013). SeaWiFS daily surface PAR data are producedusing the Frouin et al. (2003) algorithmwhich uses plane-parallel theo-ry to decouple the effects of clouds and clear atmosphere. The water at-tenuation coefficient at 490 nm wavelength, or Kd490, can also bedetermined fromSeaWiFS imagery. It is appropriate tonote that SeaDASKd490 algorithm is based on the assumption that Chl a is the only atten-uating optical component (not i.e. suspended material or CDOM); andtherefore, it is inversely related to the SeaDAS Chl a values. The Morelet al. (2007) algorithmwas used to convert Kd490 to KdPAR in order to es-timate PAR attenuation coefficient in thewater column. This conversionwas aimed at ensuring that the light attenuation coefficient is represen-tative of the entire PAR spectrum (400–700 nm) and could be used asinput to primary production model.
The Great Lakes Primary ProductionModel (GLPPM)was used to es-timate areal integrated primary production (Shuchman et al., 2013) foreach image. Input for the GLPPM included the following parameters: 1)hourly surface solar radiation, 2) depth-varying chlorophyll measure-ments, 3) depth-varying P-E parameters, and 4) KdPAR. The model out-puts integrated daily production (mg Cm−2 day−1) over the entirewater column.
Hourly solar radiation values, provided by the National Solar Radia-tion Data Base (NSRDB, http://rredc.nrel.gov/solar/old_data/nsrdb/,2012) were used (units ofWattm−2 h−1). Watt m−2 h−1 was convert-ed to μmol m−2 s−1 using Planck's Law. NSRDB provides hourly as wellas monthly average measurements for solar radiation. Four stationswere selected along the eastern and western boundaries of Lake
Please cite this article as: Yousef, F., et al., Bio-optical properties and primimagery, J Great Lakes Res (2014), http://dx.doi.org/10.1016/j.jglr.2014.02
Michigan, and surface PAR estimates were averaged in order to accountfor possible spatial variation in solar radiation (Muskegon county Air-port, MI; Benton Harbor/Ross, MI; Milwaukee Mitchell Intl. Airport,WI; Chicago/Waukegan, IL).
Chlorophyll a concentrations were assumed to be uniform withdepth during the study period. At this time of the year, the watercolumn is usually isothermal and well mixed (March and April;Fahnenstiel et al., 2010; Kerfoot et al., 2008, 2010), thus our assumptionof uniform Chl a concentration with depth is reasonable. Mean P-E pa-rameters were taken from Fahnenstiel et al. (2010). All estimates forKdPAR, Chl a, and primary production were averaged for the entiresouthern Lake Michigan basin. Finally, the average daily primary pro-duction estimates for March and April were regressed against time.
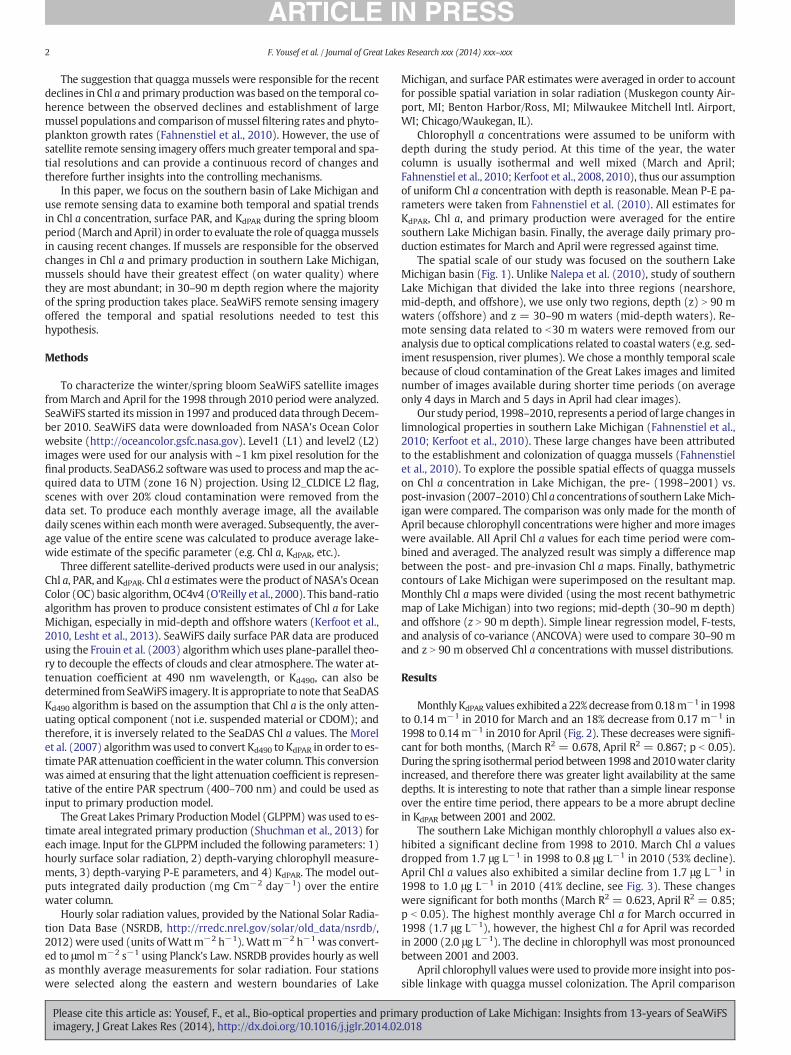
The spatial scale of our study was focused on the southern LakeMichigan basin (Fig. 1). Unlike Nalepa et al. (2010), study of southernLake Michigan that divided the lake into three regions (nearshore,mid-depth, and offshore), we use only two regions, depth (z) N 90 mwaters (offshore) and z = 30–90 m waters (mid-depth waters). Re-mote sensing data related to b30 m waters were removed from ouranalysis due to optical complications related to coastal waters (e.g. sed-iment resuspension, river plumes). We chose a monthly temporal scalebecause of cloud contamination of the Great Lakes images and limitednumber of images available during shorter time periods (on averageonly 4 days in March and 5 days in April had clear images).
Our study period, 1998–2010, represents a period of large changes inlimnological properties in southern Lake Michigan (Fahnenstiel et al.,2010; Kerfoot et al., 2010). These large changes have been attributedto the establishment and colonization of quagga mussels (Fahnenstielet al., 2010). To explore the possible spatial effects of quagga musselson Chl a concentration in Lake Michigan, the pre- (1998–2001) vs.post-invasion (2007–2010) Chl a concentrations of southern LakeMich-igan were compared. The comparison was only made for the month ofApril because chlorophyll concentrations were higher andmore imageswere available. All April Chl a values for each time period were com-bined and averaged. The analyzed result was simply a difference mapbetween the post- and pre-invasion Chl a maps. Finally, bathymetriccontours of Lake Michigan were superimposed on the resultant map.Monthly Chl a maps were divided (using the most recent bathymetricmap of Lake Michigan) into two regions; mid-depth (30–90 m depth)and offshore (z N 90 m depth). Simple linear regression model, F-tests,and analysis of co-variance (ANCOVA) were used to compare 30–90 mand z N 90 m observed Chl a concentrations with mussel distributions.
Results
Monthly KdPAR values exhibited a 22%decrease from0.18m−1 in 1998to 0.14 m−1 in 2010 for March and an 18% decrease from 0.17 m−1 in1998 to 0.14 m−1 in 2010 for April (Fig. 2). These decreases were signifi-cant for both months, (March R2 = 0.678, April R2 = 0.867; p b 0.05).During the spring isothermal period between1998 and2010water clarityincreased, and therefore there was greater light availability at the samedepths. It is interesting to note that rather than a simple linear responseover the entire time period, there appears to be a more abrupt declinein KdPAR between 2001 and 2002.
The southern Lake Michigan monthly chlorophyll a values also ex-hibited a significant decline from 1998 to 2010. March Chl a valuesdropped from 1.7 μg L−1 in 1998 to 0.8 μg L−1 in 2010 (53% decline).April Chl a values also exhibited a similar decline from 1.7 μg L−1 in1998 to 1.0 μg L−1 in 2010 (41% decline, see Fig. 3). These changeswere significant for both months (March R2 = 0.623, April R2 = 0.85;p b 0.05). The highest monthly average Chl a for March occurred in1998 (1.7 μg L−1), however, the highest Chl a for April was recordedin 2000 (2.0 μg L−1). The decline in chlorophyll was most pronouncedbetween 2001 and 2003.
April chlorophyll valueswere used to providemore insight into pos-sible linkage with quagga mussel colonization. The April comparison
ary production of Lake Michigan: Insights from 13-years of SeaWiFS.018
Fig. 1.Map of study area, the southern Lake Michigan basin.
3F. Yousef et al. / Journal of Great Lakes Research xxx (2014) xxx–xxx
was used to identify spatial differences in April Chl a values between thepre-invasion and post-invasion periods (1998–2001 vs. 2007–2010).Compared to offshore waters, a greater decrease in Chl a occurred inmid-depth waters (30–90 m) and the values converged to values
Fig. 2. Monthly average water-column, PAR attenuation coefficient, KdPAR (m−1), forsouthern LakeMichigan between 1998 and 2010. Open circles: March; solid circles: April.
Please cite this article as: Yousef, F., et al., Bio-optical properties and primimagery, J Great Lakes Res (2014), http://dx.doi.org/10.1016/j.jglr.2014.02
similar to offshore. A 0.2 μg L−1 decrease was observed between 1998and 2010 in offshorewaters (the light blue disk is the center of southernLake Michigan, see Fig. 4) and a 0.5 μg L−1 average decrease for mid-depth waters (the dark blue surrounding band); however, there were
Fig. 3.Monthly average chlorophyll a values (μg L−1) for southern LakeMichiganbasin be-tween 1998 and 2010. Open circles: March; solid circles: April.
ary production of Lake Michigan: Insights from 13-years of SeaWiFS.018
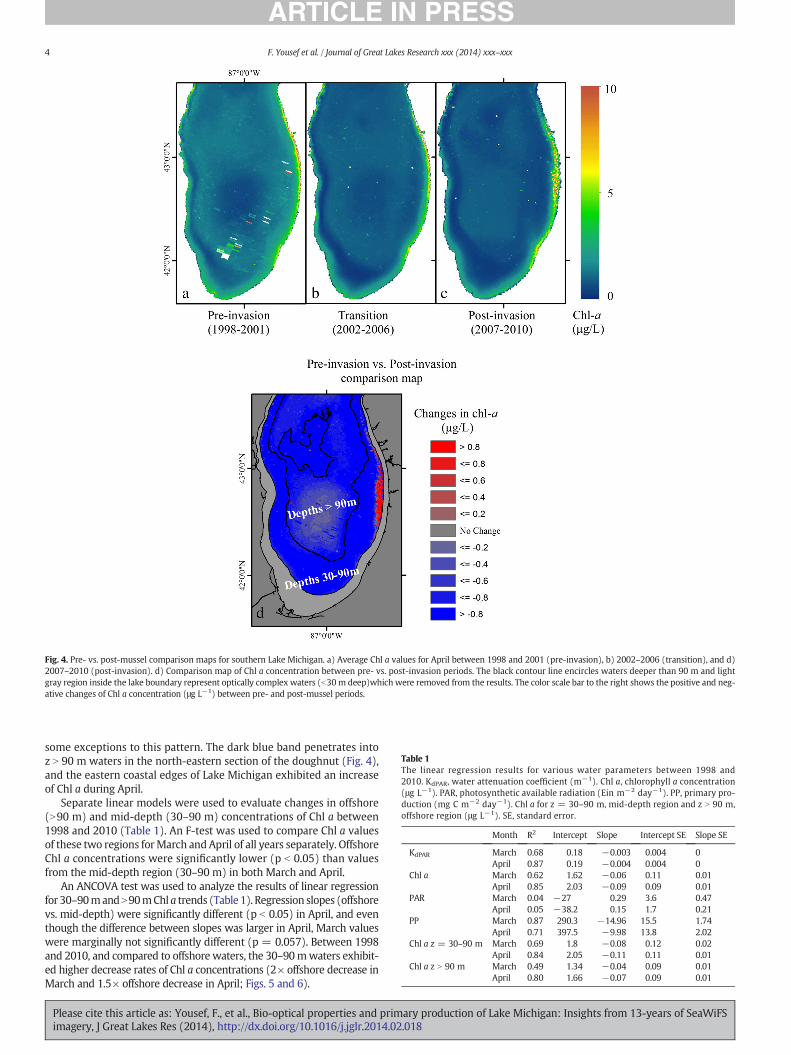
Fig. 4. Pre- vs. post-mussel comparison maps for southern Lake Michigan. a) Average Chl a values for April between 1998 and 2001 (pre-invasion), b) 2002–2006 (transition), and d)2007–2010 (post-invasion). d) Comparison map of Chl a concentration between pre- vs. post-invasion periods. The black contour line encircles waters deeper than 90 m and lightgray region inside the lake boundary represent optically complex waters (b30m deep)whichwere removed from the results. The color scale bar to the right shows the positive and neg-ative changes of Chl a concentration (μg L−1) between pre- and post-mussel periods.
Table 1The linear regression results for various water parameters between 1998 and2010. KdPAR, water attenuation coefficient (m−1). Chl a, chlorophyll a concentration(μg L−1). PAR, photosynthetic available radiation (Ein m−2 day−1). PP, primary pro-duction (mg C m−2 day−1). Chl a for z = 30–90 m, mid-depth region and z N 90 m,offshore region (μg L−1). SE, standard error.
Month R2 Intercept Slope Intercept SE Slope SE
KdPAR March 0.68 0.18 −0.003 0.004 0April 0.87 0.19 −0.004 0.004 0
Chl a March 0.62 1.62 −0.06 0.11 0.01April 0.85 2.03 −0.09 0.09 0.01
PAR March 0.04 −27 0.29 3.6 0.47April 0.05 −38.2 0.15 1.7 0.21
PP March 0.87 290.3 −14.96 15.5 1.74April 0.71 397.5 −9.98 13.8 2.02
Chl a z = 30–90 m March 0.69 1.8 −0.08 0.12 0.02April 0.84 2.05 −0.11 0.11 0.01
Chl a z N 90 m March 0.49 1.34 −0.04 0.09 0.01April 0.80 1.66 −0.07 0.09 0.01
4 F. Yousef et al. / Journal of Great Lakes Research xxx (2014) xxx–xxx
some exceptions to this pattern. The dark blue band penetrates intoz N 90 m waters in the north-eastern section of the doughnut (Fig. 4),and the eastern coastal edges of Lake Michigan exhibited an increaseof Chl a during April.
Separate linear models were used to evaluate changes in offshore(N90 m) and mid-depth (30–90 m) concentrations of Chl a between1998 and 2010 (Table 1). An F-test was used to compare Chl a valuesof these two regions forMarch andApril of all years separately. OffshoreChl a concentrations were significantly lower (p b 0.05) than valuesfrom the mid-depth region (30–90 m) in both March and April.
An ANCOVA test was used to analyze the results of linear regressionfor 30–90mandN90mChl a trends (Table 1). Regression slopes (offshorevs. mid-depth) were significantly different (p b 0.05) in April, and eventhough the difference between slopes was larger in April, March valueswere marginally not significantly different (p = 0.057). Between 1998and 2010, and compared to offshore waters, the 30–90mwaters exhibit-ed higher decrease rates of Chl a concentrations (2× offshore decrease inMarch and 1.5× offshore decrease in April; Figs. 5 and 6).
Please cite this article as: Yousef, F., et al., Bio-optical properties and primary production of Lake Michigan: Insights from 13-years of SeaWiFSimagery, J Great Lakes Res (2014), http://dx.doi.org/10.1016/j.jglr.2014.02.018
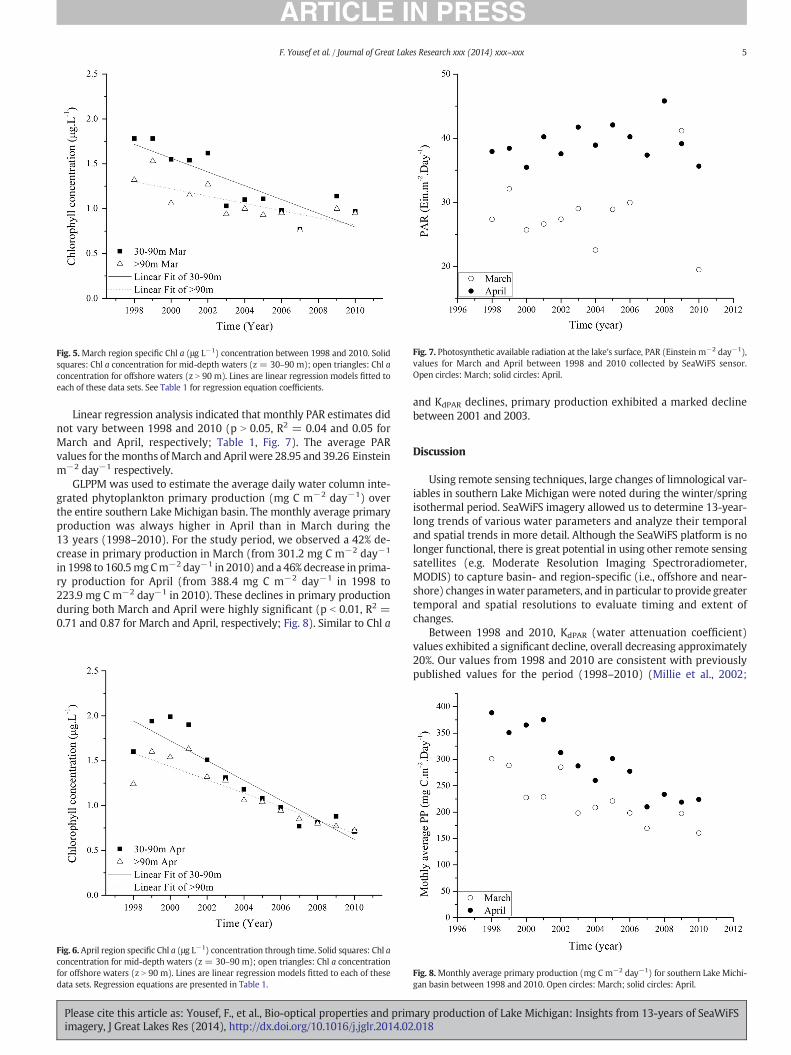
Fig. 5.March region specific Chl a (μg L−1) concentration between 1998 and 2010. Solidsquares: Chl a concentration for mid-depth waters (z = 30–90 m); open triangles: Chl aconcentration for offshore waters (z N 90 m). Lines are linear regression models fitted toeach of these data sets. See Table 1 for regression equation coefficients.
Fig. 7. Photosynthetic available radiation at the lake's surface, PAR (Einstein m−2 day−1),values for March and April between 1998 and 2010 collected by SeaWiFS sensor.Open circles: March; solid circles: April.
5F. Yousef et al. / Journal of Great Lakes Research xxx (2014) xxx–xxx
Linear regression analysis indicated that monthly PAR estimates didnot vary between 1998 and 2010 (p N 0.05, R2 = 0.04 and 0.05 forMarch and April, respectively; Table 1, Fig. 7). The average PARvalues for themonths ofMarch and April were 28.95 and 39.26 Einsteinm−2 day−1 respectively.
GLPPM was used to estimate the average daily water column inte-grated phytoplankton primary production (mg C m−2 day−1) overthe entire southern Lake Michigan basin. The monthly average primaryproduction was always higher in April than in March during the13 years (1998–2010). For the study period, we observed a 42% de-crease in primary production in March (from 301.2 mg C m−2 day−1
in 1998 to 160.5mg Cm−2 day−1 in 2010) and a 46% decrease in prima-ry production for April (from 388.4 mg C m−2 day−1 in 1998 to223.9 mg C m−2 day−1 in 2010). These declines in primary productionduring both March and April were highly significant (p b 0.01, R2 =0.71 and 0.87 for March and April, respectively; Fig. 8). Similar to Chl a
Fig. 6. April region specific Chl a (μg L−1) concentration through time. Solid squares: Chl aconcentration for mid-depth waters (z = 30–90 m); open triangles: Chl a concentrationfor offshore waters (z N 90 m). Lines are linear regression models fitted to each of thesedata sets. Regression equations are presented in Table 1.
Please cite this article as: Yousef, F., et al., Bio-optical properties and primimagery, J Great Lakes Res (2014), http://dx.doi.org/10.1016/j.jglr.2014.02
and KdPAR declines, primary production exhibited a marked declinebetween 2001 and 2003.
Discussion
Using remote sensing techniques, large changes of limnological var-iables in southern Lake Michigan were noted during the winter/springisothermal period. SeaWiFS imagery allowed us to determine 13-year-long trends of various water parameters and analyze their temporaland spatial trends in more detail. Although the SeaWiFS platform is nolonger functional, there is great potential in using other remote sensingsatellites (e.g. Moderate Resolution Imaging Spectroradiometer,MODIS) to capture basin- and region-specific (i.e., offshore and near-shore) changes inwater parameters, and in particular to provide greatertemporal and spatial resolutions to evaluate timing and extent ofchanges.
Between 1998 and 2010, KdPAR (water attenuation coefficient)values exhibited a significant decline, overall decreasing approximately20%. Our values from 1998 and 2010 are consistent with previouslypublished values for the period (1998–2010) (Millie et al., 2002;
Fig. 8.Monthly average primary production (mg C m−2 day−1) for southern Lake Michi-gan basin between 1998 and 2010. Open circles: March; solid circles: April.
ary production of Lake Michigan: Insights from 13-years of SeaWiFS.018
6 F. Yousef et al. / Journal of Great Lakes Research xxx (2014) xxx–xxx
Shuchman et al., 2013) and thus provide support for the documentedtrends. For 1998 Millie et al. (2002) reported KdPAR values of 0.21 m−1
for southern Lake Michigan which is similar to our value of 0.18 m−1.Similarly our mean KdPAR for 2010 (0.14 m−1) is similar to Satlanticmeasurements of KdPAR (0.13 m−1) from Shuchman et al. (2013). Thelower KdPAR values in the last few years can be translated as morelight available for phytoplankton and less light limitation (Fahnenstielet al., 2000). This increase in light is especially important during thewinter/spring period as phytoplankton populations can be light limited(Fahnenstiel et al., 2000), thus the increase in light may result in moreprimary production (Lang and Fahnenstiel, 1996).
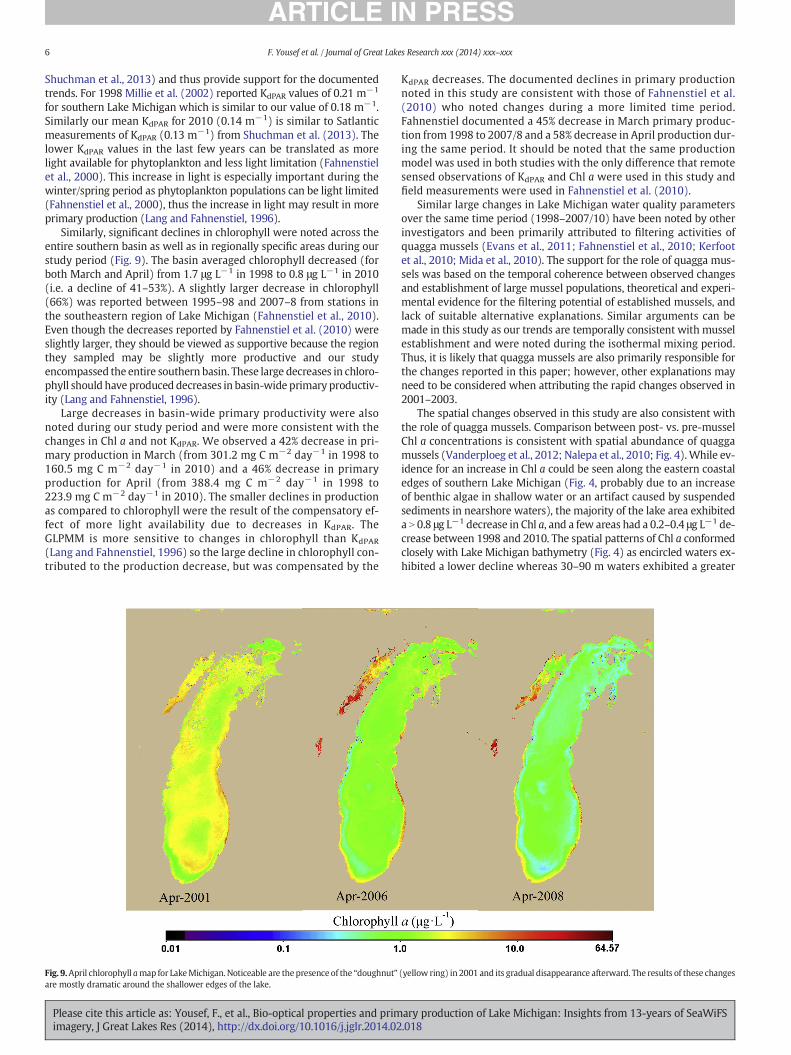
Similarly, significant declines in chlorophyll were noted across theentire southern basin as well as in regionally specific areas during ourstudy period (Fig. 9). The basin averaged chlorophyll decreased (forboth March and April) from 1.7 μg L−1 in 1998 to 0.8 μg L−1 in 2010(i.e. a decline of 41–53%). A slightly larger decrease in chlorophyll(66%) was reported between 1995–98 and 2007–8 from stations inthe southeastern region of Lake Michigan (Fahnenstiel et al., 2010).Even though the decreases reported by Fahnenstiel et al. (2010) wereslightly larger, they should be viewed as supportive because the regionthey sampled may be slightly more productive and our studyencompassed the entire southern basin. These large decreases in chloro-phyll should have produced decreases in basin-wide primary productiv-ity (Lang and Fahnenstiel, 1996).
Large decreases in basin-wide primary productivity were alsonoted during our study period and were more consistent with thechanges in Chl a and not KdPAR. We observed a 42% decrease in pri-mary production in March (from 301.2 mg C m−2 day−1 in 1998 to160.5 mg C m−2 day−1 in 2010) and a 46% decrease in primaryproduction for April (from 388.4 mg C m−2 day−1 in 1998 to223.9 mg C m−2 day−1 in 2010). The smaller declines in productionas compared to chlorophyll were the result of the compensatory ef-fect of more light availability due to decreases in KdPAR. TheGLPMM is more sensitive to changes in chlorophyll than KdPAR
(Lang and Fahnenstiel, 1996) so the large decline in chlorophyll con-tributed to the production decrease, but was compensated by the
Fig. 9.April chlorophyll amap for LakeMichigan. Noticeable are thepresence of the “doughnut”are mostly dramatic around the shallower edges of the lake.
Please cite this article as: Yousef, F., et al., Bio-optical properties and primimagery, J Great Lakes Res (2014), http://dx.doi.org/10.1016/j.jglr.2014.02
KdPAR decreases. The documented declines in primary productionnoted in this study are consistent with those of Fahnenstiel et al.(2010) who noted changes during a more limited time period.Fahnenstiel documented a 45% decrease in March primary produc-tion from 1998 to 2007/8 and a 58% decrease in April production dur-ing the same period. It should be noted that the same productionmodel was used in both studies with the only difference that remotesensed observations of KdPAR and Chl a were used in this study andfield measurements were used in Fahnenstiel et al. (2010).
Similar large changes in Lake Michigan water quality parametersover the same time period (1998–2007/10) have been noted by otherinvestigators and been primarily attributed to filtering activities ofquagga mussels (Evans et al., 2011; Fahnenstiel et al., 2010; Kerfootet al., 2010; Mida et al., 2010). The support for the role of quagga mus-sels was based on the temporal coherence between observed changesand establishment of large mussel populations, theoretical and experi-mental evidence for the filtering potential of established mussels, andlack of suitable alternative explanations. Similar arguments can bemade in this study as our trends are temporally consistent with musselestablishment and were noted during the isothermal mixing period.Thus, it is likely that quagga mussels are also primarily responsible forthe changes reported in this paper; however, other explanations mayneed to be considered when attributing the rapid changes observed in2001–2003.
The spatial changes observed in this study are also consistent withthe role of quagga mussels. Comparison between post- vs. pre-musselChl a concentrations is consistent with spatial abundance of quaggamussels (Vanderploeg et al., 2012; Nalepa et al., 2010; Fig. 4).While ev-idence for an increase in Chl a could be seen along the eastern coastaledges of southern Lake Michigan (Fig. 4, probably due to an increaseof benthic algae in shallow water or an artifact caused by suspendedsediments in nearshore waters), the majority of the lake area exhibiteda N 0.8 μg L−1 decrease in Chl a, and a few areas had a 0.2–0.4 μg L−1 de-crease between 1998 and 2010. The spatial patterns of Chl a conformedclosely with Lake Michigan bathymetry (Fig. 4) as encircled waters ex-hibited a lower decline whereas 30–90 m waters exhibited a greater
(yellow ring) in 2001 and its gradual disappearance afterward. The results of these changes
ary production of Lake Michigan: Insights from 13-years of SeaWiFS.018
7F. Yousef et al. / Journal of Great Lakes Research xxx (2014) xxx–xxx
decline. The results of the F-test demonstrate that the two regions hadstatistical differences in their average Chl a concentrations, implyinglinks to the high density presence of quagga mussels in 30–90 mregions.
Despite strong evidence for the role of mussels, the role of phospho-rus loading also needs to be considered. Phosphorus is the limiting nu-trient in Lake Michigan (Schelske and Stoermer, 1972) and musselfiltration affects phosphorus availability as well (Hecky et al., 2004).However, the trend in total phosphorus loading to Lake Michigan overthe past 20–30 years is unclear (Mida et al., 2010; Robertsonand Saad, 2011). Mida et al.(2010) documented a gradual decrease(ca. ~25–30%) over the past 30 years whereas Robertson and Saad(2011) suggested that phosphorus loading has not decreased from1983 to 2002. Thus, it is unlikely that phosphorus loading decreaseswere responsible for the rapid declines in chlorophyll, KdPAR, and prima-ry production noted from 1998 through 2010. Even if we assume thattotal phosphorus loadings have gradually decreased during the past30 years as noted in Mida et al. (2010), there is evidence to suggestthat the recent changes were not due to gradual decreases in phospho-rus loading.
If the gradual decrease in phosphorus loading was responsible forthese dramatic changes,wewould have expected to see similar declinesin summer Chl a concentration and primary production (Pauer et al.,2007). Unlike spring, summer Chl a and primary production valueshave changed very little or not at all after quagga mussel invasion(Fahnenstiel et al., 2010, Mida et al., 2010; Pothoven and Fahnenstiel,2013). In addition, the starting point of the gradual decline in phospho-rus goes back to 1976. During the period before quagga mussel arrival(1980s–90s), total phosphorous concentration declined but Chl a con-centration did not decrease (Johengen et al., 1994; Scavia et al., 1986).Thus the link between phosphorous and Chl a concentration is not al-ways clear and it is hard to propose a mechanism for rapid decrease inChl a concentration as a result of gradual phosphorous load reductions.Also Mida et al. (2010) did not find any correlation between the phos-phorous concentrations and phosphorous loadings in her long-termanalysis. Based on all the evidence provided it is highly unlikely thatphosphorus load reductions were the primary factor responsible forthe changed noted in this study, but they might have a smaller rolethat is masked by quagga mussels.
Zooplanktongrazing pressuremight also have contributed to the ob-served changes in southern Lake Michigan. However spring zooplank-ton biomass after quagga mussel (20.9 mg m−3) has actually declinedcompared to the biomass during the period before quagga mussel(26.9 mg m−3; Vanderploeg et al., 2012). Additionally, zooplanktongrazing was relatively low and did not exhibit control over phytoplank-ton population in the 1980s (Scavia and Fahnenstiel, 1987). Thereforethe spring zooplankton grazing pressure during the period after quaggamussel should not be responsible for the dramatic changes in phyto-plankton abundance. Also, predatory zooplankton species (Bythotrepheslongimanus, and Limnocalanus macrurus) are on the rise in southernLake Michigan (Vanderploeg et al., 2012). This is probably due to thefact that the populations of forage fish like alewives have decreased.Consequently, the population of the grazing zooplankton which mighthave had any control on the abundance of Chl a has declined and thuscould not contribute to the observed changes (Vanderploeg et al., 2012).
Similarly, climate change might potentially explain some of thesechanges noted. Surface PAR and water temperature regime can be im-portant factors controlling phytoplankton abundance and production.PAR represents the quantum flux of solar radiation of wavelengths be-tween 400 and 700 nm. The results of our analysis did not show any sig-nificant decline or increase in monthly average values of PAR reachingthe surface of Lake Michigan during the study interval. These trendssuggest that the cloud coverage environment of the lake has notchanged, which in turn eliminates any possible contribution of PAR toobserved trends of Chl a and primary production. Variation in thermalclimate of the lake seems even less likely to be a contributing factor.
Please cite this article as: Yousef, F., et al., Bio-optical properties and primimagery, J Great Lakes Res (2014), http://dx.doi.org/10.1016/j.jglr.2014.02
The isothermal period and therefore the spring bloom is temperaturedependent. One potential negative effect of climate change would bean earlier onset of stratification period and thus a shortening isothermalperiod. However, the observed increase of average stratification periodis very minimal (6 h/year; McCormick and Fahnenstiel, 1999) and canonly shorten the isothermal period by 2–3 days during our study period.Also, recent declines in Lake Michigan ice cover (Wang et al., 2011)should actually contribute to greater primary production and chloro-phyll concentrations as the lack of ice would result in greater meanwater column irradiance and facilitates the dispersal of the riverine nu-trient discharges into offshore rejoins earlier in the spring hence fuelsthe spring bloom.
Despite the strong direct role of filtration by quagga mussels inexplaining the observed trends, other factors might be important inchanges between 2001 and 2003. One interesting finding of this studyis the relatively rapid decrease in all water parameters (KdPAR, Chl a,and primary production) between 2001 and 2003. This was the periodof initial colonizationwhen quaggamussel densitieswere still relativelylow on a lake-wide basis (Nalepa et al., 2010) so this rapid decreasemight have been a synergistic response to other ecosystem changes(Mida et al., 2010) or even represented an ecosystem tipping point(Scheffer, 2004). Even though quagga mussel densities continued to in-crease from 2003 through at least 2008 in all regions of the lake, lake-wide measured parameters appeared to change more slowly. Therapid decrease in water parameters associated with initial low densitiesof mussels is not the same pattern observedwhen zebramussels invad-ed Saginaw Bay (Nalepa et al., 1999). In this shallowwater system largeecosystem changes were temporally coherent with zebra mussel densi-ties. However, the observed low Chl a in 2003 might be connected tolow total phosphorus (TP) in the same year (Mida et al., 2010;Vanderploeg et al., 2012). Mussels filter more than just phytoplanktonso their impact on phosphorus dynamics may be greater than simpledecreases in phytoplankton (Hecky et al., 2004). It is also very possiblethat nutrient (e.g. phosphorous and carbon) sequestration bydreissenidmussels (Hecky et al., 2004, Vanderploeg et al., 2010, 2012) may havecontributed to the overall decline in this period. However, the exactmechanism(s) responsible for the steep decline in 2001–2003 is/arenot clear and merits further study.
Evidence for ecological impacts of dreissenid mussels on phyto-plankton abundance and primary production has been noted in otherlakes. Analyzing the trends of Chl a fluctuations in 27 inland lakesafter invasion by dreissenid mussels, Higgins et al. (2011) found anoverall 40–45% decline in Chl a concentrations which is consistentwith the decline reported in this study. Although similar changes inChl awere noted in Lake Huron (50–60% decline in Chl a concentrationof April and May between 2003–2006 and 1998–2002; Barbiero et al.,2011), the decline was only partially attributed to filtration by musseldue to the lack of spatial coherence between mussel abundance andnoted chlorophyll decreases.
The impact of quaggamussels is not limited to phytoplankton popu-lations. Density and community composition of organisms in other tro-phic levels (secondary producers, benthic macro-invertebrates), as wellas nutrient utilization and uptake rates are also altered. Density of cer-tain zooplankton species showed a major decline after dreissenids be-tween 2006 and 2008 (Cyclopoid copepods 94%; Kerfoot et al., 2010).Vanderploeg et al. (2012) reports the decline in population ofmany cla-docerans and calanoid copepods during the same period and that thezooplankton community has shifted to large predacious species andhence grazers are both under increased predation pressure (topdown) and stress from loss of phytoplankton (bottom up).
In this study we used satellite imagery and the GLPPM to follow thelong-term changes of water parameters (KdPAR, Chl a and primary pro-duction) during the spring bloom season in Lake Michigan. The tempo-ral and spatial attributes of the rapid changes in water clarity and Chl aconcentration are likely more consistent with dreissenids mussels bio-engineering and filtration. The observed consistency between SeaWiFS
ary production of Lake Michigan: Insights from 13-years of SeaWiFS.018
8 F. Yousef et al. / Journal of Great Lakes Research xxx (2014) xxx–xxx
and fieldmeasurements of KdPAR and also close similarities between theprinciple results of this paper and the results from other researchers(e.g. Fahnenstiel et al., 2010; Kerfoot et al., 2010; Mida et al., 2010;Nalepa et al., 2009, 2010) demonstrate the advantages of remote sens-ing and encourage its complementary application in future research.This ability can serve to answer both scientific and management ques-tions related to changing conditions in Lake Michigan and the otherGreat Lakes. Further research into the factors contributing to the dra-matic changes between 2001 and 2003 may yield important insightsinto how ecosystem responds to large scale perturbations.
Acknowledgment
This investigation was supported by NASA Roses grant #NNX09AU88 and NASA Carbon Monitoring grant #NNX12AP94G. Weare thankful to the Ocean Biology Processing Group (OBPG, NASA) fortheir support and technical comments. We thank Mike Sayers for hiscomments on the production model. We would also like to thank Dr.Barry Lesht (Associate Editor) and two anonymous reviewers for theirinsightful comments and feedbacks. This is Contribution No. 3 of GreatLakes Research Center (GLRC) at Michigan Technological University.
References
Barbiero, R.P., Lesht, B.M., Warren, G.J., 2011. Evidence for bottom-up control of recentshifts in the plagic food web of Lake Huron. J. Great Lakes Res. 37, 78–85.
Brooks, A.S., Torke, B.G., 1977. Vertical and seasonal distribution of chlorophyll a in LakeMichigan. J. Fish. Res. Board Can. 34, 2280–2287.
Chen, C., et al., 2004. Impacts of suspended sediment on the ecosystem in Lake Michigan:a comparison between the 1998 and 1999 plume events. J. Geophys. Res. 109,C10S05. http://dx.doi.org/10.1029/2002JC001687.
Evans, M.A., Fahnenstiel, G., Scavia, D., 2011. Incidental oligotrophication of NorthAmerican great Lakes. Environ. Sci. Technol. 45, 3297–3303.
Fahnenstiel, G.L., Stone, R.A., McCormick, M.J., Schelske, C.L., Lohrenz, S.E., 2000. Springisothermal mixing in the Great Lakes: evidence of nutrient limitation and nutrient-light interactions in a suboptimal light environment. Can. J. Fish. Aquat. Sci. 57,1901–1910.
Fahnenstiel, G., Pothhoven, S., Vandergloeg, H., Klrer, D., Nalepa, T., Scavia, D., 2010. Re-cent changes in primary production and phytoplankton in the offshore region ofsoutheastern Lake Michigan. J. Great Lakes Res. 36 (Supplement 3), 20–29.
Frouin, R., Franz, B.A., Werdell, P.J., 2003. The SeaWiFS PAR product. In: Hooker, S.B.,Firestone, E.R. (Eds.), Algorithm Updates for the Fourth SeaWiFS Data Reprocessing.NASA/TM-2003-206892, 22, pp. 46–50.
Hecky, R.E., Smith, R.E.H., Barton, D.R., Gulldford, S.J., Taylor, W.D., Charlton, M.N., Howell,T., 2004. The nearshore phosphorus shunt: a consequence of ecosystem engineeringb dreissenids in the Laurentian Great Lakes. Can. J. Fish. Aquat. Sci. 16, 1285–1293.
Higgins, S.N., Vander Zanden, S.J., Joppa, L.N., Vadeboncoeur, Y., 2011. The effects ofdreissenid invasion on chlorophyll and the chlorophyll: total phosphorus ration innorth-temperate lakes. Can. J. Fish. Aquat. Sci. 63, 319–329.
Johengen, T.H., Johannsson, O.E., Pernie, G.L., Millard, E.S., 1994. Temporal and seasonaltrends in nutrient dynamics and biomass measures in lakes Michigan and Ontarioin response to phosphorus control. Can. J. Fish. Aquat. Sci. 51, 2570–2578.
Kerfoot, W.C., Budd, J.W., Green, S.A., Cotner, J.B., Biddanda, B.A., Schwab, D.J.,Vanderploeg, H.A., 2008. Doughnut in desert: late-winter production pulse in south-ern Lake Michigan. Limnol. Oceanogr. 53 (2), 589–604.
Kerfoot, W.C., Yousef, F., Budd, J.W., Green, S.A., Schwab, D.J., Vanderploeg, H.A., 2010. Ap-proaching storm: disappearing winter bloom in Lake Michigan. J. Great Lakes Res. 36(Supplement 3), 30–41.
Please cite this article as: Yousef, F., et al., Bio-optical properties and primimagery, J Great Lakes Res (2014), http://dx.doi.org/10.1016/j.jglr.2014.02
Lang, G.A., Fahnenstiel, G.L., 1996. NOAA Technical Memorandum ERL GLERL-90. GreatLakes Primary Production Model-Methodology and USE. ERL GLERL-90.
Lesht, B.M., Barbiero, R.P., Warren, G.J., 2013. A band-ratio algorithm for retrieving open-lake chlorophyll values from satellite observations of the Great Lakes. J. Great LakesRes. 39 (1), 138–152.
McCormick, M.J., Fahnenstiel, G.L., 1999. Recent climatic trends in nearshore water tem-peratures in the St. Lawrence Great Lakes. Limnol. Oceanogr. 44, 530–540.
Mida, J.L., Scavia, D., Fahnenstiel, G.L., Pothoven, S.A., Vanderploeg, H.A., Dolan, D.M., 2010.Long-term and recent changes in southern LakeMichiganwater quality with implica-tions for present trophic status. J. Great Lakes Res. 36 (Supplement 3), 42–49.
Millie, D.F., Fahnenstiel, G.L., Carrick, H.J., Lohrenz, S.F., Schofield, O.M.E., 2002. Phyto-plankton pigment in coastal Lake Michigan: distribution during the spring isothermalperiod and relation with episodic sediment resuspension. J. Phycol. 38, 639–648.
Mills, E.L., Leach, J.H., Carlton, J.T., Secor, C.L., 1993. Exotic species in The Great Lakes: a his-tory of biotic crises and anthropogenic. J. Great Lakes Res. 19 (1), 1–54.
Morel, A., Hout, Y., Gentili, B., Werdell, P.J., Hooker, S.B., Franz, B.A., 2007. Examining theconsistency of products derived from various ocean color sensors in ocean (Case1)waters in the perspective of a multi-sensor approach. Remote Sens. Environ. 111,69–88.
Nalepa, T.F., Fahnenstiel, G.L., Johengen, T.H., 1999. Impacts of the zebramussel (Dreissenapolymorpha) on water quality: a case study in Saginaw Bay, Lake Huron. In: Claudi, R.,Leach, J.H. (Eds.), Non-Indigenous Freshwater Organisms in North America: Their Bi-ology and Impact. CRC Press, Lewis Publishers, Boca Raton, FL, pp. 255–271.
Nalepa, T.F., Fanslow, D.L., Lang, G.A., 2009. Transformation of the offshore benthic com-munity in Lake Michigan: recent shift from the native amphipod Diporeia spp. to in-vasive mussel Dreissena rostrifoemis bugensis. Freshw. Biol. 54, 466–479.
Nalepa, T.F., Fanslow, D.L., Pothoven, S.A., 2010. Recent changes in density, biomass, re-cruitment, size structure, and nutritional state of Derissena population in southernLake Michigan. J. Great Lakes Res. 36 (Supplement 3), 5–19.
O'Reilly, J.E., et al., 2000. SeaWiFS post-launch technical report series. SeaWiFS Post-Launch Calibration and Validation Analyses, Part3. NASA Technical Memorandum2000–206892, 11.
Pauer, J.J., Taunt, K.W., Melendez, W., Kreis Jr., R.G., Anstead, A.M., 2007. Resurrection ofthe Lake Michigan eutrophication model, MICH1. J. Great Lakes Res. 33 (3), 554–565.
Pothoven, S.A., Fahnenstiel, G.L., 2013. Recent change in summer chlorophyll a dynamicsof southeastern Lake Michigan. J. Great Lakes Res. 39, 287–294.
Robertson, D.M., Saad, D.A., 2011. Nutrient inputs to the Laurentian Great Lakes by sourceand watershed estimated using SPARROW watershed models. J. Am. Water Resour.Assoc. 47 (5), 1011–1033.
Scavia, D., Fahnenstiel, G.L., 1987. Dynamics of Lake Michigan phytoplankton: mecha-nisms controlling epilimnetic populations. J. Great Lakes Res. 13, 103–120.
Scavia, D., Fahnenstiel, G.L., Evans, M.S., Jude, D.J., Lehman, J.T., 1986. Influence ofsalmonine predation and weather on long-term water quality trends in LakeMichigan. Can. J. Fish. Aquat. Sci. 43, 435–443.
Scheffer, M., 2004. Ecology of Shallow Lakes. Chapman & Hall 346.Schelske, C.L., Stoermer, E.F., 1972. Phosphorous, silica, and euotrophication of Lake
Michigan. Am. Soc. Limnol. Oceanogr. Spec. Symp. 1, 157–171.Shuchman, R.A., Sayers, M., Fahnenstiel, G.L., Leshkevich, G., 2013. A model for determin-
ing satellite-derived primary productivity estimates for Lake Michigan. J. Great LakesRes. 39 (Supplement 1), 46–54.
Vanderploeg, H.A., Nalepa, T.F., Jude, D.J., Mills, E.L., Holeck, K.T., Liebig, J.R., Grigorvich, I.A.,Ojaveer, H., 2002. Dispersal and emerging ecological impacts of Ponto-Caspian spe-cies in the Laurentian Great Lakes. Can. J. Fish. Aquat. Sci. 59, 1209–1228.
Vanderploeg, H.A., Liebig, J.R., Nalepa, T.F., Fahnenstiel, G.L., Pothoven, S.A., 2010.Dreissena and the disappearance of the spring phytoplankton bloom in Lake Michi-gan. J. Great Lakes Res. 36 (Supplement 3), 50–59.
Vanderploeg, H.A., Pothoven, S.A., Fahnenstiel, G.L., Cavaletto, J.F., Liebig, J.R., Stow, C.A.,Nalepa, T.F., Madenjian, C.P., Bunnell, D.B., 2012. Seasonal zooplankton dynamics inLake Michigan: disentangling impacts of resource limitation, ecosystem engineering,and predation during a critical ecosystem transition. J. Great Lakes Res. 38 (2),336–352.
Wang, J., Bai, X., Hu, H., Clites, A.H., Colton, M.C., Lofgren, B.M., 2011. Temporal and spatialvariability of Great Lakes ice cover, 1973–2010. J. Clim. 25 (4), 1318–1329.
ary production of Lake Michigan: Insights from 13-years of SeaWiFS.018


![Let’s practice sound [ei] Let’s practice sound [ei] lake gate cake table.](https://static.fdocument.org/doc/165x107/56649ea95503460f94bad14b/lets-practice-sound-ei-lets-practice-sound-ei-lake-gate-cake-table.jpg)