,B.Batgerel , R.Togoo , A.I.Malakhov , M.Sovd , B.Chadraa ...E1-2012-13).pdf · A Possible Study of...
24
E1-2012-13 Ts. Baatar 1 , B. Batgerel 1,2 , R. Togoo 1 , A. I. Malakhov 2 , B. Otgongerel 1 , M. Sovd 1 , B. Chadraa 1 , N. G. Fadeev 2 , G. Sharkhuu 1 A POSSIBLE STUDY OF THE PHASE TRANSITION IN π − C INTERACTION AT 40 GeV/c Submitted to ®Ÿ¤¥·´ Ö Ë¨§¨± ¯ 1 Institute of Physics and Technology, MAS, Ulaanbaatar, Mongolia 2 Joint Institute for Nuclear Research, Dubna
Transcript of ,B.Batgerel , R.Togoo , A.I.Malakhov , M.Sovd , B.Chadraa ...E1-2012-13).pdf · A Possible Study of...
E1-2012-13
Ts. Baatar1, B. Batgerel1,2, R. Togoo1, A. I.Malakhov2,B.Otgongerel1, M. Sovd1, B. Chadraa1, N. G. Fadeev2,G. Sharkhuu1
A POSSIBLE STUDY OF THE PHASE TRANSITIONIN π−C INTERACTION AT 40 GeV/c
Submitted to ®Ÿ¤¥·´ Ö Ë¨§¨± ¯
1Institute of Physics and Technology, MAS, Ulaanbaatar, Mongolia2Joint Institute for Nuclear Research, Dubna
� É · –. ¨ ¤·. E1-2012-13‚μ§³μ¦´μ¸ÉÓ ¨§ÊÎ¥´¨Ö Ë §μ¢μ£μ ¶¥·¥Ìμ¤ ¢ π−C-¢§ ¨³μ¤¥°¸É¢¨¨¶·¨ 40 ƒÔ‚/c
� ¸¸³μÉ·¥´Ò ¨³¶Ê²Ó¸´Ò¥ ¨ Ê£²μ¢Ò¥ Ì · ±É¥·¨¸É¨±¨ ¶·μÉμ´μ¢ ¨ π−-³¥§μ´μ¢,·μ¦¤¥´´ÒÌ ¢ π−C-¢§ ¨³μ¤¥°¸É¢¨ÖÌ ¶·¨ 40 ƒÔ‚/c, ± ± ËÊ´±Í¨Ö ±Ê³Ê²Öɨ¢´μ£μΨ¸² nk (¨²¨ Î¥ÉÒ·¥Ì³¥·´μ£μ ¶¥·¥¤ ´´μ£μ ¨³¶Ê²Ó¸ t). �·μ¢¥¤¥´´Ò° ´ ²¨§Ê± §Ò¢ ¥É ´ ¢μ§³μ¦´μ¥ ¶μÖ¢²¥´¨¥ Ë §μ¢μ£μ ¶¥·¥Ìμ¤ Ö¤¥·´μ° ³ É¥·¨¨.
� ¡μÉ ¢Ò¶μ²´¥´ ¢ ‹ ¡μ· Éμ·¨¨ ˨§¨±¨ ¢Ò¸μ±¨Ì Ô´¥·£¨° ¨³. ‚.ˆ. ‚¥±¸²¥· ¨ �.Œ. � ²¤¨´ �ˆŸˆ.
�·¥¶·¨´É �¡Ñ¥¤¨´¥´´μ£μ ¨´¸É¨ÉÊÉ Ö¤¥·´ÒÌ ¨¸¸²¥¤μ¢ ´¨°. „Ê¡´ , 2012
Baatar Ts. et al. E1-2012-13A Possible Study of the Phase Transition in π−C Interactionat 40 GeV/c
In this paper we consider the momentum and angular characteristics of protonsand π− mesons produced in π−C interactions at 40 GeV/c as a function of thecumulative number nk (or the four-dimensional momentum transfer t). Analysiscarried out in this paper indicates possible appearance of the phase transition ofnuclear matter.
The investigation has been performed at the Veksler and Baldin Laboratory ofHigh Energy Physics, JINR.
Preprint of the Joint Institute for Nuclear Research. Dubna, 2012
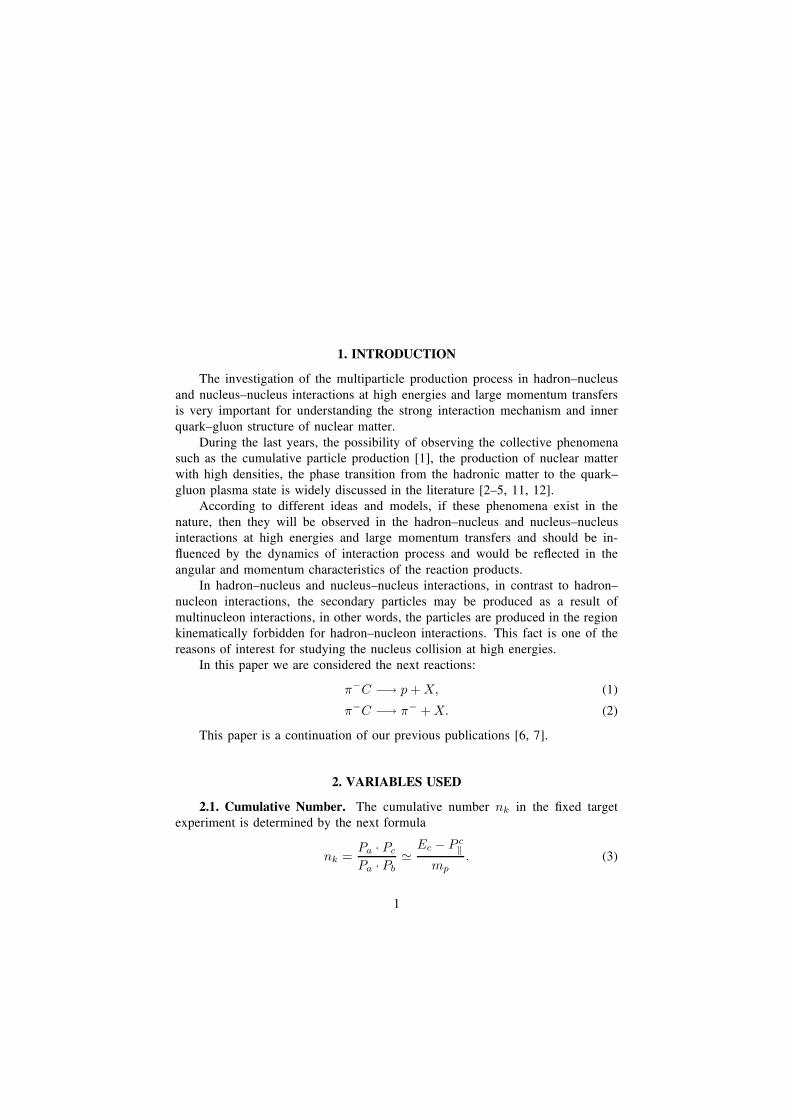
1. INTRODUCTION
The investigation of the multiparticle production process in hadronÄnucleusand nucleusÄnucleus interactions at high energies and large momentum transfersis very important for understanding the strong interaction mechanism and innerquarkÄgluon structure of nuclear matter.
During the last years, the possibility of observing the collective phenomenasuch as the cumulative particle production [1], the production of nuclear matterwith high densities, the phase transition from the hadronic matter to the quarkÄgluon plasma state is widely discussed in the literature [2Ä5, 11, 12].
According to different ideas and models, if these phenomena exist in thenature, then they will be observed in the hadronÄnucleus and nucleusÄnucleusinteractions at high energies and large momentum transfers and should be in-�uenced by the dynamics of interaction process and would be re�ected in theangular and momentum characteristics of the reaction products.
In hadronÄnucleus and nucleusÄnucleus interactions, in contrast to hadronÄnucleon interactions, the secondary particles may be produced as a result ofmultinucleon interactions, in other words, the particles are produced in the regionkinematically forbidden for hadronÄnucleon interactions. This fact is one of thereasons of interest for studying the nucleus collision at high energies.
In this paper we are considered the next reactions:
π−C −→ p + X, (1)
π−C −→ π− + X. (2)
This paper is a continuation of our previous publications [6, 7].
2. VARIABLES USED
2.1. Cumulative Number. The cumulative number nk in the ˇxed targetexperiment is determined by the next formula
nk =Pa · Pc
Pa · Pb�
Ec − P c‖
mp. (3)
1
Here Pa, Pb, and Pc are the four-dimensional momenta of the incident particle,target, and the considered secondary particles, correspondingly; Ec is the energy,and P c
‖ is the longitudinal momentum of the considered particle, mp is the protonmass. From this formula we see that this variable is relativistic invariant.
This variable (nk) may be interpreted as a minimal target mass, which isrequired for producing the given secondary particle, because at summarizing byall secondary particles, there should be obtained the value of the target massdetermined on the basis of the energyÄmomentum conservation law, i.e.,
Mt �∑n
i=1(E − P‖)i
mp. (4)
So, nk distribution gives the ordered mass values from the target required forproducing the considered secondary particles.
The connection between the variable nk and momentum transfer t is deter-mined by the next formula [7]:
t = −Q2 = −m2π − m2
c + Sπ−p · nk ≈ Sπ−p · nk, (5)
where Sπ−p is the total energy square of π−p interaction. In this experiment,Sπ−p
∼= 2Ea · mp∼= 75 GeV2/c2 is constant. To study the phase transition of
the nuclear matter we must choose the variables corresponding to this physicalprocess. In the theoretical calculations, the effective temperature T , the densityof nuclear matter ρ/ρ0 or the chemical potential μ are mainly used. But thevariables μ and ρ are not fully determined experimentally. So for studying thephase transition process we must select the other appropriate variable. With thisgoal let us consider formula (5) which gives the connection between the variablesnk and t. From this formula one can see that with increasing t the minimal massvalue nk, which is required from the target for producing the considered secondaryparticle, increases or vice versa. This means that if any one particle with nk > 1(cumulative particle) is produced in hadronÄnucleus interactions at high energies,then this particle should be produced at large momentum transfers more than thetotal energy square of π−p interaction Sπ−p, i.e., t > Sπ−p, for example, if nk =1.5, then only for this particle t ∼= Sπ−p ·nk = 75 GeV2/c2 ·1.5 = 112.5 GeV2/c2
which is not allowed for π−p interactions.On the other hand, if two particles are produced at two different values of
nk (Q21 < Q2
2), then the size of the particle-production region for every particleis different and may be estimated by the formulae r1 ∼ 1/Q1, r1 ∼ 1/Q2 andsatisˇes the condition r1 > r2, i.e. the size of the particle-emission region at highQ2 is smaller than in the case at low Q2.
As a result of these two features (increasing of the mass (nk · mp) anddecreasing of the distance r) of the variable nk (or t), the density of the nuclearmatter ρ increases with increasing of nk. In this sence, nk (or t) is the more
2
appropriate variable to study the phase transition process of nuclear matter. Inthis case, the density of nuclear matter ρ may be determined by the next formula:
ρ =m
V=
nk · mp
V, (6)
where V is the volume from which the particle is emitted. The volume V maybe estimated as a sphere, i.e.,
V =4π
3r3. (7)
2.2. The Effective Temperature T . The transverse energy spectra of thesecondary particles in the different nk intervals are approximated by exponentialfunctions of the next form:
12 · Et
ΔN
ΔEt∼ e−b·Et , Et =
√p2
t + m2. (8)
The effective temperature T is determined as the inverse of the slope parameters b,
T =1b. (9)
3. EXPERIMENTAL METHOD
The experimental material was obtained with the help of Dubna 2-meterpropane (C3H8) bubble chamber exposed to π− mesons with momentum 40 GeV/cfrom Serpukhov accelerator. According to the advantage of the bubble chamberexperiment, all distributions in this paper are obtained in the condition of 4πgeometry of secondary particles.
The average error of the momentum measurements is ∼ 12%, and the averageerror of the angular measurements is ∼ 0.6◦.
All secondary negative particles are taken as π− mesons. The average bound-ary momentum from which π− mesons were well identiˇed in the propane bubblechamber is ∼ 70 MeV/c. In connection with the identiˇcation problem betweenenergetic protons and π+ mesons, protons with momentum more than ∼ 1 GeV/care included into π+ mesons.
The other experimental details are described in [8, 9].
4. STATISTICS
8791 π−C interactions are used in this analysis.
1. The total number of protons is 12441.
2. The total number of π−-mesons is 30145.
3
5. π− + C −→ p + X ANALYSIS
It is interesting to stress that in this experiment the incident particles are π−
mesons. This means that the secondary protons in π−C interactions at 40 GeV/cshould be produced only in the target fragmentation region, in other words, there isno overlapping from the projectile fragmetation region in the rapidity distributionof protons.
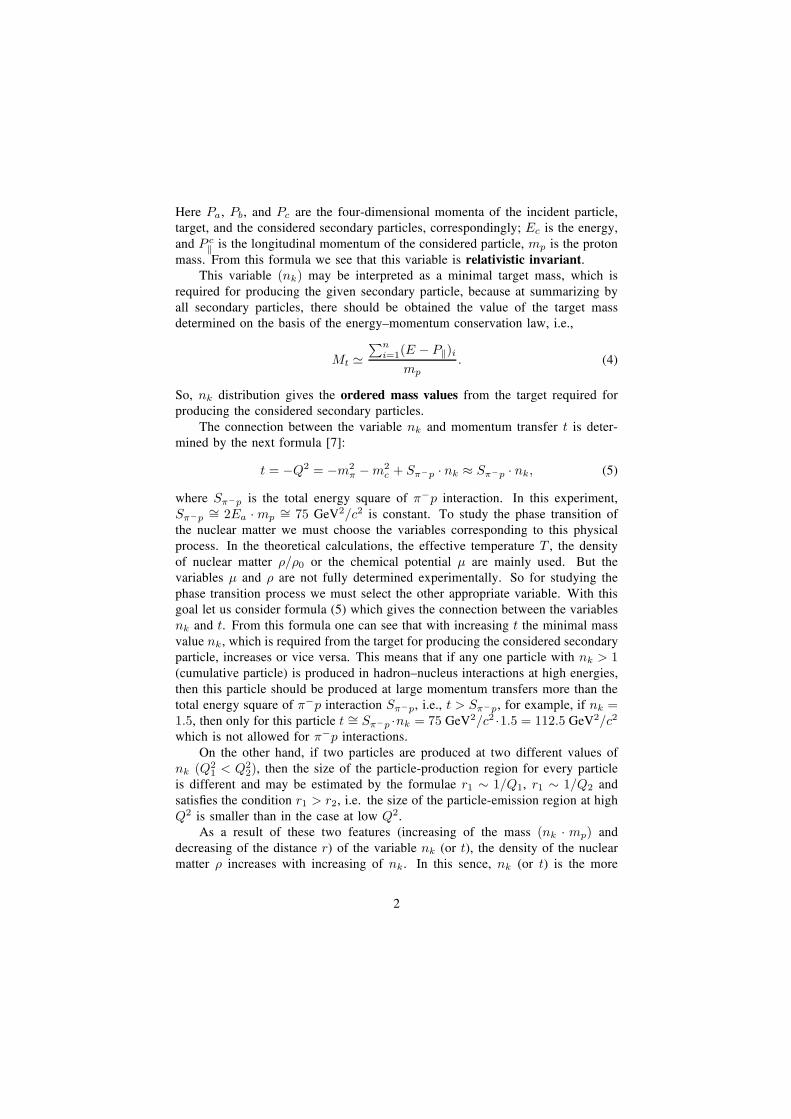
Figure 1 shows the nk distribution of the secondary protons produced inπ−C interactions at 40 GeV/c. From this distribution we see that many protonsare produced in the region with nk > 1 (cumulative protons). This distributioncontinues until nk ≈ 2.3.
Fig. 1. Cumulative number (nk) distribution of protons
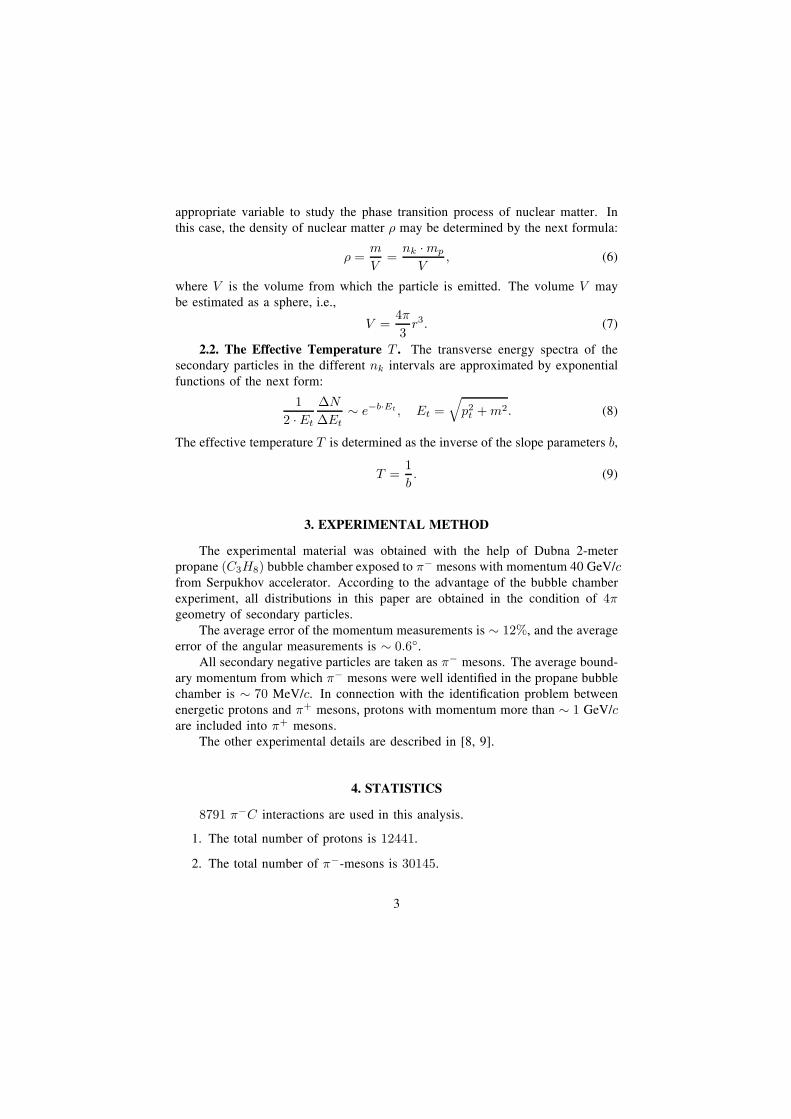
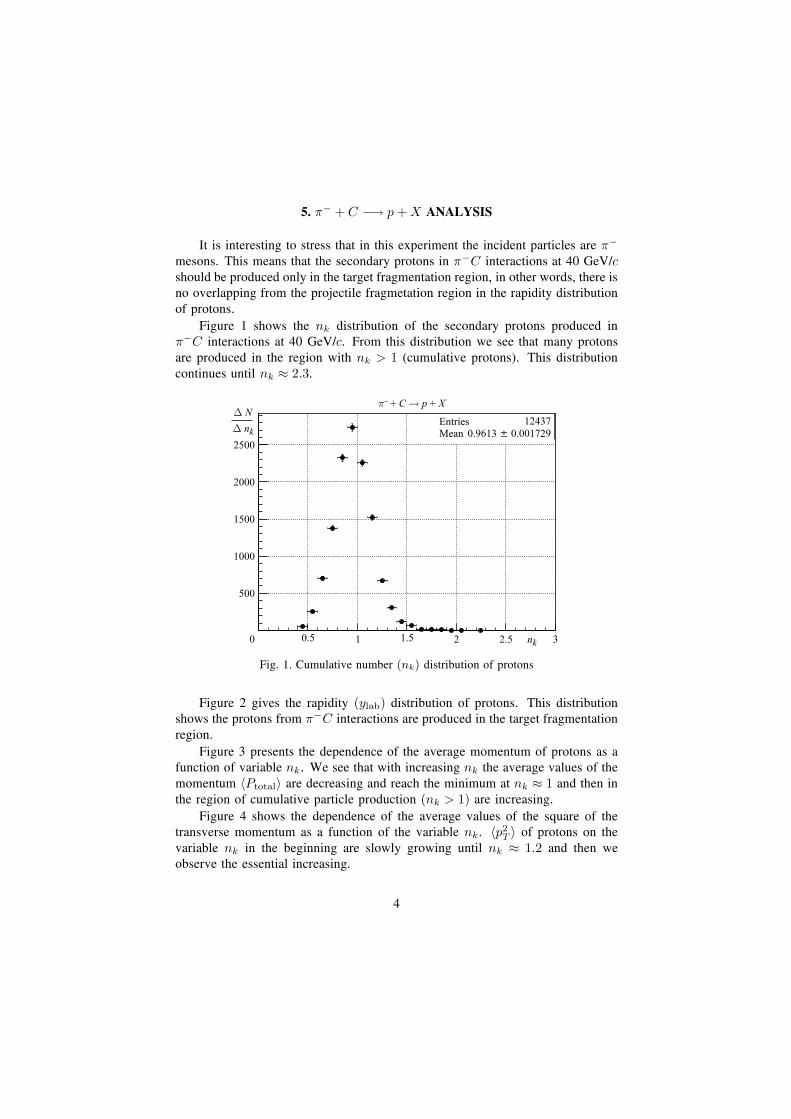
Figure 2 gives the rapidity (ylab) distribution of protons. This distributionshows the protons from π−C interactions are produced in the target fragmentationregion.
Figure 3 presents the dependence of the average momentum of protons as afunction of variable nk. We see that with increasing nk the average values of themomentum 〈Ptotal〉 are decreasing and reach the minimum at nk ≈ 1 and then inthe region of cumulative particle production (nk > 1) are increasing.
Figure 4 shows the dependence of the average values of the square of thetransverse momentum as a function of the variable nk. 〈p2
T 〉 of protons on thevariable nk in the beginning are slowly growing until nk ≈ 1.2 and then weobserve the essential increasing.
4
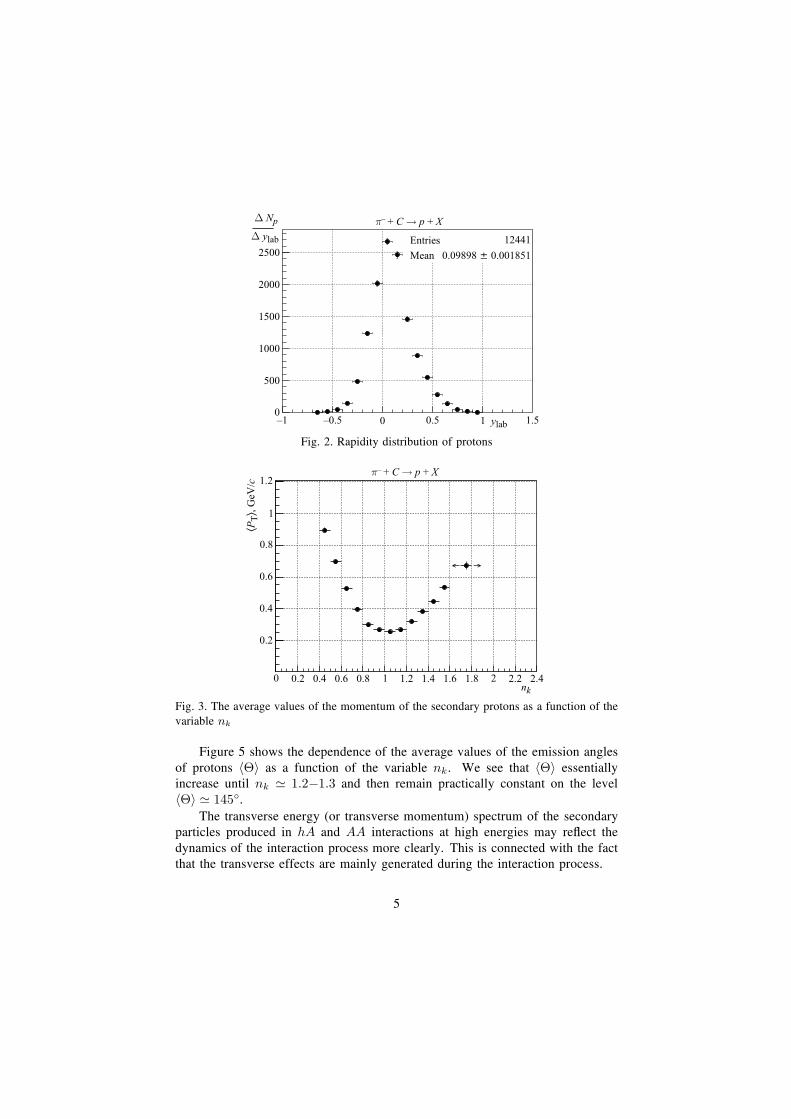
Fig. 2. Rapidity distribution of protons
Fig. 3. The average values of the momentum of the secondary protons as a function of thevariable nk
Figure 5 shows the dependence of the average values of the emission anglesof protons 〈Θ〉 as a function of the variable nk. We see that 〈Θ〉 essentiallyincrease until nk � 1.2−1.3 and then remain practically constant on the level〈Θ〉 � 145◦.
The transverse energy (or transverse momentum) spectrum of the secondaryparticles produced in hA and AA interactions at high energies may re�ect thedynamics of the interaction process more clearly. This is connected with the factthat the transverse effects are mainly generated during the interaction process.
5
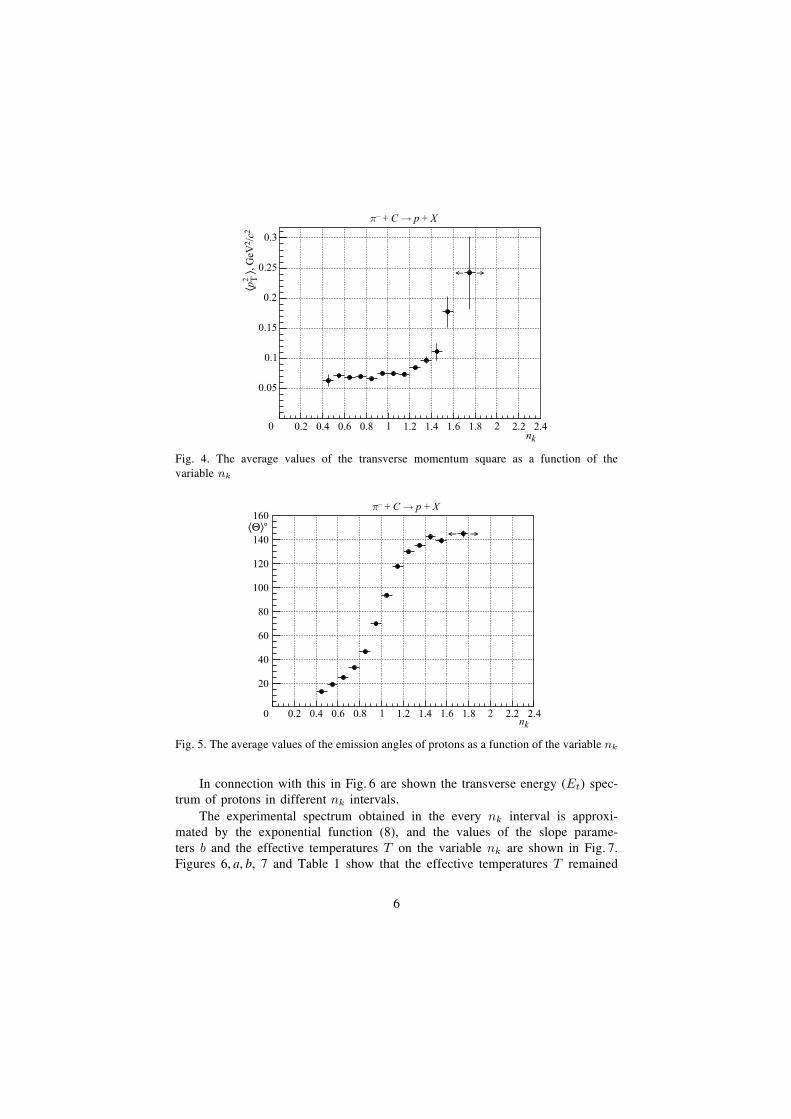
Fig. 4. The average values of the transverse momentum square as a function of thevariable nk
Fig. 5. The average values of the emission angles of protons as a function of the variable nk
In connection with this in Fig. 6 are shown the transverse energy (Et) spec-trum of protons in different nk intervals.
The experimental spectrum obtained in the every nk interval is approxi-mated by the exponential function (8), and the values of the slope parame-ters b and the effective temperatures T on the variable nk are shown in Fig. 7.Figures 6, a, b, 7 and Table 1 show that the effective temperatures T remained
6
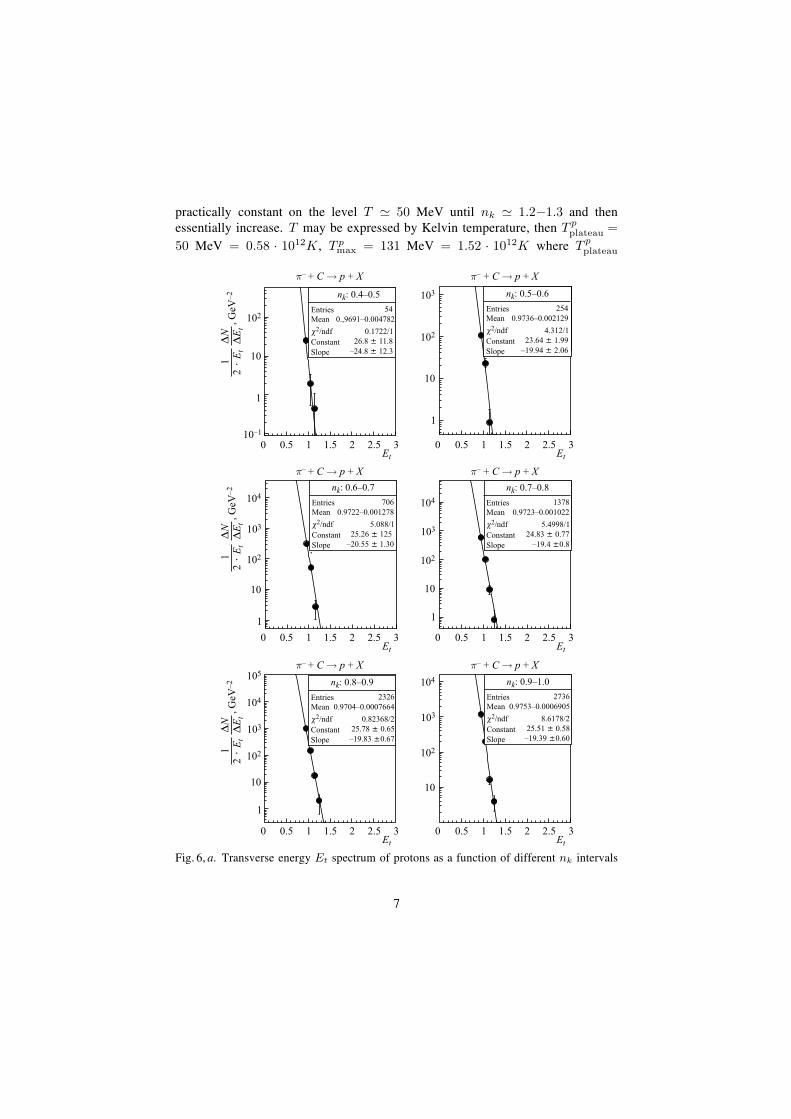
practically constant on the level T � 50 MeV until nk � 1.2−1.3 and thenessentially increase. T may be expressed by Kelvin temperature, then T p
plateau =50 MeV = 0.58 · 1012K , T p
max = 131 MeV = 1.52 · 1012K where T pplateau
Fig. 6, a. Transverse energy Et spectrum of protons as a function of different nk intervals
7
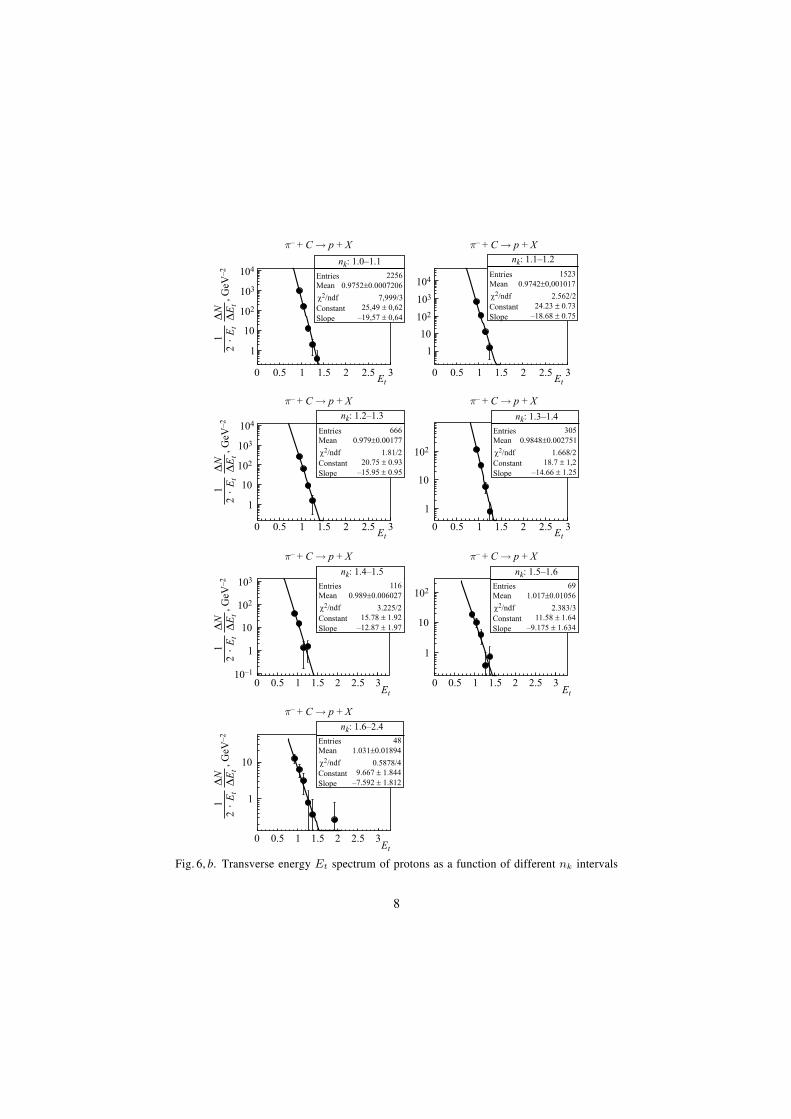
Fig. 6, b. Transverse energy Et spectrum of protons as a function of different nk intervals
8
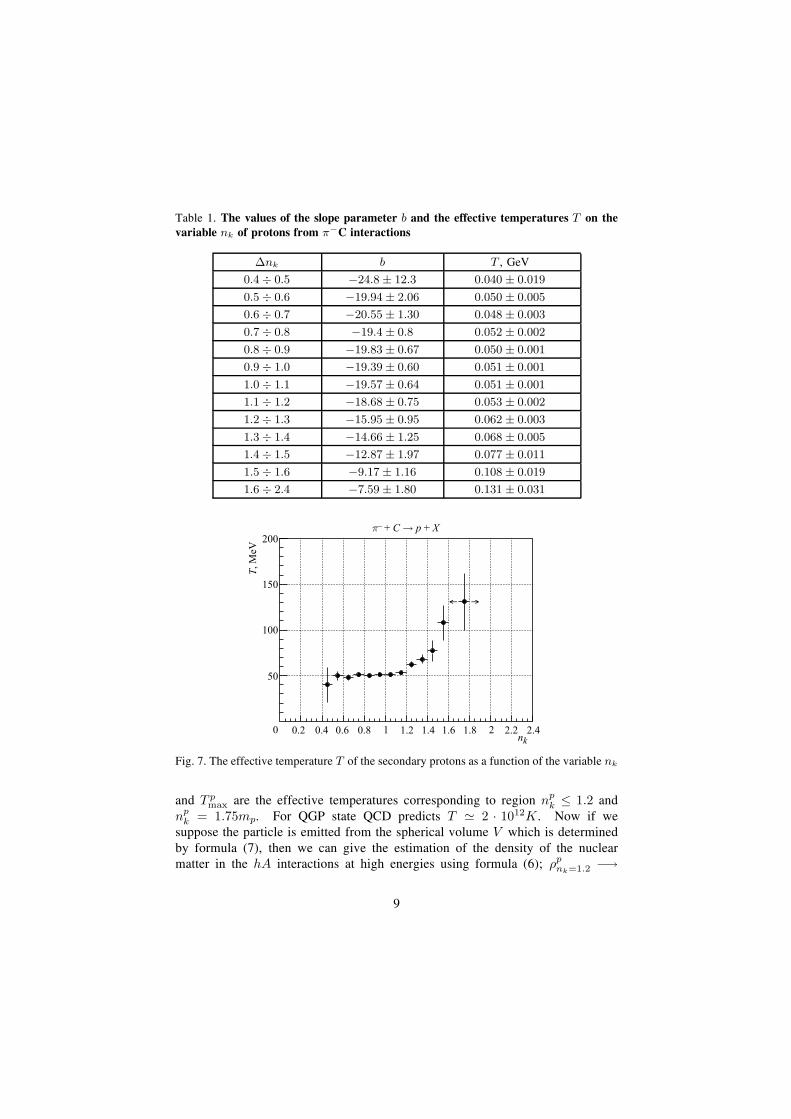
Table 1. The values of the slope parameter b and the effective temperatures T on thevariable nk of protons from π−C interactions
Δnk b T , GeV
0.4 ÷ 0.5 −24.8 ± 12.3 0.040 ± 0.019
0.5 ÷ 0.6 −19.94 ± 2.06 0.050 ± 0.005
0.6 ÷ 0.7 −20.55 ± 1.30 0.048 ± 0.003
0.7 ÷ 0.8 −19.4 ± 0.8 0.052 ± 0.002
0.8 ÷ 0.9 −19.83 ± 0.67 0.050 ± 0.001
0.9 ÷ 1.0 −19.39 ± 0.60 0.051 ± 0.001
1.0 ÷ 1.1 −19.57 ± 0.64 0.051 ± 0.001
1.1 ÷ 1.2 −18.68 ± 0.75 0.053 ± 0.002
1.2 ÷ 1.3 −15.95 ± 0.95 0.062 ± 0.003
1.3 ÷ 1.4 −14.66 ± 1.25 0.068 ± 0.005
1.4 ÷ 1.5 −12.87 ± 1.97 0.077 ± 0.011
1.5 ÷ 1.6 −9.17 ± 1.16 0.108 ± 0.019
1.6 ÷ 2.4 −7.59 ± 1.80 0.131 ± 0.031
Fig. 7. The effective temperature T of the secondary protons as a function of the variable nk
and T pmax are the effective temperatures corresponding to region np
k ≤ 1.2 andnp
k = 1.75mp. For QGP state QCD predicts T � 2 · 1012K . Now if wesuppose the particle is emitted from the spherical volume V which is determinedby formula (7), then we can give the estimation of the density of the nuclearmatter in the hA interactions at high energies using formula (6); ρp
nk=1.2 −→
9
1.2mp
V=
1.2mp
0.082fm3= 14.6mp/fm3, ρp
nk=1.75 −→ 1.75mp
V=
1.75mp
0.039fm3=
44.9mp/fm3. Where ρpnk=1.2 and ρp
nk=1.75 are the estimations of the densitiescorresponding to the regions nk = 1.2 and nk = 1.75.
6. π− + C −→ π− + X ANALYSIS
As in the case of protons, the angular and momentum characteristics of π−
mesons from π−C interaction at 40 GeV/c as a function of the variable nk arecarried out here.
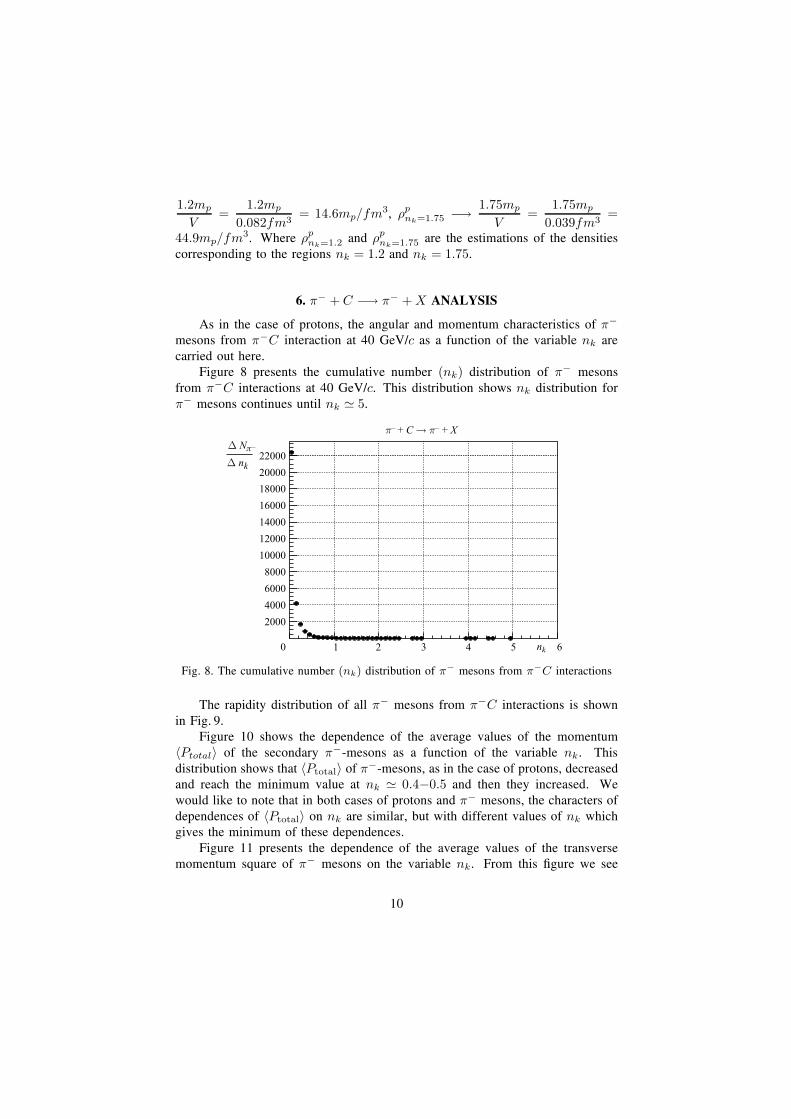
Figure 8 presents the cumulative number (nk) distribution of π− mesonsfrom π−C interactions at 40 GeV/c. This distribution shows nk distribution forπ− mesons continues until nk � 5.
Fig. 8. The cumulative number (nk) distribution of π− mesons from π−C interactions
The rapidity distribution of all π− mesons from π−C interactions is shownin Fig. 9.
Figure 10 shows the dependence of the average values of the momentum〈Ptotal〉 of the secondary π−-mesons as a function of the variable nk. Thisdistribution shows that 〈Ptotal〉 of π−-mesons, as in the case of protons, decreasedand reach the minimum value at nk � 0.4−0.5 and then they increased. Wewould like to note that in both cases of protons and π− mesons, the characters ofdependences of 〈Ptotal〉 on nk are similar, but with different values of nk whichgives the minimum of these dependences.
Figure 11 presents the dependence of the average values of the transversemomentum square of π− mesons on the variable nk. From this ˇgure we see
10
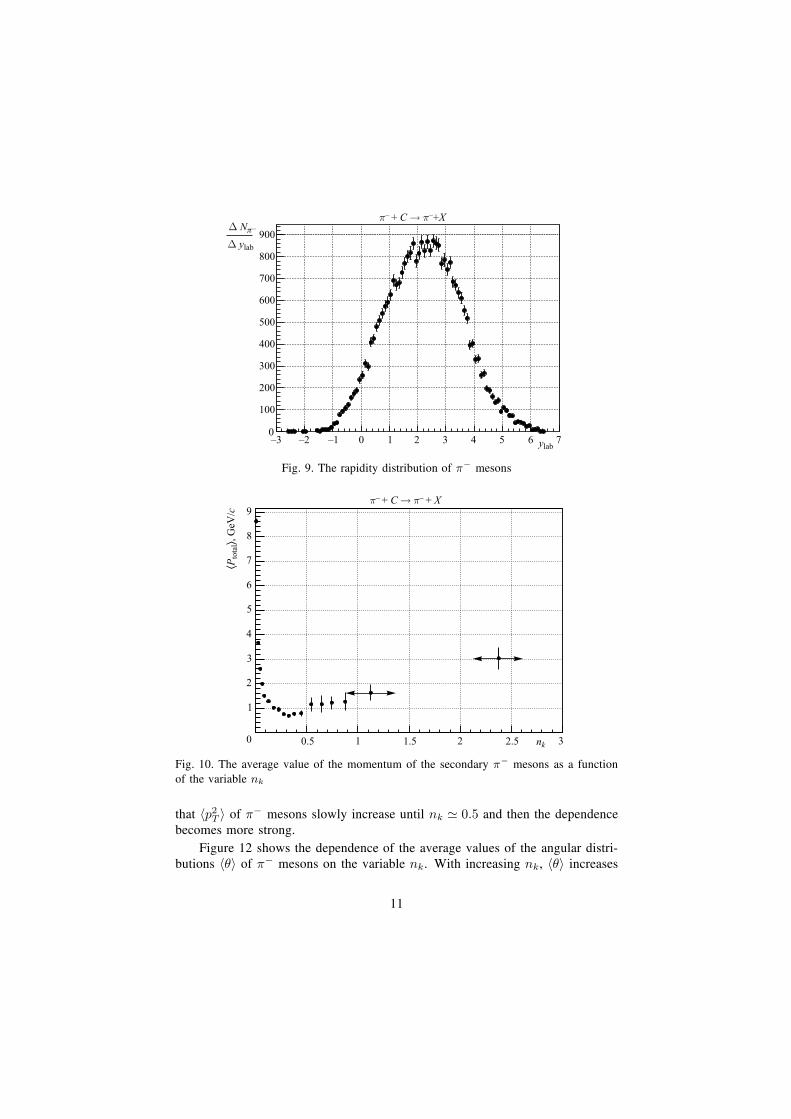
Fig. 9. The rapidity distribution of π− mesons
Fig. 10. The average value of the momentum of the secondary π− mesons as a functionof the variable nk
that 〈p2T 〉 of π− mesons slowly increase until nk � 0.5 and then the dependence
becomes more strong.
Figure 12 shows the dependence of the average values of the angular distri-butions 〈θ〉 of π− mesons on the variable nk. With increasing nk, 〈θ〉 increases
11
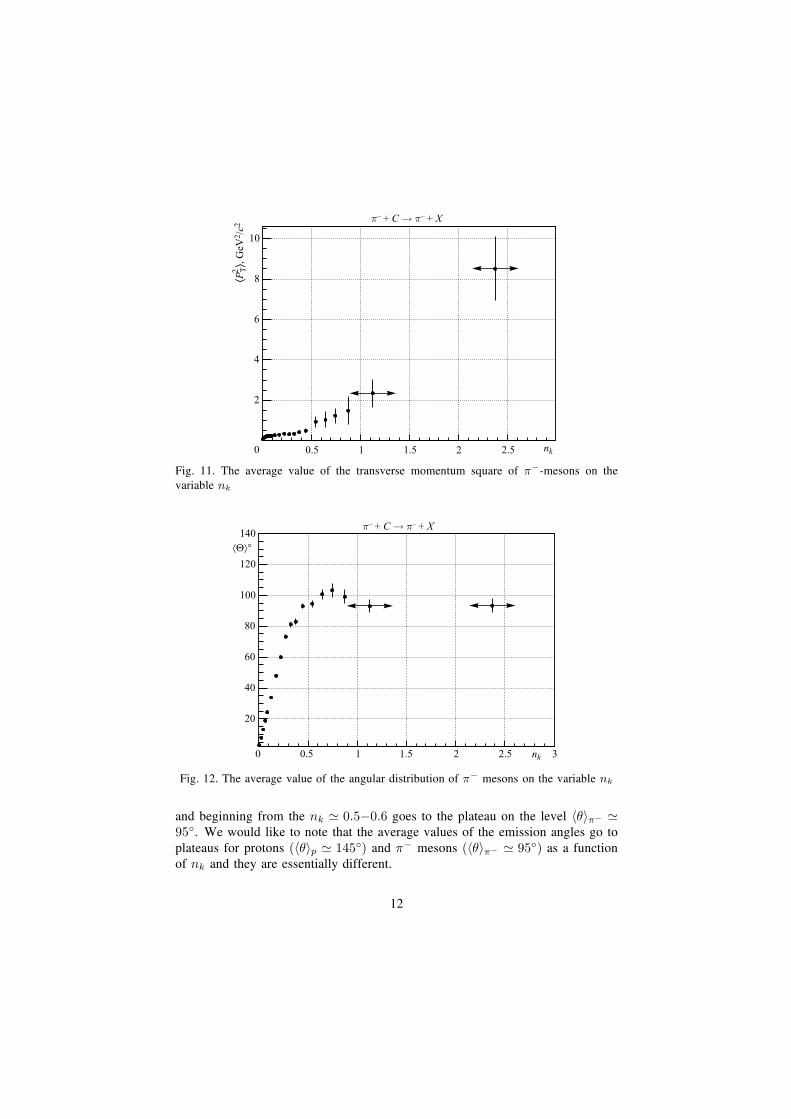
Fig. 11. The average value of the transverse momentum square of π−-mesons on thevariable nk
Fig. 12. The average value of the angular distribution of π− mesons on the variable nk
and beginning from the nk � 0.5−0.6 goes to the plateau on the level 〈θ〉π− �95◦. We would like to note that the average values of the emission angles go toplateaus for protons (〈θ〉p � 145◦) and π− mesons (〈θ〉π− � 95◦) as a functionof nk and they are essentially different.
12
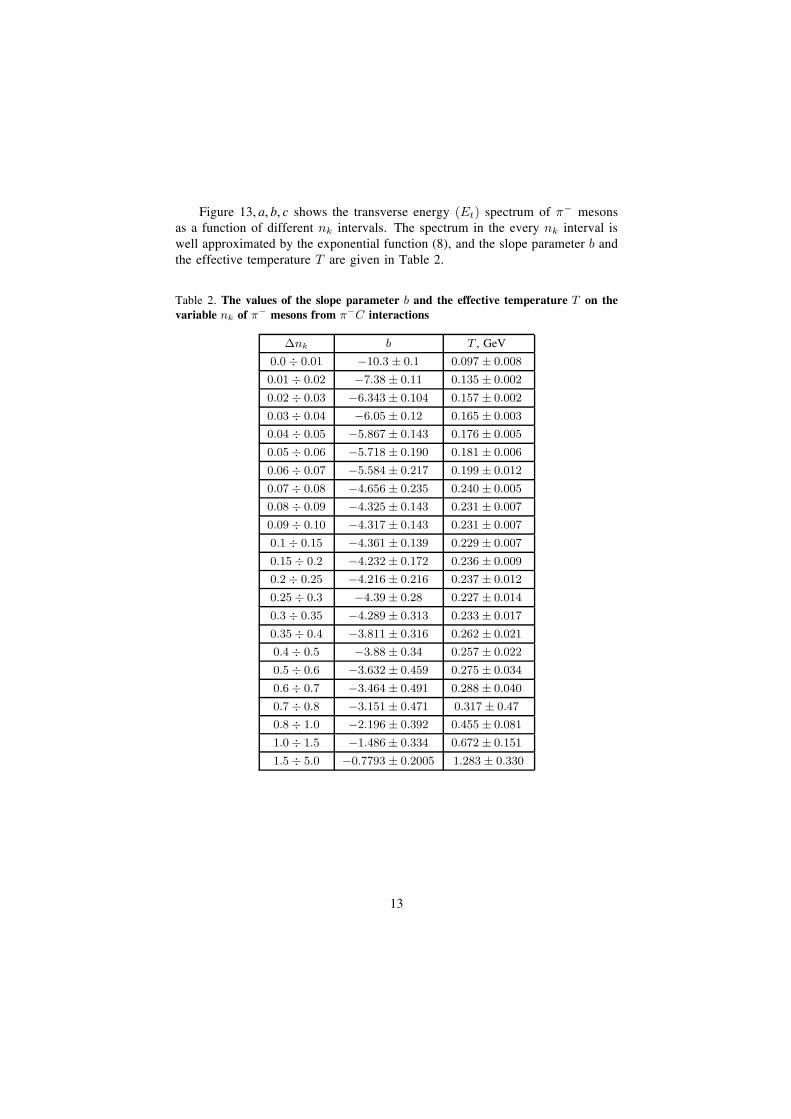
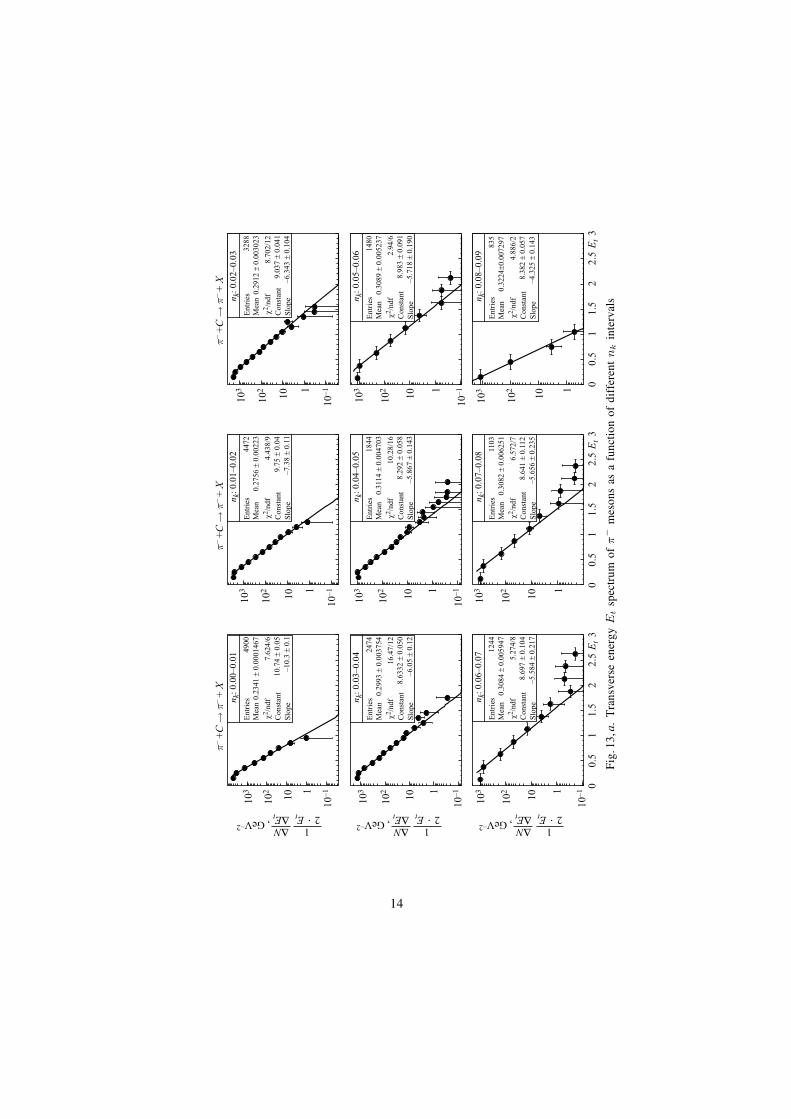
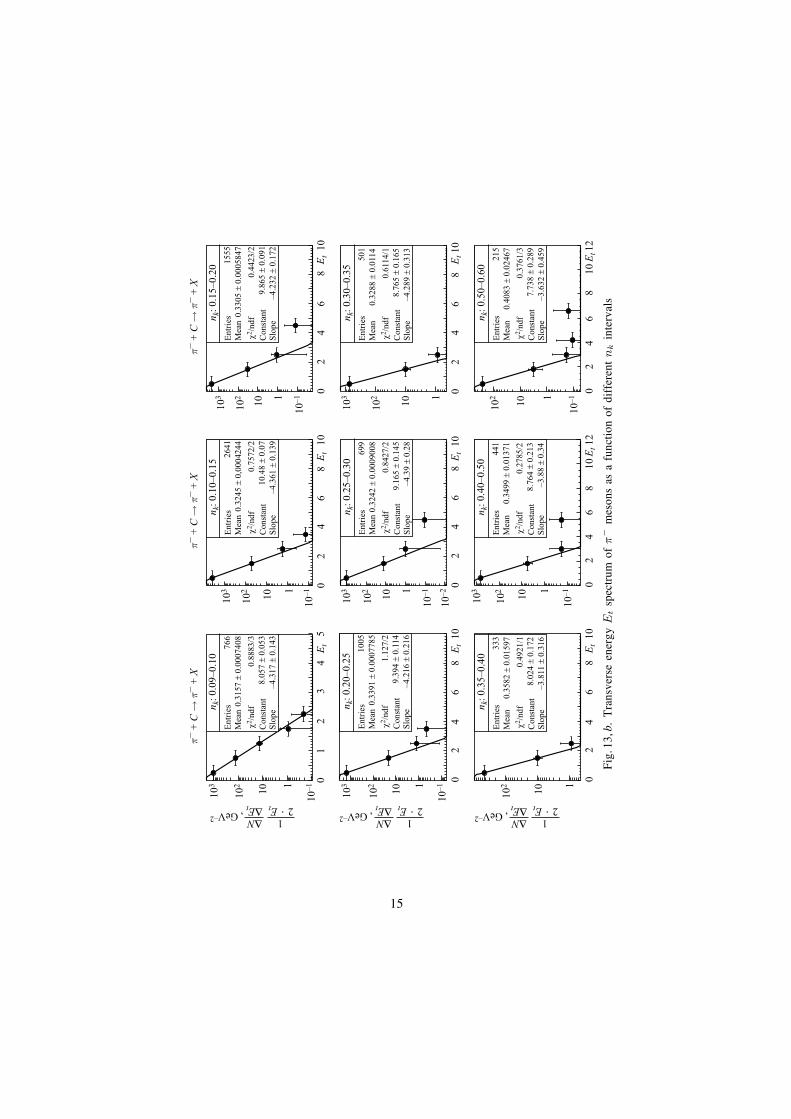
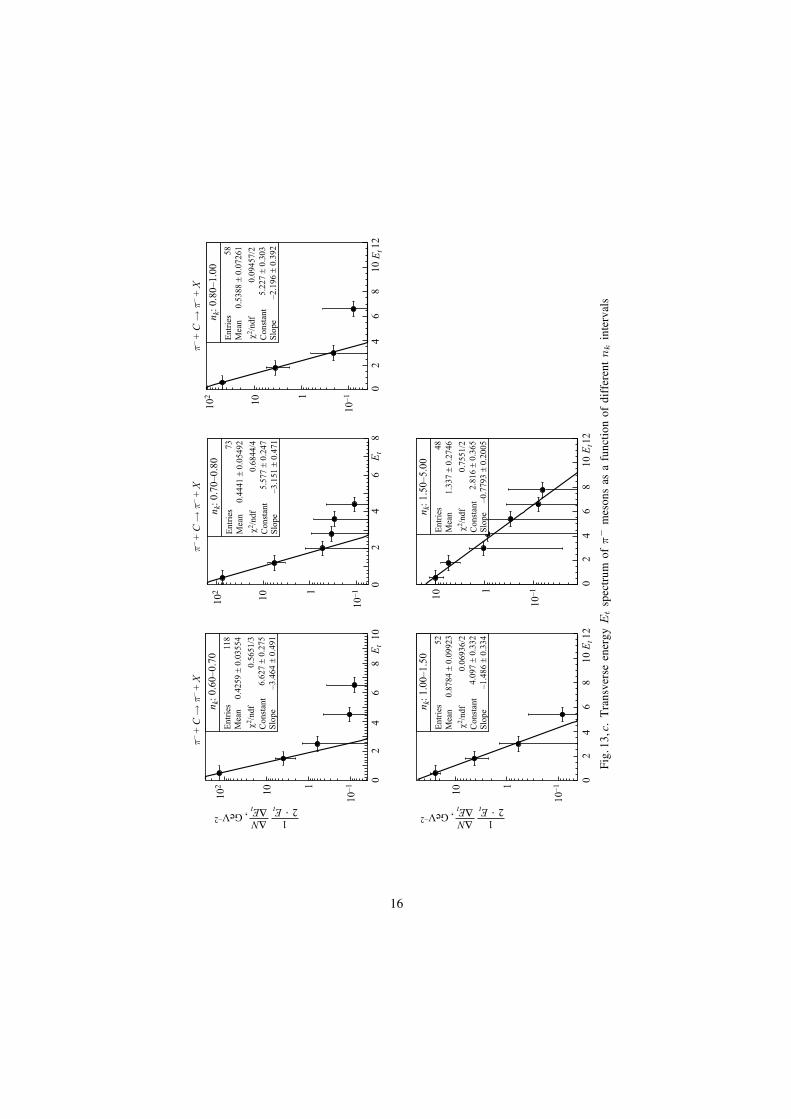
Figure 13, a, b, c shows the transverse energy (Et) spectrum of π− mesonsas a function of different nk intervals. The spectrum in the every nk interval iswell approximated by the exponential function (8), and the slope parameter b andthe effective temperature T are given in Table 2.
Table 2. The values of the slope parameter b and the effective temperature T on thevariable nk of π− mesons from π−C interactions
Δnk b T , GeV
0.0 ÷ 0.01 −10.3 ± 0.1 0.097 ± 0.008
0.01 ÷ 0.02 −7.38 ± 0.11 0.135 ± 0.002
0.02 ÷ 0.03 −6.343 ± 0.104 0.157 ± 0.002
0.03 ÷ 0.04 −6.05 ± 0.12 0.165 ± 0.003
0.04 ÷ 0.05 −5.867 ± 0.143 0.176 ± 0.005
0.05 ÷ 0.06 −5.718 ± 0.190 0.181 ± 0.006
0.06 ÷ 0.07 −5.584 ± 0.217 0.199 ± 0.012
0.07 ÷ 0.08 −4.656 ± 0.235 0.240 ± 0.005
0.08 ÷ 0.09 −4.325 ± 0.143 0.231 ± 0.007
0.09 ÷ 0.10 −4.317 ± 0.143 0.231 ± 0.007
0.1 ÷ 0.15 −4.361 ± 0.139 0.229 ± 0.007
0.15 ÷ 0.2 −4.232 ± 0.172 0.236 ± 0.009
0.2 ÷ 0.25 −4.216 ± 0.216 0.237 ± 0.012
0.25 ÷ 0.3 −4.39 ± 0.28 0.227 ± 0.014
0.3 ÷ 0.35 −4.289 ± 0.313 0.233 ± 0.017
0.35 ÷ 0.4 −3.811 ± 0.316 0.262 ± 0.021
0.4 ÷ 0.5 −3.88 ± 0.34 0.257 ± 0.022
0.5 ÷ 0.6 −3.632 ± 0.459 0.275 ± 0.034
0.6 ÷ 0.7 −3.464 ± 0.491 0.288 ± 0.040
0.7 ÷ 0.8 −3.151 ± 0.471 0.317 ± 0.47
0.8 ÷ 1.0 −2.196 ± 0.392 0.455 ± 0.081
1.0 ÷ 1.5 −1.486 ± 0.334 0.672 ± 0.151
1.5 ÷ 5.0 −0.7793 ± 0.2005 1.283 ± 0.330
13
Fig
.13,
a.Tra
nsve
rse
ener
gyE
tsp
ectrum
ofπ−
mes
ons
asa
func
tion
ofdi
ffer
entn
kin
terv
als
14
Fig
.13,
b.Tra
nsve
rse
ener
gyE
tsp
ectrum
ofπ−
mes
ons
asa
func
tion
ofdi
ffer
entn
kin
terv
als
15
Fig
.13,
c.Tra
nsve
rse
ener
gyE
tsp
ectrum
ofπ−
mes
ons
asa
func
tion
ofdi
ffer
entn
kin
terv
als
16
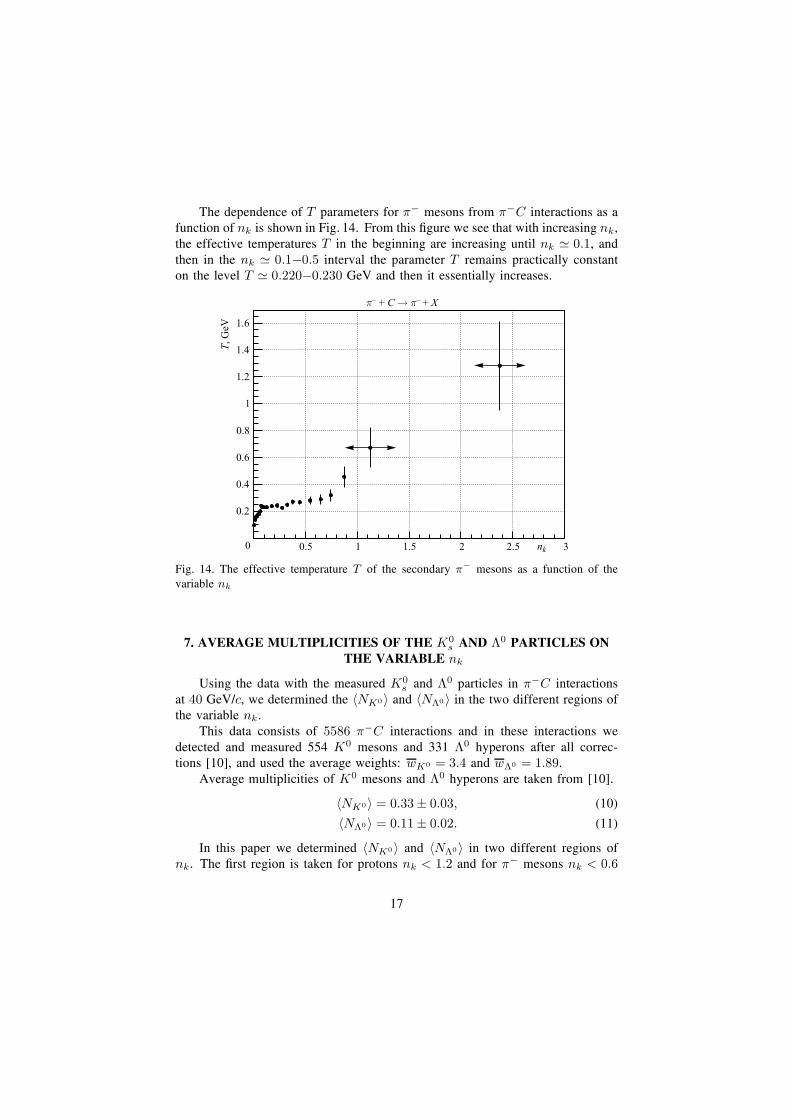
The dependence of T parameters for π− mesons from π−C interactions as afunction of nk is shown in Fig. 14. From this ˇgure we see that with increasing nk,the effective temperatures T in the beginning are increasing until nk � 0.1, andthen in the nk � 0.1−0.5 interval the parameter T remains practically constanton the level T � 0.220−0.230 GeV and then it essentially increases.
Fig. 14. The effective temperature T of the secondary π− mesons as a function of thevariable nk
7. AVERAGE MULTIPLICITIES OF THE K0s AND Λ0 PARTICLES ON
THE VARIABLE nk
Using the data with the measured K0s and Λ0 particles in π−C interactions
at 40 GeV/c, we determined the 〈NK0〉 and 〈NΛ0〉 in the two different regions ofthe variable nk.
This data consists of 5586 π−C interactions and in these interactions wedetected and measured 554 K0 mesons and 331 Λ0 hyperons after all correc-tions [10], and used the average weights: wK0 = 3.4 and wΛ0 = 1.89.
Average multiplicities of K0 mesons and Λ0 hyperons are taken from [10].
〈NK0〉 = 0.33 ± 0.03, (10)
〈NΛ0〉 = 0.11 ± 0.02. (11)
In this paper we determined 〈NK0〉 and 〈NΛ0〉 in two different regions ofnk. The ˇrst region is taken for protons nk < 1.2 and for π− mesons nk < 0.6
17
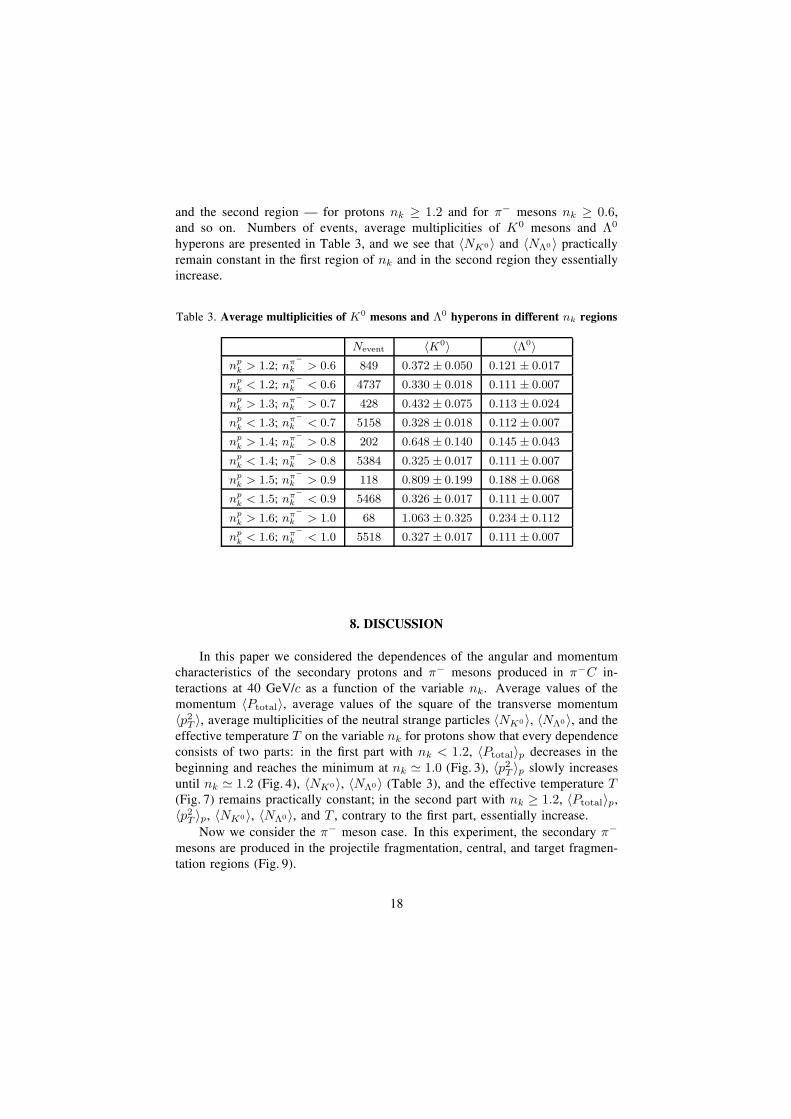
and the second region Å for protons nk ≥ 1.2 and for π− mesons nk ≥ 0.6,and so on. Numbers of events, average multiplicities of K0 mesons and Λ0
hyperons are presented in Table 3, and we see that 〈NK0〉 and 〈NΛ0〉 practicallyremain constant in the ˇrst region of nk and in the second region they essentiallyincrease.
Table 3. Average multiplicities of K0 mesons and Λ0 hyperons in different nk regions
Nevent 〈K0〉 〈Λ0〉np
k > 1.2; nπ−k > 0.6 849 0.372 ± 0.050 0.121 ± 0.017
npk < 1.2; nπ−
k < 0.6 4737 0.330 ± 0.018 0.111 ± 0.007
npk > 1.3; nπ−
k > 0.7 428 0.432 ± 0.075 0.113 ± 0.024
npk < 1.3; nπ−
k < 0.7 5158 0.328 ± 0.018 0.112 ± 0.007
npk > 1.4; nπ−
k > 0.8 202 0.648 ± 0.140 0.145 ± 0.043
npk < 1.4; nπ−
k > 0.8 5384 0.325 ± 0.017 0.111 ± 0.007
npk > 1.5; nπ−
k > 0.9 118 0.809 ± 0.199 0.188 ± 0.068
npk < 1.5; nπ−
k < 0.9 5468 0.326 ± 0.017 0.111 ± 0.007
npk > 1.6; nπ−
k > 1.0 68 1.063 ± 0.325 0.234 ± 0.112
npk < 1.6; nπ−
k < 1.0 5518 0.327 ± 0.017 0.111 ± 0.007
8. DISCUSSION
In this paper we considered the dependences of the angular and momentumcharacteristics of the secondary protons and π− mesons produced in π−C in-teractions at 40 GeV/c as a function of the variable nk. Average values of themomentum 〈Ptotal〉, average values of the square of the transverse momentum〈p2
T 〉, average multiplicities of the neutral strange particles 〈NK0〉, 〈NΛ0〉, and theeffective temperature T on the variable nk for protons show that every dependenceconsists of two parts: in the ˇrst part with nk < 1.2, 〈Ptotal〉p decreases in thebeginning and reaches the minimum at nk � 1.0 (Fig. 3), 〈p2
T 〉p slowly increasesuntil nk � 1.2 (Fig. 4), 〈NK0〉, 〈NΛ0〉 (Table 3), and the effective temperature T(Fig. 7) remains practically constant; in the second part with nk ≥ 1.2, 〈Ptotal〉p,〈p2
T 〉p, 〈NK0〉, 〈NΛ0〉, and T , contrary to the ˇrst part, essentially increase.Now we consider the π− meson case. In this experiment, the secondary π−
mesons are produced in the projectile fragmentation, central, and target fragmen-tation regions (Fig. 9).
18
With the increasing variable nk, 〈Ptotal〉π− decrease and reach the minimumat nk � 0.4−0.5 and then they are essentially increasing (Fig. 10) as in the caseof protons. We would like to note that the nk values which give the minimafor protons (nk � 1.0) and for π− mesons (nk � 0.4) are different. 〈p2
T 〉π−
and the parameters T for π− mesons contrary to the proton case, are noticeablyincreasing until nk � 0.1 and then the dependences remain practically constant(or increase very slowly) until nk � 0.4 ÷ 0.5 and then in the region nk ≥ 0.5they again give the essential increasing. So we observe the essential changing ofthe behaviours of the angular and momentum characteristics of protons and π−
mesons from π−C interactions at 40 GeV/c on the variable nk in two differentregions for protons and in three different regions for π− mesons. Such behavioursmay suggest different mechanism of particle production in these regions of thevariable nk (or t) and temperature T . If so, the ˇrst region with nk < 0.1T ≤ 0.220 GeV for π− mesons is connected with the thermalization of thestrongly interacting objects, and the second region with 0.1 < nk ≤ 0.5 for π−
mesons and 0.4 < nk ≤ 1.2 for protons in which the parameter T is practicallyconstant, may suggest that the equilibrium state formation (hadron +QGP state)and the third region with nk ≥ 0.5 for mesons and nk ≥ 1.2 for protons can beconnected with the production of pure QGP state.
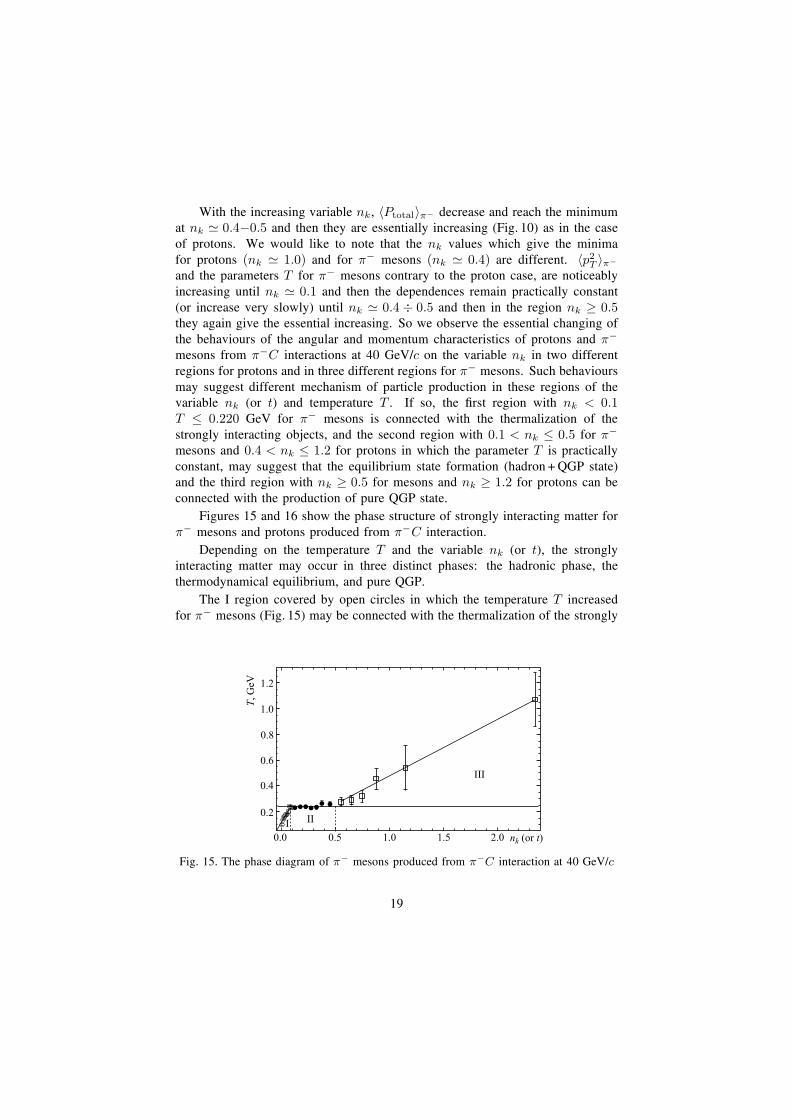
Figures 15 and 16 show the phase structure of strongly interacting matter forπ− mesons and protons produced from π−C interaction.
Depending on the temperature T and the variable nk (or t), the stronglyinteracting matter may occur in three distinct phases: the hadronic phase, thethermodynamical equilibrium, and pure QGP.
The I region covered by open circles in which the temperature T increasedfor π− mesons (Fig. 15) may be connected with the thermalization of the strongly
Fig. 15. The phase diagram of π− mesons produced from π−C interaction at 40 GeV/c
19
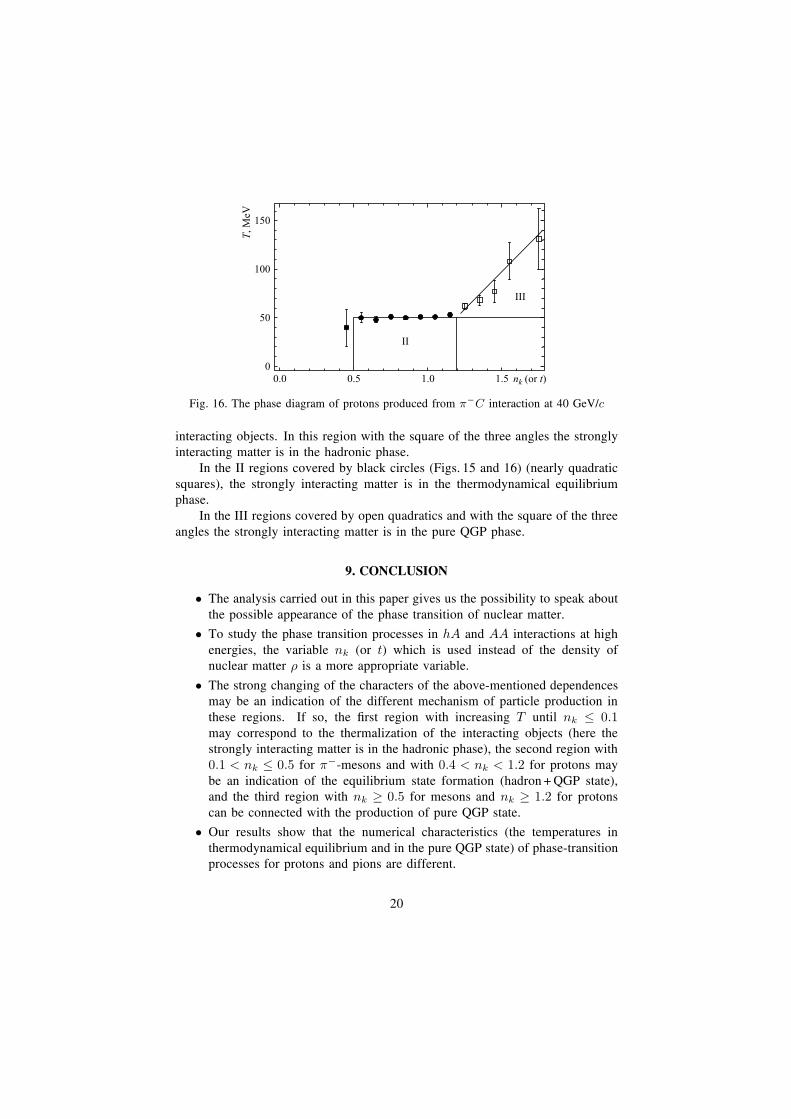
Fig. 16. The phase diagram of protons produced from π−C interaction at 40 GeV/c
interacting objects. In this region with the square of the three angles the stronglyinteracting matter is in the hadronic phase.
In the II regions covered by black circles (Figs. 15 and 16) (nearly quadraticsquares), the strongly interacting matter is in the thermodynamical equilibriumphase.
In the III regions covered by open quadratics and with the square of the threeangles the strongly interacting matter is in the pure QGP phase.
9. CONCLUSION
• The analysis carried out in this paper gives us the possibility to speak aboutthe possible appearance of the phase transition of nuclear matter.
• To study the phase transition processes in hA and AA interactions at highenergies, the variable nk (or t) which is used instead of the density ofnuclear matter ρ is a more appropriate variable.
• The strong changing of the characters of the above-mentioned dependencesmay be an indication of the different mechanism of particle production inthese regions. If so, the ˇrst region with increasing T until nk ≤ 0.1may correspond to the thermalization of the interacting objects (here thestrongly interacting matter is in the hadronic phase), the second region with0.1 < nk ≤ 0.5 for π−-mesons and with 0.4 < nk < 1.2 for protons maybe an indication of the equilibrium state formation (hadron +QGP state),and the third region with nk ≥ 0.5 for mesons and nk ≥ 1.2 for protonscan be connected with the production of pure QGP state.
• Our results show that the numerical characteristics (the temperatures inthermodynamical equilibrium and in the pure QGP state) of phase-transitionprocesses for protons and pions are different.
20
Acknowledgments. We would like to express our thanks to prof. Kh.Namsrai,Prof. G.Ganbold, Prof. A. S. Sorin, Prof. A.V. Efremov and Prof. O.V. Teryaevfor their valuable discussions and remarks.
REFERENCES
1. Baldin A.M. // Particles and Nuclei. 1977. V. 8. P. 429.
2. Collins J. C., Perry M. J. // Phys. Rev. Lett. 1975. V. 34. P. 1353.
3. Polyakov A. M. // Phys. Lett. B. 1975. V. 59. P. 82.4. Polyakov A. M. // Phys. Lett. B. 1978. V. 72. P. 477.
5. Gavani R. V., Sats H. // Phys. Lett. B. 1984. V. 145. P. 248.
6. Baatar Ts. et al. JINR, P1-89424. Dubna, 1989.7. Baatar Ts. et al. // J. Nucl. Phys. 1990. V. 52. P. 3(9),
8. Balea O. et al. // Phys. Lett. B. 1972. V. 39. P. 571.9. Abdurahmanov A. J. et al. JINR, P1-6937. Dubna, 1973.
10. Angelov N. et al. JINR, P1-9209. Dubna, 1975.
11. Hagedorn R. // Nouvo Cim. Suppl. 1965. V. 3. P. 147.
12. Rischke Dirk H. arXiv:nucl-th/0305030v2.
Received on February 8, 2012.
�¥¤ ±Éμ· �.‚. ˆ¢ ϱ¥¢¨Î
�줶¨¸ ´μ ¢ ¶¥Î ÉÓ 09.06.2012.”μ·³ É 60× 90/16. �ʳ £ μ˸¥É´ Ö. �¥Î ÉÓ μ˸¥É´ Ö.
“¸². ¶¥Î. ². 1,5. “Î.-¨§¤. ². 2,06. ’¨· ¦ 340 Ô±§. ‡ ± § º 57670.
ˆ§¤ É¥²Ó¸±¨° μɤ¥² �¡Ñ¥¤¨´¥´´μ£μ ¨´¸É¨ÉÊÉ Ö¤¥·´ÒÌ ¨¸¸²¥¤μ¢ ´¨°141980, £. „Ê¡´ , Œμ¸±μ¢¸± Ö μ¡²., ʲ.†μ²¨μ-ŠÕ·¨, 6.
E-mail: [email protected]/publish/


![agenda.infn.it · Issues of the MSSM) [GeV] 1 t ~ m(200 300 400 500 600 700 800 900 1000) [GeV] 1 0 c ~ m(0 100 200 300 400 500 600 700 800 1 0 c W b ~ ® 1 t ~ / 1 0 c ~ ® t 1 t](https://static.fdocument.org/doc/165x107/5e9b180535942256b30ec81b/issues-of-the-mssm-gev-1-t-m200-300-400-500-600-700-800-900-1000-gev-1.jpg)


![wwnd10 jamaica salur finalSevil&Salur& 6 E. Bruna%[STARCollabora=on],% QuarkMaVer%2009% Jet (GeV/c) T p 0 10 20 30 40 50 60-1) (GeV/c)d d T dN/(dp event 1/N 10-9 10-8 10-7 10-6 10-5](https://static.fdocument.org/doc/165x107/5e3c464c0ff882545c7ab097/wwnd10-jamaica-salur-final-sevilsalur-6-e-brunastarcollaboraon.jpg)
![R in Low Energy e e [Ecm 5 GeV] · Table 1. R(Ecm≲5 GeV) from different laboratories Place Ring Detector Ecm(GeV) ptsYear Beijing BEPC BESII 2.0-5.0 1061998 -1999 Novosibirsk VEPP-2M](https://static.fdocument.org/doc/165x107/5f7c79d3af794e434822d967/r-in-low-energy-e-e-ecm-5-gev-table-1-recma5-gev-from-different-laboratories.jpg)