Pearson’s Chi-Square Test Modifications for Comparison of ...
Antenna Characterisation for Amplitude Comparison inElectronic Warfare Systems
Simon Brownα, James Irvineβ, Adrian Metcalfeγ
αInstitute for System Level IntegrationHeriot-Watt University Research Park, Edinburgh, EH14 4AP, UK
βUniversity Of StrathclydeRoyal College Building, 204 George Street, Glasgow, G1 1XW, UK
γTeledyne DefenceAiredale House, Acorn Park, Shipley, BD17 7SW, UK
22nd October 2010
Abstract
Radar warning receivers listen for pulses from radars of interest. The angle of arrival of each pulseis needed for pulse processing and location purposes. It can be accurately calculated using phasecomparison, but this method is often impractical and expensive. This paper describes the authorsattempts to use the less accurate method of amplitude comparison to provide adequate accuracy foruse in a novel low cost radar warning receiver.
Introduction
The Radar is regarded as perhaps the biggest advance in remote sensing since the invention of thetelescope [1]. Consequently since then methods have been sought to impair radar performance and toturn radar operation into a weakness. Such activity is referred to as electronic warfare (EW) and playsa major part in modern warfare. An ideal radar has enough transmit power to be able to illuminatetargets at the desired operating range, enough resolution to be able to separate targets of interest andis able to measure both the range and velocity of those targets. These requirements place constraints onthe type of signal a radar can emit and thereby provide a useful set of characteristics an eavesdroppercan use to identify a radar.
Such listening devices fall into two categories, radar warning receivers (RWR) and Electronic Supportmeasures (ESM). RWRs are the simpler of the two and perform a platform protection role. They warnthe operator of the presence of a radar of interest and may be able to indicate if they are being tracked bythe radar. As an example RWRs are often fitted to military jets and are used to warn of the presence ofenemy air defences, whether they are being tracked by the defences and whether an anti-aircraft missilehas been launched in their direction. ESMs are more sophisticated in that they can provide all of the
1
functionality of a RWR but also the ability to detect unexpected and characterise previously unknownradars. Their role is primarily intelligence gathering rather than protection.
As the exact nature and location of the radars of interest is not known in advance, RWR and ESMsystems have to listen across the entire radar band and have antennas that can receive emissions from alldirections. A radar pulse characteriser is able to measure the characteristics of individual radar pulsessuch as their width or frequency but some important data can only be inferred such as pulses repetitionfrequency and angle of arrival. The more data that can be gathered, the more exactly the radar can becharacterised.
Angle of arrival (AOA) is often used as the key parameter for deinterleaving the received pulses. That isattributing a received pulse to the pulse train of one emitter rather than another. If it is known that twopulses have come from the same direction, the chances have improved that they have come from the samesource. Once the pulse trains have been separated it is much easier to identify the emitter. There are twotechniques commonly used to calculate angle of arrival, both of which rely upon comparing how the samepulse was received by multiple antennas. If the antennas are phase matched and are situated a knowndistance apart, phase comparison can be used. This technique has an accuracy of less than 1 degree butis less commonly used. As well as being more expensive it requires the siting of three or more antennasat multiple points around the platform. Expensive protection is fitted to expensive platforms whichnormally have a long service life. This makes it very hard to fit to existing high value platforms whichwere not designed around such antennas, and platforms such as jets with strict aerodynamic constraints.The comparatively inexpensive option is amplitude comparison which is normally quoted as having a10 degree error [3]. It requires single antennas placed at multiple points on the platform and uses theknown antenna gain patterns to calculate the AOA of the pulse.
Teledyne Defence Ltd has developed a new RWR/ESM system called Phobos. Phobos was designedto challenge the accepted view of the role of RWR and ESM systems by being significantly smaller,lighter, lower power and lower cost than anything currently available. This allows it to be fitted to lowercost platforms and to be used in new ways. This paper describes the authors’ work to characterise theantennas on a prototype Phobos system to allow the measurement of angle of arrival accuracy.
System Description
The Phobos prototype consists of a RR017 [2] pulse characteriser, processing board, digital compass,GPS and 4 antennas. The prototype is shown in Figure 1 with the lid removed. The RR017 is the deviceconnected to the four antennas and rests on top of the computer. The RR017 has four ports but onlytwo active channels. The two active channels are switched around the four ports to provide full 360degree azimuth coverage. When a pulse is detected, the RR017 sends to the processing board a pulsedescriptor word (PDW) which contains a variety of information including width and frequency of thepulse and the amplitude measurements from each channel. The processing board then passes the pulsedescriptor words through an algorithm which performs both the deinterleaving and the identificationstep. For pulses of interest the AOA then needs to be calculated, duplicates removed and the resultingdata passed to the operator.
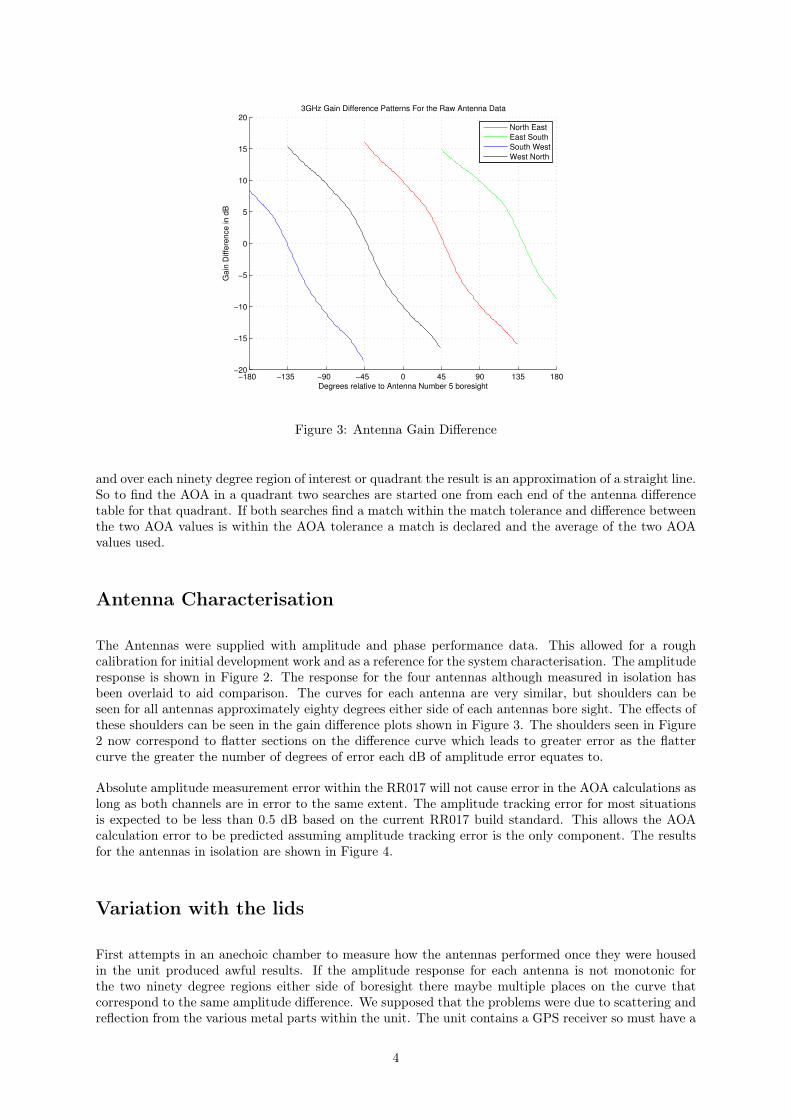
The Angle of arrival is calculated in a very simple manner. It is assumed that the only reason for avariation in amplitude between the two channels is due to the difference in antenna gain caused byantenna variation and orientation. Once the antennas have been characterised, the AOA can then becalculated. The antenna gain patterns at 3GHz are shown in Figure 2.
2
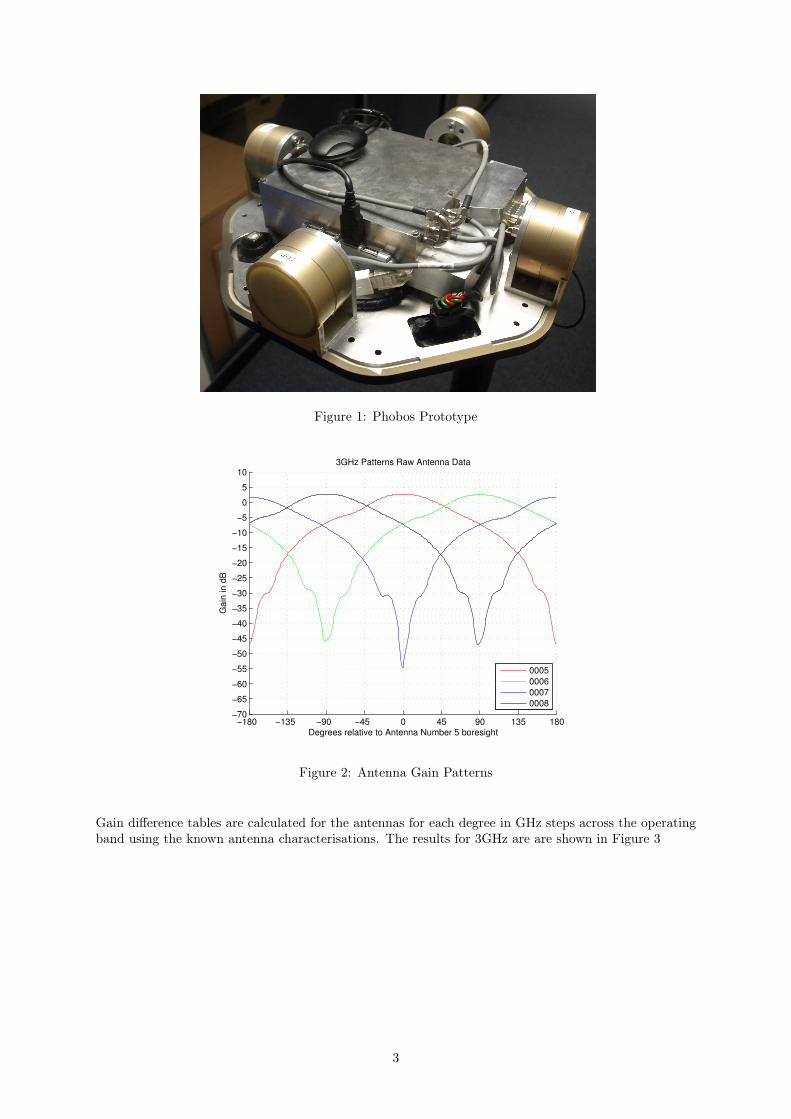
Figure 1: Phobos Prototype
−180 −135 −90 −45 0 45 90 135 180−70
−65
−60
−55
−50
−45
−40
−35
−30
−25
−20
−15
−10
−5
0
5
103GHz Patterns Raw Antenna Data
Degrees relative to Antenna Number 5 boresight
Ga
in in
dB
0005
0006
0007
0008
Figure 2: Antenna Gain Patterns
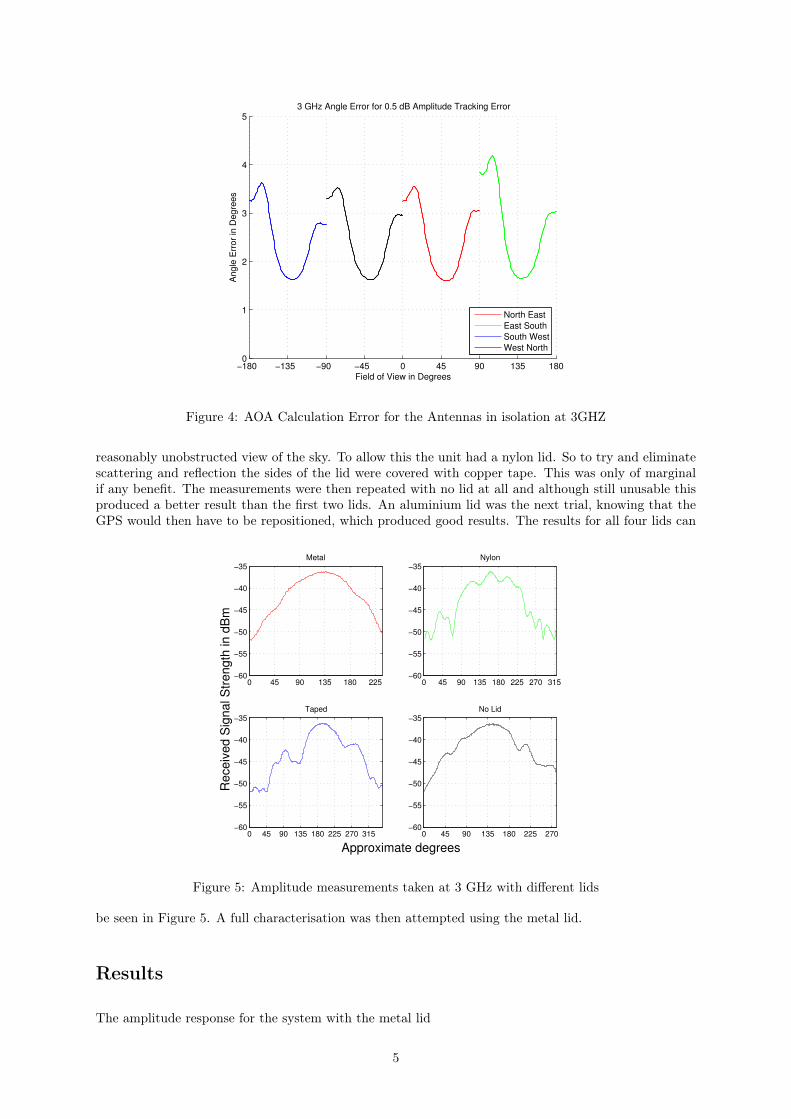
Gain difference tables are calculated for the antennas for each degree in GHz steps across the operatingband using the known antenna characterisations. The results for 3GHz are are shown in Figure 3
3
−180 −135 −90 −45 0 45 90 135 180−20
−15
−10
−5
0
5
10
15
203GHz Gain Difference Patterns For the Raw Antenna Data
Degrees relative to Antenna Number 5 boresight
Ga
in D
iffe
ren
ce
in
dB
North East
East South
South West
West North
Figure 3: Antenna Gain Difference
and over each ninety degree region of interest or quadrant the result is an approximation of a straight line.So to find the AOA in a quadrant two searches are started one from each end of the antenna differencetable for that quadrant. If both searches find a match within the match tolerance and difference betweenthe two AOA values is within the AOA tolerance a match is declared and the average of the two AOAvalues used.
Antenna Characterisation
The Antennas were supplied with amplitude and phase performance data. This allowed for a roughcalibration for initial development work and as a reference for the system characterisation. The amplituderesponse is shown in Figure 2. The response for the four antennas although measured in isolation hasbeen overlaid to aid comparison. The curves for each antenna are very similar, but shoulders can beseen for all antennas approximately eighty degrees either side of each antennas bore sight. The effects ofthese shoulders can be seen in the gain difference plots shown in Figure 3. The shoulders seen in Figure2 now correspond to flatter sections on the difference curve which leads to greater error as the flattercurve the greater the number of degrees of error each dB of amplitude error equates to.
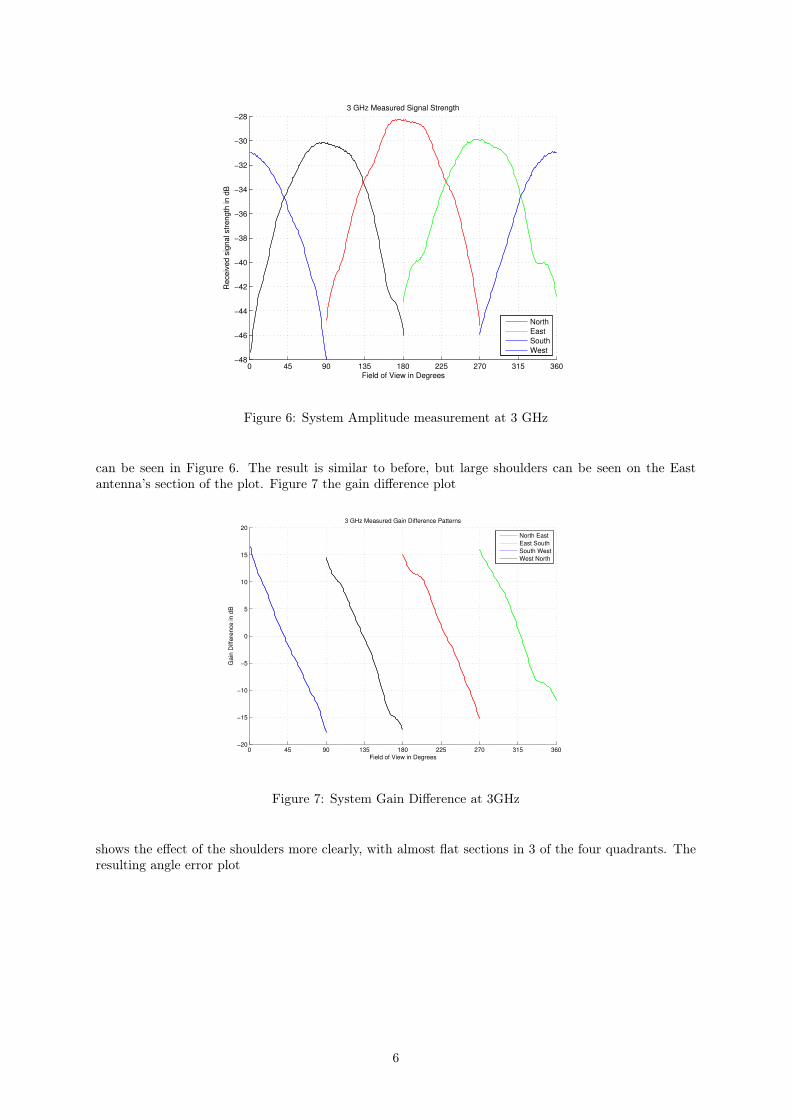
Absolute amplitude measurement error within the RR017 will not cause error in the AOA calculations aslong as both channels are in error to the same extent. The amplitude tracking error for most situationsis expected to be less than 0.5 dB based on the current RR017 build standard. This allows the AOAcalculation error to be predicted assuming amplitude tracking error is the only component. The resultsfor the antennas in isolation are shown in Figure 4.
Variation with the lids
First attempts in an anechoic chamber to measure how the antennas performed once they were housedin the unit produced awful results. If the amplitude response for each antenna is not monotonic forthe two ninety degree regions either side of boresight there maybe multiple places on the curve thatcorrespond to the same amplitude difference. We supposed that the problems were due to scattering andreflection from the various metal parts within the unit. The unit contains a GPS receiver so must have a
4
−180 −135 −90 −45 0 45 90 135 1800
1
2
3
4
53 GHz Angle Error for 0.5 dB Amplitude Tracking Error
Field of View in Degrees
An
gle
Err
or
in D
eg
ree
s
North East
East South
South West
West North
Figure 4: AOA Calculation Error for the Antennas in isolation at 3GHZ
reasonably unobstructed view of the sky. To allow this the unit had a nylon lid. So to try and eliminatescattering and reflection the sides of the lid were covered with copper tape. This was only of marginalif any benefit. The measurements were then repeated with no lid at all and although still unusable thisproduced a better result than the first two lids. An aluminium lid was the next trial, knowing that theGPS would then have to be repositioned, which produced good results. The results for all four lids can
Approximate degrees
Re
ceiv
ed S
ignal S
trength
in d
Bm
0 45 90 135 180 225−60
−55
−50
−45
−40
−35Metal
0 45 90 135 180 225 270 315−60
−55
−50
−45
−40
−35Nylon
0 45 90 135 180 225 270 315−60
−55
−50
−45
−40
−35Taped
0 45 90 135 180 225 270−60
−55
−50
−45
−40
−35No Lid
Figure 5: Amplitude measurements taken at 3 GHz with different lids
be seen in Figure 5. A full characterisation was then attempted using the metal lid.
Results
The amplitude response for the system with the metal lid
5
0 45 90 135 180 225 270 315 360−48
−46
−44
−42
−40
−38
−36
−34
−32
−30
−28
Field of View in Degrees
Re
ce
ive
d s
ign
al str
en
gth
in
dB
3 GHz Measured Signal Strength
North
East
South
West
Figure 6: System Amplitude measurement at 3 GHz
can be seen in Figure 6. The result is similar to before, but large shoulders can be seen on the Eastantenna’s section of the plot. Figure 7 the gain difference plot
0 45 90 135 180 225 270 315 360−20
−15
−10
−5
0
5
10
15
203 GHz Measured Gain Difference Patterns
Field of View in Degrees
Gain
Diffe
rence in d
B
North East
East South
South West
West North
Figure 7: System Gain Difference at 3GHz
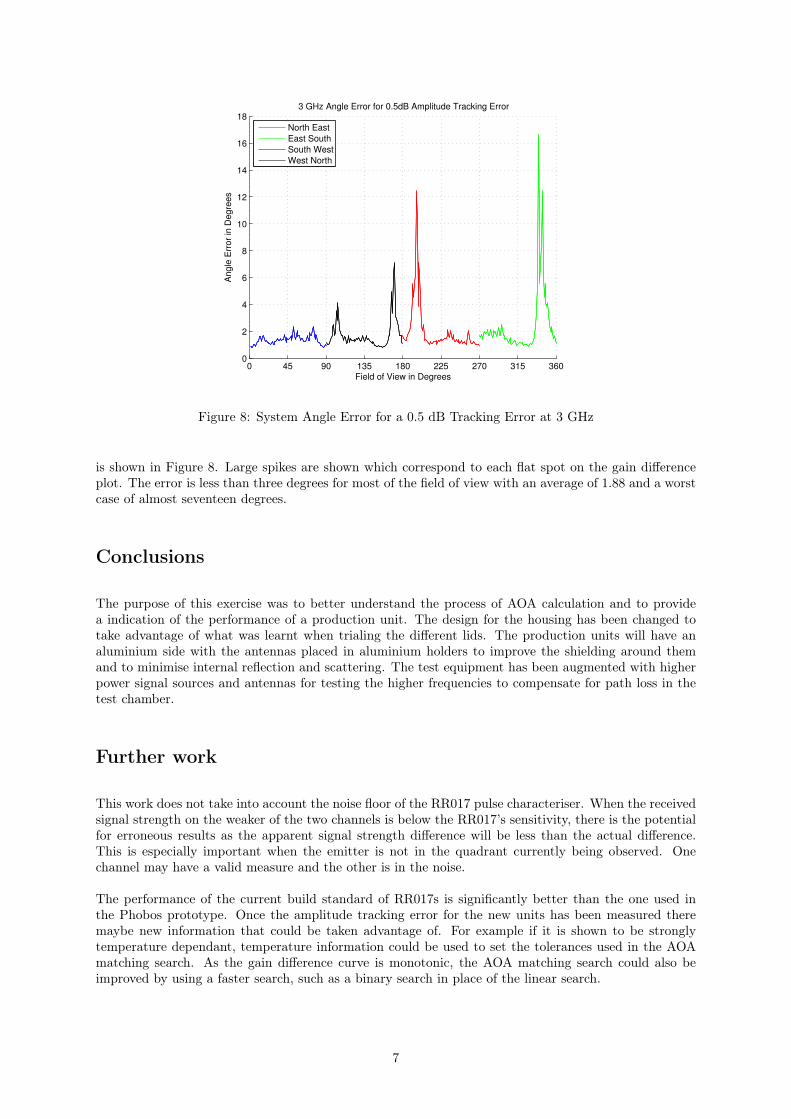
shows the effect of the shoulders more clearly, with almost flat sections in 3 of the four quadrants. Theresulting angle error plot
6
0 45 90 135 180 225 270 315 3600
2
4
6
8
10
12
14
16
183 GHz Angle Error for 0.5dB Amplitude Tracking Error
Field of View in Degrees
An
gle
Err
or
in D
eg
ree
s
North East
East South
South West
West North
Figure 8: System Angle Error for a 0.5 dB Tracking Error at 3 GHz
is shown in Figure 8. Large spikes are shown which correspond to each flat spot on the gain differenceplot. The error is less than three degrees for most of the field of view with an average of 1.88 and a worstcase of almost seventeen degrees.
Conclusions
The purpose of this exercise was to better understand the process of AOA calculation and to providea indication of the performance of a production unit. The design for the housing has been changed totake advantage of what was learnt when trialing the different lids. The production units will have analuminium side with the antennas placed in aluminium holders to improve the shielding around themand to minimise internal reflection and scattering. The test equipment has been augmented with higherpower signal sources and antennas for testing the higher frequencies to compensate for path loss in thetest chamber.
Further work
This work does not take into account the noise floor of the RR017 pulse characteriser. When the receivedsignal strength on the weaker of the two channels is below the RR017’s sensitivity, there is the potentialfor erroneous results as the apparent signal strength difference will be less than the actual difference.This is especially important when the emitter is not in the quadrant currently being observed. Onechannel may have a valid measure and the other is in the noise.
The performance of the current build standard of RR017s is significantly better than the one used inthe Phobos prototype. Once the amplitude tracking error for the new units has been measured theremaybe new information that could be taken advantage of. For example if it is shown to be stronglytemperature dependant, temperature information could be used to set the tolerances used in the AOAmatching search. As the gain difference curve is monotonic, the AOA matching search could also beimproved by using a faster search, such as a binary search in place of the linear search.
7
Acknowledgments
The authors would like to thanks Professor Raed Abd-Alhameed and Dr Chan See of Bradford Universityfor their invaluable assistance with this work.
References
[1] Barton, D. K., Radar Systems Analysis, Dedham, MA, USA: Artech House, 1976, p. 1.
[2] Teledyne Defence Ltd, RR017 Data Sheet, http://www.teledynedefence.co.uk/pdf/RR017_Teledyne.pdf
[3] Selex Galileo, SEER a digital RWR for modern fighters, http://www.selex-sas.com/EN/Common/files/SELEX_Galileo/Products/SEER_digital_RWR_dsh.pdf
8