and heavy elements in the outer disk. - arXiv · and heavy elements in the outer disk. ... from...
17
Astronomy & Astrophysics manuscript no. lemasle c ESO 2018 October 29, 2018 Galactic abundance gradients from Cepheids: ? α and heavy elements in the outer disk. B. Lemasle 1,2 , P. Franc ¸ois 3,4 , K. Genovali 5 , V. V. Kovtyukh 6 , G. Bono 5,7 , L. Inno 5,10 , C. D. Laney 8,9 , L. Kaper 1 , M. Bergemann 10 , M. Fabrizio 11 , N. Matsunaga 12 , S. Pedicelli 5 , F. Primas 13 , and M. Romaniello 13 1 Astronomical Institute Anton Pannekoek, Science Park 904, P.O. Box 94249, 1090 GE Amsterdam, The Netherlands [email protected] 2 Kapteyn Astronomical Institute, Landleven 12, 9747 AD Groningen, The Netherlands 3 GEPI - Observatoire de Paris, 64 Avenue de l’Observatoire, 75014 Paris, France 4 UPJV - Universit´ e de Picardie Jules Verne, 80000 Amiens, France 5 Dipartimento di Fisica, Universit` a di Roma Tor Vergata, via della Ricerca Scientifica 1, 00133 Rome, Italy 6 Astronomical Observatory of Odessa National University, and Isaac Newton Institute of Chile, Odessa branch, Shevchenko Park, 65014, Odessa, Ukraine 7 INAF - Osservatorio Astronomico di Roma, via Frascati 33, Monte Porzio Catone, Rome, Italy 8 South African Astronomical Observatory, P.O. Box 9, Observatory 7935, South Africa 9 Department of Physics and Astronomy, Western Kentucky University, 1906 College Heights Blvd, Bowling Green, KY 42101- 1077,USA 10 Max Planck Institute for Astrophysics, Karl-Schwarzschild-Str. 1, D-85741 Garching bei Munchen, Germany 11 INAF - Osservatorio Astronomico Collurania, Via M. Maggini, 64100 Teramo, Italy 12 Department of Astronomy, School of Science, The University of Tokyo, 7-3-1 Hongo, Bunkyo-ku, Tokyo 113-0033, Japan 13 European Southern Observatory, Karl-Schwarzschild-Str. 2, D-85748 Garching bei Munchen, Germany Received September 15, 1996; accepted March 16, 1997 ABSTRACT Context. Galactic abundance gradients set strong constraints to chemo-dynamical evolutionary models of the Milky Way. Given the period-luminosity relations that provide accurate distances and the large number of spectral lines, Cepheids are excellent tracers of the present-day abundance gradients. Aims. We want to measure the Galactic abundance gradient of several chemical elements. While the slope of the Cepheid iron gradient did not vary much from the very first studies, the gradients of the other elements are not that well constrained. In this paper we focus on the inner and outer regions of the Galactic thin disk. Methods. We use high-resolution spectra (FEROS, ESPADONS, NARVAL) to measure the abundances of several light (Na, Al), α (Mg, Si, S, Ca), and heavy elements (Y, Zr, La, Ce, Nd, Eu) in a sample of 65 Milky Way Cepheids. Combining these results with accurate distances from period-Wesenheit relations in the near infrared enables us to determine the abundance gradients in the Milky Way. Results. Our results are in good agreement with previous studies on either Cepheids or other tracers. In particular, we confirm an upward shift of ≈0.2 dex for the Mg abundances, as has recently been reported. We also confirm the existence of a gradient for all the heavy elements studied in the context of a local thermodynamic equilibrium analysis. However, for Y, Nd, and especially La, we find lower abundances for Cepheids in the outer disk than reported in previous studies, leading to steeper gradients. This effect can be explained by the differences in the line lists used by different groups. Conclusions. Our data do not support a flattening of the gradients in the outer disk, in agreement with recent Cepheid studies and chemo-dynamical simulations. This is in contrast to the open cluster observations but remains compatible with a picture where the transition zone between the inner disk and the outer disk would move outward with time. Key words. stars: abundances - stars: supergiants - stars: variables: Cepheids - Galaxy: abundances - Galaxy: evolution - Galaxy: disk ? Based on observations obtained at the Canada-France-Hawaii Telescope (CFHT), which is operated by the National Research Council of Canada, the Institut National des Sciences de l’Univers of the Centre National de la Recherche Scientifique of France, and the University of Hawaii. Based on observations collected with FEROS at the European Southern Observatory (La Silla, Chile) under proposal ID: 60.A- 9120. Based on observations obtained at the Telescope Bernard Lyot (USR5026) operated by the Observatoire Midi-Pyr´ en´ ees and the Institut National des Science de lUnivers of the Centre National de la Recherche Scientifique of France. The data of NARVAL were reduced using the 1. Introduction The distribution of the elements along the disk of galaxies is influenced by the star formation history (SFH), accretion events, radial flows of gas, and radial mixing of stars. It usually follows a radial gradient. Radial abundance gradients are therefore used to constrain models describing the formation and evolution of data reduction software Libre-ESpRIT, written and provided by J.-F. Donati from the LATT (Observatoire Midi-Pyr´ en´ ees) 1 arXiv:1308.3249v1 [astro-ph.GA] 14 Aug 2013
Transcript of and heavy elements in the outer disk. - arXiv · and heavy elements in the outer disk. ... from...

Astronomy & Astrophysics manuscript no. lemasle c© ESO 2018October 29, 2018
Galactic abundance gradients from Cepheids:?
α and heavy elements in the outer disk.
B. Lemasle1,2, P. Francois3,4, K. Genovali5, V. V. Kovtyukh6, G. Bono5,7, L. Inno5,10, C. D. Laney8,9, L. Kaper1,M. Bergemann10, M. Fabrizio11, N. Matsunaga12, S. Pedicelli5, F. Primas13, and M. Romaniello13
1 Astronomical Institute Anton Pannekoek, Science Park 904, P.O. Box 94249, 1090 GE Amsterdam, The [email protected]
2 Kapteyn Astronomical Institute, Landleven 12, 9747 AD Groningen, The Netherlands3 GEPI - Observatoire de Paris, 64 Avenue de l’Observatoire, 75014 Paris, France4 UPJV - Universite de Picardie Jules Verne, 80000 Amiens, France5 Dipartimento di Fisica, Universita di Roma Tor Vergata, via della Ricerca Scientifica 1, 00133 Rome, Italy6 Astronomical Observatory of Odessa National University, and Isaac Newton Institute of Chile, Odessa branch, Shevchenko Park,
65014, Odessa, Ukraine7 INAF - Osservatorio Astronomico di Roma, via Frascati 33, Monte Porzio Catone, Rome, Italy8 South African Astronomical Observatory, P.O. Box 9, Observatory 7935, South Africa9 Department of Physics and Astronomy, Western Kentucky University, 1906 College Heights Blvd, Bowling Green, KY 42101-
1077,USA10 Max Planck Institute for Astrophysics, Karl-Schwarzschild-Str. 1, D-85741 Garching bei Munchen, Germany11 INAF - Osservatorio Astronomico Collurania, Via M. Maggini, 64100 Teramo, Italy12 Department of Astronomy, School of Science, The University of Tokyo, 7-3-1 Hongo, Bunkyo-ku, Tokyo 113-0033, Japan13 European Southern Observatory, Karl-Schwarzschild-Str. 2, D-85748 Garching bei Munchen, Germany
Received September 15, 1996; accepted March 16, 1997
ABSTRACT
Context. Galactic abundance gradients set strong constraints to chemo-dynamical evolutionary models of the Milky Way. Given theperiod-luminosity relations that provide accurate distances and the large number of spectral lines, Cepheids are excellent tracers ofthe present-day abundance gradients.Aims. We want to measure the Galactic abundance gradient of several chemical elements. While the slope of the Cepheid iron gradientdid not vary much from the very first studies, the gradients of the other elements are not that well constrained. In this paper we focuson the inner and outer regions of the Galactic thin disk.Methods. We use high-resolution spectra (FEROS, ESPADONS, NARVAL) to measure the abundances of several light (Na, Al),α (Mg, Si, S, Ca), and heavy elements (Y, Zr, La, Ce, Nd, Eu) in a sample of 65 Milky Way Cepheids. Combining these results withaccurate distances from period-Wesenheit relations in the near infrared enables us to determine the abundance gradients in the MilkyWay.Results. Our results are in good agreement with previous studies on either Cepheids or other tracers. In particular, we confirm anupward shift of ≈0.2 dex for the Mg abundances, as has recently been reported. We also confirm the existence of a gradient for allthe heavy elements studied in the context of a local thermodynamic equilibrium analysis. However, for Y, Nd, and especially La, wefind lower abundances for Cepheids in the outer disk than reported in previous studies, leading to steeper gradients. This effect can beexplained by the differences in the line lists used by different groups.Conclusions. Our data do not support a flattening of the gradients in the outer disk, in agreement with recent Cepheid studies andchemo-dynamical simulations. This is in contrast to the open cluster observations but remains compatible with a picture where thetransition zone between the inner disk and the outer disk would move outward with time.
Key words. stars: abundances - stars: supergiants - stars: variables: Cepheids - Galaxy: abundances - Galaxy: evolution - Galaxy:disk
? Based on observations obtained at the Canada-France-HawaiiTelescope (CFHT), which is operated by the National Research Councilof Canada, the Institut National des Sciences de l’Univers of the CentreNational de la Recherche Scientifique of France, and the University ofHawaii. Based on observations collected with FEROS at the EuropeanSouthern Observatory (La Silla, Chile) under proposal ID: 60.A-9120. Based on observations obtained at the Telescope Bernard Lyot(USR5026) operated by the Observatoire Midi-Pyrenees and the InstitutNational des Science de lUnivers of the Centre National de la RechercheScientifique of France. The data of NARVAL were reduced using the
1. Introduction
The distribution of the elements along the disk of galaxies isinfluenced by the star formation history (SFH), accretion events,radial flows of gas, and radial mixing of stars. It usually followsa radial gradient. Radial abundance gradients are therefore usedto constrain models describing the formation and evolution of
data reduction software Libre-ESpRIT, written and provided by J.-F.Donati from the LATT (Observatoire Midi-Pyrenees)
1
arX
iv:1
308.
3249
v1 [
astr
o-ph
.GA
] 1
4 A
ug 2
013
B. Lemasle et al.: Galactic abundance gradients from Cepheids:
galaxies, in particular of the Milky Way.
Different observational tracers have been used to derivethe Galactic abundance gradients: HII regions, O/B-type stars,Cepheids, open clusters and planetary nebulae (PNe). Becausethe nature of these objects is different, it allows us to trace differ-ent elements and age groups, paving the way for time evolutionstudies that are still in their first faltering steps.
Compared to the other tracers, Cepheids present several ad-vantages: i) as famous primary distance indicators, they providevery accurate distances; ii) they are bright stars and can thusstill be observed at large distances from the Sun; iii) they arecool supergiants that present a large set of well-defined absorp-tion lines. Therefore accurate abundances of many elements canbe determined. On the other hand, the population of GalacticCepheids is still relatively poorly sampled, and the young ageof these stars (<200 Myr, Bono et al., 2005) allows us to studyonly the present-day gradient. As Cepheids are pulsating vari-able stars, one could wonder whether the phase of observationwould influence the abundance determination. However, Luck& Andrievsky (2004), Kovtyukh et al. (2005a), Andrievsky etal. (2005), and Luck et al. (2008) have demonstrated in a seriesof papers that results are extremely stable throughout the period,whatever the period of the star.
Since the early works of Harris (1981, 1984), the determi-nations of the Galactic iron gradient from Cepheids have beenremarkably consistent: Andrievsky et al. (2002a,b,c), Luck etal. (2003), Andrievsky et al. (2004), Kovtyukh et al. (2005b),Luck et al. (2006, 2011), Luck & Lambert (2011), Lemasle etal. (2007, 2008), and Pedicelli et al. (2009, 2010) all report avalue close to –0.06 dex/kpc. Cepheid abundances have alsobeen derived by Yong et al. (2006); Usenko et al. (2011a,b).
These values are in good agreement with studies based onother tracers, even if a direct comparison between them is quitedifficult: as already mentioned, different objects trace differentelements and different ages. The abundances in HII regions canbe derived from radio recombination lines, collisionally excitedlines, or optical recombination lines that lead to somewhat dis-crepant abundances (the same also holds for PNe). Therefore the[O/H] gradients span quite a large range of values, which is be-tween −0.030 dex/kpc and –0.08 dex/kpc if we consider only therecent determinations (e.g., Simpson et al., 1995; Afflerbach etal., 1996, 1997; Deharveng et al., 2000; Quireza et al., 2006b;Rudolph et al., 2006; Balser et al., 2011).
The gradients obtained with O-B1 stars vary between –0.03 and –0.07 dex/kpc (e.g., Smartt & Rolleston, 1997;Gummersbach et al., 1998; Daflon & Cunha, 2004b; Rollestonet al., 2000). As O-B1 stars are younger than 10 Myr, they tracethe present-day gradient even more closely than Cepheids.
There are numerous abundance studies of open clusters fromdifferent groups: Bragaglia et al. (2008), Carraro et al. (2007),Chen et al. (2003), Friel et al. (2002, 2010), Jacobson et al.(2008, 2009, 2011a,b), Magrini et al. (2009a, 2010), Pancino etal. (2010), Sestito et al. (2006, 2007), Yong et al. (2005, 2012).They all reach the same conclusion: a linear gradient of approxi-mately –0.06 dex/kpc extending quite far into the outer disk, anda flattening at a level of [Fe/H] ≈ –0.3 dex, somewhere between10 and 14 kpc. The only exception is Sestito et al. (2008), whoreport a larger slope of –0.17 dex/kpc in the inner part of thedisk.
Radial [O/H] gradients from PNe have values generally com-prised between –0.02 dex/kpc and –0.06 dex/kpc (Maciel etal., 1999; Costa et al., 2004; Henry et al., 2004; Perinotto &
Morbidelli, 2006; Henry et al., 2010). Pottasch & Bernard-Salas(2006) obtain better accuracies for their abundances becausethey measure transitions both in the visible and in the infrared.However, their sample does not extend beyond ≈10 kpc (wherethe most metal-poor PNe are found), which might be why theyreport a stronger gradient of –0.085 dex/kpc. In contrast to theother studies, Stanghellini et al. (2006) find no evidence of a gra-dient.
The time evolution of the metallicity gradients is still verycontroversial: from PNe, Maciel et al. (2003) found a flatteningof the gradient with time, while Stanghellini & Haywood (2010)report instead a steepening of the gradient and Henry et al.(2010) found no evolution with time. Most studies dividingopen clusters into age bins report a flattening with time. Whencombining several tracers, Maciel & Costa (2009) again founda flattening with time, while Magrini et al. (2009a) report onlymarginal evidence of gradients flattening with time in the 7-12kpc range. From a comparison between Open Clusters andCepheids, Yong et al. (2012) report a flattening of the gradientwith time in the [5–12] kpc range for all the elements consideredin their study.
However, a simple, linear gradient may not be the better wayto describe the distribution of the elements in the Galactic disk.From Cepheids, Andrievsky et al. (2002b), Pedicelli et al. (2009,2010), and Genovali et al. (2013a) found a steeper gradient inthe very inner disk (≤ 7 kpc). We have already mentioned thatmost of the studies based on open clusters find a flatter gradi-ent in the outer disk. In this region, the situation is much lessclear when considering other objects: e.g., Vilchez & Esteban(1996) (HII regions) and Costa et al. (2004) (PNe) report flatgradients in the outskirts of the Milky Way, while other authorsusing the same tracers do not. From Cepheids, a flattening gra-dient seemed well established (Andrievsky et al., 2002c; Luck etal., 2003; Andrievsky et al., 2004; Lemasle et al., 2008), but therecent addition of outer disk Cepheids in the sample (Luck et al.,2011; Luck & Lambert, 2011) weakens this hypothesis. A flat-tening gradient is also seen in external galaxies, (e.g., Bresolinet al., 2009a). Moreover, Yong et al. (2006) brought forward aninteresting feature: the flat structure in the outer disk may occurwith two different basement values, one at –0.5 dex and a secondone as low as –0.8 dex, possibly related to a merger event.
In addition, Twarog et al. (1997) suggested that insteadof a break in the slope the radial metallicity gradient couldexperience an abrupt drop of the order of 0.2–0.3 dex around10 kpc. This feature was also proposed in other studies (e.g.,Daflon & Cunha, 2004b; Andrievsky et al., 2004). From theopen cluster point of view, it is still not clear whether thisfeature is real or only due to a too coarse sampling, despitethe rapidly growing number of studies investigating this zone.Whether the metallicity distribution takes the shape of a step ormore simply of a change in the slope, the exact location of thetransition could be a bit further out in the disk and depend onthe cluster ages (e.g., Jacobson et al., 2011b). For Cepheids, thestep was probably an artifact due to a sampling effect (Lemasleet al., 2008; Luck et al., 2011; Luck & Lambert, 2011). Sucha feature in the outer disk is generally supported by theoreticalworks invoking variations of the gas density, the presence of abar, or the consequence of long-lived spiral structures (Scarano& Lepine, 2013).
Negative abundance gradients, comparable to those of theMilky Way, have also been reported in external spiral galaxies:e.g., M31 (Sanders et al., 2010), M33 (Barker et al., 2007;
2
B. Lemasle et al.: Galactic abundance gradients from Cepheids:
Magrini et al., 2009b), M83 (Bresolin et al., 2009a), NGC300 (Kudritzki et al., 2008; Vlajic et al., 2009; Bresolin etal., 2009b), NGC 7793 (Vlajic et al., 2009). In most cases thegradient also flattens in the outer disk.
The chemical enrichment of the Galaxy was first studiedby pure chemical evolution models, most of them based on theso-called inside-out scenario (e.g., Matteucci & Francois, 1989;Chiappini et al., 1997; Prantzos & Boissier, 2000; Chiappiniet al., 2001; Molla & Dıaz, 2005; Fu et al., 2009) in which theMilky Way primarily forms during two episodes of gas infall:the first one giving birth to the halo and the bulge and the secondone producing the disk. During the second infall, the pristinegas accumulates more slowly and preferentially in the innerparts of the disk, leading to a faster chemical enrichment ofthese regions. Therefore a negative abundance gradient naturallyarises within the Galactic disk. In particular, the model fromCescutti et al. (2007) computes radial gradients for numerouselements and closely reproduces Cepheid-based observations.Radial flows of gas (up to a few km/s, see Lacey & Fall, 1985;Portinari & Chiosi, 2000; Spitoni & Matteucci, 2011) must alsobe taken into account to properly fit the observational data, inparticular to recover the gas density distribution. Radial gasflows also enable steep enough gradients in the models (Spitoni& Matteucci (2011), but see Fu et al. (2013)) to be obtained,although the alternative explanation of a variable efficiency inthe star formation rate could have a similar effect (Colavitti etal., 2008, and references therein).
More recently, dynamical aspects have also been takeninto account through N-body/smoothed particle hydrodynamics(SPH), semi-analytical models, or cosmological simulations ofgalactic disks (e.g., Stinson et al., 2010; Rahimi et al., 2011;Kobayashi & Nakasato, 2011; Few et al., 2012, for the latestones). Wiersma et al. (2011) systematically investigated the im-pact on the outcome when, not specifically looking for MilkyWay analogs, they varied a large number of physical processes.On the other hand, Pilkington et al. (2012) compared differentsets of simulations and two classical chemical evolution mod-els, all fine-tuned to resemble the Milky Way. All of the modelswere able to reproduce the present-day gradient, but followingdifferent paths.
The radial migration of stars along a Galactic radius has re-cently been recognized as a key process to understanding theevolution of gradients with time. Several mechanisms have beenproposed to explain the radial mixing:
– the position of stars around their birth radii shows anincreased spread due to scattering by molecular clouds,which increases their epicyclic energy (“blurring”, Spitzer& Schwarzschild, 1953; Binney & Tremaine, 2008);
– the orbit of stars is moved inwards or outwards either by res-onant scattering by the transient spiral structure (Sellwood& Binney, 2002; Roskar et al., 2008a,b) or by the resonanceoverlap of the bar and spiral structure (Schonrich & Binney,2009; Minchev & Famaey, 2010). This mechanism is re-ferred to as “churning” and implies a change in the angularmomentum of the star;
– radial mixing can also be caused by the perturbation inducedby a low-mass orbiting satellite (Quillen et al., 2009; Bird etal., 2012) or a satellite bombardment (Bird et al., 2012).
There were early models combining dynamics and chemicalevolution (e.g., Francois & Matteucci, 1993). Schonrich &Binney (2009) were the first to incorporate the recent results
on radial migration of stars in chemical evolution models.Very recently, Minchev et al. (2012) presented new MilkyWay models, where the chemical evolution is merged withdisk numerical simulations. Each particle in their simulationsrepresents only one star, while the N-body simulations with thehighest resolution and an improved treatment of the chemistry(e.g., Bird et al., 2012b) have particles of ≈ 104 M�. Amongother results, they found that radial migration affects the oldstars more strongly. Radial migration in the disk is at the originof azimuthal variations in the metallicity distribution of its oldstars (Di Matteo et al., 2013)
In this paper we investigate the shape of the gradient for 11elements and focus on the outer disk. The paper is organizedas follows: in Sect. 2, we briefly recall the observations and dataanalysis, and in Sect. 3 we describe the distances of the Cepheidsbased on near-infrared (NIR) photometry. Results are presentedand discussed in Sect. 4 (abundances) and Sect. 5 (gradients).Sect. 6 summarizes our findings.
2. Observations and Method
2.1. Data
Our study is based on the same high-resolution spectra(ESPaDOnS: 25 stars, FEROS: 40 stars, Narval@TBL: 1 star) asin Lemasle et al. (2007, 2008) and Pedicelli et al. (2010), wherewe determined the atmospheric parameters and iron abundancesin order to study the iron gradient across the Galactic disk. Thesignal to noise (S/N) ratio ranges from 40 to 140, with most ofthe spectra having S/N'100.
2.2. Atmospheric parameters
We used the atmospheric parameters previously derived in thepapers quoted above. For this reason, we only briefly summa-rize the method here. Because Cepheids are pulsating variablestars, it is very unlikely to obtain simultaneous photometric mea-surements. Therefore the atmospheric parameters have to be de-termined exclusively from spectroscopic information. To accu-rately determine Teff , which is critical in the process of abun-dance determination, we used the line-depth ratios method de-scribed in Kovtyukh & Gorlova (2000) and Kovtyukh (2007).This method has been long proven to give accurate temperaturesand can also be double-checked because lines with both highand low χex values have to properly fit the curve of growth. Thesurface gravity, log g, and the microturbulent velocity, vt, weredetermined by a classical spectroscopic analysis: We imposed i)the ionization balance between Fe I and Fe II with the help of thecurve of growth and ii) that the Fe I abundance depends neitheron line strength nor on the excitation potential. It should be notedhere that Andrievsky and collaborators use a slightly modifiedversion of the canonical analysis in order to avoid a possible in-fluence of non local thermodynamic equilibrium (NLTE) effectson Fe I lines (Kovtyukh & Andrievsky, 1999): surface gravitiesand microturbulent velocities are derived from Fe II lines insteadof Fe I lines. However, the two methods lead to differences thatare typically equal to or less than 0.10 dex for the [Fe/H] abun-dances.
2.3. Line list
Some usual lines in stellar spectroscopic analysis cannot be usedto determine the chemical composition of Cepheids as they are
3
B. Lemasle et al.: Galactic abundance gradients from Cepheids:
much too wide in supergiants. For instance, the Mg I line at5528.41 Å as well as the Ba II lines at 6141.73 and 6496.91Åhave equivalent widths (EW) larger than 250 mÅ in most of thestars of our sample. This is the reason why the first study ofbarium in Cepheids (which takes into account NLTE effects) ap-peared only very recently (Andrievsky et al., 2013). Surprisingly,it is also the first large study of the barium abundance across theGalactic disk. Moreover, Cepheids span a very wide range ofTeff , log g, and vt along the pulsation cycle. In particular, Teff
can span a range larger than 1000 K. As abundances should ide-ally be derived from the same set of lines for the whole sam-ple, one wants to discard lines that would disappear or becometoo strong at the edges of the Teff range. The same outcome ap-plies to the other atmospheric parameters. Finally, in the phaseswith the lowest Teff and log g, some parts of the spectrum, espe-cially toward the blue, are so crowded that line blending makesit almost impossible to locate the continuum, preventing us frommeasuring lines in those parts of the spectrum.
In order to build a proper line list, we selected a dozen of ourspectra with a good S/N that covered the atmospheric parameterspace (including [Fe/H]) as much as possible. From those spec-tra, we picked up the lines fulfilling all the aforementioned cri-teria, namely, lines that are always present but never too strong,with no or limited blending, and with a continuum well definedaround the line. Despite this careful selection, it could still hap-pen that some of the lines were not measurable, either becausethe Cepheids were observed in a phase that was less favorable ormore simply because we could only reach a limited S/N. For allthe lines, we adopted the physical properties (oscillator strength,excitation potential) listed in the Vienna Atomic Line Database(VALD) (Kupka et al., 1999; Ryabchikova et al., 1999). Our linelist for the α and heavy elements can be found in Table A.1. TheFe I and Fe II lines that were used to determine the atmosphericparameters of the Cepheids are listed in Romaniello et al. (2008)and Pedicelli et al. (2010); the EW of iron lines were not remea-sured here.
2.4. Abundance determinations
The atmospheric parameters are used as input for the MARCSmodels of Edvardsson et al. (1993). In this version of theMARCS models, the stellar atmosphere is described assum-ing a plane-parallel stratification, hydrostatic equilibrium, andlocal thermodynamic equilibrium (LTE). The EW of α andheavy elements were measured with a semi-interactive code (fit-line, written by P. Francois) based on genetic algorithms fromCharbonneau (1995) (see Lemasle et al. (2007) for details). Weadopted the solar chemical abundances provided by Grevesse etal. (1996). For a given element, the final abundance of a star isestimated as the mean value of the abundances determined foreach line of this element.
In order to test how the uncertainties on the atmospheric pa-rameters of the star affect the final abundance results, we com-puted the abundances with over- or underestimated values ofTe f f (±100 K), log g (±0.3 dex), vt (±0.5 dex), and [Fe/H](±0.12 dex). The sum in quadrature of these uncertainties on theatmospheric parameters gives uncertainties on the abundancesthat are listed in Table 1 (uncertainties of the order of 0.12 dex on[Fe/H] (Lemasle et al., 2008) leave the abundances unchangedand are therefore not included in Table 1). We repeated the ex-ercise for two stars spanning the whole temperature range forCepheids: SX Vel (Te f f =6248 K) and SV Mon (Te f f =4900 K)
∆Te f f ∆log g ∆vt ∆[X/H]Element (–100 K) (–0.3 dex) (+0.5 dex)
dex dex dex dex[Al/H] –0.04 +0.02 –0.02 0.05[Ca/H] –0.07 +0.03 –0.09 0.12[Ce/H] –0.07 –0.08 –0.13 0.17[Eu/H] –0.06 –0.08 –0.04 0.11[La/H] –0.07 –0.07 –0.03 0.11
[Mg/H] –0.06 +0.02 –0.08 0.11[Na/H] –0.06 +0.02 –0.16 0.17[Nd/H] –0.09 –0.06 –0.04 0.12
[S/H] +0.00 –0.04 –0.11 0.12[Si/H] –0.06 +0.02 –0.07 0.10[Y/H] –0.05 –0.09 –0.05 0.12[Zr/H] –0.04 –0.09 –0.06 0.12
∆Te f f ∆log g ∆vt ∆[X/H]Element (+100 K) (+0.3 dex) (–0.5 dex)
dex dex dex dex[Al/H] +0.06 –0.03 +0.09 0.12[Ca/H] +0.07 –0.02 +0.03 0.08[Ce/H] +0.00 +0.13 +0.04 0.14[Eu/H] –0.01 +0.13 +0.10 0.17[La/H] +0.02 +0.13 +0.14 0.19
[Mg/H] +0.05 –0.02 +0.13 0.14[Na/H] - - - -[Nd/H] +0.00 +0.13 +0.07 0.15
[S/H] - - - -[Si/H] +0.05 +0.02 +0.09 0.11[Y/H] –0.01 +0.14 +0.13 0.19[Zr/H] –0.01 +0.12 +0.20 0.24
Table 1. Top: Error budget for SX Vel (Te f f =6250 K, log g=1.3dex, vt=2.8 km/s, [Fe/H]=–0.2 dex). Bottom: Error budget forSV Mon (Te f f =4900 K, log g=0.50 dex, vt=3.4 km/s, [Fe/H]=–0.1 dex).
3. Distances
3.1. Period-Wesenheit relations
For a given star, the Wesenheit index (e.g., Madore, 1982) is alinear combination of a selected magnitude and one of its relatedcolors. By construction, the Wesenheit index is a reddening-freequantity. For instance, the Wesenheit index for J and K magni-tudes WJK is defined as
WJK = K −AK
E(J − K)× (J − K). (1)
Compared to traditional period-luminosity(-color) relations, theperiod-Wesenheit (P-W) relations present several advantages.
– They are almost linear over the entire period range;– the slopes of P-W relations are almost independent of the
metallicity;– the dispersion of the P-W relations is significantly reduced
compared to their corresponding period-luminosity (P-L) re-lations;
– P-W relations are reddening-free, whereas the use of classi-cal P-L relations requires the determination of the individualE(B-V) for each Cepheid.
These characteristics of P-W relations have been predicted bytheoretical pulsation models (e.g., Fiorentino et al., 2007; Bonoet al., 2008). They have been supported from an observationalpoint of view, in particular as far as the P-WVI is concerned,because a very large amount of data is already available in thosebands (e.g., Fouque et al., 2007; Madore & Freedman, 2009;
4
B. Lemasle et al.: Galactic abundance gradients from Cepheids:
Bono et al., 2010; Ngeow, 2012, and references therein). Themetallicity dependence of the optical P-WVI relations remains,however, controversial (Storm et al. (2011a,b), and Shappee etal. (2011); Gerke et al. (2011), but see also Majaess et al. (2011)for a discussion).
3.2. Method
New NIR P-W relations for Galactic Cepheids have been de-termined by Inno et al. (2013) for the J, H, and K bands.Their slopes have been calibrated with Cepheids in the LargeMagellanic Cloud and their zero-points with parallax dis-tances from the Hubble Space Telescope available for GalacticCepheids. In order to reduce the sources of uncertainties, firstovertone (FO) pulsators have not been fundamentalized. Instead,different sets of P-W relations for either fundamental or FO pul-sators have been calibrated.
We adopt here the individual distances estimated byGenovali et al. (2013b) using these new P-W relations andsingle-epoch measurements or preferably mean magnitudes inthe NIR bands. The NIR magnitudes used in Genovali et al.(2013b) originate from four different data samples, ordered be-low according to their photometric accuracy and light curve cov-erage:
1. NIR photometry of 132 northern Cepheids from Monson &Pierce (2011) with a complete coverage of the light curves;
2. data from the South African Astronomical Observatory pre-viously published by Laney & Caldwell (2007) and refer-ences therein, with a complete coverage of the light curves;
3. new, unpublished observations kindly provided by C. D.Laney (priv. comm.); the coverage of the light curves is cur-rently only partial (6-12 points);
4. the 2MASS catalog, with only single-epoch observations.The mean magnitude is then estimated with a template lightcurve, the amplitude in the V-band and the epoch of maxi-mum both available in the literature (Soszynski et al., 2005).
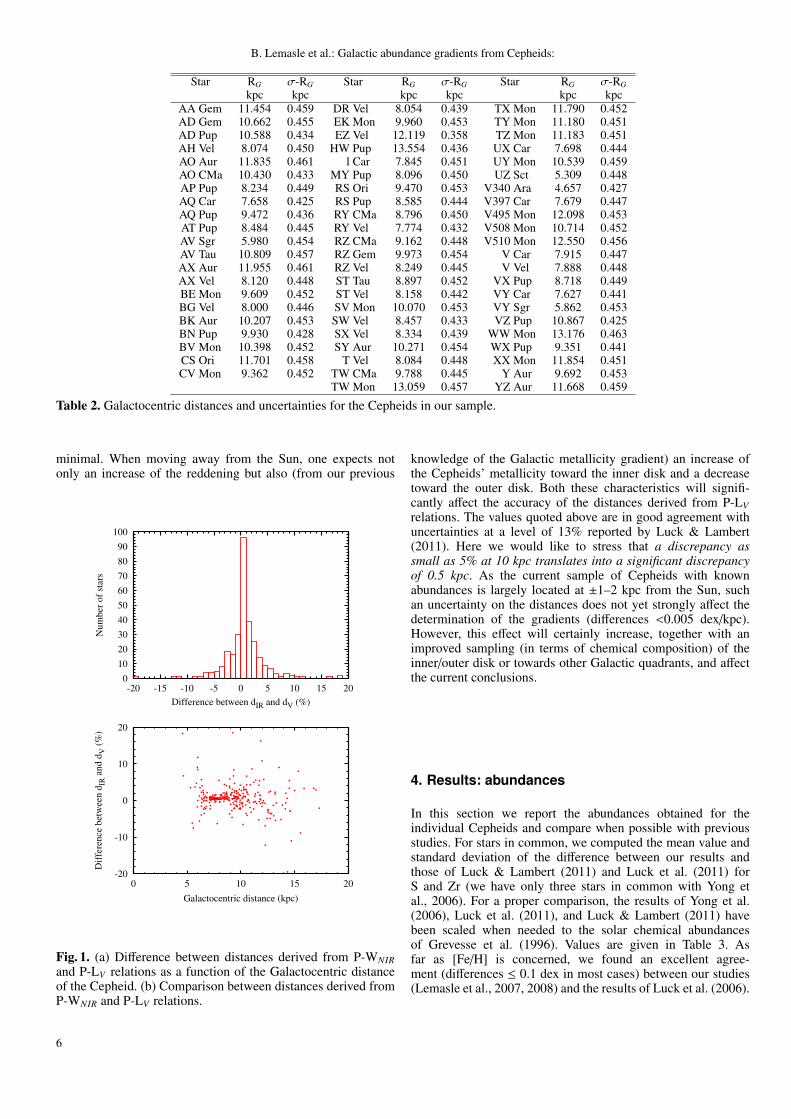
Three values of the distance modulus (and relative errors)have been computed in the three NIR bands, the conclusivevalue being their weighted mean. The results are in very goodagreement with previous results from Monson & Pierce (2011)and Storm et al. (2011a,b), in particular because they show nospurious trends with period or reddening. The reader interestedin a complete description of the method adopted to estimateaccurate distances together with a detailed analysis of theerror budget is referred to Inno et al. (2013) and Genovali etal. (2013b). However, it is worth mentioning that the errorbudget includes the errors affecting the Galactocentric distanceof the Sun. Table 2 lists the Galactocentric distances for ourhigh-resolution sample. Our whole sample (see Genovali et al.,2013b) is, to date, the largest homogeneous sample for accurateNIR distances of Galactic classical Cepheids.
We adopted 7.94 kpc as the Galactocentric distance of theSun, derived from type II Cepheids and RR Lyrae stars byGroenewegen et al. (2008). Fritz et al. (2011) obtained the samevalue from Red Clump stars in the Galactic center (GC) and anupdated extinction curve toward the GC. A very similar value(7.9 kpc) is derived by Reid et al. (2009) from the trigonometricparallax of Sgr B2, a massive star forming region very close tothe GC. Similar values are reported by Matsunaga et al. (2013)from short-period variable stars close to the GC, by Trippeet al. (2008) from the statistical parallax of late-type stars inthe GC (8.07 kpc), and by Majaess (2010) from OGLE RR
Lyrae variables (8.1 kpc). Also using RR Lyrae stars (statisticalparallaxes), Dambis (2009) found a shorter distance of 7.58 kpc.On the other hand, Ghez et al. (2008) and Gillessen et al. (2009)derived a value of, respectively, 8.4 and 8.33 kpc in monitoringstellar orbits around the massive black hole in the GC. Theseresults are similar to those of Matsunaga et al. (2009) from Miravariables (8.24 kpc). From a statistical analysis of the estimatespublished during the last 20 years, Malkin (2012) reports a finalvalue of 7.98 kpc. Possible changes to the distance to the GC donot affect the conclusions of this investigation.
3.3. Comparison with V-band-based distances
Because of the recent advent of NIR detectors, the distances ofGalactic Cepheids have been traditionally derived from V-bandP-L relations (PLV ). Still, the amount of NIR data available forGalactic Cepheids is less than in the visible part of the spec-trum, although the situation is continuously improving. Alreadyin our previous papers (Lemasle et al., 2007, 2008; Pedicelli etal., 2009, 2010), we preferred to use NIR P-L relations: it is nowwidely accepted that the slopes and zero-points of the P-L rela-tions are less dependent on the metallicity in the NIR than in thevisible part of the spectrum. However, it is worth mentioning thatno consensus has been reached yet on the amplitude of this so-called metallicity effect, neither from a theoretical nor from anempirical point of view (see, for instance, Fig. 1 in Romaniello etal., 2008). Moreover, the intrinsic dispersion of the P-L relationsis significantly lower in the NIR than in the V-band, leading tolower systematic errors in the NIR.
Finally, another drawback of the P-LV -relations has beenrecently addressed. It is related to the metallicity dependenceof the reddening correction: for a long time the main sourceof reddening values E(B-V) has been the Fernie et al. (1995)database, where individual reddening values are computed froma period-color relation not taking into account the metallicityeffect, although it is very likely that it has to be considered(Laney & Stobie, 1994; Bono et al., 1999). The first to adopt arevised version of the Fernie system were Tamman et al. (2003),and the works of Laney & Caldwell (2007) and Fouque et al.(2007) enabled us to correct any reddening value for the metal-licity effect. Again, distances derived from NIR P-L relationsare less affected by the possible remaining uncertainties in thedetermination of E(B-V) because the total amount of reddeningto be corrected is smaller in this spectral domain.
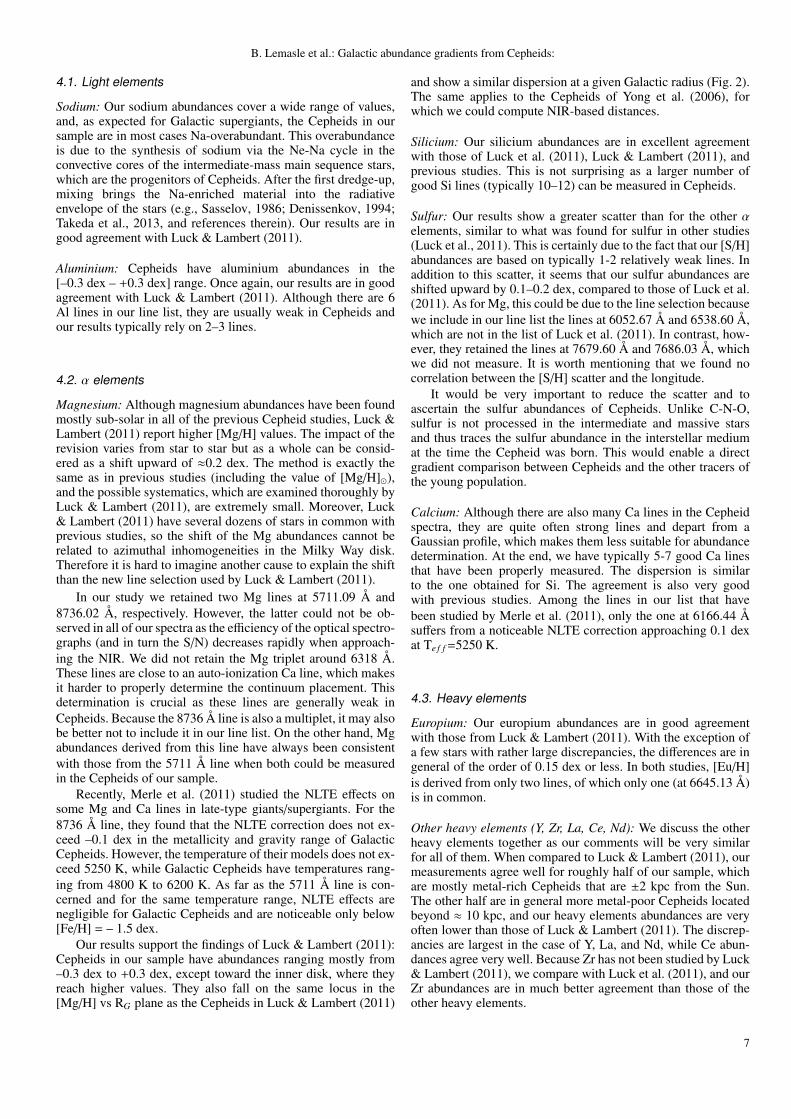
In this paper, we adopt distances derived from NIR P-Wrelations (Inno et al., 2013). This way, we benefit from the ad-vantages of the P-W relations compared to their correspondingP-L relations (see Sect. 3.1) together with those of workingin the NIR. As the relations have been derived for MagellanicClouds Cepheids, we assume that the reddening law is the samein different systems. Fig. 1a shows the overall good agreementbetween distances derived either from the P-LV taken fromLuck et al. (2011), Luck & Lambert (2011), or from the P-WNIRrelations, because the difference is in general less than 5%.Moreover, the difference is less than 2% for a significant part ofour sample, especially close to the Solar neighborhood, whereone can note in Fig. 1b the narrow distribution. On the otherhand, the discrepancies are increasing when going further fromthe Sun, both toward the inner and toward the outer disk. Sucha result is all but a surprise: the Cepheids located close to theSun are not expected to be highly reddened, and therefore thediscrepancies between P-LV and P-WNIR are expected to be
5
B. Lemasle et al.: Galactic abundance gradients from Cepheids:
Star RG σ-RG Star RG σ-RG Star RG σ-RGkpc kpc kpc kpc kpc kpc
AA Gem 11.454 0.459 DR Vel 8.054 0.439 TX Mon 11.790 0.452AD Gem 10.662 0.455 EK Mon 9.960 0.453 TY Mon 11.180 0.451AD Pup 10.588 0.434 EZ Vel 12.119 0.358 TZ Mon 11.183 0.451AH Vel 8.074 0.450 HW Pup 13.554 0.436 UX Car 7.698 0.444AO Aur 11.835 0.461 l Car 7.845 0.451 UY Mon 10.539 0.459AO CMa 10.430 0.433 MY Pup 8.096 0.450 UZ Sct 5.309 0.448AP Pup 8.234 0.449 RS Ori 9.470 0.453 V340 Ara 4.657 0.427AQ Car 7.658 0.425 RS Pup 8.585 0.444 V397 Car 7.679 0.447AQ Pup 9.472 0.436 RY CMa 8.796 0.450 V495 Mon 12.098 0.453AT Pup 8.484 0.445 RY Vel 7.774 0.432 V508 Mon 10.714 0.452AV Sgr 5.980 0.454 RZ CMa 9.162 0.448 V510 Mon 12.550 0.456AV Tau 10.809 0.457 RZ Gem 9.973 0.454 V Car 7.915 0.447AX Aur 11.955 0.461 RZ Vel 8.249 0.445 V Vel 7.888 0.448AX Vel 8.120 0.448 ST Tau 8.897 0.452 VX Pup 8.718 0.449BE Mon 9.609 0.452 ST Vel 8.158 0.442 VY Car 7.627 0.441BG Vel 8.000 0.446 SV Mon 10.070 0.453 VY Sgr 5.862 0.453BK Aur 10.207 0.453 SW Vel 8.457 0.433 VZ Pup 10.867 0.425BN Pup 9.930 0.428 SX Vel 8.334 0.439 WW Mon 13.176 0.463BV Mon 10.398 0.452 SY Aur 10.271 0.454 WX Pup 9.351 0.441CS Ori 11.701 0.458 T Vel 8.084 0.448 XX Mon 11.854 0.451CV Mon 9.362 0.452 TW CMa 9.788 0.445 Y Aur 9.692 0.453
TW Mon 13.059 0.457 YZ Aur 11.668 0.459
Table 2. Galactocentric distances and uncertainties for the Cepheids in our sample.
minimal. When moving away from the Sun, one expects notonly an increase of the reddening but also (from our previous
0
10
20
30
40
50
60
70
80
90
100
-20 -15 -10 -5 0 5 10 15 20
Nu
mb
er o
f st
ars
Difference between dIR and dV (%)
-20
-10
0
10
20
0 5 10 15 20
Dif
fere
nce
bet
wee
n d
IR a
nd
dV
(%
)
Galactocentric distance (kpc)
Fig. 1. (a) Difference between distances derived from P-WNIRand P-LV relations as a function of the Galactocentric distanceof the Cepheid. (b) Comparison between distances derived fromP-WNIR and P-LV relations.
knowledge of the Galactic metallicity gradient) an increase ofthe Cepheids’ metallicity toward the inner disk and a decreasetoward the outer disk. Both these characteristics will signifi-cantly affect the accuracy of the distances derived from P-LVrelations. The values quoted above are in good agreement withuncertainties at a level of 13% reported by Luck & Lambert(2011). Here we would like to stress that a discrepancy assmall as 5% at 10 kpc translates into a significant discrepancyof 0.5 kpc. As the current sample of Cepheids with knownabundances is largely located at ±1–2 kpc from the Sun, suchan uncertainty on the distances does not yet strongly affect thedetermination of the gradients (differences <0.005 dex/kpc).However, this effect will certainly increase, together with animproved sampling (in terms of chemical composition) of theinner/outer disk or towards other Galactic quadrants, and affectthe current conclusions.
4. Results: abundances
In this section we report the abundances obtained for theindividual Cepheids and compare when possible with previousstudies. For stars in common, we computed the mean value andstandard deviation of the difference between our results andthose of Luck & Lambert (2011) and Luck et al. (2011) forS and Zr (we have only three stars in common with Yong etal., 2006). For a proper comparison, the results of Yong et al.(2006), Luck et al. (2011), and Luck & Lambert (2011) havebeen scaled when needed to the solar chemical abundancesof Grevesse et al. (1996). Values are given in Table 3. Asfar as [Fe/H] is concerned, we found an excellent agree-ment (differences ≤ 0.1 dex in most cases) between our studies(Lemasle et al., 2007, 2008) and the results of Luck et al. (2006).
6
B. Lemasle et al.: Galactic abundance gradients from Cepheids:
4.1. Light elements
Sodium: Our sodium abundances cover a wide range of values,and, as expected for Galactic supergiants, the Cepheids in oursample are in most cases Na-overabundant. This overabundanceis due to the synthesis of sodium via the Ne-Na cycle in theconvective cores of the intermediate-mass main sequence stars,which are the progenitors of Cepheids. After the first dredge-up,mixing brings the Na-enriched material into the radiativeenvelope of the stars (e.g., Sasselov, 1986; Denissenkov, 1994;Takeda et al., 2013, and references therein). Our results are ingood agreement with Luck & Lambert (2011).
Aluminium: Cepheids have aluminium abundances in the[–0.3 dex – +0.3 dex] range. Once again, our results are in goodagreement with Luck & Lambert (2011). Although there are 6Al lines in our line list, they are usually weak in Cepheids andour results typically rely on 2–3 lines.
4.2. α elements
Magnesium: Although magnesium abundances have been foundmostly sub-solar in all of the previous Cepheid studies, Luck &Lambert (2011) report higher [Mg/H] values. The impact of therevision varies from star to star but as a whole can be consid-ered as a shift upward of ≈0.2 dex. The method is exactly thesame as in previous studies (including the value of [Mg/H]�),and the possible systematics, which are examined thoroughly byLuck & Lambert (2011), are extremely small. Moreover, Luck& Lambert (2011) have several dozens of stars in common withprevious studies, so the shift of the Mg abundances cannot berelated to azimuthal inhomogeneities in the Milky Way disk.Therefore it is hard to imagine another cause to explain the shiftthan the new line selection used by Luck & Lambert (2011).
In our study we retained two Mg lines at 5711.09 Å and8736.02 Å, respectively. However, the latter could not be ob-served in all of our spectra as the efficiency of the optical spectro-graphs (and in turn the S/N) decreases rapidly when approach-ing the NIR. We did not retain the Mg triplet around 6318 Å.These lines are close to an auto-ionization Ca line, which makesit harder to properly determine the continuum placement. Thisdetermination is crucial as these lines are generally weak inCepheids. Because the 8736 Å line is also a multiplet, it may alsobe better not to include it in our line list. On the other hand, Mgabundances derived from this line have always been consistentwith those from the 5711 Å line when both could be measuredin the Cepheids of our sample.
Recently, Merle et al. (2011) studied the NLTE effects onsome Mg and Ca lines in late-type giants/supergiants. For the8736 Å line, they found that the NLTE correction does not ex-ceed –0.1 dex in the metallicity and gravity range of GalacticCepheids. However, the temperature of their models does not ex-ceed 5250 K, while Galactic Cepheids have temperatures rang-ing from 4800 K to 6200 K. As far as the 5711 Å line is con-cerned and for the same temperature range, NLTE effects arenegligible for Galactic Cepheids and are noticeable only below[Fe/H] = – 1.5 dex.
Our results support the findings of Luck & Lambert (2011):Cepheids in our sample have abundances ranging mostly from–0.3 dex to +0.3 dex, except toward the inner disk, where theyreach higher values. They also fall on the same locus in the[Mg/H] vs RG plane as the Cepheids in Luck & Lambert (2011)
and show a similar dispersion at a given Galactic radius (Fig. 2).The same applies to the Cepheids of Yong et al. (2006), forwhich we could compute NIR-based distances.
Silicium: Our silicium abundances are in excellent agreementwith those of Luck et al. (2011), Luck & Lambert (2011), andprevious studies. This is not surprising as a larger number ofgood Si lines (typically 10–12) can be measured in Cepheids.
Sulfur: Our results show a greater scatter than for the other αelements, similar to what was found for sulfur in other studies(Luck et al., 2011). This is certainly due to the fact that our [S/H]abundances are based on typically 1-2 relatively weak lines. Inaddition to this scatter, it seems that our sulfur abundances areshifted upward by 0.1–0.2 dex, compared to those of Luck et al.(2011). As for Mg, this could be due to the line selection becausewe include in our line list the lines at 6052.67 Å and 6538.60 Å,which are not in the list of Luck et al. (2011). In contrast, how-ever, they retained the lines at 7679.60 Å and 7686.03 Å, whichwe did not measure. It is worth mentioning that we found nocorrelation between the [S/H] scatter and the longitude.
It would be very important to reduce the scatter and toascertain the sulfur abundances of Cepheids. Unlike C-N-O,sulfur is not processed in the intermediate and massive starsand thus traces the sulfur abundance in the interstellar mediumat the time the Cepheid was born. This would enable a directgradient comparison between Cepheids and the other tracers ofthe young population.
Calcium: Although there are also many Ca lines in the Cepheidspectra, they are quite often strong lines and depart from aGaussian profile, which makes them less suitable for abundancedetermination. At the end, we have typically 5-7 good Ca linesthat have been properly measured. The dispersion is similarto the one obtained for Si. The agreement is also very goodwith previous studies. Among the lines in our list that havebeen studied by Merle et al. (2011), only the one at 6166.44 Åsuffers from a noticeable NLTE correction approaching 0.1 dexat Te f f =5250 K.
4.3. Heavy elements
Europium: Our europium abundances are in good agreementwith those from Luck & Lambert (2011). With the exception ofa few stars with rather large discrepancies, the differences are ingeneral of the order of 0.15 dex or less. In both studies, [Eu/H]is derived from only two lines, of which only one (at 6645.13 Å)is in common.
Other heavy elements (Y, Zr, La, Ce, Nd): We discuss the otherheavy elements together as our comments will be very similarfor all of them. When compared to Luck & Lambert (2011), ourmeasurements agree well for roughly half of our sample, whichare mostly metal-rich Cepheids that are ±2 kpc from the Sun.The other half are in general more metal-poor Cepheids locatedbeyond ≈ 10 kpc, and our heavy elements abundances are veryoften lower than those of Luck & Lambert (2011). The discrep-ancies are largest in the case of Y, La, and Nd, while Ce abun-dances agree very well. Because Zr has not been studied by Luck& Lambert (2011), we compare with Luck et al. (2011), and ourZr abundances are in much better agreement than those of theother heavy elements.
7

B. Lemasle et al.: Galactic abundance gradients from Cepheids:
The origin of this “bimodal” behavior is not clear. We havealready mentioned that our approaches are very similar. Differentcauses can be invoked to understand this behavior:
– It could arise from systematics in the determination of the at-mospheric parameters of the Cepheids. However, we foundan excellent agreement for [Fe/H] and most of the other ele-ments we analyzed. Moreover, this could not explain whyour heavy element abundances agree in general relativelywell for the more metal-rich stars in our sample and not forthe most metal-poor ones. We thus discard this possibility.
– It seems that we have to look in the direction of the absorp-tion lines of the heavy elements. However, we can also ex-clude that the measurement errors (like a wrong fit of thelines or errors in the continuum placement) are larger for thelines of the heavy elements than in the case of other species.Moreover, it is easier to properly locate the continuum inthe Cepheids that have sub-solar metallicities than in thosethat are more metal-rich than the Sun because the line blend-ing decreases with metallicity. On the other hand, the moremetal-poor stars in our sample are found toward the outerdisk (a consequence of the abundance gradients) and there-fore have lower S/N due to their greater distances.
– We note that our analysis of heavy elements is based on aslightly larger number of lines than the other studies: Wetypically measure 4-6 Y lines, 1 Zr line, 4-6 La lines, 2-3Ce lines, and 2-4 Nd lines, while the line list of Kovtyukh& Andrievsky (1999) lists only 2 lines for each heavy el-ement. For the lines that are in common, we checked thatwe have similar atomic parameters, except for the Y lineat 6795.41 Å. For this Y line we used a log gf value of –1.03, while Kovtyukh & Andrievsky (1999) used a value of–1.20. Yong et al. (2006) measured one Eu line and four Lalines, among which three are in common with our own linelist and for which they retained the same atomic parameters.We also note that the differences are greater for the elementswhere we used a larger number of lines than Luck & Lambert(2011) (Y, La, Nd), while the agreement is quite good whenwe used a similar number of lines (Zr, Ce, Eu).
– As the atomic parameters for the lines in common are identi-cal or very similar in most cases, it seems unlikely that theyaccount for much of the difference. It is probable that at leastsome of the lines of these elements (which are, moreover,found in their ionized state) are altered by NLTE effects.Selecting different lines (that are not affected in the sameway by NLTE effects) in different line lists could then lead tothe discrepant results we observe. None of the studies com-pared here (Yong et al. (2006); Luck et al. (2011); Luck &Lambert (2011); this study) computed NLTE effects for theheavy elements or took into account hyperfine structure cor-rections. Repeating with other elements the NLTE analysisof barium in Milky Way Cepheids made by Andrievsky etal. (2013) would certainly help to clarify the situation.
5. Results: gradients
When examining the abundance trends with Galactocentricdistance, we first considered simple, linear gradients. Fig. 2 dis-plays linear gradients for several light (Na, Al) and α elements,while Fig. 3 shows the gradients for the heavy elements. Detailsabout the linear regression are given in Table 4.
Because Na and possibly Al are modified prior to theCepheid evolutionary stage, their gradients should only be
Element Mean difference σdex dex
[Na/H] 0.12 0.11[Mg/H] 0.19 0.15[Al/H] 0.13 0.09[Si/H] 0.11 0.07[S/H] 0.18 0.16
[Ca/H] 0.14 0.11[Y/H] 0.16 0.11[Zr/H] 0.17 0.13[La/H] 0.20 0.14[Ce/H] 0.14 0.11[Nd/H] 0.20 0.12[Eu/H] 0.18 0.16
Table 3. Mean value and standard deviation of the abundancedifference between this study and Luck & Lambert (2011), ex-cept for S and Zr, where the comparison is made with Luck et al.(2011).
considered as indicative. For Na, the high value obtained forthe slope of the gradient (–0.066 dex/kpc) is largely due to theinfluence of a couple of Na–rich stars in the inner disk. If incontrast we compute the gradient only in the range [7-15] kpc,the value we obtain (–0.049 dex/kpc) is very similar to theresults of Luck et al. (2011) and Luck & Lambert (2011), whichare –0.044 dex/kpc and –0.047 dex/kpc, respectively. Our resultsare also very similar for the Al gradient: we found a slope of–0.046 dex/kpc over the whole Galactic disk, while Luck etal. (2011), Luck & Lambert (2011) gave slopes of –0.053 and–0.49 dex/kpc, respectively. This value is also similar to theslope of −0.048 dex/kpc found by Daflon & Cunha (2004b)from OB stars.
For the α elements, Fig. 2 shows that our abundance trendswith Galactocentric distance agree very well with the studiesof Luck et al. (2011), Luck & Lambert (2011), and Yong etal. (2006). Indeed, the locus of the stars in the [M/H] vs. RGplane and the dispersion around the slope match very well. Theactual value of the slope (tabulated in Table 4) might be affectedin some cases by the 3–4 α rich stars in the inner disk and/orby 2–4 stars at 12–14 kpc with higher α-abundances than theother Cepheids at these Galactocentric distances. In particularfor Mg, the best fit seems to be artificially shifted by ≈+0.2dex from the rest of the sample under the combined influenceof these stars. From the figure it seems, however, that the slopeis correct, and indeed our computed slope (–0.050 dex/kpc) isin excellent agreement with the results of Luck et al. (2011),and Luck & Lambert (2011), who both found a slope of –0.048dex/kpc, and with those of Daflon & Cunha (2004b), whofound a slope of –0.052 dex/kpc. We already mentioned thatour [S/H] abundances are higher by +0.1 – +0.2 dex than thoseof Luck et al. (2011), which is confirmed by Fig. 2. We find,however, a similar slope (–0.079 dex/kpc vs. –0.076 dex/kpc) ifwe ignore the two inner disk Cepheids, while Daflon & Cunha(2004b) report a much shallower slope (–0.040 dex/kpc). Thedispersion is much lower for Si and, to a slightly lesser extent,for Ca because their abundances are determined with a largernumber of lines. Given the size of the respective error bars,this dispersion is certainly closer to reflecting a real star-to-starscatter, while it is probably dominated by the uncertainties of theabundance determinations for the other elements. Our Ca slope(–0.044 dex/kpc) is very close to those determined by Lucket al. (2011) and Luck & Lambert (2011), which are –0.040
8
B. Lemasle et al.: Galactic abundance gradients from Cepheids:
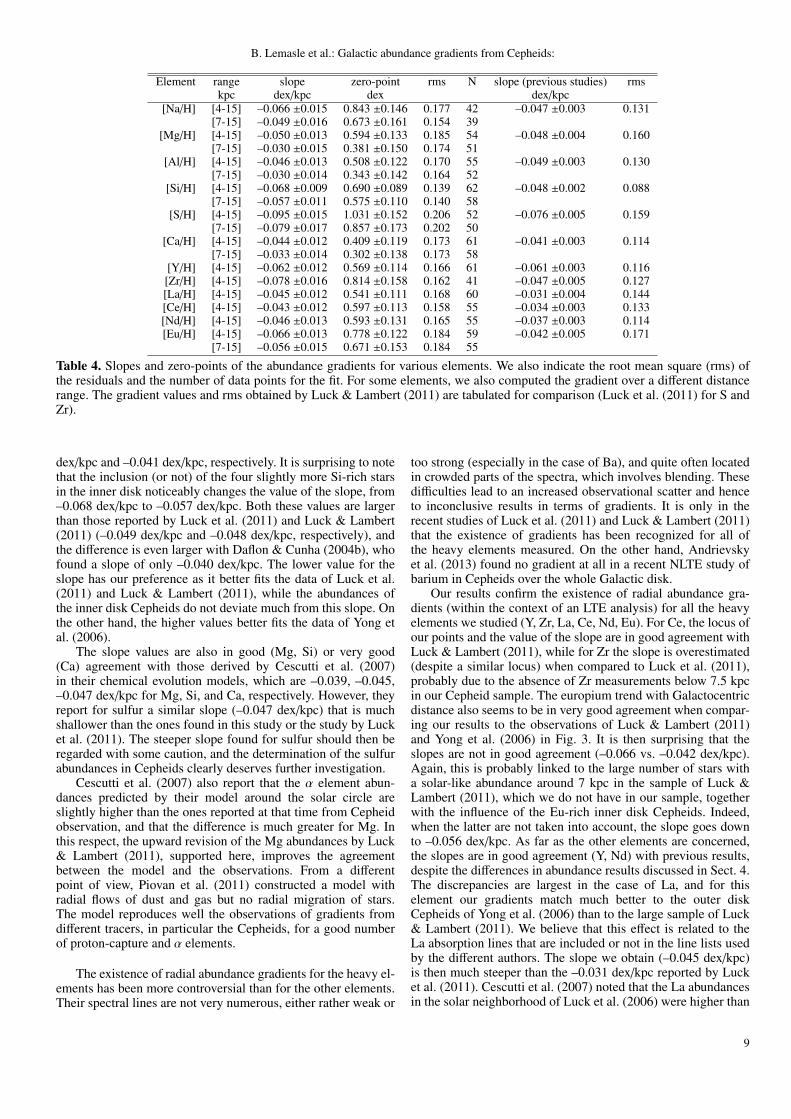
Element range slope zero-point rms N slope (previous studies) rmskpc dex/kpc dex dex/kpc
[Na/H] [4-15] –0.066 ±0.015 0.843 ±0.146 0.177 42 –0.047 ±0.003 0.131[7-15] –0.049 ±0.016 0.673 ±0.161 0.154 39
[Mg/H] [4-15] –0.050 ±0.013 0.594 ±0.133 0.185 54 –0.048 ±0.004 0.160[7-15] –0.030 ±0.015 0.381 ±0.150 0.174 51
[Al/H] [4-15] –0.046 ±0.013 0.508 ±0.122 0.170 55 –0.049 ±0.003 0.130[7-15] –0.030 ±0.014 0.343 ±0.142 0.164 52
[Si/H] [4-15] –0.068 ±0.009 0.690 ±0.089 0.139 62 –0.048 ±0.002 0.088[7-15] –0.057 ±0.011 0.575 ±0.110 0.140 58
[S/H] [4-15] –0.095 ±0.015 1.031 ±0.152 0.206 52 –0.076 ±0.005 0.159[7-15] –0.079 ±0.017 0.857 ±0.173 0.202 50
[Ca/H] [4-15] –0.044 ±0.012 0.409 ±0.119 0.173 61 –0.041 ±0.003 0.114[7-15] –0.033 ±0.014 0.302 ±0.138 0.173 58
[Y/H] [4-15] –0.062 ±0.012 0.569 ±0.114 0.166 61 –0.061 ±0.003 0.116[Zr/H] [4-15] –0.078 ±0.016 0.814 ±0.158 0.162 41 –0.047 ±0.005 0.127[La/H] [4-15] –0.045 ±0.012 0.541 ±0.111 0.168 60 –0.031 ±0.004 0.144[Ce/H] [4-15] –0.043 ±0.012 0.597 ±0.113 0.158 55 –0.034 ±0.003 0.133[Nd/H] [4-15] –0.046 ±0.013 0.593 ±0.131 0.165 55 –0.037 ±0.003 0.114[Eu/H] [4-15] –0.066 ±0.013 0.778 ±0.122 0.184 59 –0.042 ±0.005 0.171
[7-15] –0.056 ±0.015 0.671 ±0.153 0.184 55
Table 4. Slopes and zero-points of the abundance gradients for various elements. We also indicate the root mean square (rms) ofthe residuals and the number of data points for the fit. For some elements, we also computed the gradient over a different distancerange. The gradient values and rms obtained by Luck & Lambert (2011) are tabulated for comparison (Luck et al. (2011) for S andZr).
dex/kpc and –0.041 dex/kpc, respectively. It is surprising to notethat the inclusion (or not) of the four slightly more Si-rich starsin the inner disk noticeably changes the value of the slope, from–0.068 dex/kpc to –0.057 dex/kpc. Both these values are largerthan those reported by Luck et al. (2011) and Luck & Lambert(2011) (–0.049 dex/kpc and –0.048 dex/kpc, respectively), andthe difference is even larger with Daflon & Cunha (2004b), whofound a slope of only –0.040 dex/kpc. The lower value for theslope has our preference as it better fits the data of Luck et al.(2011) and Luck & Lambert (2011), while the abundances ofthe inner disk Cepheids do not deviate much from this slope. Onthe other hand, the higher values better fits the data of Yong etal. (2006).
The slope values are also in good (Mg, Si) or very good(Ca) agreement with those derived by Cescutti et al. (2007)in their chemical evolution models, which are –0.039, –0.045,–0.047 dex/kpc for Mg, Si, and Ca, respectively. However, theyreport for sulfur a similar slope (–0.047 dex/kpc) that is muchshallower than the ones found in this study or the study by Lucket al. (2011). The steeper slope found for sulfur should then beregarded with some caution, and the determination of the sulfurabundances in Cepheids clearly deserves further investigation.
Cescutti et al. (2007) also report that the α element abun-dances predicted by their model around the solar circle areslightly higher than the ones reported at that time from Cepheidobservation, and that the difference is much greater for Mg. Inthis respect, the upward revision of the Mg abundances by Luck& Lambert (2011), supported here, improves the agreementbetween the model and the observations. From a differentpoint of view, Piovan et al. (2011) constructed a model withradial flows of dust and gas but no radial migration of stars.The model reproduces well the observations of gradients fromdifferent tracers, in particular the Cepheids, for a good numberof proton-capture and α elements.
The existence of radial abundance gradients for the heavy el-ements has been more controversial than for the other elements.Their spectral lines are not very numerous, either rather weak or
too strong (especially in the case of Ba), and quite often locatedin crowded parts of the spectra, which involves blending. Thesedifficulties lead to an increased observational scatter and henceto inconclusive results in terms of gradients. It is only in therecent studies of Luck et al. (2011) and Luck & Lambert (2011)that the existence of gradients has been recognized for all ofthe heavy elements measured. On the other hand, Andrievskyet al. (2013) found no gradient at all in a recent NLTE study ofbarium in Cepheids over the whole Galactic disk.
Our results confirm the existence of radial abundance gra-dients (within the context of an LTE analysis) for all the heavyelements we studied (Y, Zr, La, Ce, Nd, Eu). For Ce, the locus ofour points and the value of the slope are in good agreement withLuck & Lambert (2011), while for Zr the slope is overestimated(despite a similar locus) when compared to Luck et al. (2011),probably due to the absence of Zr measurements below 7.5 kpcin our Cepheid sample. The europium trend with Galactocentricdistance also seems to be in very good agreement when compar-ing our results to the observations of Luck & Lambert (2011)and Yong et al. (2006) in Fig. 3. It is then surprising that theslopes are not in good agreement (–0.066 vs. –0.042 dex/kpc).Again, this is probably linked to the large number of stars witha solar-like abundance around 7 kpc in the sample of Luck &Lambert (2011), which we do not have in our sample, togetherwith the influence of the Eu-rich inner disk Cepheids. Indeed,when the latter are not taken into account, the slope goes downto –0.056 dex/kpc. As far as the other elements are concerned,the slopes are in good agreement (Y, Nd) with previous results,despite the differences in abundance results discussed in Sect. 4.The discrepancies are largest in the case of La, and for thiselement our gradients match much better to the outer diskCepheids of Yong et al. (2006) than to the large sample of Luck& Lambert (2011). We believe that this effect is related to theLa absorption lines that are included or not in the line lists usedby the different authors. The slope we obtain (–0.045 dex/kpc)is then much steeper than the –0.031 dex/kpc reported by Lucket al. (2011). Cescutti et al. (2007) noted that the La abundancesin the solar neighborhood of Luck et al. (2006) were higher than
9
B. Lemasle et al.: Galactic abundance gradients from Cepheids:
those predicted by their model. As a result, the slope predictedby the model (-0.032 dex/kpc in the [4-14] kpc range) wassteeper than the one seen in the data available at that time. Itis, however, close to the current value proposed by Luck &Lambert (2011). Considering only the objects located within13 kpc from the Galactic center, Yong et al. (2012) comparedthe slope of the gradients for the Cepheids and for the young(<1 Gyr) open clusters in their compilation (see their Fig. 32).The slopes are in very close agreement for all of the elementsexcept La, where the difference reaches ≈0.05 dex (the openclusters gradient has a larger value than the Cepheid gradient).It should be noted that the uncertainties on the La gradient fromopen clusters are also much greater than for any other element.Clearly La deserves further investigation, both from a Cepheidand from an open cluster point of view. While Y and Nd show asimilar behavior to La, the differences are less pronounced andthe slopes of our gradients are in good agreement with Luck &Lambert (2011).
A steeper slope for the iron gradient in Cepheids toward theinner disk was first reported by Andrievsky et al. (2002b) andsupported by Pedicelli et al. (2009, 2010) and more recently ona larger sample by Genovali et al. (2013a). On the basis of thecurrent (small) sample of Cepheids towards the inner disk, it isimpossible to say if such a distinctive feature also holds for theother elements: the shallower slopes found when the inner diskCepheids are discarded seem to speak in favor of this scenario;on the other hand this could simply be caused by the severe un-dersampling of inner disk Cepheids. We plan to focus on thisregion in more detail in a forthcoming paper (Genovali et al.,2013b).
In contrast with previous studies, we found no clear evidenceof a flattening of the gradient in the outer disk, as was alreadypointed out by Luck et al. (2011) and Luck & Lambert (2011).This is in contrast to the young population in distant galaxiesand to the open clusters in the Milky Way. Jacobson et al.(2011b), Yong et al. (2012), and most of the previous openclusters studies report a flattening of the gradient in the outerdisk. When splitting the sample in three age bins, Jacobson etal. (2011b) report a possible flattening of the gradient, but also apossible change in the location of the transition zone with time.The outer disk flattening seems to occur around 10 kpc for theoldest clusters, while [Fe/H] in the intermediate-age clustersdecreases linearly and reaches the same ceiling value onlyaround 14 kpc (where the distribution of the intermediate-ageclusters stops). It is impossible to draw any firm conclusion yetdue the unequal sampling of each bin (each age bin containsa different number of clusters and the sampling in terms ofGalactocentric distance is also different). Because the recentstudies could not detect a flattening of the Cepheid gradientin the outer disk, the Cepheids would then easily fit in thatcontext. A comprehensive comparison between Cepheids andopen clusters has been made by Yong et al. (2012); we willnot repeat the exercise here. The simulations of Minchev et al.(2012) also show no flat gradient in the outer disk for the youngstars. They found a strong flattening of the gradient for the oldstars, which was also found by Wang & Zhao (2013), but theyoung populations are much less affected. As a result, the initialand the present-day gradient are very similar out to ≈12 kpc,where some flattening occurs. Indeed, the differences betweenthe initial/final slopes are very small and anyway smaller thanthe uncertainties on the observed gradient.
Large surveys combining photometry and spectroscopy en-able us to derive the radial velocities and the atmospheric pa-rameters of numerous stars. The size of the samples and theirhigh internal consistency compensates for the somewhat less ac-curate abundances and distances compared to the tracers com-monly used to study the abundance gradients in the Milky Way.From the Geneva-Copenhagen Survey, Nordstrom et al. (2004)derived a value of –0.076±0.014 dex/kpc for stars younger than1.5 Gyr in the solar neighborhood (≈ [7–9] kpc). From the thirddata release (DR3) of the RAVE survey (Steinmetz et al., 2006),Coskunoglu et al. (2012) derived for young, F-type stars a ra-dial metallicity [M/H] gradient of –0.051±0.005 dex/kpc similarto the Cepheid gradient. Again from the RAVE DR3 data butthis time for red clump stars in the thin disk, Bilir et al. (2012)report a slightly shallower gradient of [M/H] = –0.041±0.005dex/kpc. From MSTO stars (which are older than Cepheids)in the SEGUE data (Yanni et al., 2009), Cheng et al. (2012a)found a gradient of –0.066 dex/kpc for stars at 0.15 kpc < |z| <0.25 kpc, with a gradient flattening toward higher altitudes. Thisvalue is close to the one obtained for Cepheids. However, itshould be noted that most of the Cepheids are located below |z|= 0.15 kpc. Moreover, the SEGUE subsample considered con-tains several hundreds of stars in the [0.15–0.25] kpc layer, butover a range of Galactocentric distances limited to the [7–10]kpc region. Taking advantage of a large spectroscopic samplecollected in preparation for the CoRoT mission (Loeillet et al.,2008), Gazzano et al. (2013) determined the atmospheric param-eters of numerous Milky Way disk stars with the help of theMATISSE algorithm (Recio-Blanco et al., 2006). They reporta radial metallicity gradient of –0.097±0.015 dex/kpc with gi-ant stars and –0.053±0.015 dex/kpc with dwarfs; the latter invery good agreement with the value obtained from Cepheids.Most of the results quoted above concern the iron gradient andsometimes also the α elements (Cheng et al., 2012b; Gazzanoet al., 2013). Possible comparisons for a larger number of ele-ments await the results of the ongoing large spectroscopic sur-veys like APOGEE (Majewski et al., 2007), the GAIA-ESO sur-vey (Gilmore et al., 2012), or HERMES (Freeman, 2012).
6. Conclusions
We used high-resolution spectra (FEROS, ESPADONS,NARVAL) to determine the abundances of several light (Na,Al), α (Mg, Si, S, Ca), and heavy elements (Y, Zr, La, Ce, Nd,Eu) in a sample of 65 Milky Way Cepheids. Combining theseresults with accurate distances from p-W relations in the NIRenables us to study the abundance gradients in the Milky Way.Our results are in good agreement with previous studies fromCepheids or other tracers. In particular:
– We confirm an upward shift of ≈0.2 dex for the Mg abun-dances first reported by Luck & Lambert (2011).
– The locus of our points is for most of the elements in goodagreement with previous Cepheid studies (Yong et al., 2006;Luck et al., 2011; Luck & Lambert, 2011). The slopes aresometimes discrepant, mainly due to sampling effects, as afew points sometimes have a strong influence on the determi-nation of the slope. Our sample, originally designed to studyeither the outer disk or the very inner disk, lacks targets inthe solar neighborhood.
– We confirm the existence of a gradient for all the heavy ele-ments in the context of an LTE analysis. Moreover, for Y, Nd,and especially La, we find lower abundances for Cepheids inthe outer disk than reported in previous studies, leading to
10
B. Lemasle et al.: Galactic abundance gradients from Cepheids:
steeper slopes for the gradients. We attribute this effect to thedifferences in the line lists used by different groups. On theother hand, Andrievsky et al. (2013) report no gradient foran NLTE analysis of Ba. Further investigations are neededto assess the behavior of the heavy elements and quantify, inparticular, the role of the asymptotic giant branch stars in thechemical evolution of the Milky Way.
– Current data do not support a flattening of the gradients inthe outer disk, in agreement with the observations of Lucket al. (2011), Luck & Lambert (2011), and the simulations ofMinchev et al. (2012). This is different from what is observedin open clusters, but remains coherent with a picture wherethe transition zone between the inner disk and the outer diskwould move outward with time (Jacobson et al., 2011b).
Acknowledgements. We thank the anonymous referee for the careful reading ofour manuscript and the valuable comments. This work was partially supportedby PRIN-INAF 2011 “Tracing the formation and evolution of the Galactic halowith VST” (PI: M. Marconi) and by PRIN-MIUR (2010LY5N2T) “Chemicaland dynamical evolution of the Milky Way and Local Group galaxies” (PI: F.Matteucci). G.B. thanks ESO for support as science visitors. V.K. is gratefulfor the support from the Swiss National Science Foundation, project SCOPESNo. IZ73Z0-128180. B.L. thanks the French Programme National de PhysiqueStellaire (PNPS) for the financial support of the observing missions.
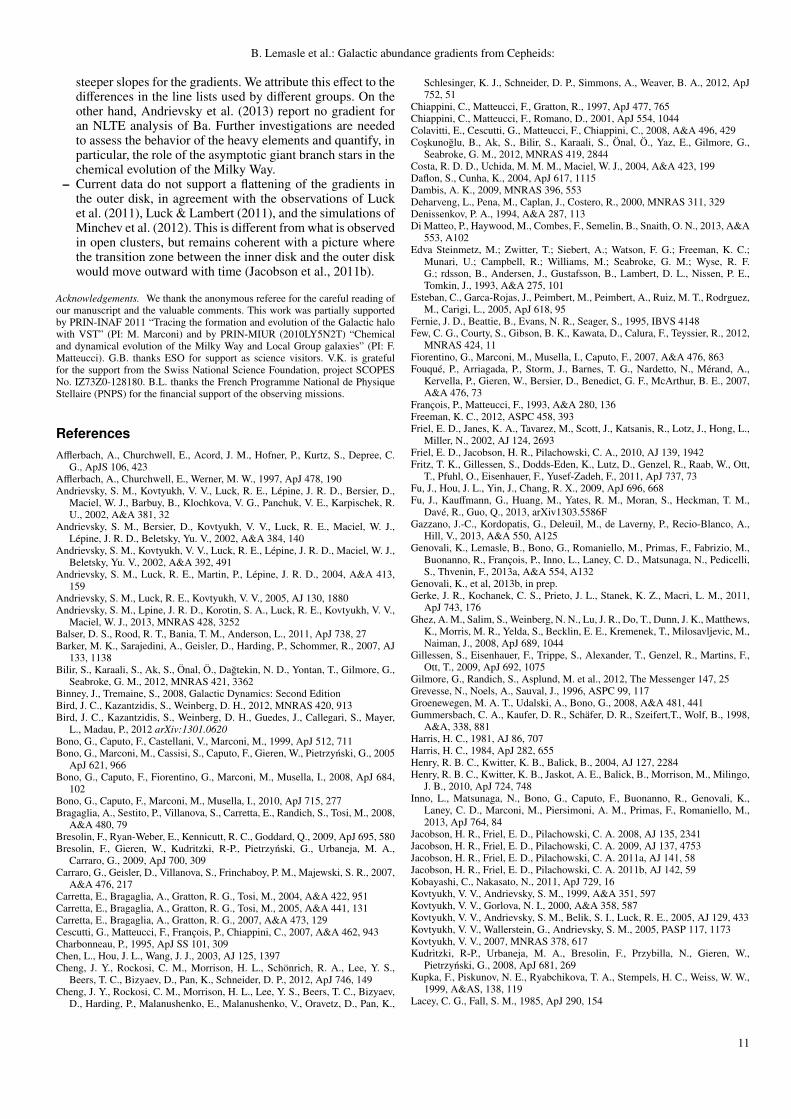
ReferencesAfflerbach, A., Churchwell, E., Acord, J. M., Hofner, P., Kurtz, S., Depree, C.
G., ApJS 106, 423Afflerbach, A., Churchwell, E., Werner, M. W., 1997, ApJ 478, 190Andrievsky, S. M., Kovtyukh, V. V., Luck, R. E., Lepine, J. R. D., Bersier, D.,
Maciel, W. J., Barbuy, B., Klochkova, V. G., Panchuk, V. E., Karpischek, R.U., 2002, A&A 381, 32
Andrievsky, S. M., Bersier, D., Kovtyukh, V. V., Luck, R. E., Maciel, W. J.,Lepine, J. R. D., Beletsky, Yu. V., 2002, A&A 384, 140
Andrievsky, S. M., Kovtyukh, V. V., Luck, R. E., Lepine, J. R. D., Maciel, W. J.,Beletsky, Yu. V., 2002, A&A 392, 491
Andrievsky, S. M., Luck, R. E., Martin, P., Lepine, J. R. D., 2004, A&A 413,159
Andrievsky, S. M., Luck, R. E., Kovtyukh, V. V., 2005, AJ 130, 1880Andrievsky, S. M., Lpine, J. R. D., Korotin, S. A., Luck, R. E., Kovtyukh, V. V.,
Maciel, W. J., 2013, MNRAS 428, 3252Balser, D. S., Rood, R. T., Bania, T. M., Anderson, L., 2011, ApJ 738, 27Barker, M. K., Sarajedini, A., Geisler, D., Harding, P., Schommer, R., 2007, AJ
133, 1138Bilir, S., Karaali, S., Ak, S., Onal, O., Dagtekin, N. D., Yontan, T., Gilmore, G.,
Seabroke, G. M., 2012, MNRAS 421, 3362Binney, J., Tremaine, S., 2008, Galactic Dynamics: Second EditionBird, J. C., Kazantzidis, S., Weinberg, D. H., 2012, MNRAS 420, 913Bird, J. C., Kazantzidis, S., Weinberg, D. H., Guedes, J., Callegari, S., Mayer,
L., Madau, P., 2012 arXiv:1301.0620Bono, G., Caputo, F., Castellani, V., Marconi, M., 1999, ApJ 512, 711Bono, G., Marconi, M., Cassisi, S., Caputo, F., Gieren, W., Pietrzynski, G., 2005
ApJ 621, 966Bono, G., Caputo, F., Fiorentino, G., Marconi, M., Musella, I., 2008, ApJ 684,
102Bono, G., Caputo, F., Marconi, M., Musella, I., 2010, ApJ 715, 277Bragaglia, A., Sestito, P., Villanova, S., Carretta, E., Randich, S., Tosi, M., 2008,
A&A 480, 79Bresolin, F., Ryan-Weber, E., Kennicutt, R. C., Goddard, Q., 2009, ApJ 695, 580Bresolin, F., Gieren, W., Kudritzki, R-P., Pietrzynski, G., Urbaneja, M. A.,
Carraro, G., 2009, ApJ 700, 309Carraro, G., Geisler, D., Villanova, S., Frinchaboy, P. M., Majewski, S. R., 2007,
A&A 476, 217Carretta, E., Bragaglia, A., Gratton, R. G., Tosi, M., 2004, A&A 422, 951Carretta, E., Bragaglia, A., Gratton, R. G., Tosi, M., 2005, A&A 441, 131Carretta, E., Bragaglia, A., Gratton, R. G., 2007, A&A 473, 129Cescutti, G., Matteucci, F., Francois, P., Chiappini, C., 2007, A&A 462, 943Charbonneau, P., 1995, ApJ SS 101, 309Chen, L., Hou, J. L., Wang, J. J., 2003, AJ 125, 1397Cheng, J. Y., Rockosi, C. M., Morrison, H. L., Schonrich, R. A., Lee, Y. S.,
Beers, T. C., Bizyaev, D., Pan, K., Schneider, D. P., 2012, ApJ 746, 149Cheng, J. Y., Rockosi, C. M., Morrison, H. L., Lee, Y. S., Beers, T. C., Bizyaev,
D., Harding, P., Malanushenko, E., Malanushenko, V., Oravetz, D., Pan, K.,
Schlesinger, K. J., Schneider, D. P., Simmons, A., Weaver, B. A., 2012, ApJ752, 51
Chiappini, C., Matteucci, F., Gratton, R., 1997, ApJ 477, 765Chiappini, C., Matteucci, F., Romano, D., 2001, ApJ 554, 1044Colavitti, E., Cescutti, G., Matteucci, F., Chiappini, C., 2008, A&A 496, 429Coskunoglu, B., Ak, S., Bilir, S., Karaali, S., Onal, O., Yaz, E., Gilmore, G.,
Seabroke, G. M., 2012, MNRAS 419, 2844Costa, R. D. D., Uchida, M. M. M., Maciel, W. J., 2004, A&A 423, 199Daflon, S., Cunha, K., 2004, ApJ 617, 1115Dambis, A. K., 2009, MNRAS 396, 553Deharveng, L., Pena, M., Caplan, J., Costero, R., 2000, MNRAS 311, 329Denissenkov, P. A., 1994, A&A 287, 113Di Matteo, P., Haywood, M., Combes, F., Semelin, B., Snaith, O. N., 2013, A&A
553, A102Edva Steinmetz, M.; Zwitter, T.; Siebert, A.; Watson, F. G.; Freeman, K. C.;
Munari, U.; Campbell, R.; Williams, M.; Seabroke, G. M.; Wyse, R. F.G.; rdsson, B., Andersen, J., Gustafsson, B., Lambert, D. L., Nissen, P. E.,Tomkin, J., 1993, A&A 275, 101
Esteban, C., Garca-Rojas, J., Peimbert, M., Peimbert, A., Ruiz, M. T., Rodrguez,M., Carigi, L., 2005, ApJ 618, 95
Fernie, J. D., Beattie, B., Evans, N. R., Seager, S., 1995, IBVS 4148Few, C. G., Courty, S., Gibson, B. K., Kawata, D., Calura, F., Teyssier, R., 2012,
MNRAS 424, 11Fiorentino, G., Marconi, M., Musella, I., Caputo, F., 2007, A&A 476, 863Fouque, P., Arriagada, P., Storm, J., Barnes, T. G., Nardetto, N., Merand, A.,
Kervella, P., Gieren, W., Bersier, D., Benedict, G. F., McArthur, B. E., 2007,A&A 476, 73
Francois, P., Matteucci, F., 1993, A&A 280, 136Freeman, K. C., 2012, ASPC 458, 393Friel, E. D., Janes, K. A., Tavarez, M., Scott, J., Katsanis, R., Lotz, J., Hong, L.,
Miller, N., 2002, AJ 124, 2693Friel, E. D., Jacobson, H. R., Pilachowski, C. A., 2010, AJ 139, 1942Fritz, T. K., Gillessen, S., Dodds-Eden, K., Lutz, D., Genzel, R., Raab, W., Ott,
T., Pfuhl, O., Eisenhauer, F., Yusef-Zadeh, F., 2011, ApJ 737, 73Fu, J., Hou, J. L., Yin, J., Chang, R. X., 2009, ApJ 696, 668Fu, J., Kauffmann, G., Huang, M., Yates, R. M., Moran, S., Heckman, T. M.,
Dave, R., Guo, Q., 2013, arXiv1303.5586FGazzano, J.-C., Kordopatis, G., Deleuil, M., de Laverny, P., Recio-Blanco, A.,
Hill, V., 2013, A&A 550, A125Genovali, K., Lemasle, B., Bono, G., Romaniello, M., Primas, F., Fabrizio, M.,
Buonanno, R., Francois, P., Inno, L., Laney, C. D., Matsunaga, N., Pedicelli,S., Thvenin, F., 2013a, A&A 554, A132
Genovali, K., et al, 2013b, in prep.Gerke, J. R., Kochanek, C. S., Prieto, J. L., Stanek, K. Z., Macri, L. M., 2011,
ApJ 743, 176Ghez, A. M., Salim, S., Weinberg, N. N., Lu, J. R., Do, T., Dunn, J. K., Matthews,
K., Morris, M. R., Yelda, S., Becklin, E. E., Kremenek, T., Milosavljevic, M.,Naiman, J., 2008, ApJ 689, 1044
Gillessen, S., Eisenhauer, F., Trippe, S., Alexander, T., Genzel, R., Martins, F.,Ott, T., 2009, ApJ 692, 1075
Gilmore, G., Randich, S., Asplund, M. et al., 2012, The Messenger 147, 25Grevesse, N., Noels, A., Sauval, J., 1996, ASPC 99, 117Groenewegen, M. A. T., Udalski, A., Bono, G., 2008, A&A 481, 441Gummersbach, C. A., Kaufer, D. R., Schafer, D. R., Szeifert,T., Wolf, B., 1998,
A&A, 338, 881Harris, H. C., 1981, AJ 86, 707Harris, H. C., 1984, ApJ 282, 655Henry, R. B. C., Kwitter, K. B., Balick, B., 2004, AJ 127, 2284Henry, R. B. C., Kwitter, K. B., Jaskot, A. E., Balick, B., Morrison, M., Milingo,
J. B., 2010, ApJ 724, 748Inno, L., Matsunaga, N., Bono, G., Caputo, F., Buonanno, R., Genovali, K.,
Laney, C. D., Marconi, M., Piersimoni, A. M., Primas, F., Romaniello, M.,2013, ApJ 764, 84
Jacobson, H. R., Friel, E. D., Pilachowski, C. A. 2008, AJ 135, 2341Jacobson, H. R., Friel, E. D., Pilachowski, C. A. 2009, AJ 137, 4753Jacobson, H. R., Friel, E. D., Pilachowski, C. A. 2011a, AJ 141, 58Jacobson, H. R., Friel, E. D., Pilachowski, C. A. 2011b, AJ 142, 59Kobayashi, C., Nakasato, N., 2011, ApJ 729, 16Kovtyukh, V. V., Andrievsky, S. M., 1999, A&A 351, 597Kovtyukh, V. V., Gorlova, N. I., 2000, A&A 358, 587Kovtyukh, V. V., Andrievsky, S. M., Belik, S. I., Luck, R. E., 2005, AJ 129, 433Kovtyukh, V. V., Wallerstein, G., Andrievsky, S. M., 2005, PASP 117, 1173Kovtyukh, V. V., 2007, MNRAS 378, 617Kudritzki, R-P., Urbaneja, M. A., Bresolin, F., Przybilla, N., Gieren, W.,
Pietrzynski, G., 2008, ApJ 681, 269Kupka, F., Piskunov, N. E., Ryabchikova, T. A., Stempels, H. C., Weiss, W. W.,
1999, A&AS, 138, 119Lacey, C. G., Fall, S. M., 1985, ApJ 290, 154
11
B. Lemasle et al.: Galactic abundance gradients from Cepheids:
Laney, C. D., Stobie, R. S., 1994, MNRAS 266, 441Laney, C. D., Caldwell, J. A. R., 2007, MNRAS 377, 147Lemasle, B., Francois, P., Bono, G., Mottini, M., Primas, F., Romaniello, M.,
2007, A&A 467, 283Lemasle, B., Francois, P., Piersimoni, A. Pedicelli, S., Bono, G., Laney, C. D.,
Primas, F., Romaniello, M., 2008, A&A 490, 613Loeillet, B., Bouchy, F., Deleuil, M., Royer, F., Bouret, J. C., Moutou, C., Barge,
P., de Laverny, P., Pont, F., Recio-Blanco, A., Santos, N. C., 2008, A&A 479,865
Luck, R. E., Gieren, W. P., Andrievsky, S. M., Kovtyukh, V. V., Fouque, P., Pont,P., Kienzle, F., 2003, A&A 401, 939
Luck, R. E., Andrievsky, S. M., 2004, AJ 128, 343Luck, R. E., Kovtyukh, V. V., Andrievsky, S. M., 2006, AJ 132, 902Luck, R. E., Andrievsky, S. M., Fokin, A., Kovtyukh, V. V., 2008, AJ 136, 98Luck, R. E.; Andrievsky, S. M., Kovtyukh, V. V., Gieren, W., Graczyk, D., 2011,
AJ 142, 51Luck, R. E., Lambert, D. L., 2011, AJ 142, 136Maciel, W. J., Quireza, C., 1999, A&A 345, 629Maciel, W. J., Costa, R. D. D., Uchida, M. M. M., 2003, A&A 397, 667Maciel, W. J., Costa, R. D. D., 2009, in IAU Symposium, Vol. 254, IAU
Symposium, ed. J. Andersen, J. Bland-Hawthorn, & B. Nordstrom, 38Madore, B. F., 1982, ApJ 253, 575Madore, B. F., Freedman, W. F., 2009, ApJ 696, 1498Magrini, L., Sestito, P., Randich, S., Galli, D., 2009, A&A 494, 95Magrini, L., Stanghellini, L., Villaver, E., 2009, ApJ 696, 729Magrini, L., Randich, S., Zoccali, M., Jilkova, L., Carraro, G., Galli, D., Maiorca,
E., Busso, M., 2010, A&A 523, A11Majaess, D., 2010, AcA 60, 55Majaess, D., Turner, D., Gieren, W., 2011,-0.063 ApJ 741, 36Majewski, S. R., Skrutskie, M. F., Schiavon, R. P., Wilson, J. C., O’Connell, R.
W., Smith, V. V., Shetrone, M., Cunha, K., Frinchaboy, P. M., Reid, I. N. etal., 2007, BAAS 39, 962
Malkin, Z., 2012, arXiv:1202.6128Matsunaga, N., Kawadu, T., Nishiyama, S., Nagayama, T., Hatano, H., Tamura,
M., Glass, I. S., Nagata, T., 2009, MNRAS 399, 1709Matsunaga, N., Feast, M. W., Kawadu, T., Nishiyama, S., Nagayama, T., Nagata,
T., Tamura, M., Bono, G., Kobayashi, N., 2013, MNRAS 429, 385Matteucci, F., Francois, P., 1989, MNRAS 239, 885Merle, T., Thevenin, F., Pichon, B., Bigot, L., 2011, MNRAS 418, 863Minchev, I., Famaey, B., Combes, F., Di Matteo P., Mouhcine, M., Wozniak, H.,
2011, A&A 527, A147Minchev, I., Famaey, B., 2010, ApJ 722, 112Minchev, I., Chiappini, C., Martig, M., 2012, arXiv:1208.1506Molla, M., Dıaz, A. I., 2005, MNRAS 358, 521Monson, A. J., Pierce, M. J., 2011, ApJS 193, 12Ngeow, C-C., Kanbur, S. M., 2005, MNRAS 360, 1033Ngeow, C-C., 2012, ApJ 747, 50Nordstrom, B., Mayor, M., Andersen, J., Holmberg, J., Pont, F., Jørgensen, B.
R., Olsen, E. H., Udry, S., Mowlavi, N., 2004, A&A 418, 989Pancino, E., Carrera, R., Rossetti, E., Gallart, C., 2010, A&A 511, A56Pedicelli, S., Bono, G., Lemasle, B., Francois, P., Groenewegen, M., Lub, J., Pel,
J. W., Laney, D., Piersimoni, A., Romaniello, M., Buonanno, R., Caputo, F.,Cassisi, S., Castelli, F., Leurini, S., Pietrinferni, A., Primas, F., Pritchard, J.,2009, A&A 504, 81
Pedicelli, S., Lemasle, B., Groenewegen, M., Romaniello, M., Bono, G., Laney,D., Francois, P.,M., Buonanno, R., Caputo, F.,Lub, J., Pel, J. W., Primas, F.,Pritchard, J., 2010, A&A 518, A11
Perinotto, M., Morbidelli, L., 2006, MNRAS 372, 45Pilkington, K., Few, C. G., Gibson, B. K., Calura, F., Michel-Dansac, L.,
Thacker, R. J., Molla, M., Matteucci, F., Rahimi, A., Kawata, D., Kobayashi,C., Brook, C. B., Stinson, G. S., Couchman, H. M. P., Bailin, J., Wadsley, J.,2012, A&A 540, A56
Piovan, L., Chiosi, C., Merlin, E., Grassi, T., Tantalo, R., Buonomo, U., Cassara,L. P., 2011, arXiv1107.4567P
Portinari, L., Chiosi, C. 2000, A&A 355, 929Pottasch, S. R., Bernard-Salas, J., 2006, A&A 457, 189Prantzos, N., Boissier, S., 2000, MNRAS 313, 338Quillen, A. C., Minchev, I., Bland-Hawthorn, J., Haywood M., 2009, MNRAS
397, 1599Quireza, C., Rood, R. T., Bania, T. M., Balser, D. S., Maciel, W. J., 2006b ApJ
653, 1226Rahimi, A., Kawata, D., Allende Prieto, C., Brook, C. B., Gibson, B. K.,
Kiessling, A., 2011, MNRAS 415, 1469Recio-Blanco, A., Bijaoui, A., de Laverny, P., 2006, MNRAS 370, 141Reid, M. J., Menten, K. M., Zheng, X. W., Brunthaler, A., Xu, Y., 2009, ApJ
705, 1548Rolleston, W. R. J., Smartt, S. J., Dufton, P. L., Ryans, R. S. I., 2000, A&A, 363,
537
Romaniello, M., Primas, F., Mottini, M., Pedicelli, S., Lemasle, B., Bono, G.,Francois, P., Groenewegen, M. A. T., Laney, C. D., 2008, A&A 488, 731
Roskar, R., Debattista, V. P., Stinson, G. S., Quinn, T. R., Kaufmann, T., Wadsley,J., 2008a ApJ 675, 65
Roskar, R., Debattista, V. P., Quinn, T. R., Stinson, G. S., Wadsley, J., 2008, ApJ684, 79
Rudolph, A. L., Fich, M., Bell, G. R., Norsen, T., Simpson, J. P., Haas, M. R.,Erickson, E. F., 2006, ApJS 162, 346
Ryabchikova, T. A., Piskunov, N. E., Stempels, H. C., Kupka, F., Weiss, W.W., 1999, Proc. of the 6th International Colloquium on Atomic Spectra andOscillator Strengths, Victoria BC, Canada, 1998, Physica Scripta T83, 162
Sanders, N., Caldwell, N., McDowell, J., 2010, BAAS 36, 1113Sasselov, D. D., 1986, PASP 98, 561Scarano, S., Lepine, J. R. D., 2013, MNRAS 428, 625Schonrich, R., Binney, J., 2009, MNRAS 396, 203Sellwood, J. A., Binney, J. J., 2002, MNRAS 336, 785Sestito, P., Bragaglia, A., Randich, S., Carretta, E., Prisinzano, L., Tosi, M., 2006,
A&A 458, 121Sestito, P., Randich, S., Bragaglia, A., 2007, A&A 465, 185Sestito, P., Bragaglia, A., Randich, S., Pallavicini, R., Andrievsky, S. M.,
Korotin, S. A. 2008, A&A 488, 943Shappee, B. J., Stanek, K. Z., 2011, ApJ 733, 124Simpson, J. P., Colgan, S. W. J., Rubin, R. H., Erickson, E. F., Haas, M. R., 1995,
ApJ 444, 721Smartt, S. J., Rolleston, W. R. J., 1997, ApJ 481, L47Soszynski, I., Gieren, W., Pietrzynski, G., 2005, PASP 117, 823Spitoni, E., Matteucci, F., 2011, A&A 531, 72Spitzer, L., Schwarzschild, M., 1953 ApJ 118, 106Stanghellini, L., Guerrero, M. A., Cunha, K., Manchado, A., Villaver, E., 2006,
ApJ 651, 898Stanghellini, L., Haywood, M., 2010, ApJ 714, 1096Steinmetz, M., Zwitter, T., Siebert, A., Watson, F. G., Freeman, K. C., Munari,
U., Campbell, R., Williams, M., Seabroke, G. M., Wyse, R. F. G. et al., 2006,AJ 132, 1645
Stinson, G. S., Bailin, J., Couchman, H., Wadsley, J., Shen, S., Nickerson, S.,Brook, C., Quinn, T., 2010, MNRAS 408, 812
Storm, J., Gieren, W., Fouque, P., Barnes, T. G., Pietrzynski, G., Nardetto, N.,Weber, M., Granzer, T., Strassmeier, K. G., 2011a, A&A 534, 94
Storm, J., Gieren, W., Fouque, P., Barnes, T. G., Soszynski, I., Pietrzynski, G.,Nardetto, N., Queloz, D., 2011b, A&A 534, 95
Takeda, Y., Kang, D.-I., Han, I., Lee, B.-C., Kim, K.-M., 2013, MNRAS 432,769
Tammann, G. A., Sandage, A., Reindl, B., 2003, A&A 404, 423Trippe, S., Gillessen, S., Gerhard, O. E., Bartko, H., Fritz, T. K., Maness, H. L.,
Eisenhauer, F., Martins, F., Ott, T., Dodds-Eden, K., Genzel, R., 2008, A&A492, 419
Twarog, B. A., Ashman, K. M., Antony-Twarog, B. J., 1997, AJ 114, 2556Usenko, I. A., Kniazev, A. Y., Berdnikov, L. N., Kravtsov, V. V., 2011, AstL 37,
499Usenko, I. A., Berdnikov, L. N., Kravtsov, V. V., Kniazev, A. Y., Chini, R.,
Hoffmeister, V. H., Stahl, O., Drass, H., 2011, AstL 37, 718Vilchez, J. M., Esteban, C., 1996, MNRAS 280, 720Vlajic, M., Bland-Hawthorn, J., Freeman, K. C., 2009, ApJ 697, 361Vlajic, M., Bland-Hawthorn, J., Freeman, K. C., 2011, ApJ 732, 7Wang, Y., Zhao, G., 2013, ApJ 769, 4Wiersma, R. P. C., Schaye, J., Theuns, T.. 2011, MNRAS 415, 353Yanny, B., Rockosi, C., Newberg, H. J., Knapp, G. R. et al, 2009 AJ 137, 4377Yong, D., Carney, B. W., de Almeida, M. L. T., 2005, AJ 130, 597Yong, D., Carney, B. W., de Almeida, M. L. T., Pohl, B. L., 2006, AJ 131, 2256Yong, D., Carney, B. W., Friel, E. D., 2012, AJ 144, 95
Appendix A: Line list
12

B. Lemasle et al.: Galactic abundance gradients from Cepheids:
Wavelength Element χex log g fÅ eV
7835.31 Al I 4.02 –0.657836.13 Al I 4.02 –0.494486.91 Ce II 0.29 –0.264554.04 Ba II 0.00 0.174562.37 Ce II 0.48 0.234578.56 Ca I 2.52 –0.704685.27 Ca I 2.93 –0.884721.02 Ca II 7.05 –0.784959.12 Nd II 0.06 –0.805044.02 Ce I 1.21 –0.075092.79 Nd II 0.38 –0.615112.28 Zr II 1.66 –0.855114.56 La II 0.23 –1.035119.12 Y II 0.99 –1.365130.59 Nd II 1.30 0.455181.17 Nd II 0.86 –0.745289.81 Y II 1.03 –1.855290.82 La II 0.00 –1.655349.47 Ca I 2.71 –0.315402.77 Y II 1.84 –0.635431.52 Nd II 1.12 –0.475509.91 Y II 0.99 –0.955518.49 Ce II 1.15 –0.675581.97 Ca I 2.52 –0.555590.11 Ca I 2.52 –0.575601.28 Ca I 2.53 –0.525665.56 Si I 4.92 –1.945688.21 Na I 2.10 –0.405690.43 Si I 4.93 –1.775711.09 Mg I 4.35 –1.835728.89 Y II 1.84 –1.125805.77 La II 0.13 –1.565853.69 Ba II 0.60 –0.915867.56 Ca I 2.93 –1.575948.54 Si I 5.08 –1.136043.39 Ce II 1.21 –0.486125.03 Si I 5.61 –1.466141.71 Ba II 0.70 –0.036154.23 Na I 2.10 –1.556155.14 Si I 5.62 –0.756160.75 Na I 2.10 –1.256166.44 Ca I 2.52 –1.146244.48 Si I 5.62 –1.096262.29 La II 0.40 –1.226300.30 O I 0.00 –9.716363.77 O I 0.02 –10.26390.48 La II 0.32 –1.416414.98 Si I 5.87 –1.036437.64 Eu II 1.32 –0.326471.66 Ca I 2.53 –0.696496.89 Ba II 0.60 –0.416538.60 S I 8.05 –0.936645.13 Eu II 1.38 0.126696.02 Al I 3.14 –1.576698.67 Al I 3.14 –1.876740.08 Nd II 0.06 –1.536741.63 Si I 5.98 –1.656748.84 S I 7.87 –0.606757.17 S I 7.87 –0.316774.27 La II 0.13 –1.716795.41 Y II 1.74 –1.037034.90 Si I 5.87 –0.887375.25 Si I 6.19 –1.057423.50 Si I 5.62 –0.187680.27 Si I 5.86 –0.697849.97 Si I 6.19 –0.727881.88 Y II 1.84 –0.577932.35 Si I 5.96 –0.477944.00 Si I 5.98 –0.318712.69 Mg I 5.93 –1.378736.02 Mg I 5.95 –0.368772.87 Al I 4.02 –0.178773.90 Al I 4.02 –0.029237.54 S I 6.53 0.049276.97 Zr I 0.69 –1.00
Table A.1. List of the absorption lines used for the determinationof the abundances. The list is ordered by wavelength and alsodisplays the excitation potential (χex) and the logarithm of theweighted oscillator strength (log g f ) of the transition.
13

B. Lemasle et al.: Galactic abundance gradients from Cepheids:
-1.0
0.0
1.0
[Na/
H]
[Na/H]=-0.066Rg+0.843
-1.0
0.0
1.0
[Al/
H]
[Al/H]=-0.046Rg+0.508
-1.0
0.0
1.0
[Mg
/H] [Mg/H]=-0.050Rg+0.594
-1.0
0.0
1.0
[Si/
H]
[Si/H]=-0.068Rg+0.690
-1.0
0.0
1.0
[S/H
]
[S/H]=-0.095Rg+1.031
-1.0
0.0
1.0
5 10 15 20
[Ca/
H]
Galactocentric distance (kpc)
[Ca/H]=-0.044Rg+0.409
Fig. 2. Galactic abundance gradients from Cepheids for light and α elements. The full red dots are our data. We also show data fromLuck & Lambert (2011) (black open circles) and if not available, from Luck et al. (2011) (black open triangles). When stars are incommon and the abundances fall within 0.2 dex, we overplotted black open circles (triangles) to the red dots. Yong et al. (2006)also provided data for several elements in the outer disk (full blue dots). All the distances are derived with a PWNIR relation. Arepresentative error bar is shown, including both the uncertainty on the atmospheric parameters and the rms uncertainty on the meanabundance [X/H]. We also indicate a linear fit to our data on the [4-15] kpc range (thick red line) and (for some elements) on the[7-15] kpc range (dashed red line).
14

B. Lemasle et al.: Galactic abundance gradients from Cepheids:
-1.0
0.0
1.0
[Y/H
][Y/H]=-0.062Rg+0.569
-1.0
0.0
1.0
[Zr/
H] [Zr/H]=-0.078Rg+0.814
-1.0
0.0
1.0
[La/
H] [La/H]=-0.045Rg+0.541
-1.0
0.0
1.0
[Ce/
H] [Ce/H]=-0.043Rg+0.597
-1.0
0.0
1.0
[Nd
/H] [Nd/H]=-0.046Rg+0.593
-1.0
0.0
1.0
5 10 15 20
[Eu/H
]
Galactocentric distance (kpc)
[Eu/H]=-0.066Rg+0.778
Fig. 3. Same as Fig. 2, but for heavy elements.
15
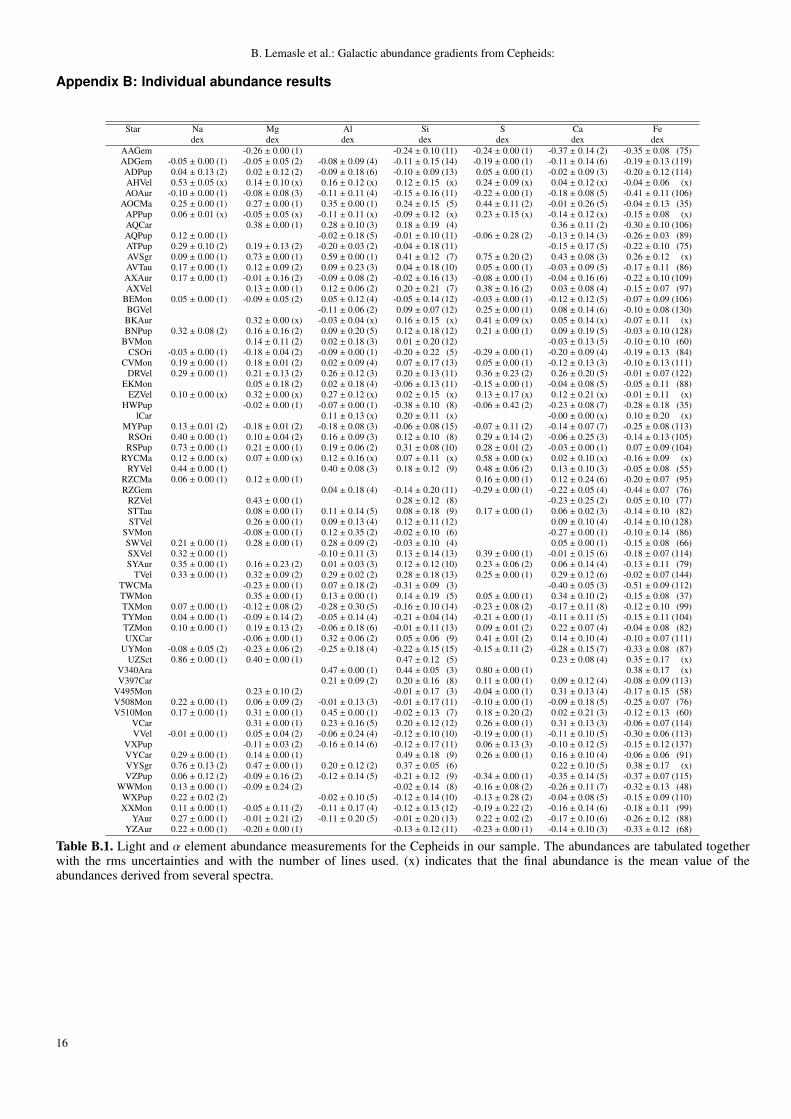
B. Lemasle et al.: Galactic abundance gradients from Cepheids:
Appendix B: Individual abundance results
Star Na Mg Al Si S Ca Fedex dex dex dex dex dex dex
AAGem -0.26 ± 0.00 (1) -0.24 ± 0.10 (11) -0.24 ± 0.00 (1) -0.37 ± 0.14 (2) -0.35 ± 0.08 (75)ADGem -0.05 ± 0.00 (1) -0.05 ± 0.05 (2) -0.08 ± 0.09 (4) -0.11 ± 0.15 (14) -0.19 ± 0.00 (1) -0.11 ± 0.14 (6) -0.19 ± 0.13 (119)ADPup 0.04 ± 0.13 (2) 0.02 ± 0.12 (2) -0.09 ± 0.18 (6) -0.10 ± 0.09 (13) 0.05 ± 0.00 (1) -0.02 ± 0.09 (3) -0.20 ± 0.12 (114)AHVel 0.53 ± 0.05 (x) 0.14 ± 0.10 (x) 0.16 ± 0.12 (x) 0.12 ± 0.15 (x) 0.24 ± 0.09 (x) 0.04 ± 0.12 (x) -0.04 ± 0.06 (x)AOAur -0.10 ± 0.00 (1) -0.08 ± 0.08 (3) -0.11 ± 0.11 (4) -0.15 ± 0.16 (11) -0.22 ± 0.00 (1) -0.18 ± 0.08 (5) -0.41 ± 0.11 (106)
AOCMa 0.25 ± 0.00 (1) 0.27 ± 0.00 (1) 0.35 ± 0.00 (1) 0.24 ± 0.15 (5) 0.44 ± 0.11 (2) -0.01 ± 0.26 (5) -0.04 ± 0.13 (35)APPup 0.06 ± 0.01 (x) -0.05 ± 0.05 (x) -0.11 ± 0.11 (x) -0.09 ± 0.12 (x) 0.23 ± 0.15 (x) -0.14 ± 0.12 (x) -0.15 ± 0.08 (x)AQCar 0.38 ± 0.00 (1) 0.28 ± 0.10 (3) 0.18 ± 0.19 (4) 0.36 ± 0.11 (2) -0.30 ± 0.10 (106)AQPup 0.12 ± 0.00 (1) -0.02 ± 0.18 (5) -0.01 ± 0.10 (11) -0.06 ± 0.28 (2) -0.13 ± 0.14 (3) -0.26 ± 0.03 (89)ATPup 0.29 ± 0.10 (2) 0.19 ± 0.13 (2) -0.20 ± 0.03 (2) -0.04 ± 0.18 (11) -0.15 ± 0.17 (5) -0.22 ± 0.10 (75)AVSgr 0.09 ± 0.00 (1) 0.73 ± 0.00 (1) 0.59 ± 0.00 (1) 0.41 ± 0.12 (7) 0.75 ± 0.20 (2) 0.43 ± 0.08 (3) 0.26 ± 0.12 (x)AVTau 0.17 ± 0.00 (1) 0.12 ± 0.09 (2) 0.09 ± 0.23 (3) 0.04 ± 0.18 (10) 0.05 ± 0.00 (1) -0.03 ± 0.09 (5) -0.17 ± 0.11 (86)AXAur 0.17 ± 0.00 (1) -0.01 ± 0.16 (2) -0.09 ± 0.08 (2) -0.02 ± 0.16 (13) -0.08 ± 0.00 (1) -0.04 ± 0.16 (6) -0.22 ± 0.10 (109)AXVel 0.13 ± 0.00 (1) 0.12 ± 0.06 (2) 0.20 ± 0.21 (7) 0.38 ± 0.16 (2) 0.03 ± 0.08 (4) -0.15 ± 0.07 (97)
BEMon 0.05 ± 0.00 (1) -0.09 ± 0.05 (2) 0.05 ± 0.12 (4) -0.05 ± 0.14 (12) -0.03 ± 0.00 (1) -0.12 ± 0.12 (5) -0.07 ± 0.09 (106)BGVel -0.11 ± 0.06 (2) 0.09 ± 0.07 (12) 0.25 ± 0.00 (1) 0.08 ± 0.14 (6) -0.10 ± 0.08 (130)BKAur 0.32 ± 0.00 (x) -0.03 ± 0.04 (x) 0.16 ± 0.15 (x) 0.41 ± 0.09 (x) 0.05 ± 0.14 (x) -0.07 ± 0.11 (x)BNPup 0.32 ± 0.08 (2) 0.16 ± 0.16 (2) 0.09 ± 0.20 (5) 0.12 ± 0.18 (12) 0.21 ± 0.00 (1) 0.09 ± 0.19 (5) -0.03 ± 0.10 (128)
BVMon 0.14 ± 0.11 (2) 0.02 ± 0.18 (3) 0.01 ± 0.20 (12) -0.03 ± 0.13 (5) -0.10 ± 0.10 (60)CSOri -0.03 ± 0.00 (1) -0.18 ± 0.04 (2) -0.09 ± 0.00 (1) -0.20 ± 0.22 (5) -0.29 ± 0.00 (1) -0.20 ± 0.09 (4) -0.19 ± 0.13 (84)
CVMon 0.19 ± 0.00 (1) 0.18 ± 0.01 (2) 0.02 ± 0.09 (4) 0.07 ± 0.17 (13) 0.05 ± 0.00 (1) -0.12 ± 0.13 (3) -0.10 ± 0.13 (111)DRVel 0.29 ± 0.00 (1) 0.21 ± 0.13 (2) 0.26 ± 0.12 (3) 0.20 ± 0.13 (11) 0.36 ± 0.23 (2) 0.26 ± 0.20 (5) -0.01 ± 0.07 (122)
EKMon 0.05 ± 0.18 (2) 0.02 ± 0.18 (4) -0.06 ± 0.13 (11) -0.15 ± 0.00 (1) -0.04 ± 0.08 (5) -0.05 ± 0.11 (88)EZVel 0.10 ± 0.00 (x) 0.32 ± 0.00 (x) 0.27 ± 0.12 (x) 0.02 ± 0.15 (x) 0.13 ± 0.17 (x) 0.12 ± 0.21 (x) -0.01 ± 0.11 (x)
HWPup -0.02 ± 0.00 (1) -0.07 ± 0.00 (1) -0.38 ± 0.10 (8) -0.06 ± 0.42 (2) -0.23 ± 0.08 (7) -0.28 ± 0.18 (35)lCar 0.11 ± 0.13 (x) 0.20 ± 0.11 (x) -0.00 ± 0.00 (x) 0.10 ± 0.20 (x)
MYPup 0.13 ± 0.01 (2) -0.18 ± 0.01 (2) -0.18 ± 0.08 (3) -0.06 ± 0.08 (15) -0.07 ± 0.11 (2) -0.14 ± 0.07 (7) -0.25 ± 0.08 (113)RSOri 0.40 ± 0.00 (1) 0.10 ± 0.04 (2) 0.16 ± 0.09 (3) 0.12 ± 0.10 (8) 0.29 ± 0.14 (2) -0.06 ± 0.25 (3) -0.14 ± 0.13 (105)RSPup 0.73 ± 0.00 (1) 0.21 ± 0.00 (1) 0.19 ± 0.06 (2) 0.31 ± 0.08 (10) 0.28 ± 0.01 (2) -0.03 ± 0.00 (1) 0.07 ± 0.09 (104)
RYCMa 0.12 ± 0.00 (x) 0.07 ± 0.00 (x) 0.12 ± 0.16 (x) 0.07 ± 0.11 (x) 0.58 ± 0.00 (x) 0.02 ± 0.10 (x) -0.16 ± 0.09 (x)RYVel 0.44 ± 0.00 (1) 0.40 ± 0.08 (3) 0.18 ± 0.12 (9) 0.48 ± 0.06 (2) 0.13 ± 0.10 (3) -0.05 ± 0.08 (55)
RZCMa 0.06 ± 0.00 (1) 0.12 ± 0.00 (1) 0.16 ± 0.00 (1) 0.12 ± 0.24 (6) -0.20 ± 0.07 (95)RZGem 0.04 ± 0.18 (4) -0.14 ± 0.20 (11) -0.29 ± 0.00 (1) -0.22 ± 0.05 (4) -0.44 ± 0.07 (76)
RZVel 0.43 ± 0.00 (1) 0.28 ± 0.12 (8) -0.23 ± 0.25 (2) 0.05 ± 0.10 (77)STTau 0.08 ± 0.00 (1) 0.11 ± 0.14 (5) 0.08 ± 0.18 (9) 0.17 ± 0.00 (1) 0.06 ± 0.02 (3) -0.14 ± 0.10 (82)STVel 0.26 ± 0.00 (1) 0.09 ± 0.13 (4) 0.12 ± 0.11 (12) 0.09 ± 0.10 (4) -0.14 ± 0.10 (128)
SVMon -0.08 ± 0.00 (1) 0.12 ± 0.35 (2) -0.02 ± 0.10 (6) -0.27 ± 0.00 (1) -0.10 ± 0.14 (86)SWVel 0.21 ± 0.00 (1) 0.28 ± 0.00 (1) 0.28 ± 0.09 (2) -0.03 ± 0.10 (4) 0.05 ± 0.00 (1) -0.15 ± 0.08 (66)SXVel 0.32 ± 0.00 (1) -0.10 ± 0.11 (3) 0.13 ± 0.14 (13) 0.39 ± 0.00 (1) -0.01 ± 0.15 (6) -0.18 ± 0.07 (114)SYAur 0.35 ± 0.00 (1) 0.16 ± 0.23 (2) 0.01 ± 0.03 (3) 0.12 ± 0.12 (10) 0.23 ± 0.06 (2) 0.06 ± 0.14 (4) -0.13 ± 0.11 (79)
TVel 0.33 ± 0.00 (1) 0.32 ± 0.09 (2) 0.29 ± 0.02 (2) 0.28 ± 0.18 (13) 0.25 ± 0.00 (1) 0.29 ± 0.12 (6) -0.02 ± 0.07 (144)TWCMa -0.23 ± 0.00 (1) 0.07 ± 0.18 (2) -0.31 ± 0.09 (3) -0.40 ± 0.05 (3) -0.51 ± 0.09 (112)TWMon 0.35 ± 0.00 (1) 0.13 ± 0.00 (1) 0.14 ± 0.19 (5) 0.05 ± 0.00 (1) 0.34 ± 0.10 (2) -0.15 ± 0.08 (37)TXMon 0.07 ± 0.00 (1) -0.12 ± 0.08 (2) -0.28 ± 0.30 (5) -0.16 ± 0.10 (14) -0.23 ± 0.08 (2) -0.17 ± 0.11 (8) -0.12 ± 0.10 (99)TYMon 0.04 ± 0.00 (1) -0.09 ± 0.14 (2) -0.05 ± 0.14 (4) -0.21 ± 0.04 (14) -0.21 ± 0.00 (1) -0.11 ± 0.11 (5) -0.15 ± 0.11 (104)TZMon 0.10 ± 0.00 (1) 0.19 ± 0.13 (2) -0.06 ± 0.18 (6) -0.01 ± 0.11 (13) 0.09 ± 0.01 (2) 0.22 ± 0.07 (4) -0.04 ± 0.08 (82)UXCar -0.06 ± 0.00 (1) 0.32 ± 0.06 (2) 0.05 ± 0.06 (9) 0.41 ± 0.01 (2) 0.14 ± 0.10 (4) -0.10 ± 0.07 (111)
UYMon -0.08 ± 0.05 (2) -0.23 ± 0.06 (2) -0.25 ± 0.18 (4) -0.22 ± 0.15 (15) -0.15 ± 0.11 (2) -0.28 ± 0.15 (7) -0.33 ± 0.08 (87)UZSct 0.86 ± 0.00 (1) 0.40 ± 0.00 (1) 0.47 ± 0.12 (5) 0.23 ± 0.08 (4) 0.35 ± 0.17 (x)
V340Ara 0.47 ± 0.00 (1) 0.44 ± 0.05 (3) 0.80 ± 0.00 (1) 0.38 ± 0.17 (x)V397Car 0.21 ± 0.09 (2) 0.20 ± 0.16 (8) 0.11 ± 0.00 (1) 0.09 ± 0.12 (4) -0.08 ± 0.09 (113)
V495Mon 0.23 ± 0.10 (2) -0.01 ± 0.17 (3) -0.04 ± 0.00 (1) 0.31 ± 0.13 (4) -0.17 ± 0.15 (58)V508Mon 0.22 ± 0.00 (1) 0.06 ± 0.09 (2) -0.01 ± 0.13 (3) -0.01 ± 0.17 (11) -0.10 ± 0.00 (1) -0.09 ± 0.18 (5) -0.25 ± 0.07 (76)V510Mon 0.17 ± 0.00 (1) 0.31 ± 0.00 (1) 0.45 ± 0.00 (1) -0.02 ± 0.13 (7) 0.18 ± 0.20 (2) 0.02 ± 0.21 (3) -0.12 ± 0.13 (60)
VCar 0.31 ± 0.00 (1) 0.23 ± 0.16 (5) 0.20 ± 0.12 (12) 0.26 ± 0.00 (1) 0.31 ± 0.13 (3) -0.06 ± 0.07 (114)VVel -0.01 ± 0.00 (1) 0.05 ± 0.04 (2) -0.06 ± 0.24 (4) -0.12 ± 0.10 (10) -0.19 ± 0.00 (1) -0.11 ± 0.10 (5) -0.30 ± 0.06 (113)
VXPup -0.11 ± 0.03 (2) -0.16 ± 0.14 (6) -0.12 ± 0.17 (11) 0.06 ± 0.13 (3) -0.10 ± 0.12 (5) -0.15 ± 0.12 (137)VYCar 0.29 ± 0.00 (1) 0.14 ± 0.00 (1) 0.49 ± 0.18 (9) 0.26 ± 0.00 (1) 0.16 ± 0.10 (4) -0.06 ± 0.06 (91)VYSgr 0.76 ± 0.13 (2) 0.47 ± 0.00 (1) 0.20 ± 0.12 (2) 0.37 ± 0.05 (6) 0.22 ± 0.10 (5) 0.38 ± 0.17 (x)VZPup 0.06 ± 0.12 (2) -0.09 ± 0.16 (2) -0.12 ± 0.14 (5) -0.21 ± 0.12 (9) -0.34 ± 0.00 (1) -0.35 ± 0.14 (5) -0.37 ± 0.07 (115)
WWMon 0.13 ± 0.00 (1) -0.09 ± 0.24 (2) -0.02 ± 0.14 (8) -0.16 ± 0.08 (2) -0.26 ± 0.11 (7) -0.32 ± 0.13 (48)WXPup 0.22 ± 0.02 (2) -0.02 ± 0.10 (5) -0.12 ± 0.14 (10) -0.13 ± 0.28 (2) -0.04 ± 0.08 (5) -0.15 ± 0.09 (110)XXMon 0.11 ± 0.00 (1) -0.05 ± 0.11 (2) -0.11 ± 0.17 (4) -0.12 ± 0.13 (12) -0.19 ± 0.22 (2) -0.16 ± 0.14 (6) -0.18 ± 0.11 (99)
YAur 0.27 ± 0.00 (1) -0.01 ± 0.21 (2) -0.11 ± 0.20 (5) -0.01 ± 0.20 (13) 0.22 ± 0.02 (2) -0.17 ± 0.10 (6) -0.26 ± 0.12 (88)YZAur 0.22 ± 0.00 (1) -0.20 ± 0.00 (1) -0.13 ± 0.12 (11) -0.23 ± 0.00 (1) -0.14 ± 0.10 (3) -0.33 ± 0.12 (68)
Table B.1. Light and α element abundance measurements for the Cepheids in our sample. The abundances are tabulated togetherwith the rms uncertainties and with the number of lines used. (x) indicates that the final abundance is the mean value of theabundances derived from several spectra.
16
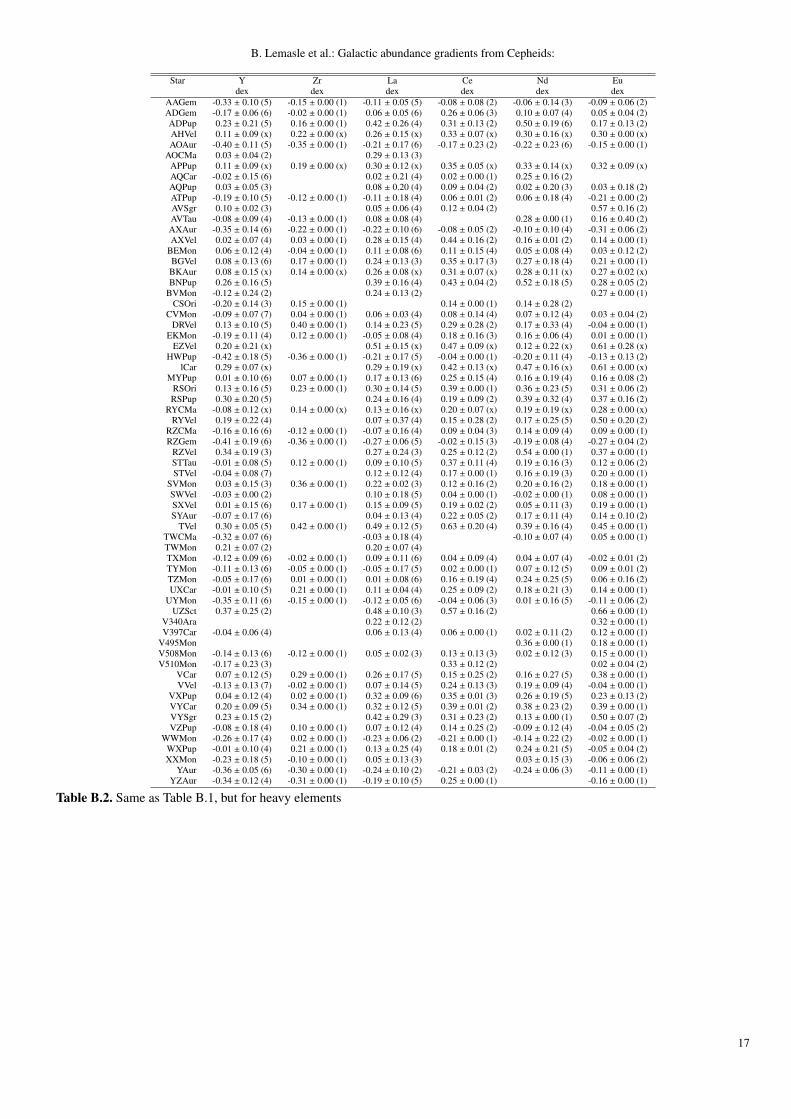
B. Lemasle et al.: Galactic abundance gradients from Cepheids:
Star Y Zr La Ce Nd Eudex dex dex dex dex dex
AAGem -0.33 ± 0.10 (5) -0.15 ± 0.00 (1) -0.11 ± 0.05 (5) -0.08 ± 0.08 (2) -0.06 ± 0.14 (3) -0.09 ± 0.06 (2)ADGem -0.17 ± 0.06 (6) -0.02 ± 0.00 (1) 0.06 ± 0.05 (6) 0.26 ± 0.06 (3) 0.10 ± 0.07 (4) 0.05 ± 0.04 (2)ADPup 0.23 ± 0.21 (5) 0.16 ± 0.00 (1) 0.42 ± 0.26 (4) 0.31 ± 0.13 (2) 0.50 ± 0.19 (6) 0.17 ± 0.13 (2)AHVel 0.11 ± 0.09 (x) 0.22 ± 0.00 (x) 0.26 ± 0.15 (x) 0.33 ± 0.07 (x) 0.30 ± 0.16 (x) 0.30 ± 0.00 (x)AOAur -0.40 ± 0.11 (5) -0.35 ± 0.00 (1) -0.21 ± 0.17 (6) -0.17 ± 0.23 (2) -0.22 ± 0.23 (6) -0.15 ± 0.00 (1)
AOCMa 0.03 ± 0.04 (2) 0.29 ± 0.13 (3)APPup 0.11 ± 0.09 (x) 0.19 ± 0.00 (x) 0.30 ± 0.12 (x) 0.35 ± 0.05 (x) 0.33 ± 0.14 (x) 0.32 ± 0.09 (x)AQCar -0.02 ± 0.15 (6) 0.02 ± 0.21 (4) 0.02 ± 0.00 (1) 0.25 ± 0.16 (2)AQPup 0.03 ± 0.05 (3) 0.08 ± 0.20 (4) 0.09 ± 0.04 (2) 0.02 ± 0.20 (3) 0.03 ± 0.18 (2)ATPup -0.19 ± 0.10 (5) -0.12 ± 0.00 (1) -0.11 ± 0.18 (4) 0.06 ± 0.01 (2) 0.06 ± 0.18 (4) -0.21 ± 0.00 (2)AVSgr 0.10 ± 0.02 (3) 0.05 ± 0.06 (4) 0.12 ± 0.04 (2) 0.57 ± 0.16 (2)AVTau -0.08 ± 0.09 (4) -0.13 ± 0.00 (1) 0.08 ± 0.08 (4) 0.28 ± 0.00 (1) 0.16 ± 0.40 (2)AXAur -0.35 ± 0.14 (6) -0.22 ± 0.00 (1) -0.22 ± 0.10 (6) -0.08 ± 0.05 (2) -0.10 ± 0.10 (4) -0.31 ± 0.06 (2)AXVel 0.02 ± 0.07 (4) 0.03 ± 0.00 (1) 0.28 ± 0.15 (4) 0.44 ± 0.16 (2) 0.16 ± 0.01 (2) 0.14 ± 0.00 (1)
BEMon 0.06 ± 0.12 (4) -0.04 ± 0.00 (1) 0.11 ± 0.08 (6) 0.11 ± 0.15 (4) 0.05 ± 0.08 (4) 0.03 ± 0.12 (2)BGVel 0.08 ± 0.13 (6) 0.17 ± 0.00 (1) 0.24 ± 0.13 (3) 0.35 ± 0.17 (3) 0.27 ± 0.18 (4) 0.21 ± 0.00 (1)BKAur 0.08 ± 0.15 (x) 0.14 ± 0.00 (x) 0.26 ± 0.08 (x) 0.31 ± 0.07 (x) 0.28 ± 0.11 (x) 0.27 ± 0.02 (x)BNPup 0.26 ± 0.16 (5) 0.39 ± 0.16 (4) 0.43 ± 0.04 (2) 0.52 ± 0.18 (5) 0.28 ± 0.05 (2)
BVMon -0.12 ± 0.24 (2) 0.24 ± 0.13 (2) 0.27 ± 0.00 (1)CSOri -0.20 ± 0.14 (3) 0.15 ± 0.00 (1) 0.14 ± 0.00 (1) 0.14 ± 0.28 (2)
CVMon -0.09 ± 0.07 (7) 0.04 ± 0.00 (1) 0.06 ± 0.03 (4) 0.08 ± 0.14 (4) 0.07 ± 0.12 (4) 0.03 ± 0.04 (2)DRVel 0.13 ± 0.10 (5) 0.40 ± 0.00 (1) 0.14 ± 0.23 (5) 0.29 ± 0.28 (2) 0.17 ± 0.33 (4) -0.04 ± 0.00 (1)
EKMon -0.19 ± 0.11 (4) 0.12 ± 0.00 (1) -0.05 ± 0.08 (4) 0.18 ± 0.16 (3) 0.16 ± 0.06 (4) 0.01 ± 0.00 (1)EZVel 0.20 ± 0.21 (x) 0.51 ± 0.15 (x) 0.47 ± 0.09 (x) 0.12 ± 0.22 (x) 0.61 ± 0.28 (x)
HWPup -0.42 ± 0.18 (5) -0.36 ± 0.00 (1) -0.21 ± 0.17 (5) -0.04 ± 0.00 (1) -0.20 ± 0.11 (4) -0.13 ± 0.13 (2)lCar 0.29 ± 0.07 (x) 0.29 ± 0.19 (x) 0.42 ± 0.13 (x) 0.47 ± 0.16 (x) 0.61 ± 0.00 (x)
MYPup 0.01 ± 0.10 (6) 0.07 ± 0.00 (1) 0.17 ± 0.13 (6) 0.25 ± 0.15 (4) 0.16 ± 0.19 (4) 0.16 ± 0.08 (2)RSOri 0.13 ± 0.16 (5) 0.23 ± 0.00 (1) 0.30 ± 0.14 (5) 0.39 ± 0.00 (1) 0.36 ± 0.23 (5) 0.31 ± 0.06 (2)RSPup 0.30 ± 0.20 (5) 0.24 ± 0.16 (4) 0.19 ± 0.09 (2) 0.39 ± 0.32 (4) 0.37 ± 0.16 (2)
RYCMa -0.08 ± 0.12 (x) 0.14 ± 0.00 (x) 0.13 ± 0.16 (x) 0.20 ± 0.07 (x) 0.19 ± 0.19 (x) 0.28 ± 0.00 (x)RYVel 0.19 ± 0.22 (4) 0.07 ± 0.37 (4) 0.15 ± 0.28 (2) 0.17 ± 0.25 (5) 0.50 ± 0.20 (2)
RZCMa -0.16 ± 0.16 (6) -0.12 ± 0.00 (1) -0.07 ± 0.16 (4) 0.09 ± 0.04 (3) 0.14 ± 0.09 (4) 0.09 ± 0.00 (1)RZGem -0.41 ± 0.19 (6) -0.36 ± 0.00 (1) -0.27 ± 0.06 (5) -0.02 ± 0.15 (3) -0.19 ± 0.08 (4) -0.27 ± 0.04 (2)
RZVel 0.34 ± 0.19 (3) 0.27 ± 0.24 (3) 0.25 ± 0.12 (2) 0.54 ± 0.00 (1) 0.37 ± 0.00 (1)STTau -0.01 ± 0.08 (5) 0.12 ± 0.00 (1) 0.09 ± 0.10 (5) 0.37 ± 0.11 (4) 0.19 ± 0.16 (3) 0.12 ± 0.06 (2)STVel -0.04 ± 0.08 (7) 0.12 ± 0.12 (4) 0.17 ± 0.00 (1) 0.16 ± 0.19 (3) 0.20 ± 0.00 (1)
SVMon 0.03 ± 0.15 (3) 0.36 ± 0.00 (1) 0.22 ± 0.02 (3) 0.12 ± 0.16 (2) 0.20 ± 0.16 (2) 0.18 ± 0.00 (1)SWVel -0.03 ± 0.00 (2) 0.10 ± 0.18 (5) 0.04 ± 0.00 (1) -0.02 ± 0.00 (1) 0.08 ± 0.00 (1)SXVel 0.01 ± 0.15 (6) 0.17 ± 0.00 (1) 0.15 ± 0.09 (5) 0.19 ± 0.02 (2) 0.05 ± 0.11 (3) 0.19 ± 0.00 (1)SYAur -0.07 ± 0.17 (6) 0.04 ± 0.13 (4) 0.22 ± 0.05 (2) 0.17 ± 0.11 (4) 0.14 ± 0.10 (2)
TVel 0.30 ± 0.05 (5) 0.42 ± 0.00 (1) 0.49 ± 0.12 (5) 0.63 ± 0.20 (4) 0.39 ± 0.16 (4) 0.45 ± 0.00 (1)TWCMa -0.32 ± 0.07 (6) -0.03 ± 0.18 (4) -0.10 ± 0.07 (4) 0.05 ± 0.00 (1)TWMon 0.21 ± 0.07 (2) 0.20 ± 0.07 (4)TXMon -0.12 ± 0.09 (6) -0.02 ± 0.00 (1) 0.09 ± 0.11 (6) 0.04 ± 0.09 (4) 0.04 ± 0.07 (4) -0.02 ± 0.01 (2)TYMon -0.11 ± 0.13 (6) -0.05 ± 0.00 (1) -0.05 ± 0.17 (5) 0.02 ± 0.00 (1) 0.07 ± 0.12 (5) 0.09 ± 0.01 (2)TZMon -0.05 ± 0.17 (6) 0.01 ± 0.00 (1) 0.01 ± 0.08 (6) 0.16 ± 0.19 (4) 0.24 ± 0.25 (5) 0.06 ± 0.16 (2)UXCar -0.01 ± 0.10 (5) 0.21 ± 0.00 (1) 0.11 ± 0.04 (4) 0.25 ± 0.09 (2) 0.18 ± 0.21 (3) 0.14 ± 0.00 (1)
UYMon -0.35 ± 0.11 (6) -0.15 ± 0.00 (1) -0.12 ± 0.05 (6) -0.04 ± 0.06 (3) 0.01 ± 0.16 (5) -0.11 ± 0.06 (2)UZSct 0.37 ± 0.25 (2) 0.48 ± 0.10 (3) 0.57 ± 0.16 (2) 0.66 ± 0.00 (1)
V340Ara 0.22 ± 0.12 (2) 0.32 ± 0.00 (1)V397Car -0.04 ± 0.06 (4) 0.06 ± 0.13 (4) 0.06 ± 0.00 (1) 0.02 ± 0.11 (2) 0.12 ± 0.00 (1)
V495Mon 0.36 ± 0.00 (1) 0.18 ± 0.00 (1)V508Mon -0.14 ± 0.13 (6) -0.12 ± 0.00 (1) 0.05 ± 0.02 (3) 0.13 ± 0.13 (3) 0.02 ± 0.12 (3) 0.15 ± 0.00 (1)V510Mon -0.17 ± 0.23 (3) 0.33 ± 0.12 (2) 0.02 ± 0.04 (2)
VCar 0.07 ± 0.12 (5) 0.29 ± 0.00 (1) 0.26 ± 0.17 (5) 0.15 ± 0.25 (2) 0.16 ± 0.27 (5) 0.38 ± 0.00 (1)VVel -0.13 ± 0.13 (7) -0.02 ± 0.00 (1) 0.07 ± 0.14 (5) 0.24 ± 0.13 (3) 0.19 ± 0.09 (4) -0.04 ± 0.00 (1)
VXPup 0.04 ± 0.12 (4) 0.02 ± 0.00 (1) 0.32 ± 0.09 (6) 0.35 ± 0.01 (3) 0.26 ± 0.19 (5) 0.23 ± 0.13 (2)VYCar 0.20 ± 0.09 (5) 0.34 ± 0.00 (1) 0.32 ± 0.12 (5) 0.39 ± 0.01 (2) 0.38 ± 0.23 (2) 0.39 ± 0.00 (1)VYSgr 0.23 ± 0.15 (2) 0.42 ± 0.29 (3) 0.31 ± 0.23 (2) 0.13 ± 0.00 (1) 0.50 ± 0.07 (2)VZPup -0.08 ± 0.18 (4) 0.10 ± 0.00 (1) 0.07 ± 0.12 (4) 0.14 ± 0.25 (2) -0.09 ± 0.12 (4) -0.04 ± 0.05 (2)
WWMon -0.26 ± 0.17 (4) 0.02 ± 0.00 (1) -0.23 ± 0.06 (2) -0.21 ± 0.00 (1) -0.14 ± 0.22 (2) -0.02 ± 0.00 (1)WXPup -0.01 ± 0.10 (4) 0.21 ± 0.00 (1) 0.13 ± 0.25 (4) 0.18 ± 0.01 (2) 0.24 ± 0.21 (5) -0.05 ± 0.04 (2)XXMon -0.23 ± 0.18 (5) -0.10 ± 0.00 (1) 0.05 ± 0.13 (3) 0.03 ± 0.15 (3) -0.06 ± 0.06 (2)
YAur -0.36 ± 0.05 (6) -0.30 ± 0.00 (1) -0.24 ± 0.10 (2) -0.21 ± 0.03 (2) -0.24 ± 0.06 (3) -0.11 ± 0.00 (1)YZAur -0.34 ± 0.12 (4) -0.31 ± 0.00 (1) -0.19 ± 0.10 (5) 0.25 ± 0.00 (1) -0.16 ± 0.00 (1)
Table B.2. Same as Table B.1, but for heavy elements
17


![1. Introduction.dolgop/outer15.pdf · equivalent curves have conjugated outer billiards all triangular outer billiards have bounded (in fact, periodic) orbits. It was proved in [5]](https://static.fdocument.org/doc/165x107/5fe1f80839c2b2720c3178ca/1-dolgopouter15pdf-equivalent-curves-have-conjugated-outer-billiards-all.jpg)