PKK mediates Bcl10-independent NF-κB Activation Induced by ...
1 3
Arch Toxicol (2016) 90:1163–1179DOI 10.1007/s00204-015-1536-3
ORGAN TOXICITY AND MECHANISMS
Activation of the Nrf2 response by intrinsic hepatotoxic drugs correlates with suppression of NF‑κB activation and sensitizes toward TNFα‑induced cytotoxicity
Bram Herpers1 · Steven Wink1 · Lisa Fredriksson1 · Zi Di1 · Giel Hendriks2 · Harry Vrieling2 · Hans de Bont1 · Bob van de Water1
Received: 27 January 2015 / Accepted: 12 May 2015 / Published online: 31 May 2015 © The Author(s) 2015. This article is published with open access at Springerlink.com
toward TNFα-mediated cytotoxicity. This was related to an adaptive primary protective response of Nrf2, since loss of Nrf2 enhanced this cytotoxic synergy with TNFα, while KEAP1 downregulation was cytoprotective. These data indi-cate that both Nrf2 and NF-κB signaling may be pivotal in the regulation of DILI. We propose that the NF-κB-inhibiting effects that coincide with a strong Nrf2 stress response likely sensitize liver cells to pro-apoptotic signaling cascades induced by intrinsic cytotoxic pro-inflammatory cytokines.
Keywords Drug-induced liver injury · Live-cell imaging · Nrf2 activation · Oxidative stress · NF-κB signaling
AbbreviationsBHA Butylated hydroxyanisoleDILI Drug-induced liver injuryPHH Primary human hepatocytessiRNA Small interfering RNAROS Reactive oxygen speciesAPAP Acetaminophen/paracetamolAMAP 3′-HydroxyacetanilideAMI AmiodaroneCBZ CarbamazepineCLZ ClozapineDCF DiclofenacDEM Di-ethyl maleateINH IsoniazidKTZ KetoconazoleMEN MenadioneMTX MethotrexateNFZ NefazodoneNPX NaproxenNTF NitrofurantoinOFX Ofloxacin
Abstract Drug-induced liver injury (DILI) is an impor-tant problem both in the clinic and in the development of new safer medicines. Two pivotal adaptation and survival responses to adverse drug reactions are oxidative stress and cytokine signaling based on the activation of the transcrip-tion factors Nrf2 and NF-κB, respectively. Here, we system-atically investigated Nrf2 and NF-κB signaling upon DILI-related drug exposure. Transcriptomics analyses of 90 DILI compounds in primary human hepatocytes revealed that a strong Nrf2 activation is associated with a suppression of endogenous NF-κB activity. These responses were translated into quantitative high-content live-cell imaging of induction of a selective Nrf2 target, GFP-tagged Srxn1, and the altered nuclear translocation dynamics of a subunit of NF-κB, GFP-tagged p65, upon TNFR signaling induced by TNFα using HepG2 cells. Strong activation of GFP-Srxn1 expression by DILI compounds typically correlated with suppression of NF-κB nuclear translocation, yet reversely, activation of NF-κB by TNFα did not affect the Nrf2 response. DILI compounds that provided strong Nrf2 activation, includ-ing diclofenac, carbamazepine and ketoconazole, sensitized
Bram Herpers, Steven Wink and Lisa Fredriksson have contributed equally to this work.
Electronic supplementary material The online version of this article (doi:10.1007/s00204-015-1536-3) contains supplementary material, which is available to authorized users.
* Bob van de Water [email protected]
1 Division of Toxicology, Leiden Academic Center for Drug Research, Leiden University, Einsteinweg 55, 2333 CC Leiden, The Netherlands
2 Department of Human Genetics, Leiden University Medical Center, Leiden, The Netherlands
1164 Arch Toxicol (2016) 90:1163–1179
1 3
SN SimvastatinTGZ Troglitazone
Introduction
Drug safety issues that lead to drug-induced liver injury (DILI) are the major reason for drug-related hospitaliza-tions and drug withdrawals. Often with no overt changes in hepatocellular toxicity parameters (e.g., rise in alanine or aspartate aminotransferase (ALT/AST) levels or increased total bilirubin) found in preclinical settings, drugs are (unknowingly) safely marketed until more than 1 in 10,000 drug users demonstrate signs of liver failure (Kaplowitz 2005). Novel, predictive systems for DILI based on mecha-nistic understanding will be essential to pave the way for-ward for improved drug safety assessment.
The common notion around DILI is that drugs affect the intracellular biochemistry of liver cells, elicited by either the parent drug, its metabolites, or the metabolic shift the drug conveys upon uptake (Han et al. 2013; Kaplow-itz 2005). Although often idiosyncratic, there is a need to understand the key events that are critical mechanistic determinants of human DILI. Perturbations of immune-mediated signaling seem an important event in DILI (Steu-erwald et al. 2013). In particular, TNFα-mediated signaling seems an important contributor to sensitize liver cells to drug-induced hepatocyte toxicity both in vitro (Cosgrove et al. 2009) and in vivo (Shaw et al. 2007). TNFα mediates intracellular signaling through activation of NF-κB tran-scription factor (Mercurio et al. 1997). NF-κB transiently translocates to the nucleus to activate downstream (cyto-protective) target genes including chemokines, inhibitor of apoptosis protein family members (IAPs) and anti-apop-totic Bcl2 family members (Liu et al. 1996). We demon-strated that for diclofenac (DCF), the synergy with TNFα to kill hepatocytes is directly related to inhibition of NF-κB nuclear translocation and activation and that inhibition of NF-κB signaling sensitizes toward cytotoxicity caused by DCF (Fredriksson et al. 2011).
Bioactivation of drugs contributes to the formation of reactive metabolites which is shown to be a risk fac-tor in DILI (Leung et al. 2012). These reactive metabo-lites typically provoke a cellular oxidative stress environ-ment, thereby initiating the stabilization and activation of the transcription factor Nrf2 (Li et al. 2005). Subsequent downstream target gene activation by Nrf2 contributes to adaptation and protection of cells against oxidative stress. Likewise, Nrf2 deletion in the liver severely increases the sensitivity toward drug-induced liver failure (Liu et al. 2010, 2013). In some studies, it has been shown that Nrf2 activation can act to suppress NF-κB-based immune signal-ing responses (Chen et al. 2006), which is interesting as this
would suggest that Nrf2 could be involved in NF-κB sup-pression in certain situations including DILI. So far, there is no systematic evaluation on the relationship between Nrf2 and NF-κB activation in DILI.
Here, we investigated whether drugs with known risk of DILI invoke specific cellular stress and defense pathways (NF-κB and Nrf2) and if these can aid in predicting the degree of drug toxicity and whether associations between these pathways exist. We investigated the transcriptional response to 90 DILI-associated drugs as well as several cytokines/growth factors in primary human hepatocytes (PHH) at multiple concentrations and time points, based on publicly available data (Uehara et al. 2010). To translate these findings to high-throughput approaches, we established novel GFP-based reporter cell lines amenable for high-content high-throughput live-cell imaging to quantitatively assess Nrf2 and NF-κB activation on a cell-to-cell basis. Our combined data indicate that the degree of oxidative stress in liver cells negatively correlates with NF-κB activ-ity and that the inability to adequately respond to inflamma-tory responses upon drug exposure predisposes liver cells toward cell death. We propose that our integration of live-cell high-content imaging models to determine Nrf2 and NF-κB activation as well as cytotoxicity is likely to contribute to improving the discrimination of novel drug entities that are intrinsically at risk of DILI.
Materials and methods
Reagents
All drugs were acquired from Sigma-Aldrich and freshly dissolved in DMSO, except for menadione (MEN) and naproxen (NPX) (in PBS). Human TNFα was purchased from R&D systems and stored as 10 μg/mL in 0.1 % BSA in PBS aliquots.
Cell culture
Human hepatoma HepG2 cells were acquired from ATCC (clone HB8065) and maintained and exposed to drugs in DMEM high glucose supplemented with 10 % (v/v) FBS, 25 U/mL penicillin and 25 μg/mL streptomycin. The cells were used between passage 5 and 20. For live-cell imag-ing, the cells were seeded in Greiner black μ-clear 96-well plates, at 20,000 cells per well.
Gene expression analysis
CEL files were downloaded from the Open TG-GATEs database for all DILI-related compounds (see Sup-plementary Table 1): “Toxicogenomics Project and
1165Arch Toxicol (2016) 90:1163–1179
1 3
Toxicogenomics Informatics Project under CC Attribution-Share Alike 2.1 Japan” http://dbarchive.biosciencedbc.jp/en/open-tggates/desc.html. Probe annotation was per-formed using the hthgu133pluspmhsentrezg.db package version 17.1.0, and probe mapping was performed with hthgu133pluspmhsentrezgcdf downloaded from NuGO (http://nmg-r.bioinformatics.nl/NuGO_R.html). Probe-wise background correction (robust multi-array average expression measure), between-array normalization within each treatment group (quantile normalization) and probe set summaries (median polish algorithm) were calculated with the rma function of the Affy package (Affy package, version 1.38.1) (Irizarry et al. 2003). The normalized data were statistically analyzed for differential gene expression using a linear model with coefficients for each experimen-tal group within a treatment group (Wolfinger et al. 2001).
A contrast analysis was applied to compare each expo-sure with the corresponding vehicle control. For hypoth-esis testing, the empirical Bayes statistics for differential expression was used followed by an implementation of the multiple testing correction of Benjamini and Hochberg (1990) using the LIMMA package (Smyth et al. 2005).
Cluster analysis of oxidative stress and inflammation‑regulated gene sets
A gene set for oxidative stress and a gene set for inflam-matory signaling were generated using several databases (see Supplementary Fig 1). From Ingenuity Pathway Analy-sis (version 18841524), the genes present in the following pathways were extracted: NRF2-mediated oxidative stress response, death receptor signaling, NF-κB signaling, TNFR1 signaling, TNFR2 signaling and Toll-like receptor signaling. From the Gene Ontology Project (Ashburner et al. 2000), genes associated with the following terms were obtained using AmiGO 2 version 2.2.0 (Carbon et al. 2009): response to oxidative stress (GO:0006979) for oxidative stress and regulation of inflammatory response (GO:0050727) for inflammatory signaling. Both queries were performed with filters evidence-type closure set to “experimental evidence” and taxon closure label set to “Homo sapiens.”
From the Molecular Signatures Database (MSigDB) (Liberzon et al. 2011), for oxidative stress the following gene sets from BioCarta were used: BIOCARTA NRF2 PATHWAY and for inflammatory signaling BIOCARTA NFKB PATHWAY, BIOCARTA DEATH PATHWAY, BIO-CARTA TNFR1 PATHWAY, BIOCARTA TNFR2 PATH-WAY and BIOCARTA TOLL PATHWAY.
From Kyoto Encyclopedia of Genes and Genomes (KEGG Release 71.0, July 1, 2014): (Kanehisa et al. 2014) the path-ways NF-κ B signaling pathway, TNF signaling pathway and Toll-like receptor signaling pathway were used for inflamma-tory signaling. No entry for Nrf2 or oxidative stress was found.
From Reactome (version 48) (Croft et al. 2014) the path-ways innate immune system and detoxification of reactive oxy-gen species (ROS) were used for inflammatory signaling and oxidative stress signaling, respectively. From “TRANSFAC® (www.biobase-international.com/transcription-factor-binding-sites) from BIOBASE Corporation” (Qian et al. 2006), the genes bound by factor NFE2L2 and RELA were used for oxi-dative stress and inflammatory signaling, respectively.
From all databases, a total of 490 and 175 unique genes were obtained for inflammatory and oxidative stress signaling, respectively. As a next step to determine whether the selected genes are actively transcribed in PHH of the TG-GATEs data-set, another selection step was performed using the oxidative stress model compounds: di-ethyl maleate (DEM) and butyl-ated hydroxyanisole (BHA), and inflammatory model treat-ments: TNFα, LPS and interleukin-1β; both for the high-dose 8- and 24-h data. The oxidative stress gene set was filtered based on a multiple-testing-corrected p value of 0.05, minimum average expression of 5 (log2) and a minimum absolute log2-fold change of 1.5 within the oxidative stress model compound subset resulting in 55 genes. The inflammatory signaling gene set was filtered based on a multiple-testing-corrected p value of 0.05, minimum average expression of 5 (log2) and a minimum absolute log2-fold change of 2 within the inflammatory signal-ing model treatment subset resulting in 82 genes. The log2-fold change values for all DILI treatments and controls were gath-ered followed by Manhattan distance measure and ward clus-tering using the NMF package (version 0.20.5) (Gaujoux and Seoighe 2010). Different log2-fold change threshold values were used to obtain more similar gene set sizes.
The DILI score annotation was adapted from the manual literature survey performed by Astrazeneca (Garside et al. 2014). The DILI concern and SeverityScore were largely based on a text mining study of FDA labels (Chen et al. 2011).
Ingenuity Pathway Analysis
Differentially expressed genes for all DILI compounds in the TG-GATEs dataset were selected based on a minimal log2-fold change of 1.3 (fold change of 2.5 × with respect to matched control), a maximum multiple-testing-corrected p value of 0.05 and a minimum average log2 expression of 7 within the treatment groups (Supplementary Fig 1). Clas-sification of the selected genes according to their biologi-cal and toxicological functions was generated through the use of QIAGEN’s Ingenuity Pathway Analysis (IPA®, QIA-GEN Redwood City, www.qiagen.com/ingenuity), which finds associated canonical pathways based on the selected gene sets. p values are calculated using right-tailed Fisher exact test and represented as −log10 (p values). The p val-ues were extracted for the “Nrf2-mediated oxidative stress response” pathway representing oxidative stress, and as
1166 Arch Toxicol (2016) 90:1163–1179
1 3
B
DILI Concernless−DILI−concernmost−DILI−concernoxidative stressinflammation
Severity Classfatal hepatotoxicityhyperbilirubinemiaoxidative stressliver aminotr. increasejaundicecholestasisacute liver failureinflammationliver necrosis
Gene Typeinflammatoryoxidativeboth
ANRF2−mediated Oxidative Stress Response
Inflammatory Signaling0
2
4
6
0
2
4
6
colc
hici
neaz
athi
oprin
esu
linda
cfu
rose
mid
edi
ethy
l mal
eate
prop
ylth
iour
acil
omep
razo
leva
lpro
ic a
cid
buty
late
d hy
drox
yani
sole
cycl
opho
spha
mid
ero
sigl
itazo
ne m
alea
tedi
clof
enac
dana
zol
phen
obar
bita
let
hion
amid
ene
fazo
done
indo
met
haci
nni
fedi
pine
fluox
etin
e hy
droc
hlor
ide
acet
amin
ophe
nin
terle
ukin
1 b
eta,
hum
anni
trofu
rant
oin
rifam
pici
nad
apin
tacr
ine
tam
oxife
nra
nitid
ine
imip
ram
ine
acar
bose
fluta
mid
edi
ltiaz
emke
toco
nazo
lem
ethy
ldop
aca
rbam
azep
ine
prom
etha
zine
glib
encl
amid
epa
pave
rine
chlo
rpro
pam
ide
disu
lfira
mflu
phen
azin
elo
mus
tine
diso
pyra
mid
een
alap
rilci
met
idin
ena
prox
enm
efen
amic
aci
dis
onia
zid
trim
etha
dion
ecl
ozap
ine
etha
mbu
tol
met
him
azol
eve
nlaf
axin
eto
lbut
amid
esi
mva
stat
ingr
iseo
fulv
inph
enyt
oin
prop
rano
lol
mel
oxic
amca
ptop
rilTN
Ftio
pron
inet
opos
ide
mex
iletin
edi
azep
amcy
clos
porin
e A
ticlo
pidi
neam
phot
eric
in B
amitr
ipty
line
thio
ridaz
ine
fam
otid
ine
feno
fibra
teal
lopu
rinol
labe
talo
lLP
Sbu
spiro
nech
lorp
rom
azin
eib
upro
fen
quin
idin
e
-log 1
0pVa
l
DILI Concerninflammationless−DILI−concernmost−DILI−concernoxidative stress
10
60
Number of Genes (arrows)
MAFFSRXN1TXNRD1GCLMSQSTM1G6PDFOSMMP1HMOX1
CDK1CXCL1CCL2LMNB1BCL2A1HERPUD1CXCL11LTBCXCL10CXCL2TNFSF10IL8STAT4TLR3BIRC3IER3LIFTPM1TRAF1
TNF
inte
rleuk
in 1
bet
a, h
uman
LPS
venl
afax
ine
diso
pyra
mid
era
nitid
ine
cycl
ospo
rine
Aam
phot
eric
in B
busp
irone
cloz
apin
eflu
oxet
ine
hydr
ochl
orid
epr
opra
nolo
let
opos
ide
nife
dipi
neta
crin
epr
omet
hazi
neet
ham
buto
ldi
ltiaz
emqu
inid
ine
papa
verin
ene
fazo
done
phen
obar
bita
lco
lchi
cine
sulin
dac
diet
hyl m
alea
tefu
rose
mid
epr
opyl
thio
urac
ilac
etam
inop
hen
diaz
epam
omep
razo
leda
nazo
lbu
tyla
ted
hydr
oxya
niso
lero
sigl
itazo
ne m
alea
tedi
clof
enac
nitro
fura
ntoi
naz
athi
oprin
eflu
tam
ide
keto
cona
zole
valp
roic
aci
dm
ethi
maz
ole
sim
vast
atin
dexa
met
haso
neet
hion
amid
eto
lbut
amid
elo
mus
tine
carb
amaz
epin
ecy
clop
hosp
ham
ide
allo
purin
olgr
iseo
fulv
inad
apin
ison
iazi
dla
beta
lol
mex
iletin
ein
dom
etha
cin
rifam
pici
nflu
phen
azin
eha
lope
ridol
chlo
rpro
maz
ine
thio
ridaz
ine
capt
opril
peni
cilla
min
een
alap
rilna
prox
enib
upro
fen
chlo
rpro
pam
ide
mef
enam
ic a
cid
acar
bose
disu
lfira
mm
ethy
ltest
oste
rone
amitr
ipty
line
clom
ipra
min
eim
ipra
min
efa
mot
idin
eda
ntro
lene
met
hyld
opa
gem
fibro
zil
sulfa
sala
zine
terb
inaf
ine
tam
oxife
ntic
lopi
dine
nico
tinic
aci
dtri
met
hadi
one
cim
etid
ine
cipr
oflo
xaci
ntio
pron
inte
tracy
clin
ecl
ofib
rate
feno
fibra
teph
enyt
oin
acet
azol
amid
etri
azol
amer
ythr
omyc
in e
thyl
succ
inat
eam
ioda
rone
glib
encl
amid
em
elox
icam
ECT2_OIKBKAP_IS100A6_OCOCH_OIL18_IGAS2_IOXTR_ITRAF1_ITPM1_OLIF_IIER3_IBIRC3_ITLR3_ISTAT4_IIL8_ITNFSF10_ICXCL2_ICXCL10_ILTB_ICXCL11_IHERPUD1_OBCL2A1_ILMNB1_ICCL2_ICXCL1_ICDK1_ITXN2_OPRDX3_OPNPT1_OADSL_OAOX1_OTNFRSF21_IHYAL1_OCYCS_BPNKP_OFKBP5_ORHOB_ODUSP6_ICX3CL1_IMAP3K5_BSLC25A24_OABCG2_OLIPG_ITNFRSF1B_IABCC2_OFABP1_OCREB3L3_ICXCL5_ICXCL3_IIL6_BZC3H12A_ILCN2_IIFNGR2_ITAP1_INFKB1_ITNIP1_IIFNAR2_ICCL4_INFKBIA_IIRF1_IPLAU_ICSF2_IVCAM1_ICD40_IIL23A_ISOCS3_IJUNB_IPIGR_ISDC4_ICSF1_ICTSS_ISELE_IPI3_IIL1B_ICCL5_ISPP1_IBLNK_INAMPT_ILBP_ITNFAIP3_ITLR2_IICAM1_IMAP2K6_IIL18R1_ICCL20_ILY96_IELF3_IIL1RN_IMAP3K8_IWNT5A_IMICB_OIL15_IPELI1_INOD2_IIRAK2_IF3_ICBR3_OMMP3_ISELK_OVIMP_BLONP1_OFTH1_OAZI2_INFE2L2_OETV5_ODHRS2_OEPHX1_OCYP2A6_OPPIF_ORELB_INFKB2_ISTIP1_OVCP_OKEAP1_OZNF622_OMAFK_ONQO2_OAPTX_OGLRX2_OGSR_ORELA_BHMOX1_OMMP1_IFOS_BG6PD_OSQSTM1_OGCLM_OTXNRD1_OSRXN1_OMAFF_OCHI3L1_ICD55_ISIRT1_BPLK3_OGCLC_OCDC34_OMAFG_O
A B
A`
EDC
B`
G`
F`
E`
D`
C`
H`
DILI ConcernSeverity Class
GeneType
−4
−2
0
2
4
6
8
log2 FC
1
-1
Fold
cha
nge
1
-1
1167Arch Toxicol (2016) 90:1163–1179
1 3
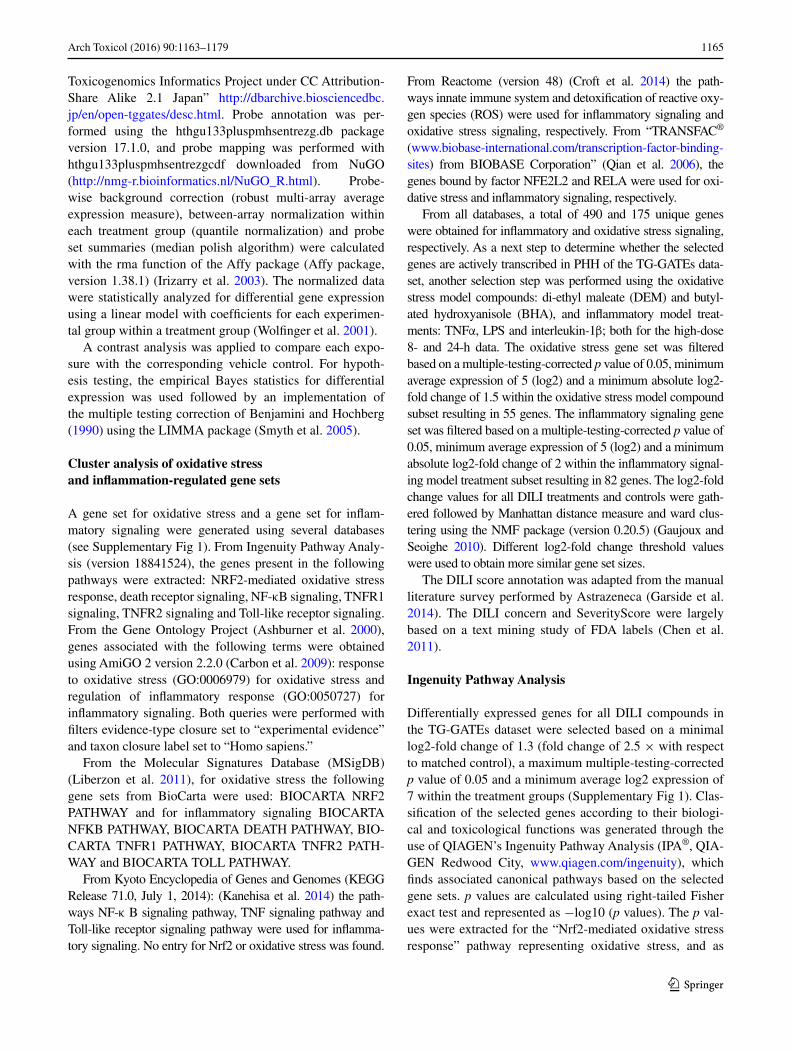
representation for “inflammatory signaling,” the average of the p values of pathways “Toll-like receptor signaling,” “death receptor signaling,” “TNFR1 signaling,” “TNFR2 signaling” and “NF-κB signaling” was calculated. For each treatment, the average magnitude of the log2-fold change values of the genes responsible for the significance of the oxidative stress and inflammatory pathways was calculated and displayed as an arrow vector above the −log10 p value bars of the bar graph. The number of genes responsible for the significance of the individual pathways is color-coded from blue (low number of genes) to pink (high number of genes).
Generation of GFP‑tagged cell lines
HepG2 cells stably expressing human GFP-p65 as described in (Fredriksson et al. 2011). Mouse sulfiredoxin (Srxn1) was tagged with GFP at the C-terminus using BAC recombineering (Hendriks et al. 2012) and stably intro-duced into HepG2 cells by transfection and 500 μg/mL G-418 selection.
RNA interference
siRNAs against human NFE2L2 (Nrf2) and KEAP1 were acquired from Dharmacon (ThermoFisher Scientific) as siGENOME SMARTpool reagents, as well as in the form of four individual siRNAs. HepG2 cells were transiently transfected with the siRNAs (50nM) using INTERFERin
(Polyplus) as described previously (Fredriksson et al. 2011).
Western blotting
Samples were collected by direct cell lysis (including pel-leted apoptotic cells) in 1 × sample buffer supplemented with 5 % v/v β-mercaptoethanol and heat-denatured at 95 °C for 10 min. The separated proteins were blotted onto PVDF membranes before antibody incubation in 1 % BSA in TBS–Tween 20. The following antibodies were used: mouse-anti-GFP (Roche); rabbit-anti-IκBα (Cell Signal-ing); rabbit-anti-Nrf2 (H300, Santa-Cruz); mouse-anti-Cleaved Caspase-8 (Cell Signaling); rabbit-anti-PARP (Cell Signaling); mouse-anti-Tubulin (Sigma); mouse-anti-actin (Santa-Cruz).
Microscopy
Real-time cell death induction was determined by moni-toring the accumulation of Annexin-V-Alexa633-labeled cells over a 24-h time period (Puigvert et al. 2010). For this, transmission and Alexa633 images of the same area with cells were taken automatically every 30 min using a BD Pathway™ 855 bioimager with CCD camera and a 10x objective with an image resolution of 608 × 456 (binning 2).
Accumulation of Srxn1-GFP or nuclear oscillation of GFP-p65 was monitored using a Nikon Eclipse Ti confo-cal microscope (lasers: 488 and 408 nm), equipped with an automated stage, Nikon 20x Dry PlanApo VC NA 0.75 objective and perfect focus system. Images were acquired at 512 × 512 pixels. Prior to imaging at >20× magnifica-tion, HepG2 cells were loaded for 45 min with 100 ng/mL Hoechst33342 to visualize the nuclei, upon which the Hoe-chst-containing medium was washed away to avoid Hoe-chst phototoxicity (Purschke et al. 2010). Srxn1-GFP cells were imaged every 30 min across a 24-h time span, and GFP-p65 cells every 6 min for 6 h.
Image quantification
To quantify the total pixel area occupied by cells or the number of cells per field imaged, transmission images and Hoechst images, respectively, were analyzed using Image-Pro 7.0 (Media Cybernetics). The accumulation of dead cells or the appearance of Srxn1-GFP-positive cells was quantified as the total number of pixels above background. The Annexin-V-positive pixel total was normalized for the total cell area. The number of adjacent fluorescent Srxn1-GFP pixels above background (with a minimum size of 45 pixels, which is about one-fourth of average cell size) was multiplied by the average density of those pixels as a
Fig. 1 Gene expression analysis of 24-h highest concentration primary human hepatocyte subset of the TG-GATEs dataset. a Differentially expressed genes were analyzed with Ingenuity Pathway Analysis as described in detail in the “Materials and methods” section. In the top panel, the −log10 p values for the corresponding pathways are displayed for the Nrf2-mediated oxidative stress response. The top panel dis-plays the mean of the p values for the inflammatory-related pathways. Compounds are ordered according to highest significance of the Nrf2-mediated oxidative stress response. The compound labels in red are the compounds chosen in this study. The color of the bars corresponds to DILI severity type or to the oxidative stress/inflammatory model com-pounds (model compound type). The length of the arrows corresponds to the mean fold change of the genes which are responsible for the sig-nificance of the corresponding pathways. The direction of the arrow corresponds to either mean up- or downregulation of these genes. The color of the arrows corresponds to the number of these genes rang-ing from 10 to 60 genes. b Unsupervised hierarchical clustering of all DILI compounds and a selected gene set as described in detail in the “Materials and methods” section. Blue corresponds to downregulated genes, and orange, to upregulated genes; the brightness corresponds to the magnitude of the fold changes. The top color-coded bar corresponds to the DILI concern or model compound type. The second top color-coded bar corresponds to the severity class or model compound type. The left color-coded bar corresponds to the gene type—either inflamma-tory genes, oxidative genes or both. Important clusters on gene level are represented from A′ to H′, and important compound-level clusters with A–E for easy reference from the text. Compounds used in this study are color-coded in red (color figure online)
◂
1168 Arch Toxicol (2016) 90:1163–1179
1 3
measure for the GFP signal intensity increase and normal-ized for the amount of nuclei.
To quantify the nuclear translocation of GFP-p65, nuclei (Hoechst) masks are segmented and tracked in ImageJ to define the GFP-p65 nuclear intensity, followed by cytoplasm segmentation. The normalized nuclear/cyto-plasmic intensity ratio for each cell is recorded and fur-ther analyzed for different oscillation features, also using ImageJ, including the number of translocations, time period of each individual peak, intensity of the peaks, delay between peaks, and nuclear entry and exit rates (Di et al. 2012).
Statistics
All experiments are performed at least in triplicate. Error bars indicate standard error. Statistical comparisons were made using a one-way ANOVA. The following p values were considered significant: p < 0.05 (*); p < 0.01 (**); p < 0.001 (***).
Results
Enhanced Nrf2 activation is associated with suppression of endogenous NF‑κB activity in PHH
The Japanese Toxicogenomics Project has generated the Open TG-GATEs data repository of gene expression pro-files in PHH upon exposure to 157 compounds, of which
HMOX1
SRXN1
GCLM
CXCL1
CCL2
BCL2A1
−4−2024
−4−2024
−4−2024
−4−2024
−4−2024
−4−2024
colc
hici
neaz
athi
oprin
esu
linda
cfu
rose
mid
edi
ethy
l mal
eate
prop
ylth
iour
acil
omep
razo
leva
lpro
ic a
cid
buty
late
d hy
drox
yani
sole
cycl
opho
spha
mid
ero
sigl
itazo
ne m
alea
tedi
clof
enac
dana
zol
phen
obar
bita
let
hion
amid
ene
fazo
done
indo
met
haci
nni
fedi
pine
fluox
etin
e hy
droc
hlor
ide
acet
amin
ophe
nin
terle
ukin
1 b
eta,
hum
anni
trofu
rant
oin
rifam
pici
nad
apin
tacr
ine
tam
oxife
nra
nitid
ine
imip
ram
ine
acar
bose
fluta
mid
edi
ltiaz
emke
toco
nazo
lem
ethy
ldop
aca
rbam
azep
ine
prom
etha
zine
glib
encl
amid
epa
pave
rine
chlo
rpro
pam
ide
disu
lfira
mflu
phen
azin
elo
mus
tine
diso
pyra
mid
een
alap
rilci
met
idin
ena
prox
enm
efen
amic
aci
dis
onia
zid
trim
etha
dion
ecl
ozap
ine
etha
mbu
tol
met
him
azol
eve
nlaf
axin
eto
lbut
amid
esi
mva
stat
ingr
iseo
fulv
inph
enyt
oin
prop
rano
lol
mel
oxic
amca
ptop
rilTN
Ftio
pron
inet
opos
ide
mex
iletin
edi
azep
amcy
clos
porin
e A
ticlo
pidi
neam
phot
eric
in B
amitr
ipty
line
thio
ridaz
ine
fam
otid
ine
feno
fibra
teal
lopu
rinol
labe
talo
lLP
Sbu
spiro
nech
lorp
rom
azin
eib
upro
fen
quin
idin
e
log 2F
C
DILI Concern: inflammation less−DILI−concern most−DILI−concern oxidative stress
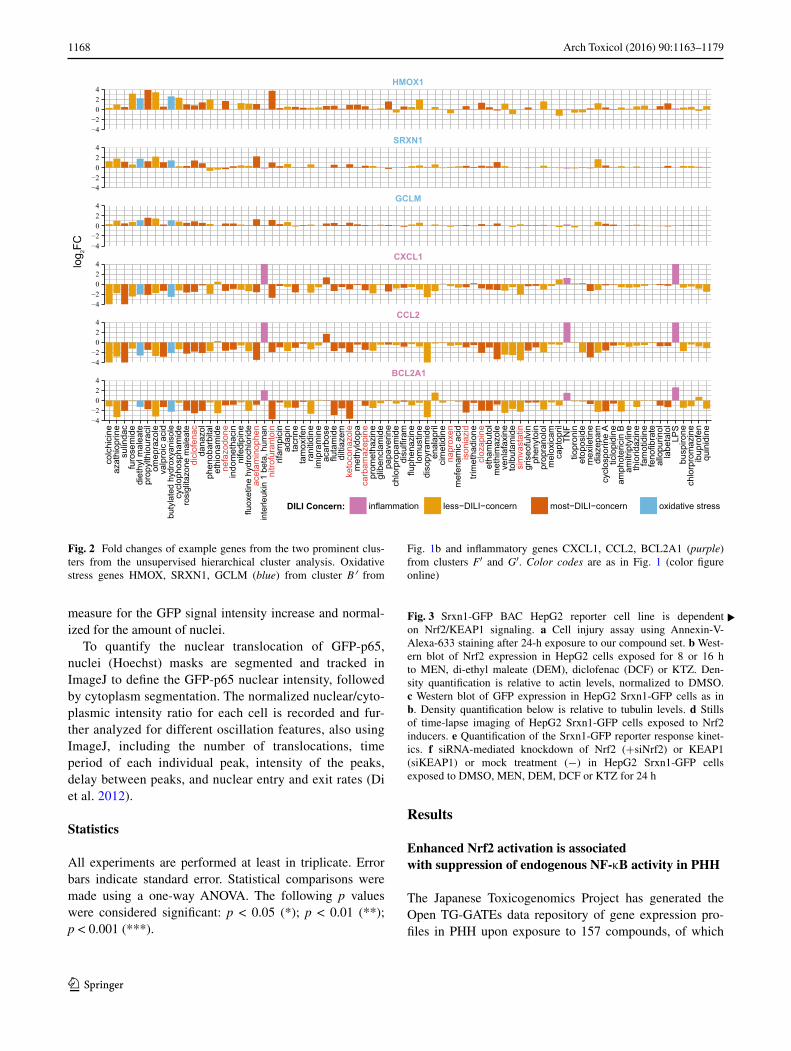
Fig. 2 Fold changes of example genes from the two prominent clus-ters from the unsupervised hierarchical cluster analysis. Oxidative stress genes HMOX, SRXN1, GCLM (blue) from cluster B′ from
Fig. 1b and inflammatory genes CXCL1, CCL2, BCL2A1 (purple) from clusters F′ and G′. Color codes are as in Fig. 1 (color figure online)
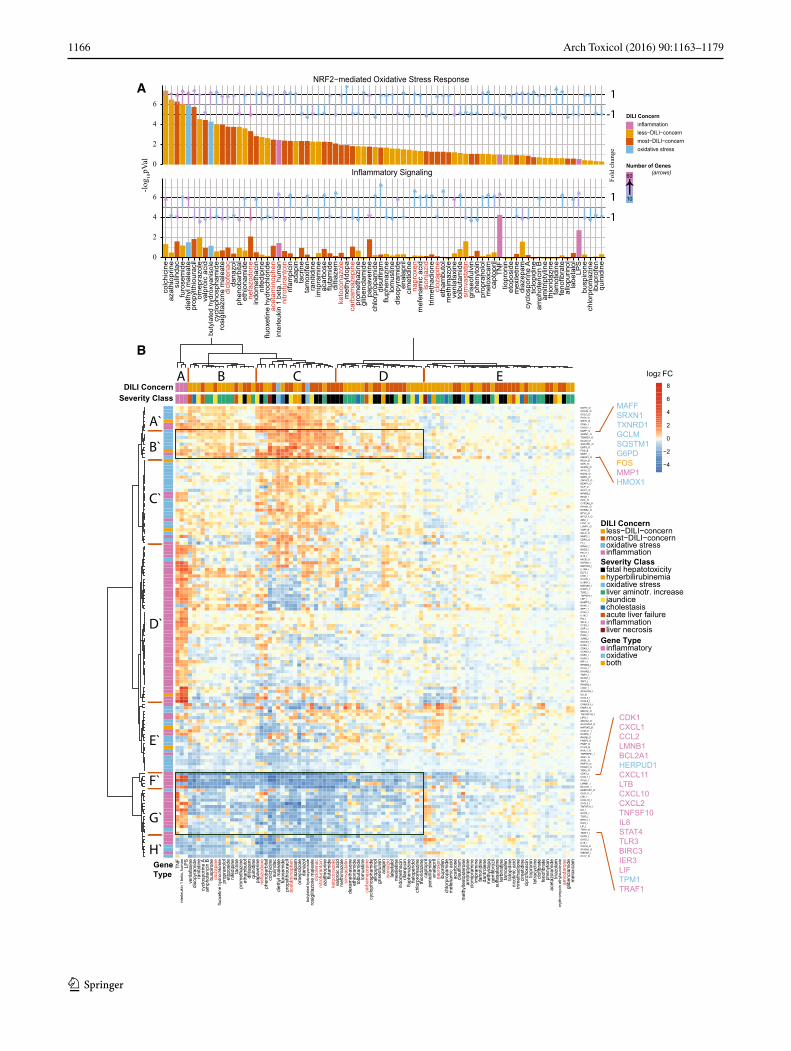
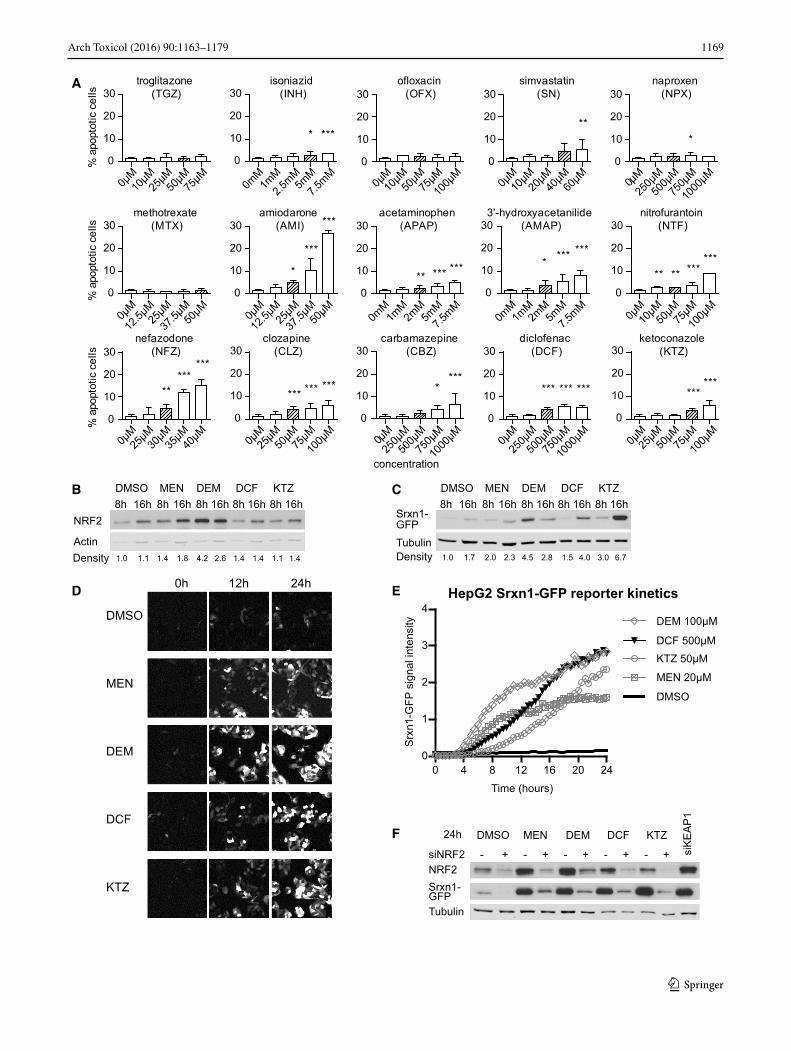
Fig. 3 Srxn1-GFP BAC HepG2 reporter cell line is dependent on Nrf2/KEAP1 signaling. a Cell injury assay using Annexin-V-Alexa-633 staining after 24-h exposure to our compound set. b West-ern blot of Nrf2 expression in HepG2 cells exposed for 8 or 16 h to MEN, di-ethyl maleate (DEM), diclofenac (DCF) or KTZ. Den-sity quantification is relative to actin levels, normalized to DMSO. c Western blot of GFP expression in HepG2 Srxn1-GFP cells as in b. Density quantification below is relative to tubulin levels. d Stills of time-lapse imaging of HepG2 Srxn1-GFP cells exposed to Nrf2 inducers. e Quantification of the Srxn1-GFP reporter response kinet-ics. f siRNA-mediated knockdown of Nrf2 (+siNrf2) or KEAP1 (siKEAP1) or mock treatment (−) in HepG2 Srxn1-GFP cells exposed to DMSO, MEN, DEM, DCF or KTZ for 24 h
▸
1169Arch Toxicol (2016) 90:1163–1179
1 3
DMSO
MEN
DEM
DCF
0h 12h 24h
DCF
NRF2Srxn1-GFP
DMSO MEN DEM KTZ
siK
EA
P1
siNRF2 - + - + - + - + - +
KTZ
A
CB
D
24h
E
DMSO MEN DEM DCF KTZ
Actin
NRF28h 16h 8h 16h 8h 16h 8h 16h 8h 16h
1.0 1.1 1.4 1.8 4.2 2.6 1.4 1.4 1.1 1.4
Tubulin
DMSO MEN DEM DCF KTZ
Srxn1-GFPTubulin
8h 16h 8h 16h 8h 16h 8h 16h 8h 16h
1.0 1.7 2.0 2.3 4.5 2.8 1.5 4.0 3.0 6.7
F
% a
popt
otic
cel
ls
amiodarone (AMI)
0μM
12.5μ
M25
μM
37.5μ
M50
μM0
10
20
30 ***
***
*
% a
popt
otic
cel
ls%
apo
ptot
ic c
ells
carbamazepine (CBZ)
0μM25
0μM50
0μM75
0μM
1000
μM
****
0
10
20
30
isoniazid (INH)
0mM
1mM2.5
mM5m
M7.5
mM
* ***
0
10
20
30
nefazodone (NFZ)
0μM25
μM30
μM35
μM40
μM
******
**
0
10
20
30
ofloxacin (OFX)
0μM10
μM50
μM75
μM10
0μM
0
10
20
30
3'-hydroxyacetanilide (AMAP)
0mM
1mM2m
M5m
M7.5
mM
*******
0
10
20
30
clozapine (CLZ)
0μM25
μM50
μM75
μM10
0μM
*********
0
10
20
30ketoconazole
(KTZ)
0μM25
μM50
μM75
μM10
0μM
******
0
10
20
30
naproxen (NPX)
0μM25
0μM50
0μM75
0μM
1000
μM
*
0
10
20
30simvastatin
(SN)
0μM10
μM20
μM40
μM60
μM
**
0
10
20
30
acetaminophen (APAP)
0mM
1mM
2mM
5mM7.5
mM
********0
10
20
30
diclofenac (DCF)
0μM25
0μM50
0μM75
0μM
1000
μM
*** *** ***
0
10
20
30
methotrexate (MTX)
0μM
12.5μ
M25
μM
37.5μ
M50
μM0
10
20
30nitrofurantoin
(NTF)
0μM10
μM50
μM75
μM10
0μM
** ** ******
0
10
20
30
troglitazone (TGZ)
0μM10
μM25
μM50
μM75
μM0
10
20
30
concentration
HepG2 Srxn1-GFP reporter kinetics
0 4 8 12 16 20 240
1
2
3
4
DMSO
MEN 20μM
DCF 500μM
DEM 100μM
KTZ 50μM
Time (hours)
Srx
n1-G
FP s
igna
l int
ensi
ty
Density Density
1170 Arch Toxicol (2016) 90:1163–1179
1 3
many are DILI-related, at 1–3 different concentrations and 1–3 time points (2, 8 and 24 h), including a few pro-inflammatory cytokines, TNFα, IL1β and LPS (Uehara et al. 2010). We focused on the NF-κB and Nrf2 signaling-related gene sets extracted from several key databases as described in detail in the “Materials and methods” section. Ingenuity Pathway Analysis (IPA) for oxidative stress and inflammatory signaling was performed for all DILI com-pounds in the dataset. Typically, a significant modulation of these pathways was observed. A major modulation of the “Nrf2-mediated oxidative stress response” overall related to upregulation of genes linked to this pathway. Interest-ingly, DILI compounds that showed a strong oxidative stress response also showed a modulation of “inflamma-tory signaling” related to NF-κB activity (26 compounds, p < 0.05) although this was typically associated with down-regulation of genes (Fig. 1a). This effect was strongest after 24-h treatment, although a similar association was already observed at 8-h treatment (Supplementary Fig. 2A).
The above observation indicated an opposite direction of Nrf2-mediated signaling versus NF-κB-related inflamma-tory signaling by DILI compounds in PHH. Indeed, Nrf2 can negatively affect NF-κB activity (Liu et al. 2008; Yu et al. 2011). Therefore, we next performed a more detailed hierarchical clustering analysis of the altered gene expres-sion induced by all DILI compounds associated with both signaling pathways. As a first step, based on different annotation databases, we systematically selected a set of Nrf2 signaling-related genes as well as a set of inflamma-tory signaling-related genes. To determine which genes are responsive to oxidative stress and inflammatory stimuli in PHH, we included a stringent filtering procedure based on the exposures of PHH in the TG-GATEs data to DEM and BHA for Nrf2 signaling, and TNFα, IL-1β and LPS for inflammatory signaling. We then extracted the differential expression levels for all DILI compounds for the selected 55 and 82 genes related to Nrf2 signaling and inflamma-tory signaling, respectively. Using an unsupervised hier-archical clustering for all genes and DILI compounds at 24 h, we could clearly distinguish Nrf2 clusters (A′, B′, C′ and E′) and NF-κB gene clusters (D′, F′ and G′) (Fig. 1b). Moreover, cytokines and LPS (cluster A) clearly induced a different response compared to all DILI compounds (clus-ters B–E). DILI compound cluster C gave the strongest overall response at the level of both Nrf2 target gene acti-vation and inflammation signaling target gene downregula-tion; this cluster was slightly enriched in compounds that demonstrate “fatal hepatotoxicity”. These effects were not as prominent at 8-h treatment conditions (Supplementary Fig. 2B).
Within the hierarchical cluster analysis, two strong gene clusters were prominent in their response to DILI compounds: a first cluster (cluster B′) with Nrf2 target
genes that were mostly upregulated by DILI compounds but hardly affected by cytokines, including Maff, Srxn1, Txnrd1, GCLM, SQSTM1, G6PD, FOS, MMP1 and HMOX1, mostly prototypical Nrf2 target genes (see Fig. 2 for examples), and a second cluster (clusters F′ and G′) with inflammatory genes that were strongly upregulated by the cytokines and LPS, but were strongly downregulated by the same DILI compounds that caused upregulation of Nrf2 targets, which included CXCL1, CCL2, BCL2A1, CXCL11, CXCL2 (see Fig. 2 for examples). To deter-mine the correlation with the DILI severity, we performed a similar cluster analysis for only severe DILI compounds and non-severe DILI compounds based on the FDA drug labeling classification (Chen et al. 2011) (Supplementary Figs. 3 and 4). Severe DILI compounds mostly mimicked the overall DILI hierarchical cluster analysis showing the strongest inverse relationship between Nrf2 activity and NF-κB suppression and included DCF, sulindac, ketocona-zole (KTZ) and acetaminophen (APAP).
Altogether, these findings indicate a strong correlation between the ability of DILI compounds to induce an adap-tive Nrf2 response and the suppression of NF-κB activity.
A BAC‑Srxn1‑GFP HepG2 cell line reports xenobiotic‑mediated Nrf2 activation
The most prominent differences between NF-κB and Nrf2 responses in the PHH dataset were observed at high concentrations and at 24 h of drug exposure. Like all signaling events, the transcriptional activities of Nrf2 and NF-κB are dynamic in nature and may show differ-ential activity over time. Therefore, we sought to moni-tor the activity of these two transcription factors in liv-ing cells using GFP-tagging technology allowing their dynamic analysis. As PHH dedifferentiate within 24 h in vitro when grown in 2D cultures (Boess et al. 2003) and are not amenable for stable expression of GFP reporter constructs, we chose the liver model cell line HepG2 to generate stable fluorescent reporters for both NF-κB and Nrf2 signaling. As a first step, to enable reli-able quantitative measurements of the dynamic effect of drug exposure on Nrf2 activity using live-cell imag-ing, we generated a HepG2 reporter cell line based on bacterial artificial chromosome (BAC) recombineering (Poser et al. 2008) of the Nrf2 target gene sulfiredoxin (Srxn1) (Hendriks et al. 2012), which was part of the predictive DILI cluster. We tagged the Srxn1 gene with GFP at its C-terminus and established a stably express-ing HepG2 Srxn1-GFP cell line under control of its own entire promoter region. To monitor for its functionality as an Nrf2 reporter, we exposed the HepG2 cells to MEN (20 μM) and DEM (100 μM) as proto-typical model acti-vators of Nrf2, as well as DCF and KTZ, of which the
1171Arch Toxicol (2016) 90:1163–1179
1 3
DM
SO
AM
IA
MA
P
APA
P
CB
Z
CLZ
HNI
FC
D KTZ
MTX
XP
NZF
NNTF
OFX
SN
TGZ
Nrf2Srxn1-GFPTubulin
- + - + - + - + - +- +
Nrf2Srxn1-GFPTubulin
Nrf2Srxn1-GFPTubulin
- + - + - + - + - +- +
- + - + - + - + - +- +
TNFαDMSO AMI CBZ CLZ DCF KTZ
DMSO APAP AMAP NFZ NTF MTX
DMSO NPX INH OFX SN TGZ
BA
C
TNFα
TNFα
D
Time (hours)
Nor
mal
ized
Srx
n1-G
FP s
igna
l int
ensi
ty
4h 14h 24h 4h 14h 24h
- +DMSO
- +DMSO
- +DMSO
AMAP
0 8 16 240
5
10
15
TGZ
0 8 16 240
5
10
15 INH
0 8 16 240
5
10
15 OFX
0 8 16 240
5
10
15
SN
0 8 16 240
5
10
15 MTX
0 8 16 240
5
10
15NPX
0 8 16 240
5
10
15
AMI
0 8 16 240
5
10
15 APAP
0 8 16 240
5
10
15
NTF
0 8 16 240
5
10
15 NFZ
0 8 16 240
5
10
15 CLZ
0 8 16 2405
101520
DCF
0 8 16 240
5
10
15 KTZ
0 8 16 240
5
10
15CBZ
0 8 16 240
5
10
15
010µM50µM75µM
010µM50µM75µM
010µM50µM75µM
012.5µM25µM37.5µM
010µM50µM75µM
0100µM500µM750µM
0100µM500µM750µM
010µM50µM75µM
012.5µM25µM37.5µM
010µM30µM60µM
0100µM500µM750µM
010µM50µM75µM
01mM2.5mM7.5mM
01mM2.5mM7.5mM
01mM2.5mM7.5mM
Srxn1-GFP
DM
SO
TGZ
INH
OFX SN
NP
X
MTX AM
I
APA
P
AM
AP
NTF
NFZ
CLZ
CB
Z
DC
F
KTZ
02468
10
no TNFα10ng/ml TNFα
rela
tive
Srx
n1-G
FP p
rote
in le
vels
Nrf2
DM
SO
TGZ
INH
OFX SN
NP
X
MTX AM
I
APA
P
AM
AP
NTF
NFZ
CLZ
CB
Z
DC
F
KTZ
0
1
2
3
no TNFα10ng/ml TNFα
rela
tive
Nrf2
pr
otei
n le
vels
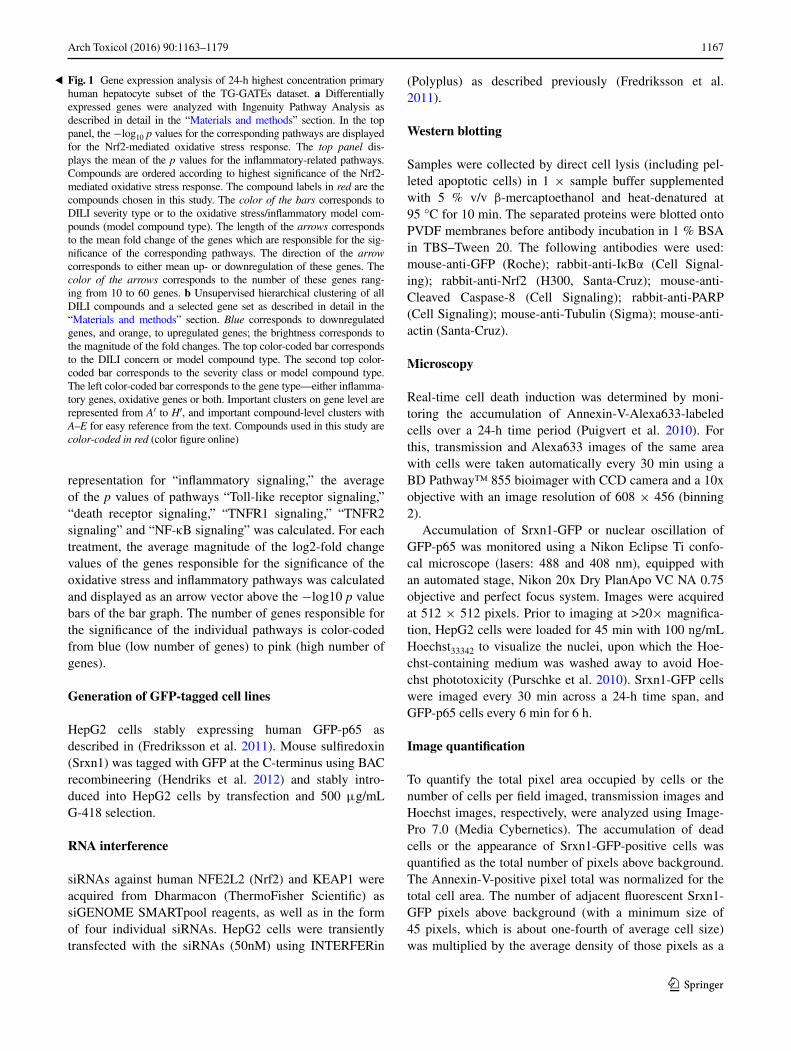
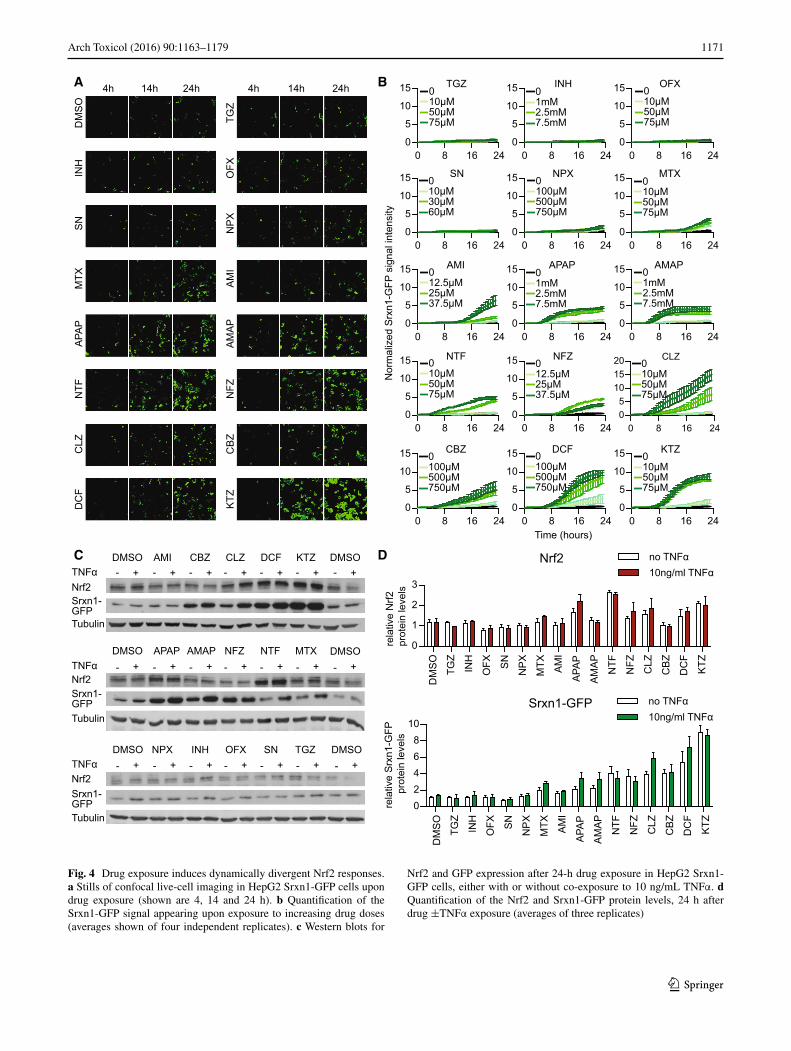
Fig. 4 Drug exposure induces dynamically divergent Nrf2 responses. a Stills of confocal live-cell imaging in HepG2 Srxn1-GFP cells upon drug exposure (shown are 4, 14 and 24 h). b Quantification of the Srxn1-GFP signal appearing upon exposure to increasing drug doses (averages shown of four independent replicates). c Western blots for
Nrf2 and GFP expression after 24-h drug exposure in HepG2 Srxn1-GFP cells, either with or without co-exposure to 10 ng/mL TNFα. d Quantification of the Nrf2 and Srxn1-GFP protein levels, 24 h after drug ±TNFα exposure (averages of three replicates)
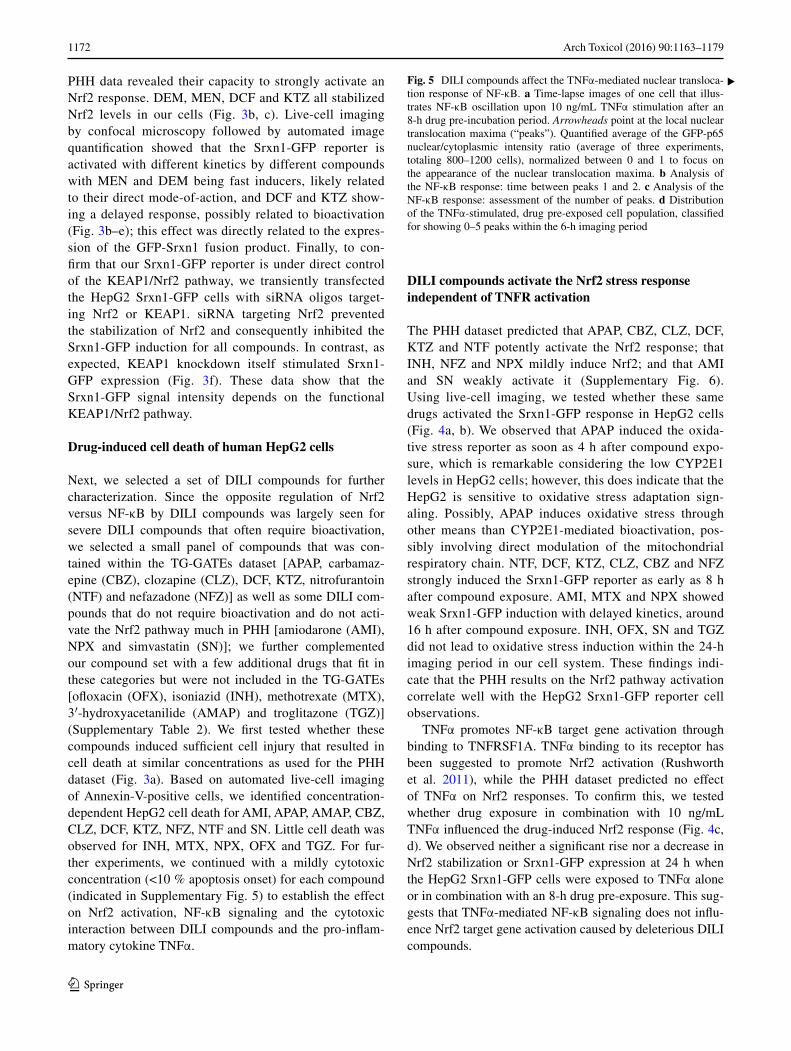
1172 Arch Toxicol (2016) 90:1163–1179
1 3
PHH data revealed their capacity to strongly activate an Nrf2 response. DEM, MEN, DCF and KTZ all stabilized Nrf2 levels in our cells (Fig. 3b, c). Live-cell imaging by confocal microscopy followed by automated image quantification showed that the Srxn1-GFP reporter is activated with different kinetics by different compounds with MEN and DEM being fast inducers, likely related to their direct mode-of-action, and DCF and KTZ show-ing a delayed response, possibly related to bioactivation (Fig. 3b–e); this effect was directly related to the expres-sion of the GFP-Srxn1 fusion product. Finally, to con-firm that our Srxn1-GFP reporter is under direct control of the KEAP1/Nrf2 pathway, we transiently transfected the HepG2 Srxn1-GFP cells with siRNA oligos target-ing Nrf2 or KEAP1. siRNA targeting Nrf2 prevented the stabilization of Nrf2 and consequently inhibited the Srxn1-GFP induction for all compounds. In contrast, as expected, KEAP1 knockdown itself stimulated Srxn1-GFP expression (Fig. 3f). These data show that the Srxn1-GFP signal intensity depends on the functional KEAP1/Nrf2 pathway.
Drug‑induced cell death of human HepG2 cells
Next, we selected a set of DILI compounds for further characterization. Since the opposite regulation of Nrf2 versus NF-κB by DILI compounds was largely seen for severe DILI compounds that often require bioactivation, we selected a small panel of compounds that was con-tained within the TG-GATEs dataset [APAP, carbamaz-epine (CBZ), clozapine (CLZ), DCF, KTZ, nitrofurantoin (NTF) and nefazadone (NFZ)] as well as some DILI com-pounds that do not require bioactivation and do not acti-vate the Nrf2 pathway much in PHH [amiodarone (AMI), NPX and simvastatin (SN)]; we further complemented our compound set with a few additional drugs that fit in these categories but were not included in the TG-GATEs [ofloxacin (OFX), isoniazid (INH), methotrexate (MTX), 3′-hydroxyacetanilide (AMAP) and troglitazone (TGZ)] (Supplementary Table 2). We first tested whether these compounds induced sufficient cell injury that resulted in cell death at similar concentrations as used for the PHH dataset (Fig. 3a). Based on automated live-cell imaging of Annexin-V-positive cells, we identified concentration-dependent HepG2 cell death for AMI, APAP, AMAP, CBZ, CLZ, DCF, KTZ, NFZ, NTF and SN. Little cell death was observed for INH, MTX, NPX, OFX and TGZ. For fur-ther experiments, we continued with a mildly cytotoxic concentration (<10 % apoptosis onset) for each compound (indicated in Supplementary Fig. 5) to establish the effect on Nrf2 activation, NF-κB signaling and the cytotoxic interaction between DILI compounds and the pro-inflam-matory cytokine TNFα.
DILI compounds activate the Nrf2 stress response independent of TNFR activation
The PHH dataset predicted that APAP, CBZ, CLZ, DCF, KTZ and NTF potently activate the Nrf2 response; that INH, NFZ and NPX mildly induce Nrf2; and that AMI and SN weakly activate it (Supplementary Fig. 6). Using live-cell imaging, we tested whether these same drugs activated the Srxn1-GFP response in HepG2 cells (Fig. 4a, b). We observed that APAP induced the oxida-tive stress reporter as soon as 4 h after compound expo-sure, which is remarkable considering the low CYP2E1 levels in HepG2 cells; however, this does indicate that the HepG2 is sensitive to oxidative stress adaptation sign-aling. Possibly, APAP induces oxidative stress through other means than CYP2E1-mediated bioactivation, pos-sibly involving direct modulation of the mitochondrial respiratory chain. NTF, DCF, KTZ, CLZ, CBZ and NFZ strongly induced the Srxn1-GFP reporter as early as 8 h after compound exposure. AMI, MTX and NPX showed weak Srxn1-GFP induction with delayed kinetics, around 16 h after compound exposure. INH, OFX, SN and TGZ did not lead to oxidative stress induction within the 24-h imaging period in our cell system. These findings indi-cate that the PHH results on the Nrf2 pathway activation correlate well with the HepG2 Srxn1-GFP reporter cell observations.
TNFα promotes NF-κB target gene activation through binding to TNFRSF1A. TNFα binding to its receptor has been suggested to promote Nrf2 activation (Rushworth et al. 2011), while the PHH dataset predicted no effect of TNFα on Nrf2 responses. To confirm this, we tested whether drug exposure in combination with 10 ng/mL TNFα influenced the drug-induced Nrf2 response (Fig. 4c, d). We observed neither a significant rise nor a decrease in Nrf2 stabilization or Srxn1-GFP expression at 24 h when the HepG2 Srxn1-GFP cells were exposed to TNFα alone or in combination with an 8-h drug pre-exposure. This sug-gests that TNFα-mediated NF-κB signaling does not influ-ence Nrf2 target gene activation caused by deleterious DILI compounds.
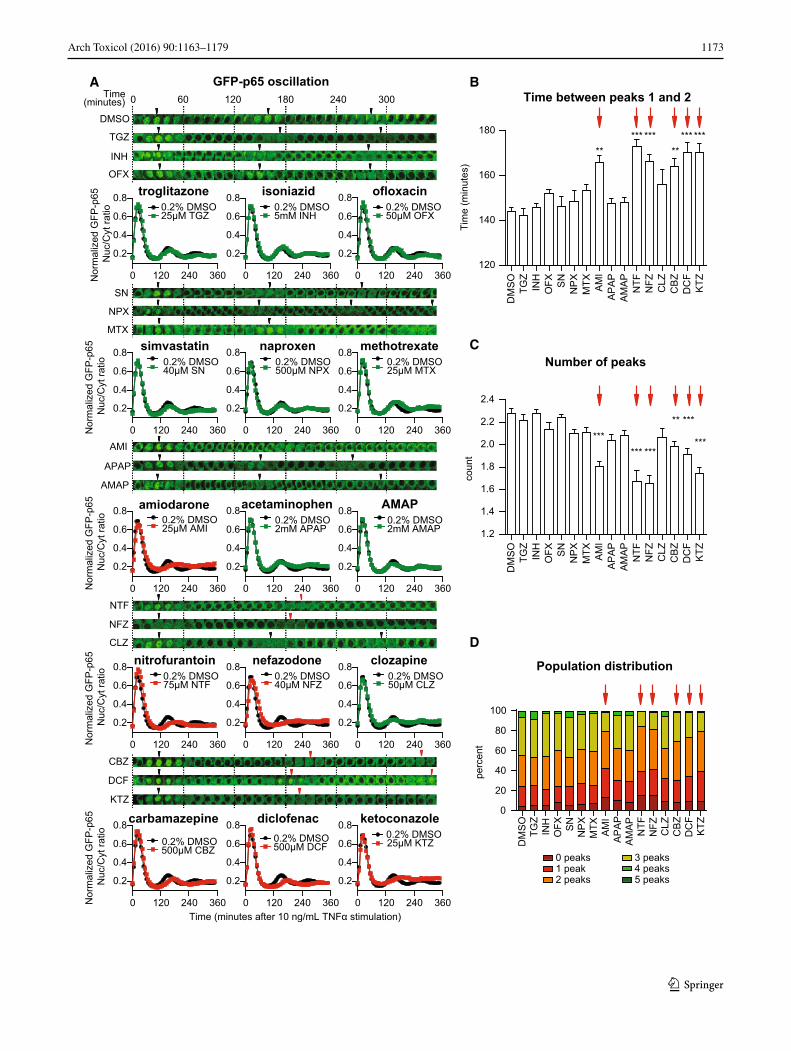
Fig. 5 DILI compounds affect the TNFα-mediated nuclear transloca-tion response of NF-κB. a Time-lapse images of one cell that illus-trates NF-κB oscillation upon 10 ng/mL TNFα stimulation after an 8-h drug pre-incubation period. Arrowheads point at the local nuclear translocation maxima (“peaks”). Quantified average of the GFP-p65 nuclear/cytoplasmic intensity ratio (average of three experiments, totaling 800–1200 cells), normalized between 0 and 1 to focus on the appearance of the nuclear translocation maxima. b Analysis of the NF-κB response: time between peaks 1 and 2. c Analysis of the NF-κB response: assessment of the number of peaks. d Distribution of the TNFα-stimulated, drug pre-exposed cell population, classified for showing 0–5 peaks within the 6-h imaging period
▸
1173Arch Toxicol (2016) 90:1163–1179
1 3
Time between peaks 1 and 2
DMSO
TGZ
INH
OFX SN
NPX
MTX AMI
APAP
AMAP
NTF
NFZ
CLZ
CBZ
DCF
KTZ
120
140
160
180
Tim
e (m
inut
es)
AN
orm
aliz
ed G
FP-p
65 N
uc/C
yt ra
tio0 60 120 180 240 300Time
(minutes)
GFP-p65 oscillation B
C
D
AMI
AMAP
APAP
DMSO
CBZ
CLZ
DCF
INH
KTZ
MTX
NFZ
NTF
OFX
SN
TGZ
Time (minutes after 10 ng/mL TNFα stimulation)
NPX
0 peaks1 peak2 peaks
3 peaks4 peaks5 peaks
*****
***
*********
******* *********
Nor
mal
ized
GFP
-p65
Nuc
/Cyt
ratio
Nor
mal
ized
GFP
-p65
Nuc
/Cyt
ratio
Nor
mal
ized
GFP
-p65
Nuc
/Cyt
ratio
Nor
mal
ized
GFP
-p65
Nuc
/Cyt
rati o
ketoconazole
0 120 240 360
0.2
0.4
0.6
0.80.2% DMSO25µM KTZ
diclofenac
0 120 240 360
0.2
0.4
0.6
0.80.2% DMSO500µM DCF
carbamazepine
0 120 240 360
0.2
0.4
0.6
0.80.2% DMSO500µM CBZ
troglitazone
0 120 240 360
0.2
0.4
0.6
0.80.2% DMSO25µM TGZ
isoniazid
0 120 240 360
0.2
0.4
0.6
0.80.2% DMSO5mM INH
ofloxacin
0 120 240 360
0.2
0.4
0.6
0.80.2% DMSO50µM OFX
simvastatin
0 120 240 360
0.2
0.4
0.6
0.80.2% DMSO40µM SN
naproxen
0 120 240 360
0.2
0.4
0.6
0.80.2% DMSO500µM NPX
methotrexate
0 120 240 360
0.2
0.4
0.6
0.80.2% DMSO25µM MTX
amiodarone
0 120 240 360
0.2
0.4
0.6
0.80.2% DMSO25µM AMI
acetaminophen
0 120 240 360
0.2
0.4
0.6
0.80.2% DMSO2mM APAP
AMAP
0 120 240 360
0.2
0.4
0.6
0.80.2% DMSO2mM AMAP
nitrofurantoin
0 120 240 360
0.2
0.4
0.6
0.80.2% DMSO75µM NTF
nefazodone
0 120 240 360
0.2
0.4
0.6
0.80.2% DMSO40µM NFZ
clozapine
0 120 240 360
0.2
0.4
0.6
0.80.2% DMSO50µM CLZ
Number of peaks
DM
SO
TGZ
INH
OFX SN
NP
XM
TX AM
IA
PA
PA
MA
PN
TFN
FZC
LZC
BZ
DC
FK
TZ
1.2
1.4
1.6
1.8
2.0
2.2
2.4
coun
t
Population distribution
DM
SO
TGZ
INH
OFX SN
NP
XM
TX AM
IA
PA
PA
MA
PN
TFN
FZ CLZ
CB
ZD
CF
KTZ
0
20
40
60
80
100
perc
ent
1174 Arch Toxicol (2016) 90:1163–1179
1 3
Per
cent
age
apop
totic
cel
ls
Time (hours)
8h 24h 8h 24h 8h 24h
AM
I
AM
AP
APA
P
CB
Z
CLZ
DC
F
INH
KTZ
MTX
NFZ
NP
X
NTF
OFX SN
TGZ
A
B
- + - + - + - + - +- +TNFαDMSO AMI CBZ CLZ DCF KTZ
DMSO APAP AMAP NFZ NTF MTX
DMSO NPX INH OFX SN TGZ
Caspase-8
Cleaved Caspase-8
Tubulin
C
D
DMSO + TNFα DMSODrug + TNFα Drug only
DMSO
DMSO
- +DMSO
Cleaved PARP
- + - + - + - + - +- +TNFα
Caspase-8Cleaved Caspase-8
Tubulin
- +
Cleaved PARP
- + - + - + - + - +- +TNFα
Caspase-8Cleaved Caspase-8
Tubulin
- +
Cleaved PARP
Drug + TNFα
******
Annexin-V-Alexa633
Live apoptosis
25µM AMI
9 14 19 240
10
20
30
5mM INH
9 14 19 240
10
20
30
75µM KTZ
9 14 19 240
10
20
30
30µM NFZ
9 14 19 240
10
20
3075µM NTF
9 14 19 240
10
20
30
500µM CBZ
9 14 19 240
10
20
30 500µM DCF
9 14 19 240
10
20
30
25µM MTX
9 14 19 240
10
20
30
2mM APAP
9 14 19 240
10
20
30
50µM OFX
9 14 19 240
10
20
3025µM TGZ
9 14 19 240
10
20
30
40µM SN
9 14 19 240
10
20
30 500µM NPX
9 14 19 240
10
20
30
50µM CLZ
9 14 19 240
10
20
30
2mM AMAP
9 14 19 240
10
20
30
Cleaved Caspase-8
DM
SO
TGZ
INH
OFX SN
NP
XM
TX AM
IA
PAP
AM
AP
NTF
NFZ CLZ
CB
ZD
CF
KTZ
0
5
10
15
20 no TNFα10ng/ml TNFα
Cle
aved
Cas
pase
-8 p
rote
in le
vels
ApoptosisD
MS
OTG
ZIN
HO
FX SN
NP
XM
TX AM
IA
PAP
AM
AP
NTF
NFZ
CLZ
CB
ZD
CF
KTZ
0.0
0.5
1.0
1.5
2.0no TNFα10ng/ml TNFα
AU
C
******
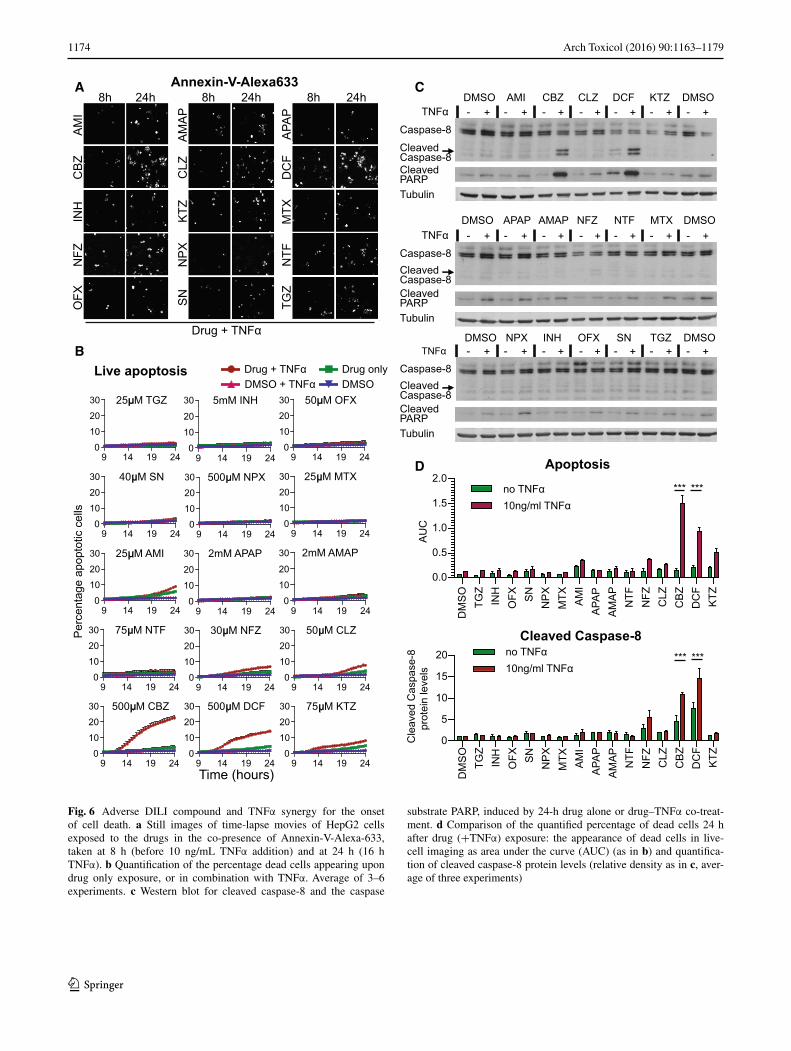
Fig. 6 Adverse DILI compound and TNFα synergy for the onset of cell death. a Still images of time-lapse movies of HepG2 cells exposed to the drugs in the co-presence of Annexin-V-Alexa-633, taken at 8 h (before 10 ng/mL TNFα addition) and at 24 h (16 h TNFα). b Quantification of the percentage dead cells appearing upon drug only exposure, or in combination with TNFα. Average of 3–6 experiments. c Western blot for cleaved caspase-8 and the caspase
substrate PARP, induced by 24-h drug alone or drug–TNFα co-treat-ment. d Comparison of the quantified percentage of dead cells 24 h after drug (+TNFα) exposure: the appearance of dead cells in live-cell imaging as area under the curve (AUC) (as in b) and quantifica-tion of cleaved caspase-8 protein levels (relative density as in c, aver-age of three experiments)
1175Arch Toxicol (2016) 90:1163–1179
1 3
DILI compounds cause a perturbation of NF‑κB signaling
To test whether Nrf2 activation by DILI compounds is associated with modulation of NF-κB signaling, we made use of a previously established HepG2 cell line express-ing GFP-tagged p65/RelA, a subunit of the dimeric tran-scription factor NF-κB (Fredriksson et al. 2011). As reported (Fredriksson et al. 2011), an 8-h DCF pre-expo-sure delays the second translocation event (peaking 26 min later than vehicle pre-incubated cells) (Fig. 5a). Also NTF (+29 min), KTZ (+26 min), AMI (+22 min), NFZ (+22 min) and CBZ (+20 min) delayed the oscillation to a similar extent as DCF. Pre-treatment with CLZ and MTX only weakly perturbed the appearance of the second trans-location response with a delay of 12 and 9 min, respec-tively. Neither AMAP, APAP, INH, OFX, SN nor TGZ significantly influenced the translocation maximum of the second nuclear translocation event.
Our live-cell imaging approach allowed detailed cell population-based quantitative analysis of the translocation response to extract various relevant parameters that describe the NF-κB oscillation pattern invoked by TNFα at the sin-gle cell as well as the cell population level (Di et al. 2012). This analysis revealed that pre-treatment with AMI, CBZ, DCF, KTZ, NFZ or NTF significantly delayed the time between the first and second NF-κB nuclear translocation maxima that normally occur at 30 and 150 min after TNFα exposure, respectively (Fig. 5b). This effect limits the aver-age number of translocation events observed within the 6-h imaging window (Fig. 5c). Importantly, by evaluating on average ~1000 cells per condition, we identified that AMI, CBZ, DCF, KTZ, NFZ and NTF induced a sharp decrease in the percentage of cells that undergo three or more NF-κB nuclear translocation events (Fig. 5d). Together, the results indicate that various DILI compounds affect the TNFα-induced NF-κB activation response by modulating its nuclear translocation dynamics. For the compounds with this delayed translocation event, the NF-κB target genes are downregulated (Fig. 1a) and all compounds except AMI fall within inhibited NF-κB/activated Nrf2 signaling clus-ters (clusters B–C, and CBZ cluster D, Fig. 1b), suggesting that the delayed translocation could be indicative of lower NF-κB target gene expression.
The inhibitory effect of Nrf2 activity on NF‑κB signaling promotes the pro‑apoptotic role of TNFα in drug‑exposed HepG2 cells
TNFα-mediated signaling seems important in DILI (Cos-grove et al. 2009; Steuerwald et al. 2013). While TNFα-receptor-mediated NF-κB signaling may provide sur-vival signaling through the upregulation of anti-apoptosis
genes such as the anti-apoptotic Bcl-2 family member A1 (BCL2A1), activation of the TNFR may in parallel initi-ate activation of caspase-8 and therefore switch on apop-tosis (Hsu et al. 1996). Since DILI compounds did affect the NF-κB signaling and therefore possibly suppressed survival signaling, we next investigated whether DILI compounds would also predispose to the onset of TNFα-mediated apoptosis. To address this issue, we monitored the rate of HepG2 cell apoptosis by live-cell imaging with Annexin-V-Alexa633 after 8-h drug pre-exposure and tested whether TNFα co-exposure enhanced the apoptotic response at 24 h. TNFα enhanced the apoptosis induction upon CBZ and DCF exposure by 18.6 and 9.7 %, respec-tively. A smaller increase of 3–4 % in cell death upon TNFα co-stimulation was found for KTZ, AMI, NFZ and CLZ (Fig. 6a, b). Since TNFα-mediated death signaling acts through caspase-8 activation, we anticipated that the synergy for the onset of apoptosis would also be associated with enhanced caspase-8 cleavage. Caspase-8 was mark-edly increased by TNFα combined with CBZ and DCF, yet for other DILI compounds tested, such a caspase-8 activation was not observed, as was expected based on the limited onset of apoptosis (Fig. 6c, d). The enhanced cas-pase-8 cleavage was associated with cleavage of PARP, a well-established caspase substrate which serves as a pivotal marker of onset of apoptosis. This indicates that primarily under CBZ and DCF pre-treatment conditions, co-treat-ment with TNFα turns on apoptosis.
Discussion
Here, we focused on the interplay of two pivotal cellu-lar stress response signaling pathways in DILI: TNFα-mediated NF-κB signaling and chemical stress-induced Nrf2 activation. Extensive transcriptomics data from pri-mary human hepatocyte revealed that the Nrf2 transcrip-tional program is activated by a majority of different DILI compounds, in particular those that are associated with severe DILI. This strong Nrf2 activation correlates with a major downregulation of genes that are under the direct control of NF-κB. We successfully transferred this inverse relationship between Nrf2 activation and NF-κB signaling into a panel of GFP-reporter-based high-content imaging assays, which now allows the high-throughput assessment of their dynamic activation (Wink et al. 2014). Using live-cell imaging, we established the time profiles of the acti-vation of these transcription factors and established that various DILI compounds activate Nrf2 activity as well as negatively modulate the NF-κB nuclear oscillation response induced by TNFα. Although no cause and effect relationship between these two signaling pathways has been proved in our study, our data do support an overall
1176 Arch Toxicol (2016) 90:1163–1179
1 3
Tabl
e 1
Sum
mar
y of
DIL
I co
mpo
und
mod
ulat
ion
of N
rf2
and
NF-κ
B s
igna
ling
and
onse
t of
DIL
I co
mpo
und/
TN
Fα c
ytot
oxic
syn
ergy
Full
nam
es, a
bbre
viat
ions
and
fun
ctio
n of
the
drug
s ch
osen
for
this
stu
dy. T
he D
ILI
clas
sific
atio
n w
as d
eriv
ed f
rom
Che
n et
al.
(201
1). T
he o
vera
ll re
sults
fro
m th
e cu
rren
t stu
dy a
re s
umm
ariz
ed
as f
old
indu
ctio
n of
the
Srx
n1-G
FP i
nten
sity
com
pare
d to
con
trol
(N
rf2
resp
onse
), t
imin
g of
the
GFP
-p65
ass
ay,
focu
sing
on
the
dela
y in
the
sec
ond
nucl
ear
tran
sloc
atio
n ev
ent
upon
TN
Fα
expo
sure
(N
F-κ
B r
espo
nse)
and
per
cent
age
of d
ead
cells
as
obse
rved
by
the
Ann
exin
-V li
ve a
ssay
(in
clud
ing
TN
Fα-e
nhan
ced
cell
deat
h)
Dru
g na
me
Abb
revi
atio
nFu
nctio
nD
ILI
labe
l/sc
ore
DIL
I cl
assi
fica-
tion
DIL
I ty
peD
ILI
conc
ern
Nrf
2 re
spon
se
assa
y (f
old
indu
ctio
n)
NF-κ
B o
scill
a-tio
n de
lay
upon
T
NFα
Apo
ptos
is a
ssay
(+
last
16
h T
NFα
)
Apo
ptos
is
effe
ct o
f T
NFα
(%
in
crea
se)
Nrf
2 tr
an-
scri
pts
up a
nd
NF-κ
B tr
an-
scri
pts
dow
n
Tro
glita
zone
TG
ZA
ntid
iabe
ticN
.A.
N.A
.A
cute
—ch
oles
-ta
tic in
jury
Mos
t1.
3×2
min
1.1
% (
2.6
%)
1.5
N.A
Ison
iazi
dIN
HA
ntim
ycob
acte
-ri
al d
rug
B.W
. 8Fa
tal h
epat
otox
-ic
ityA
cute
—he
pato
-ce
llula
r in
jury
Mos
t1.
0×2
min
2.8
% (
3.3
%)
0.5
2–9
Oflo
xaci
nO
FXA
ntib
iotic
N.A
.N
.A.
Acu
te—
hepa
to-
cellu
lar
inju
ryL
ess
1.1×
8 m
in2.
3 %
(3.
2 %
)0.
9N
.A
Sim
vast
atin
SNA
ntih
yper
lipi-
dem
icW
/P 3
Liv
er a
mi-
notr
ansf
eras
es
incr
ease
Acu
te—
hepa
to-
cellu
lar
inju
ryL
ess
1.1×
2 m
in2.
5 %
(3.
6 %
)1.
12–
19
Nap
roxe
nN
PXN
SAID
W/P
3L
iver
am
i-no
tran
sfer
ases
in
crea
se
Acu
te—
chol
es-
tatic
inju
ryL
ess
1.8×
4 m
in2.
1 %
(2.
3 %
)0.
22–
4
Met
hotr
exat
eM
TX
Ant
ineo
plas
tic
agen
tB
.W. 3
Liv
er a
mi-
notr
ansf
eras
es
incr
ease
Chr
onic
—m
icro
vesi
cula
r st
eato
sis
Les
s3.
3×9
min
1.9
% (
1.9
%)
0N
.A
Am
ioda
rone
AM
IA
ntia
rrhy
thm
ic
agen
tB
.W. 8
Fata
l hep
atot
ox-
icity
Chr
onic
—st
eato
-he
patit
isM
ost
1.9×
22 m
in5.
8 %
(9.
0 %
)3.
20–
0
Ace
tam
inop
hen
APA
PA
nalg
esic
and
an
tipyr
etic
W/P
5Ja
undi
ceA
cute
—he
pato
-ce
llula
r in
jury
Mos
t4.
0×4
min
2.5
% (
2.5
%)
012
–29
3′-H
ydro
xyac
et-
anili
deA
MA
PR
egio
isom
er o
f pa
race
tam
olN
.A.
N.A
.N
.A.
Les
s4.
0×4
min
3.1
% (
3.4
%)
0.3
N.A
Nitr
ofur
anto
inN
TF
Ant
ibac
teri
alW
/P 8
Fata
l hep
atot
ox-
icity
Chr
onic
—au
toim
mun
e he
patit
is
Mos
t4.
6×29
min
2.9
% (
3.6
%)
0.7
15–2
3
Nef
azod
one
NFZ
Ant
idep
ress
ant
B.W
. 8Fa
tal h
epat
otox
-ic
ityA
cute
—he
pato
-ce
llula
r in
jury
Mos
t4.
8×22
min
3.5
% (
6.8
%)
3.3
13–2
0
Clo
zapi
neC
LZ
Ant
ipsy
chot
ic
drug
W/P
25
Cho
lest
asis
; st
eato
hepa
titis
Acu
te—
chol
es-
tatic
inju
ryM
ost
4.6×
12 m
in4.
0 %
(7.
7 %
)3.
71–
12
Car
bam
azep
ine
CB
ZA
ntie
pile
ptic
dr
ugW
/P 7
Acu
te L
iver
Fa
ilure
Acu
te—
chol
es-
tatic
inju
ryM
ost
4.1×
20 m
in3.
9 %
(22
.5 %
)18
.64–
9
Dic
lofe
nac
DC
FN
SAID
W/P
8Fa
tal h
epat
otox
-ic
ityA
cute
—he
pato
-ce
llula
r in
jury
Mos
t6.
7×26
min
4.5
% (
14.2
%)
9.7
12–2
3
Ket
ocon
azol
eK
TZ
Ant
ifun
gal
antib
iotic
B.W
. 8Fa
tal h
epat
otox
-ic
ityA
cute
—he
pato
-ce
llula
r in
jury
Mos
t8.
3×26
min
5.0
% (
8.1
%)
3.1
9–17
1177Arch Toxicol (2016) 90:1163–1179
1 3
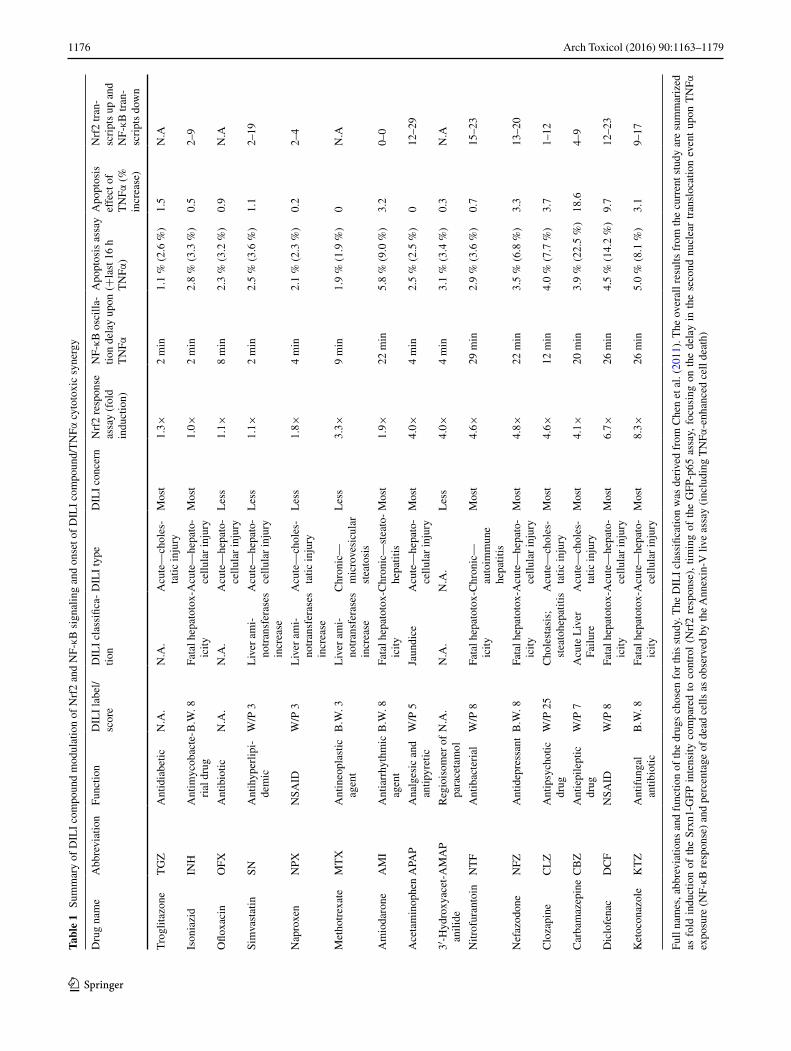
working model whereby DILI compounds that strongly affect the Nrf2 response as well as modulate the NF-κB oscillatory response (either directly or indirectly) act in synergy with TNFα to cause a cytotoxic response. An inte-grated automated high-throughput microscopy-based plat-form that simultaneously measures drug-induced Nrf2 acti-vation, TNFα-induced NF-κB activation and cytotoxicity will likely contribute to the exclusion or de-prioritization of novel drug entities for further development.
Our data indicate a differential regulation of Nrf2 and NF-κB signaling pathways in PHH. From the Japanese Toxicogenomics Project, a total of 90 DILI compounds have been evaluated. While several DILI compounds caused a strong modulation of most Nrf2 and NF-κB tar-get genes, e.g., NTF, DCF and KTZ, the effect of AMI was only modest. Despite the fact that HepG2 cells are notorious for their low level expression of CYP enzymes (Westerink and Schoonen 2007), an enhanced formation of reactive intermediates during drug metabolism may be causative for the activation of the Nrf2 response. However, we cannot exclude the role of other stress response path-ways that are intricately linked to the modulation of the Nrf2 response and by themselves are activated by chemi-cal-induced cell injury, including the perturbation of the mitochondria, the endoplasmic reticulum (ER) and the autophagosomes which may result in a secondary source of ROS that may initiate an adaptive Nrf2 response (Sano and Reed 2013). Although the role of these other programs will require further mechanistic investigations, our previ-ous investigations demonstrate that suppression of the Nrf2 adaptive stress response strongly sensitizes cells toward a synergistic toxicity with TNFα, indicating that enhanced oxidative stress predisposes for TNFα sensitization (Fre-driksson et al. 2014).
The PHH transcriptomics data indicated that many DILI compounds themselves suppress the activity of NF-κB target genes. In addition, our imaging data indicate that various DILI compounds suppress the NF-κB oscillatory response. Together, this suggests that also under control sit-uations, the overall nuclear localization of NF-κB may be limited, thereby precluding the activation of NF-κB target genes. Alternatively, a limited activation of NF-κB by DILI compounds possibly influences the expression of modu-lators that act as feedback suppressors of NF-κB activ-ity, such as IkBα/NFKBIA or A20/TNFAIP3 (Hutti et al. 2007). Indeed, NF-κB signals through an auto-regulatory negative feedback mechanism that essentially desensitizes a cell for a limited time period against re-activation of the response by an active NF-κB-inducing kinase complex (IKK) (Hinz and Scheidereit 2014). Although drug expo-sure alone may elicit NF-κB oscillations, this does not limit the primary nuclear translocation event upon TNFα expo-sure, only the subsequent nuclear translocation events. The
later oscillations are less intense and less synchronized due to induction of a second negative feedback regulator, A20. Interestingly, several, but not all, DILI compounds affect the expression of IkBα and A20 in PHH, which often occur in parallel, supporting a similar mechanism of acti-vation (see Supplementary Fig. 7). We therefore turned to our GFP-p65 reporter and tested whether the test drugs can induce NF-κB oscillations on their own. In line with this, we found that DCF, CBZ, NFZ, CLZ and KTZ induced a limited NF-κB transition in 2–6 % of a given cell popu-lation within the first 2 h after exposure which was not apparently different from control conditions (Supplemen-tary Fig. 8). This suggests that drug pre-exposure does not directly change the initial balance of NF-κB and its cyto-plasmic inhibitor, IκBα, but rather may influence the tran-scriptional and translational responses required for normal execution of the timing of the NF-κB response after the first nuclear translocation event.
The rationale for the choice of drugs was to investi-gate whether our live-cell imaging systems were able to discriminate between drugs that are often linked to DILI (TGZ, AMI, INH, KTZ, NFZ, MTX, NTF, CBZ and DCF) and relatively safe drugs (NPX, SN, OFX and CLZ). We have focused on NF-κB signaling, Nrf2 activation and cell death induction, and a summary of the different responses is provided in Table 1. As APAP and AMAP induce hepato-cellular death through necrosis at high levels of drug con-centrations (an EC50 in PHH of ~25 mM), and not apopto-sis, these are considered as relatively safe drugs (Hadi et al. 2013). Based on our results, NPX, SN and OFX are safe (no massive cell death induction, no gross effect on Nrf2 or NF-κB signaling), but CLZ should be re-evaluated: Its profile of strong Srxn1-GFP induction, NF-κB delay and slightly higher cell death induced by TNFα co-exposure shows more resemblance to drugs that are more often asso-ciated with DILI, such as DCF, CBZ, KTZ, NFZ and NTF.
Our assays have not been able to pick up any mecha-nistic signs for toxicity for INH and TGZ, two typical idi-osyncratic DILI-related drugs (Table 1). The hepatotoxic effect of these two drugs, however, could partly depend on their inhibitory effect on bile acid transport (Cheng et al. 2013; Foster et al. 2012), which might only emerge from advanced (3D) hepatocyte culture models (Malinen et al. 2012). Moreover, lack of strong bioactivation capacity in HepG2 cells could also be a reason why we could not observe any effect for these compounds.
In conclusion, we demonstrate an association between Nrf2 signaling and NF-κB responses in two distinct liver models: PHH and HepG2. Using the live-cell imaging of our GFP-based reporter models for Nrf2 and NF-κB signaling, we established the inverse relationship between these signaling pathways in relation to DILI compound and TNFα-mediated synergistic toxicity. This was only feasible by assessing the
1178 Arch Toxicol (2016) 90:1163–1179
1 3
quantitative dynamics of the NF-κB responses, underscoring the integration of live-cell imaging of stress response path-ways in mechanistic studies in relation to DILI assessment.
Acknowledgments The authors like to thank the TI-Pharma consor-tium for critically reading the manuscript and members of the divi-sion of Toxicology for help and scientific discussions. This work was supported by the TI-Pharma project (Grant Agreement D3-201), the IMI MIP-DILI (Grant Agreement No 115336), EU FP7 DETECTIVE project (Grant Agreement No 266838), project to BvdW and the NGI Horizon project (Grant Agreement 9351008) to BH.
Open Access This article is distributed under the terms of the Creative Commons Attribution 4.0 International License (http://crea-tivecommons.org/licenses/by/4.0/), which permits unrestricted use, distribution, and reproduction in any medium, provided you give appropriate credit to the original author(s) and the source, provide a link to the Creative Commons license, and indicate if changes were made.
References
Ashburner M, Ball CA, Blake JA et al (2000) Gene ontology: tool for the unification of biology. The Gene Ontology Consortium. Nat Genet 25(1):25–29. doi:10.1038/75556
Boess F, Kamber M, Romer S et al (2003) Gene expression in two hepatic cell lines, cultured primary hepatocytes, and liver slices compared to the in vivo liver gene expression in rats: possible implications for toxicogenomics use of in vitro systems. Toxicol Sci 73(2):386–402. doi:10.1093/toxsci/kfg064
Carbon S, Ireland A, Mungall CJ, Shu S, Marshall B, Lewis S (2009) AmiGO: online access to ontology and annotation data. Bioin-formatics 25(2):288–289. doi:10.1093/bioinformatics/btn615
Chen XL, Dodd G, Thomas S et al (2006) Activation of Nrf2/ARE pathway protects endothelial cells from oxidant injury and inhib-its inflammatory gene expression. Am J Physiol Heart Circ Phys-iol 290(5):H1862–H1870. doi:10.1152/ajpheart.00651.2005
Chen M, Vijay V, Shi Q, Liu Z, Fang H, Tong W (2011) FDA-approved drug labeling for the study of drug-induced liver injury. Drug Discov Today 16(15–16):697–703. doi:10.1016/j.drudis.2011.05.007
Cheng J, Krausz KW, Li F, Ma X, Gonzalez FJ (2013) CYP2E1-dependent elevation of serum cholesterol, triglycerides, and hepatic bile acids by isoniazid. Toxicol Appl Pharmacol 266(2):245–253. doi:10.1016/j.taap.2012.10.024
Cosgrove BD, King BM, Hasan MA et al (2009) Synergistic drug-cytokine induction of hepatocellular death as an in vitro approach for the study of inflammation-associated idiosyncratic drug hepatotoxicity. Toxicol Appl Pharmacol 237(3):317–330. doi:10.1016/j.taap.2009.04.002
Croft D, Mundo AF, Haw R et al (2014) The Reactome pathway knowledgebase. Nucleic Acids Res 42(Database issue):D472–D477. doi:10.1093/nar/gkt1102
Di Z, Herpers B, Fredriksson L et al (2012) Automated analysis of NF-κB nuclear translocation kinetics in high-throughput screen-ing. PLoS One 7(12):e52337. doi:10.1371/journal.pone.0052337
Foster JR, Jacobsen M, Kenna G et al (2012) Differential effect of troglitazone on the human bile acid transporters, MRP2 and BSEP, in the PXB hepatic chimeric mouse. Toxicol Pathol. doi:10.1177/0192623312447542
Fredriksson L, Herpers B, Benedetti G et al (2011) Diclofenac inhibits tumor necrosis factor-α-induced nuclear factor-κB
activation causing synergistic hepatocyte apoptosis. Hepatology 53(6):2027–2041. doi:10.1002/hep.24314
Fredriksson L, Wink S, Herpers B et al (2014) Drug-induced endo-plasmic reticulum and oxidative stress responses independently sensitize toward TNFα-mediated hepatotoxicity. Toxicol Sci 140(1):144–159. doi:10.1093/toxsci/kfu072
Garside H, Marcoe KF, Chesnut-Speelman J et al (2014) Evaluation of the use of imaging parameters for the detection of compound-induced hepatotoxicity in 384-well cultures of HepG2 cells and cryopreserved primary human hepatocytes. Toxicol In Vitro 28(2):171–181. doi:10.1016/j.tiv.2013.10.015
Gaujoux R, Seoighe C (2010) A flexible R package for non-negative matrix factorization. BMC Bioinformatics 11:367. doi:10.1186/1471-2105-11-367
Hadi M, Dragovic S, Swelm R et al (2013) AMAP, the alleged non-toxic isomer of acetaminophen, is toxic in rat and human liver. Arch Toxicol 87(1):155–165. doi:10.1007/s00204-012-0924-1
Han D, Dara L, Win S et al (2013) Regulation of drug-induced liver injury by signal transduction pathways: critical role of mito-chondria. Trends Pharmacol Sci 34(4):243–253. doi:10.1016/j.tips.2013.01.009
Hendriks G, Atallah M, Morolli B et al (2012) The ToxTracker assay: novel GFP reporter systems that provide mechanistic insight into the genotoxic properties of chemicals. Toxicol Sci 125(1):285–298. doi:10.1093/toxsci/kfr281
Hinz M, Scheidereit C (2014) The IκB kinase complex in NF-κB regulation and beyond. EMBO Rep 15(1):46–61. doi:10.1002/embr.201337983
Hochberg Y, Benjamini Y (1990) More powerful procedures for mul-tiple significance testing. Stat Med 9(7):811–818
Hsu H, Shu HB, Pan MG, Goeddel DV (1996) TRADD-TRAF2 and TRADD-FADD interactions define two distinct TNF receptor 1 signal transduction pathways. Cell 84(2):299–308. doi:10.1016/S0092-8674(00)80984-8
Hutti JE, Turk BE, Asara JM, Ma A, Cantley LC, Abbott DW (2007) IκB kinase beta phosphorylates the K63 deubiquitinase A20 to cause feedback inhibition of the NF-κB pathway. Mol Cell Biol 27(21):7451–7461. doi:10.1128/MCB.01101-07
Irizarry RA, Hobbs B, Collin F et al (2003) Exploration, normali-zation, and summaries of high density oligonucleotide array probe level data. Biostatistics 4(2):249–264. doi:10.1093/biostatistics/4.2.249
Kanehisa M, Goto S, Sato Y, Kawashima M, Furumichi M, Tan-abe M (2014) Data, information, knowledge and principle: back to metabolism in KEGG. Nucleic Acids Res 42(Database issue):D199–D205. doi:10.1093/nar/gkt1076
Kaplowitz N (2005) Idiosyncratic drug hepatotoxicity. Nat Rev Drug Discov 4(6):489–499. doi:10.1038/nrd1750
Leung L, Kalgutkar AS, Obach RS (2012) Metabolic activation in drug-induced liver injury. Drug Metab Rev 44(1):18–33. doi:10.3109/03602532.2011.605791
Li J, Johnson D, Calkins M, Wright L, Svendsen C, Johnson J (2005) Stabilization of Nrf2 by tBHQ confers protection against oxida-tive stress-induced cell death in human neural stem cells. Toxicol Sci 83(2):313–328. doi:10.1093/toxsci/kfi027
Liberzon A, Subramanian A, Pinchback R, Thorvaldsdottir H, Tamayo P, Mesirov JP (2011) Molecular signatures database (MSigDB) 3.0. Bioinformatics 27(12):1739–1740. doi:10.1093/bioinformatics/btr260
Liu ZG, Hsu H, Goeddel DV, Karin M (1996) Dissection of TNF receptor 1 effector functions: JNK activation is not linked to apoptosis while NF-κB activation prevents cell death. Cell 87(3):565–576. doi:10.1016/S0092-8674(00)81375-6
Liu GH, Qu J, Shen X (2008) NF-κB/p65 antagonizes Nrf2-ARE pathway by depriving CBP from Nrf2 and facilitating
1179Arch Toxicol (2016) 90:1163–1179
1 3
recruitment of HDAC3 to MafK. Biochim Biophys Acta 1783(5):713–727. doi:10.1016/j.bbamcr.2008.01.002
Liu F, Ichihara S, Valentine WM et al (2010) Increased susceptibil-ity of Nrf2-null mice to 1-bromopropane-induced hepatotoxicity. Toxicol Sci 115(2):596–606. doi:10.1093/toxsci/kfq075
Liu J, Wu KC, Lu YF, Ekuase E, Klaassen CD (2013) Nrf2 protection against liver injury produced by various hepatotoxicants. Oxid Med Cell Longev 2013:305861. doi:10.1155/2013/305861
Malinen MM, Palokangas H, Yliperttula M, Urtti A (2012) Peptide nanofiber hydrogel induces formation of bile canaliculi struc-tures in three-dimensional hepatic cell culture. Tissue Eng Part A 18(23–24):2418–2425. doi:10.1089/ten.TEA.2012.0046
Mercurio F, Zhu H, Murray BW et al (1997) IKK-1 and IKK-2: cytokine-activated IκB kinases essential for NF-κB activation. Science 278(5339):860–866
Poser I, Sarov M, Hutchins JR et al (2008) BAC TransgeneOmics: a high-throughput method for exploration of protein function in mammals. Nat Methods 5(5):409–415. doi:10.1038/nmeth.1199
Puigvert JC, de Bont H, van de Water B, Danen EH (2010) High-throughput live cell imaging of apoptosis. Curr Protoc Cell Biol, Chapter 18:Unit 18.10.1-13. doi:10.1002/0471143030.cb1810s47
Purschke M, Rubio N, Held KD, Redmond RW (2010) Phototoxicity of Hoechst 33342 in time-lapse fluorescence microscopy. Photo-chem Photobiol Sci 9(12):1634–1639. doi:10.1039/c0pp00234h
Qian Z, Cai YD, Li Y (2006) Automatic transcription factor classifier based on functional domain composition. Biochem Biophys Res Commun 347(1):141–144. doi:10.1016/j.bbrc.2006.06.060
Rushworth SA, Shah S, MacEwan DJ (2011) TNF mediates the sustained activation of Nrf2 in human monocytes. J Immunol 187(2):702–707. doi:10.4049/jimmunol.1004117
Sano R, Reed JC (2013) ER stress-induced cell death mechanisms. Biochim Biophys Acta 1833(12):3460–3470. doi:10.1016/j.bbamcr.2013.06.028
Shaw PJ, Hopfensperger MJ, Ganey PE, Roth RA (2007) Lipopoly-saccharide and trovafloxacin coexposure in mice causes idio-syncrasy-like liver injury dependent on tumor necrosis factor-α. Toxicol Sci 100(1):259–266. doi:10.1093/toxsci/kfm218
Smyth GK, Michaud J, Scott HS (2005) Use of within-array repli-cate spots for assessing differential expression in microarray experiments. Bioinformatics 21(9):2067–2075. doi:10.1093/bioinformatics/bti270
Steuerwald NM, Foureau DM, Norton HJ et al (2013) Profiles of serum cytokines in acute drug-induced liver injury and their prognostic significance. PLoS One 8(12):e81974. doi:10.1371/journal.pone.0081974
Uehara T, Ono A, Maruyama T et al (2010) The Japanese toxicog-enomics project: application of toxicogenomics. Mol Nutr Food Res 54(2):218–227. doi:10.1002/mnfr.200900169
Westerink WM, Schoonen WG (2007) Cytochrome P450 enzyme levels in HepG2 cells and cryopreserved primary human hepat-ocytes and their induction in HepG2 cells. Toxicol In Vitro 21(8):1581–1591. doi:10.1016/j.tiv.2007.05.014
Wink S, Hiemstra S, Huppelschoten S et al (2014) Quantitative high content imaging of cellular adaptive stress response pathways in toxicity for chemical safety assessment. Chem Res Toxicol 27(3):338–355. doi:10.1021/tx4004038
Wolfinger RD, Gibson G, Wolfinger ED et al (2001) Assess-ing gene significance from cDNA microarray expres-sion data via mixed models. J Comput Biol 8(6):625–637. doi:10.1089/106652701753307520
Yu M, Li H, Liu Q et al (2011) Nuclear factor p65 interacts with Keap1 to repress the Nrf2-ARE pathway. Cell Signal 23(5):883–892. doi:10.1016/j.cellsig.2011.01.014