A study of optical properties of Sm3+ ions in α-Na3Y(VO4)2 single crystals
7
A study of optical properties of Sm 3+ ions in α-Na 3 Y(VO 4 ) 2 single crystals Marcin Sobczyk n , Damian Szymański Faculty of Chemistry, University of Wroclaw, ul. F. Joliot-Curie 14, 50-383 Wroclaw, Poland article info Article history: Received 30 January 2013 Received in revised form 19 March 2013 Accepted 29 March 2013 Available online 10 April 2013 Keywords: Samarium Sm 3+ Vanadates Luminescence Energy transfer Crystals Vibronic transitions abstract Single crystals of α-Sm 3+ :Na 3 Y(VO 4 ) 2 have been grown by the flux growth method. The absorption (300 K) fluorescence (4.2 and 300 K) and excitation (7 and 300 K) spectra as well as the fluorescence dynamics of the Sm 3+ -doped title crystals are presented and analyzed in detail. The energy transfer between Sm 3+ –Sm 3+ as well as from VO 4 3− to Sm 3+ were studied in detail. A Judd–Ofelt intensity analysis of the absorption (300 K) spectrum has been applied for determination of Ω λ parameters which in turn have been used in calculation of the radiative transition probability factor (A), fluorescence branching ratios (β), natural (radiative) lifetime of the 4 G(4) 5/2 level of Sm 3+ and emission cross-section (s em ). For the first time very large lifetimes of the Sm 3+ fluorescence level have been observed. & 2013 Elsevier B.V. All rights reserved. 1. Introduction Tetraoxovanadates(V) activated by lanthanide ions are of inter- est due to their useful luminescent properties. Vanadates, except Tb 3+ , are excellent host lattices for various trivalent lanthanide ions, due to their efficiency energy transfer from the VO 4 3− ion to these activator ions leading to intense emission [1]. Absorption bands of the 4f N -4f N transitions of Ln 3+ doped tetraoxovanadates (V) are characterized by relatively high values of cross sections allowing an efficient excitation into 2S+1 L J levels, using a cheap commercial source of excitation. Eu 3+ : YVO 4 was an important commercial red phosphor used in color television, cathode ray tubes (CRTs) and high-pressure lamps [2,3]. Europium doped vanadates have been used as phosphors for X-ray intensifying screen and X-ray computed tomography [4]. Nd 3+ -doped YVO 4 single crystals are very efficient commercial laser materials oper- ating at 1064 nm and pumped by semiconductor laser at 808 nm due to a broad and strong Nd 3+ absorption bands [5–7]. Neody- mium and erbium ions-doped vanadates(V) shows a strong emis- sion under UV excitation due to the efficient energy transfer from the CT state to the 4f 3 (Nd 3+ ) or 4f 11 (Er 3+ ) electronic states [8,9]. Relatively strong fluorescence at 1064 nm from Nd 3+ ions was observed also in Nd 3+ :KZnLa(VO 4 ) 2 under 808 or 354.5 nm excita- tion to the 4 F 5/2 or CT bands, respectively [9]. Erbium-doped KCaY (VO 4 ) 2 shows a strong green and near infrared emission under UV observed under excitation at 980 and 320 nm, respectively. In recent years an increasing interest in inorganic samarium(III) compounds: bulk crystals, nanocrystals and glasses has been reported due to high fluorescence quantum yields. Analyzes of absorption and fluorescence spectra, decay kinetics and mechan- isms of energy transfer leading to the depopulation of fluorescence level has been presented by many authors. Trivalent samarium ions are widely used as activators characterized by efficient emission from the 4 G(4) 5/2 level to the 6 H J (J ¼ 5/2, 7/2, 9/2, 11/2) states in vis spectral region [10,11]. The color of this emission is usually reddish orange. Fluorescence of Sm 3+ ions in the NIR region, which originate from the 4 G(4) 5/2 level to the 6 H 13/2 , 6 H 15/2 and 6 F J (J ¼ 1/2, 3/2, 5/2, 7/2, 9/2,11/2) states, is presented and discussed very rarely. The 4 G (4) 5/2 state shows different quenching emission channels which make the Sm 3+ ion an interesting case to analyze the energy transfer process. Studies of Sm 3+ -doped crystals and glasses are mainly focused for the possible application as phosphors of visible light efficiency, which absorb the excitation energy in the UV–VUV and vis regions [12,13]. Earlier studies on optical absorption and emission spectra of Sm 3+ : LiNbO 3 have demonstrated the possibi- lity a laser action with a unique orange wavelength [14]. The scientific literature encountered also a report of NIR to vis upconverted emission for some Sm 3+ -doped crystals [15,16]. However, among all the trivalent lanthanide ions, except pro- methium, spectroscopic properties of the Sm 3+ ion are still little understood and described. It especially concern hosts in which CT transitions are located in the near UV with efficient energy transfer to the 4f 5 levels of Sm 3+ , such as e.g. tetraoxovanadates (V) matrices [17]. Earlier spectroscopic studies of Dy 3+ [18] and Nd 3+ -doped [19] α-Na 3 Y(VO 4 ) 2 shows that α-Na 3 Y(VO 4 ) 2 is promising host matrix Contents lists available at SciVerse ScienceDirect journal homepage: www.elsevier.com/locate/jlumin Journal of Luminescence 0022-2313/$ - see front matter & 2013 Elsevier B.V. All rights reserved. http://dx.doi.org/10.1016/j.jlumin.2013.03.062 n Corresponding author. Tel. +48 71 3757333, +48 71 3757321; fax: +48 71 328 2348. E-mail address: [email protected] (M. Sobczyk). Journal of Luminescence 142 (2013) 96–102
Transcript of A study of optical properties of Sm3+ ions in α-Na3Y(VO4)2 single crystals

Journal of Luminescence 142 (2013) 96–102
Contents lists available at SciVerse ScienceDirect
Journal of Luminescence
0022-23http://d
n CorrE-m
journal homepage: www.elsevier.com/locate/jlumin
A study of optical properties of Sm3+ ions in α-Na3Y(VO4)2 single crystals
Marcin Sobczyk n, Damian SzymańskiFaculty of Chemistry, University of Wrocław, ul. F. Joliot-Curie 14, 50-383 Wrocław, Poland
a r t i c l e i n f o
Article history:Received 30 January 2013Received in revised form19 March 2013Accepted 29 March 2013Available online 10 April 2013
Keywords:Samarium Sm3+
VanadatesLuminescenceEnergy transferCrystalsVibronic transitions
13/$ - see front matter & 2013 Elsevier B.V. Ax.doi.org/10.1016/j.jlumin.2013.03.062
esponding author. Tel. +48 71 3757333, +48 713ail address: [email protected]
a b s t r a c t
Single crystals of α-Sm3+:Na3Y(VO4)2 have been grown by the flux growth method. The absorption(300 K) fluorescence (4.2 and 300 K) and excitation (7 and 300 K) spectra as well as the fluorescencedynamics of the Sm3+-doped title crystals are presented and analyzed in detail. The energy transferbetween Sm3+–Sm3+ as well as from VO4
3− to Sm3+ were studied in detail. A Judd–Ofelt intensity analysisof the absorption (300 K) spectrum has been applied for determination of Ωλ parameters which in turnhave been used in calculation of the radiative transition probability factor (A), fluorescence branchingratios (β), natural (radiative) lifetime of the 4G(4)5/2 level of Sm3+ and emission cross-section (sem). Forthe first time very large lifetimes of the Sm3+
fluorescence level have been observed.& 2013 Elsevier B.V. All rights reserved.
1. Introduction
Tetraoxovanadates(V) activated by lanthanide ions are of inter-est due to their useful luminescent properties. Vanadates, exceptTb3+, are excellent host lattices for various trivalent lanthanideions, due to their efficiency energy transfer from the VO4
3− ion tothese activator ions leading to intense emission [1]. Absorptionbands of the 4fN-4fN transitions of Ln3+ doped tetraoxovanadates(V) are characterized by relatively high values of cross sectionsallowing an efficient excitation into 2S+1LJ levels, using a cheapcommercial source of excitation. Eu3+: YVO4 was an importantcommercial red phosphor used in color television, cathode raytubes (CRTs) and high-pressure lamps [2,3]. Europium dopedvanadates have been used as phosphors for X-ray intensifyingscreen and X-ray computed tomography [4]. Nd3+-doped YVO4
single crystals are very efficient commercial laser materials oper-ating at 1064 nm and pumped by semiconductor laser at 808 nmdue to a broad and strong Nd3+ absorption bands [5–7]. Neody-mium and erbium ions-doped vanadates(V) shows a strong emis-sion under UV excitation due to the efficient energy transfer fromthe CT state to the 4f3 (Nd3+) or 4f11 (Er3+) electronic states [8,9].Relatively strong fluorescence at 1064 nm from Nd3+ ions wasobserved also in Nd3+:KZnLa(VO4)2 under 808 or 354.5 nm excita-tion to the 4F5/2 or CT bands, respectively [9]. Erbium-doped KCaY(VO4)2 shows a strong green and near infrared emission under UVobserved under excitation at 980 and 320 nm, respectively.
ll rights reserved.
757321; fax: +48 71 328 2348.l (M. Sobczyk).
In recent years an increasing interest in inorganic samarium(III)compounds: bulk crystals, nanocrystals and glasses has beenreported due to high fluorescence quantum yields. Analyzes ofabsorption and fluorescence spectra, decay kinetics and mechan-isms of energy transfer leading to the depopulation of fluorescencelevel has been presented by many authors. Trivalent samariumions are widely used as activators characterized by efficientemission from the 4G(4)5/2 level to the 6HJ (J¼5/2, 7/2, 9/2, 11/2)states in vis spectral region [10,11]. The color of this emission isusually reddish orange.
Fluorescence of Sm3+ ions in the NIR region, which originatefrom the 4G(4)5/2 level to the 6H13/2, 6H15/2 and 6FJ (J¼1/2, 3/2, 5/2,7/2, 9/2, 11/2) states, is presented and discussed very rarely. The 4G(4)5/2 state shows different quenching emission channels whichmake the Sm3+ ion an interesting case to analyze the energytransfer process. Studies of Sm3+-doped crystals and glasses aremainly focused for the possible application as phosphors of visiblelight efficiency, which absorb the excitation energy in the UV–VUVand vis regions [12,13]. Earlier studies on optical absorption andemission spectra of Sm3+: LiNbO3 have demonstrated the possibi-lity a laser action with a unique orange wavelength [14]. Thescientific literature encountered also a report of NIR to visupconverted emission for some Sm3+ -doped crystals [15,16].However, among all the trivalent lanthanide ions, except pro-methium, spectroscopic properties of the Sm3+ ion are still littleunderstood and described. It especially concern hosts in which CTtransitions are located in the near UV with efficient energytransfer to the 4f5 levels of Sm3+, such as e.g. tetraoxovanadates(V) matrices [17].
Earlier spectroscopic studies of Dy3+ [18] and Nd3+-doped [19]α-Na3Y(VO4)2 shows that α-Na3Y(VO4)2 is promising host matrix
M. Sobczyk, D. Szymański / Journal of Luminescence 142 (2013) 96–102 97
for lanthanide ions. The crystal exhibits an efficient energy transferfrom VO4
3− to the Dy3+ ion [18]. Low energy excitation losses andhigh emission cross-section of 4F3/2-4I11/2 laser transition at1064 nm were observed for α-Nd3+: Na3Y(VO4)2 single crystals[19].
The aim of the present study is to investigate the fluorescenceproperties of Sm3+-doped α-Na3Y(VO4)2 single crystals. α-Na3Y1-x
Smx(VO4)2 (where x¼0.01, 0.1, 0.5, 1.0, 2.0 and 5.0 at%) singlecrystals with an average size of about 140 μm3 were grown by fluxgrowth method. The absorption (300 K), excitation (300 K) andfluorescence (4.2 and 300 K) spectra were investigated in detail inthe NIR–vis–UV and VUV region along with the electronic struc-ture of Sm3+ and energy transfer mechanisms between Sm3+–Sm3+,and Sm3+–VO4
3− ions. The Judd–Ofelt theory has been applied tocharacterize important emission properties of Sm3+ ions. Radiativetransition probabilities, fluorescence branching ratios, radiativedecay time and emission cross-sections have been calculated. Theeffect of the Sm3+ ion concentration on decay times are discussed.
2. Experimental
The single crystals of α-Na3Y1-xSmx(VO4)2 (where x¼0.01, 0.1,0.5, 1.0, 2.0 and 5.0 at%) were prepared according to the procedurereported for α-Nd3+: Na3Y(VO4)2 in Ref. 19. The maximum size ofthe α-Na3Y1-xSmx(VO4)2 crystal achieved is about 18�4�2 mm3
for the optimum process conditions (1323 K and cooling rate 2 K/h).High purity (99.999%) Na2CO3, Y2O3, Sm2O3 and NH4VO3 were usedas starting materials.
The electronic absorption spectra were recorded at roomtemperature on a Cary 500 SCAN NIR–vis–UV spectrophotometer(Varian). Microcrystalline samples in form of compressed andpolished disc-shaped pellets (ca. 0.494 mm thick and 12.63 mmdiameter) were used in order to obtain high-quality absorptionspectra. Previously water from the surface of the pellets, has beenremoved by heating for a time at 500 1C followed by a slowlycooling to room temperature. Finally they were fixed in thespectrophotometer on a copper holder.
The fluorescence and excitation spectra corrected for theinstrument characteristics in the vis–UV region were recordedon Cary Eclipse Fluorescence Spectrophotometer (Agilent Tech-nologies) equipped with a continuous Xe lamp. The fluorescencesignals were detected using a high-resolution HR–4000 Ocean-Optics spectrofluorometer. For low-temperature measurements(fluorescence spectra) a continuous flow helium cryostat (Oxfordmodel CF 1204) equipped with a temperature controller was used.
Fluorescence decay curves were recorded with a GDM-1000monochromator and a Tektronix model TDS 3052 digital oscillo-scope following the selective excitation by a Continuum Surelite Ioptical parametric oscillator (OPO) pumped by a third harmonic ofa Nd:YAG laser and detected by an Hamamatsu R955 photo-multiplier with S-20 spectral response.
UV–VUV spectroscopic measurements with synchrotron radia-tion were undertaken on beamline I of the SUPERLUMI experi-mental station of the Synchrotronstrahlungslabor HASYLAB atDESY in Hamburg, Germany. VUV eexcitation spectra were cor-rected for spectral efficiency of the excitation source by using asodium salicylate standard. A detailed description of this set-up isgiven elsewhere [20].
Fig. 1. Absorption spectrum of α-Sm3+: Na3Y(VO4)2, recorded at 300 K.
3. Results and discussion
3.1. Electronic structure and fluorescence properties
The α-Na3Y(VO4)2 crystallizes in the monoclinic space groupP21/n with Z¼2 [18,21]. The Sm3+ ions replace the single
crystallographic position of Y3+. The site symmetry of the Y3+
and Sm3+ is C2v. Free Sm3+ ion has a 4f5 configurationwith the 6H5/
2 ground state level.High-resolution absorption spectrum of the α-Na3Y0.95Sm0.05(VO4)2
crystal was measured at 300 K in NIR–vis–UV spectral region and isshows in Fig. 1. In the 5500–25000 cm−1 range, relatively sharp andwell separated bands of intraconfigurational 4f5-4f5 transitions fromthe 6H5/2 level were observed, exclusively. The absorption bands of theSm3+ ion can be classified into two groups: the first group in the NIRspectral region, contains transitions up to about 10700 cm−1 and thesecond one is a high–energy group containing transitions in the vis–UV range. The absorption bands observed between 6000–7000 cm−1
are ascribed to transitions from the 6H5/2 level to the 6F1/2, 6H15/2 and6F3/2 levels. The 6H5/2-
6F1/2 and 6H5/2-6F3/2 transitions are charac-
terized by much larger values of matrix elements than the 6H5/
2-6H15/2 transition; we conclude that the most intensive line at
6353 cm−1 is a Stark component of the 6F1/2 level and the intensivelines at 6816 and 6833 cm−1 are crystal-field components of the 6F3/2level. The bands between 7000 and 10700 cm−1 and 17500–20000 cm−1 are well separated. Their assignment to the correspond-ing electronic transitions do not cause problems. Bands observedbetween 20400–20900 cm−1 are ascribed to transitions from the 6H5/2
to the 4I(3)9/2 and 4M15/2 states. In the α-Sm3+:Na3Y(VO4)2 crystal, S′L′MJ′ levels higher energies than that of 4M15/2 are not observed due toscattering of light by the pressed pellet.
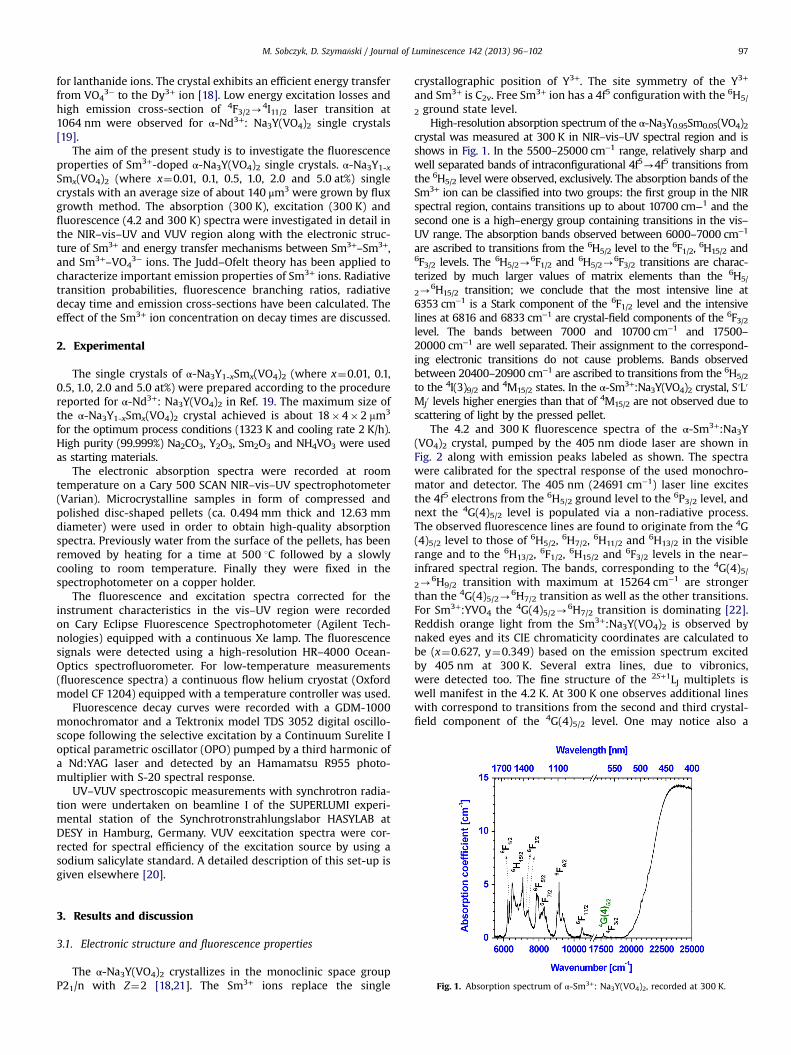
The 4.2 and 300 K fluorescence spectra of the α-Sm3+:Na3Y(VO4)2 crystal, pumped by the 405 nm diode laser are shown inFig. 2 along with emission peaks labeled as shown. The spectrawere calibrated for the spectral response of the used monochro-mator and detector. The 405 nm (24691 cm−1) laser line excitesthe 4f5 electrons from the 6H5/2 ground level to the 6P3/2 level, andnext the 4G(4)5/2 level is populated via a non-radiative process.The observed fluorescence lines are found to originate from the 4G(4)5/2 level to those of 6H5/2, 6H7/2, 6H11/2 and 6H13/2 in the visiblerange and to the 6H13/2, 6F1/2, 6H15/2 and 6F3/2 levels in the near–infrared spectral region. The bands, corresponding to the 4G(4)5/2-
6H9/2 transition with maximum at 15264 cm−1 are strongerthan the 4G(4)5/2-6H7/2 transition as well as the other transitions.For Sm3+:YVO4 the 4G(4)5/2-6H7/2 transition is dominating [22].Reddish orange light from the Sm3+:Na3Y(VO4)2 is observed bynaked eyes and its CIE chromaticity coordinates are calculated tobe (x¼0.627, y¼0.349) based on the emission spectrum excitedby 405 nm at 300 K. Several extra lines, due to vibronics,were detected too. The fine structure of the 2S+1LJ multiplets iswell manifest in the 4.2 K. At 300 K one observes additional lineswith correspond to transitions from the second and third crystal-field component of the 4G(4)5/2 level. One may notice also a
M. Sobczyk, D. Szymański / Journal of Luminescence 142 (2013) 96–10298
temperature broadening of the fluorescent lines. This phenom-enon is related to electron–phonon interactions [23].
The bands at 17713 and 17349 cm−1 determine the spittingΔE¼364 cm−1 of 6H5/2 ground level. The experimental Starkcomponents and crystal-field splitting of the ground and excitedstate levels of Sm3+-doped α-Na3Y(VO4)2 crystal determined fromthe fluorescence spectra (4.2 K) are collected in Table 1.
A number of relatively sharp vibronic lines in the 15200–14370 cm−1 range of fluorescence spectrum at 4.2 K has beenassigned to transition from the 4G(4)5/2 level to crystal-fieldcomponents of the 6H9/2 level. The assignment of the transitionshas been performed by a comparison of the relative energies of thelines with the vibrational frequencies of the α-Na3Y(VO4)2 lattice(Table 2), determined [19] from Infrared and Raman spectra. Onemay consider the agreement as a good one. The line at 14481 cm−1
is positioned of 954 cm−1 below the zero phonon and correspondswith the last line observed in the Raman spectrum and themaximum phonon energy. The ratio (R) of the integrated inten-sities for all vibronic lines, originating from transitions from thefirst crystal-field component of the 6H9/2 level to the integratedintensity of the zero phonon line (15434 cm−1) is equal to 0.88. For
Fig. 2. Fluorescence spectra of α-Sm3+: Na3Y(VO4)2 excited by 405 nm andrecorded at 300 and 4.2 K.
Table 1Experimental crystal-field components of the 2S+1LJ multiplets of Sm3+ ion-dopedα-Na3Y(VO4)2 single crystals determined from 4.2 K fluorescence spectra.
2S+1LJ Energy (cm−1) Experimental/theoretical
Baricenter(cm−1)
Splitting, ΔE(cm−1)
6H5/2 0, 275, 364 3/3 213 3646H7/2 1115, 1227, 1313, 1455 4/4 1278 3406H9/2 2279, 2330, 2345, 2404,
24575/5 2363 178
6H11/2 3589, 3693, 3723, 3733,3760, 3783
6/6 3714 194
6H13/26F1/2 6353 1/1 6353 06H15/2 6488a6F3/2 6816, 6833 2/2 6825 176F5/2 7111, 7129, 7164 3/3 7135 536F7/2 7961, 7999, 8025 3/4 7995 646F9/2 9125, 9142, 9171, 9187 4/5 9156 626F11/2 10514, 10538, 10554,
105674/6 10555a
4G5/2 17713 1/3
a Determined from 300 K absorption spectrum.
Nd3+-doped Na3Y(VO4)2 the R parameter value was reported to be0.33 for the 4I9/2-4G5/2 hypersensitive transition. Comparing theresults obtained for the Sm3+:Na3Y(VO4)2 with those reported forNd3+:Na3Y(VO4)2 one can conclude that the vibronic interaction isstronger for the last one, due to the stronger electron–phononcoupling.
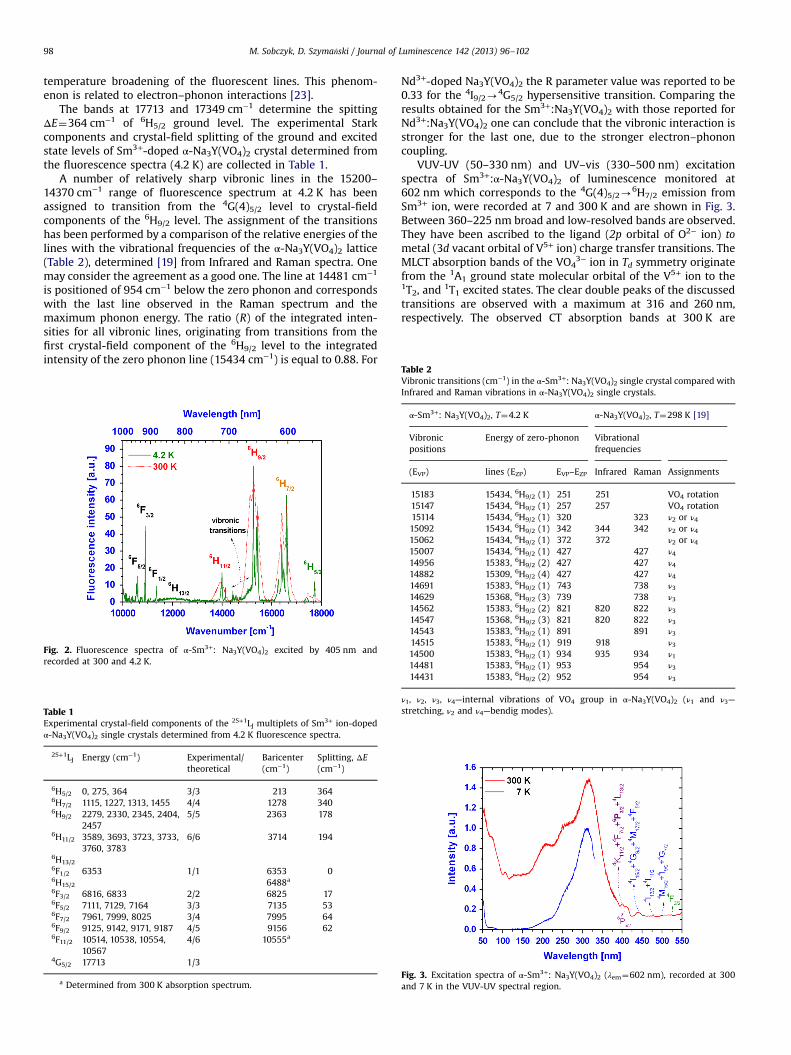
VUV-UV (50–330 nm) and UV–vis (330–500 nm) excitationspectra of Sm3+:α-Na3Y(VO4)2 of luminescence monitored at602 nm which corresponds to the 4G(4)5/2-6H7/2 emission fromSm3+ ion, were recorded at 7 and 300 K and are shown in Fig. 3.Between 360–225 nm broad and low-resolved bands are observed.They have been ascribed to the ligand (2p orbital of O2− ion) tometal (3d vacant orbital of V5+ ion) charge transfer transitions. TheMLCT absorption bands of the VO4
3− ion in Td symmetry originatefrom the 1A1 ground state molecular orbital of the V5+ ion to the1T2, and 1T1 excited states. The clear double peaks of the discussedtransitions are observed with a maximum at 316 and 260 nm,respectively. The observed CT absorption bands at 300 K are
Table 2Vibronic transitions (cm−1) in the α-Sm3+: Na3Y(VO4)2 single crystal compared withInfrared and Raman vibrations in α-Na3Y(VO4)2 single crystals.
α-Sm3+: Na3Y(VO4)2, T¼4.2 K α-Na3Y(VO4)2, T¼298 K [19]
Vibronicpositions
Energy of zero-phonon Vibrationalfrequencies
(EVP) lines (EZP) EVP–EZP Infrared Raman Assignments
15183 15434, 6H9/2 (1) 251 251 VO4 rotation15147 15434, 6H9/2 (1) 257 257 VO4 rotation15114 15434, 6H9/2 (1) 320 323 ν2 or ν415092 15434, 6H9/2 (1) 342 344 342 ν2 or ν415062 15434, 6H9/2 (1) 372 372 ν2 or ν415007 15434, 6H9/2 (1) 427 427 ν414956 15383, 6H9/2 (2) 427 427 ν414882 15309, 6H9/2 (4) 427 427 ν414691 15383, 6H9/2 (1) 743 738 ν314629 15368, 6H9/2 (3) 739 738 ν314562 15383, 6H9/2 (2) 821 820 822 ν314547 15368, 6H9/2 (3) 821 820 822 ν314543 15383, 6H9/2 (1) 891 891 ν314515 15383, 6H9/2 (1) 919 918 ν314500 15383, 6H9/2 (1) 934 935 934 ν114481 15383, 6H9/2 (1) 953 954 ν314431 15383, 6H9/2 (2) 952 954 ν3
ν1, ν2, ν3, ν4—internal vibrations of VO4 group in α-Na3Y(VO4)2 (ν1 and ν3—stretching, ν2 and ν4—bendig modes).
Fig. 3. Excitation spectra of α-Sm3+: Na3Y(VO4)2 (λem¼602 nm), recorded at 300and 7 K in the VUV-UV spectral region.
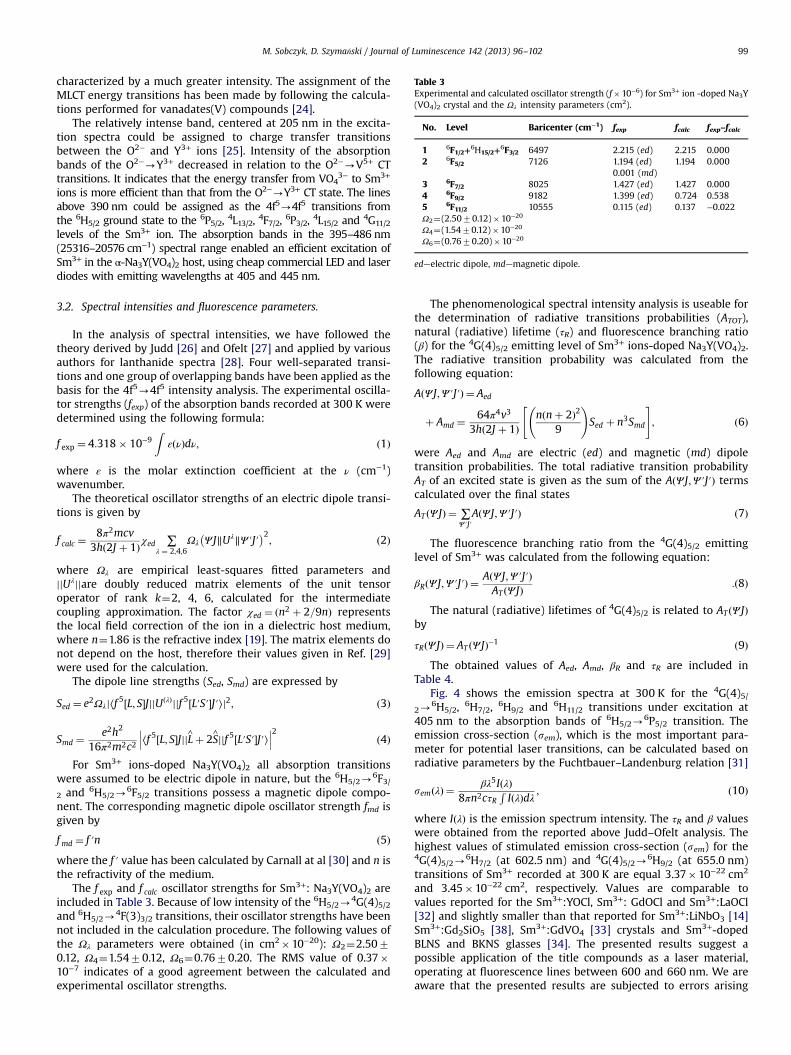
Table 3Experimental and calculated oscillator strength (f�10−6) for Sm3+ ion -doped Na3Y(VO4)2 crystal and the Ωλ intensity parameters (cm2).
No. Level Baricenter (cm−1) fexp fcalc fexp–fcalc
1 6F1/2+6H15/2+6F3/2 6497 2.215 (ed) 2.215 0.000
2 6F5/2 7126 1.194 (ed) 1.194 0.0000.001 (md)
3 6F7/2 8025 1.427 (ed) 1.427 0.0004 6F9/2 9182 1.399 (ed) 0.724 0.5385 6F11/2 10555 0.115 (ed) 0.137 −0.022Ω2¼(2.5070.12)�10−20
Ω4¼(1.5470.12)�10−20
Ω6¼(0.7670.20)�10−20
ed—electric dipole, md—magnetic dipole.
M. Sobczyk, D. Szymański / Journal of Luminescence 142 (2013) 96–102 99
characterized by a much greater intensity. The assignment of theMLCT energy transitions has been made by following the calcula-tions performed for vanadates(V) compounds [24].
The relatively intense band, centered at 205 nm in the excita-tion spectra could be assigned to charge transfer transitionsbetween the O2− and Y3+ ions [25]. Intensity of the absorptionbands of the O2−-Y3+ decreased in relation to the O2−-V5+ CTtransitions. It indicates that the energy transfer from VO4
3− to Sm3+
ions is more efficient than that from the O2−-Y3+ CT state. The linesabove 390 nm could be assigned as the 4f5-4f5 transitions fromthe 6H5/2 ground state to the 6P5/2, 4L13/2, 4F7/2, 6P3/2, 4L15/2 and 4G11/2
levels of the Sm3+ ion. The absorption bands in the 395–486 nm(25316–20576 cm−1) spectral range enabled an efficient excitation ofSm3+ in the α-Na3Y(VO4)2 host, using cheap commercial LED and laserdiodes with emitting wavelengths at 405 and 445 nm.
3.2. Spectral intensities and fluorescence parameters.
In the analysis of spectral intensities, we have followed thetheory derived by Judd [26] and Ofelt [27] and applied by variousauthors for lanthanide spectra [28]. Four well-separated transi-tions and one group of overlapping bands have been applied as thebasis for the 4f5-4f5 intensity analysis. The experimental oscilla-tor strengths (fexp) of the absorption bands recorded at 300 K weredetermined using the following formula:
f exp ¼ 4:318� 10−9Z
εðνÞdν; ð1Þ
where ε is the molar extinction coefficient at the ν (cm−1)wavenumber.
The theoretical oscillator strengths of an electric dipole transi-tions is given by
f calc ¼8π2mcv
3h 2J þ 1ð Þ χed ∑λ ¼ 2;4;6
Ωλ Ψ J‖Uλ‖Ψ ′J′� �2
; ð2Þ
where Ωλ are empirical least-squares fitted parameters andjjUλjjare doubly reduced matrix elements of the unit tensoroperator of rank k¼2, 4, 6, calculated for the intermediatecoupling approximation. The factor χed ¼ ðn2 þ 2=9nÞ representsthe local field correction of the ion in a dielectric host medium,where n¼1.86 is the refractive index [19]. The matrix elements donot depend on the host, therefore their values given in Ref. [29]were used for the calculation.
The dipole line strengths (Sed, Smd) are expressed by
Sed ¼ e2Ωλj⟨f 5½L; S�JjjU λð Þjjf 5½L′S′�J′⟩j2; ð3Þ
Smd ¼e2h2
16π2m2c2
���⟨f 5 L; S½ �JjjL∧þ 2S
∧jjf 5 L′S′½ �J′⟩
���2 ð4Þ
For Sm3+ ions-doped Na3Y(VO4)2 all absorption transitionswere assumed to be electric dipole in nature, but the 6H5/2-
6F3/2 and 6H5/2-
6F5/2 transitions possess a magnetic dipole compo-nent. The corresponding magnetic dipole oscillator strength fmd isgiven by
f md ¼ f ′n ð5Þwhere the f ′ value has been calculated by Carnall at al [30] and n isthe refractivity of the medium.
The f exp and f calc oscillator strengths for Sm3+: Na3Y(VO4)2 areincluded in Table 3. Because of low intensity of the 6H5/2-
4G(4)5/2and 6H5/2-
4F(3)3/2 transitions, their oscillator strengths have beennot included in the calculation procedure. The following values ofthe Ωλ parameters were obtained (in cm2�10−20): Ω2¼2.5070.12, Ω4¼1.5470.12, Ω6¼0.7670.20. The RMS value of 0.37�10−7 indicates of a good agreement between the calculated andexperimental oscillator strengths.
The phenomenological spectral intensity analysis is useable forthe determination of radiative transitions probabilities (ATOT),natural (radiative) lifetime (τR) and fluorescence branching ratio(β) for the 4G(4)5/2 emitting level of Sm3+ ions-doped Na3Y(VO4)2.The radiative transition probability was calculated from thefollowing equation:
A Ψ J;Ψ ′J′ð Þ ¼ Aed
þ Amd ¼64π4v3
3h 2J þ 1ð Þn nþ 2ð Þ2
9
!Sed þ n3Smd
" #; ð6Þ
were Aed and Amd are electric (ed) and magnetic (md) dipoletransition probabilities. The total radiative transition probabilityAT of an excited state is given as the sum of the AðΨ J;Ψ ′J′Þ termscalculated over the final states
AT ðΨ JÞ ¼ ∑Ψ ′J′
AðΨ J;Ψ ′J′Þ ð7Þ
The fluorescence branching ratio from the 4G(4)5/2 emittinglevel of Sm3+ was calculated from the following equation:
βRðΨ J;Ψ ′J′Þ ¼ AðΨ J;Ψ ′J′ÞAT ðΨ JÞ :ð8Þ
The natural (radiative) lifetimes of 4G(4)5/2 is related to AT ðΨ JÞby
τRðΨ JÞ ¼ AT ðΨ JÞ−1 ð9ÞThe obtained values of Aed, Amd, βR and τR are included in
Table 4.Fig. 4 shows the emission spectra at 300 K for the 4G(4)5/
2-6H5/2, 6H7/2, 6H9/2 and 6H11/2 transitions under excitation at
405 nm to the absorption bands of 6H5/2-6P5/2 transition. The
emission cross-section (sem), which is the most important para-meter for potential laser transitions, can be calculated based onradiative parameters by the Fuchtbauer–Landenburg relation [31]
sem λð Þ ¼ βλ5I λð Þ8πn2cτR
RI λð Þdλ ; ð10Þ
where I λð Þ is the emission spectrum intensity. The τR and β valueswere obtained from the reported above Judd–Ofelt analysis. Thehighest values of stimulated emission cross-section (sem) for the4G(4)5/2-6H7/2 (at 602.5 nm) and 4G(4)5/2-6H9/2 (at 655.0 nm)transitions of Sm3+ recorded at 300 K are equal 3.37�10−22 cm2
and 3.45�10−22 cm2, respectively. Values are comparable tovalues reported for the Sm3+:YOCl, Sm3+: GdOCl and Sm3+:LaOCl[32] and slightly smaller than that reported for Sm3+:LiNbO3 [14]Sm3+:Gd2SiO5 [38], Sm3+:GdVO4 [33] crystals and Sm3+-dopedBLNS and BKNS glasses [34]. The presented results suggest apossible application of the title compounds as a laser material,operating at fluorescence lines between 600 and 660 nm. We areaware that the presented results are subjected to errors arising

Table 4Energy transitions (in cm−1), radiative transitions probabilities (Aed, Amd and ATOT),radiative lifetime (τR) and branching ratios (βR) for 4G5/2 emitting level of Sm3+ ion-doped Na3Y(VO4)2 crystal.
4G5/2 - 2S+1LJ Energy transition Aed (s−1) Amd (s−1) βR (%)
0 6H5/2 7.2 25.1 11.031278 6H7/2 66.6 20.08 29.782363 6H9/2 106.8 0.0 36.383714 6H11/2 19.8 0.0 6.755051 6H13/2 2.5 0.0 0.866353 6F1/2 2.7 0.0 0.936488 6H15/2 0.2 0.0 0.056825 6F3/2 2.8 8.7 3.927126 6F5/2 18.1 5.9 8.208025 6F7/2 1.9 1.8 1.269182 6F9/2 2.4 0.0 0.80
10555 6F11/2 0.1 0.0 0.05AT¼293.4 s−1
τR¼3408 μs
Fig. 4. The emission cross-section spectrum of α-Sm3+: Na3Y(VO4)2 (λexc¼405 nm,T¼300 K).
Fig. 5. (a) Decay curves (300 K) of the 4G(4)5/2 level of α-Na3Y(VO4)2 doped with0.01 (inset) and 5.0 at% of Sm3+, (b) Influence of Sm3+ concentration on self-quenching rate of the 4G(4)5/2 level.
M. Sobczyk, D. Szymański / Journal of Luminescence 142 (2013) 96–102100
from a imperfection of the Judd–Ofelt model and require averification by laser experiments.
3.3. Fluorescence decay analysis of 4G(4)5/2 level of Sm3+ ion
Analysis of luminescence decay curves provide information onluminescence processes. The excited state lifetimes of the 4G(4)5/2fluorescent level of the Sm3+ ion have been measured at differentdopant concentrations. Semi-logarithmic plots of 4G(4)5/2 experi-mental decays at 300 K are shown in Fig. 5a. The decay curveswere obtained monitored the 4G(4)5/2-6H9/2 transition underdirect excitation at the fluorescent level. For low Sm3+ concentra-tion (0.01–2.0 at%) the luminescence decays are a single exponen-tial. For higher Sm3+ concentrations the character of the decaycurves are non-exponential. Therefore effective decay time (τm)can be calculated based on Inokuti–Hirayama formula [35]
τm ¼R∞t ¼ 0 tI tð ÞdtR∞t ¼ 0 I tð Þdt
; ð11Þ
where I is the intensity at the beginning of the decay curve andt represents time.
The emission decay times is moderation dependent on con-centration of Sm3+ ions. For example the decay times for 0.01 at%and 5 at% of Sm3+ ions were assessed as 3383 and 1301 μs,respectively. The lifetime of the 4G(4)5/2 level in the investigatedcrystal is much larger than those recorded for Sm3+ dopedvanadates(V) and other oxides. The largest value of decay timefor the 4G(4)5/2 luminescence level equal to 4360 μs was recordedfor 0.01 at% of Sm3+ -doped KZnLa(PO4)2 powder [23]. A
comparison between the lifetime of the 4G(4)5/2 level for Sm3+
doped oxides is presented in Table 5.The measured decay time (τexp) can be expressed as [36]
τ−1exp ¼ τ−1R þWMPR þWET ; ð12Þ
where WMPR and WET are the rates of multi-phonon relaxation andenergy transfer, respectively.
Since the radiative lifetimes τR of the 4G(4)5/2 level of Sm3+
-doped Na3Y(VO4)2 is calculated to be 3408 μs, the fluorescencequantum efficiency, defined as
η¼ τexpτR
� 100% ð13Þ
decreases from 99 to 38% for 0.01 and 5 at% Sm3+ ions,respectively.
The quenching of fluorescence from the 4G(4)5/2 state isattributed to energy transfer from an excited Sm3+ ion to a nearbyunexcited Sm3+ ion, via a cross-relaxation process. The Na3Y(VO4)2crystal possess the highest phonon energy of VO3−
4 ions equal to954 cm−1 [19]. The energy gab about 7100 cm−1 between the 4G(4)5/2 emitting level and the next lower-laying 6F11/2 level of Sm3+
-doped Na3Y(VO4)2, corresponds roughly to seven highest energyphonons of the VO4
3− ions, available in the Na3Y(VO4)2 host lattice.Therefore, in the case of Sm3+ the multi-phonon relaxation (WMPR) isnegligible. The luminescence level may by depopulated mainly viathe following cross-relaxation mechanisms:
(1)
Resonant cross-relaxation:4G(4)5/2-6F11/2 (7158 cm−1)¼6H5/2-6F5/2 (7126)+32 cm−1
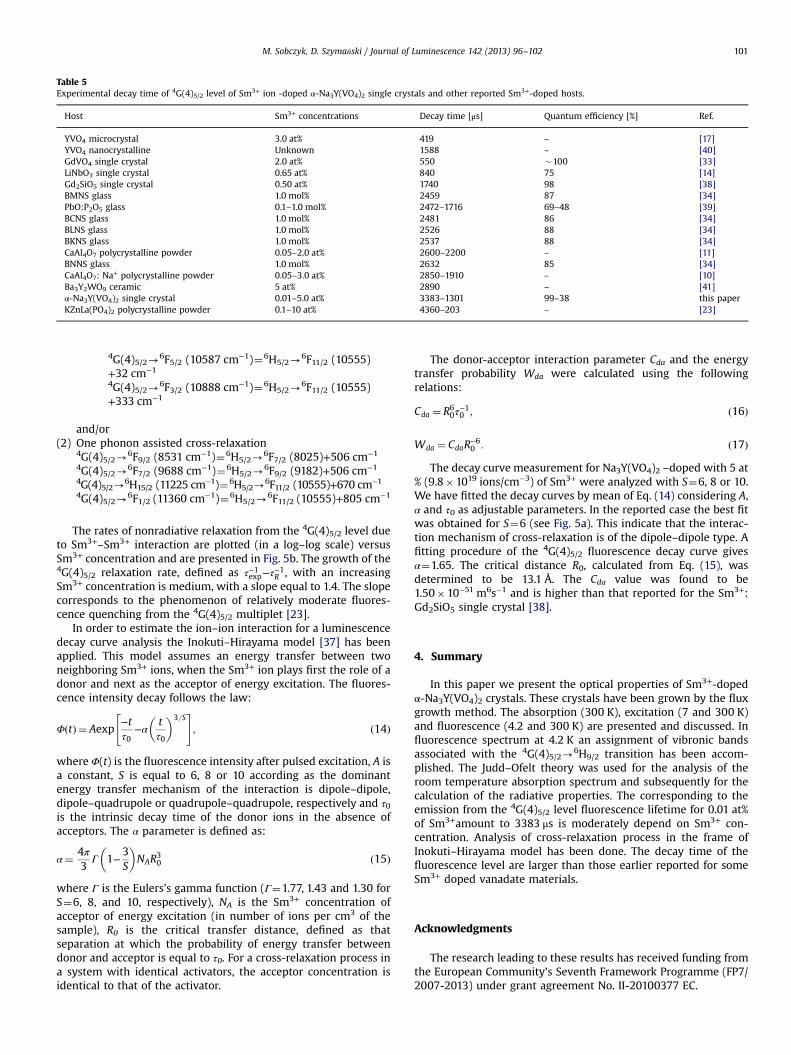
Table 5Experimental decay time of 4G(4)5/2 level of Sm3+ ion -doped α-Na3Y(VO4)2 single crystals and other reported Sm3+-doped hosts.
Host Sm3+ concentrations Decay time [μs] Quantum efficiency [%] Ref.
YVO4 microcrystal 3.0 at% 419 – [17]YVO4 nanocrystalline Unknown 1588 – [40]GdVO4 single crystal 2.0 at% 550 �100 [33]LiNbO3 single crystal 0.65 at% 840 75 [14]Gd2SiO5 single crystal 0.50 at% 1740 98 [38]BMNS glass 1.0 mol% 2459 87 [34]PbO:P2O5 glass 0.1–1.0 mol% 2472–1716 69–48 [39]BCNS glass 1.0 mol% 2481 86 [34]BLNS glass 1.0 mol% 2526 88 [34]BKNS glass 1.0 mol% 2537 88 [34]CaAl4O7 polycrystalline powder 0.05–2.0 at% 2600–2200 – [11]BNNS glass 1.0 mol% 2632 85 [34]CaAl4O7: Na+ polycrystalline powder 0.05–3.0 at% 2850–1910 – [10]Ba3Y2WO9 ceramic 5 at% 2890 – [41]α-Na3Y(VO4)2 single crystal 0.01–5.0 at% 3383–1301 99–38 this paperKZnLa(PO4)2 polycrystalline powder 0.1–10 at% 4360–203 – [23]
M. Sobczyk, D. Szymański / Journal of Luminescence 142 (2013) 96–102 101
4G(4)5/2-6F5/2 (10587 cm−1)¼6H5/2-6F11/2 (10555)
+32 cm−1
4G(4)5/2-6F3/2 (10888 cm−1)¼6H5/2-6F11/2 (10555)
+333 cm−1
and/or
(2) One phonon assisted cross-relaxation4G(4)5/2-6F9/2 (8531 cm−1)¼6H5/2-6F7/2 (8025)+506 cm−1
4G(4)5/2-6F7/2 (9688 cm−1)¼6H5/2-6F9/2 (9182)+506 cm−1
4G(4)5/2-6H15/2 (11225 cm−1)¼6H5/2-6F11/2 (10555)+670 cm−1
4G(4)5/2-6F1/2 (11360 cm−1)¼6H5/2-6F11/2 (10555)+805 cm−1
The rates of nonradiative relaxation from the 4G(4)5/2 level dueto Sm3+–Sm3+ interaction are plotted (in a log–log scale) versusSm3+ concentration and are presented in Fig. 5b. The growth of the4G(4)5/2 relaxation rate, defined as τ−1exp−τ−1R , with an increasingSm3+ concentration is medium, with a slope equal to 1.4. The slopecorresponds to the phenomenon of relatively moderate fluores-cence quenching from the 4G(4)5/2 multiplet [23].
In order to estimate the ion–ion interaction for a luminescencedecay curve analysis the Inokuti–Hirayama model [37] has beenapplied. This model assumes an energy transfer between twoneighboring Sm3+ ions, when the Sm3+ ion plays first the role of adonor and next as the acceptor of energy excitation. The fluores-cence intensity decay follows the law:
Φ tð Þ ¼ Aexp−tτ0
−αtτ0
� �3=S" #
; ð14Þ
where Φ(t) is the fluorescence intensity after pulsed excitation, A isa constant, S is equal to 6, 8 or 10 according as the dominantenergy transfer mechanism of the interaction is dipole–dipole,dipole–quadrupole or quadrupole–quadrupole, respectively and τ0is the intrinsic decay time of the donor ions in the absence ofacceptors. The α parameter is defined as:
α¼ 4π3
Γ 1−3S
� �NAR
30 ð15Þ
where Γ is the Eulers’s gamma function (Γ¼1.77, 1.43 and 1.30 forS¼6, 8, and 10, respectively), NA is the Sm3+ concentration ofacceptor of energy excitation (in number of ions per cm3 of thesample), R0 is the critical transfer distance, defined as thatseparation at which the probability of energy transfer betweendonor and acceptor is equal to τ0. For a cross-relaxation process ina system with identical activators, the acceptor concentration isidentical to that of the activator.
The donor-acceptor interaction parameter Cda and the energytransfer probability Wda were calculated using the followingrelations:
Cda ¼ R60τ
−10 ; ð16Þ
Wda ¼ CdaR−60 : ð17Þ
The decay curve measurement for Na3Y(VO4)2 –doped with 5 at% (9.8�1019 ions/cm−3) of Sm3+ were analyzed with S¼6, 8 or 10.We have fitted the decay curves by mean of Eq. (14) considering A,α and τ0 as adjustable parameters. In the reported case the best fitwas obtained for S¼6 (see Fig. 5a). This indicate that the interac-tion mechanism of cross-relaxation is of the dipole–dipole type. Afitting procedure of the 4G(4)5/2 fluorescence decay curve givesα¼1.65. The critical distance R0, calculated from Eq. (15), wasdetermined to be 13.1 Å. The Cda value was found to be1.50�10−51 m6s−1 and is higher than that reported for the Sm3+:Gd2SiO5 single crystal [38].
4. Summary
In this paper we present the optical properties of Sm3+-dopedα-Na3Y(VO4)2 crystals. These crystals have been grown by the fluxgrowth method. The absorption (300 K), excitation (7 and 300 K)and fluorescence (4.2 and 300 K) are presented and discussed. Influorescence spectrum at 4.2 K an assignment of vibronic bandsassociated with the 4G(4)5/2-6H9/2 transition has been accom-plished. The Judd–Ofelt theory was used for the analysis of theroom temperature absorption spectrum and subsequently for thecalculation of the radiative properties. The corresponding to theemission from the 4G(4)5/2 level fluorescence lifetime for 0.01 at%of Sm3+amount to 3383 μs is moderately depend on Sm3+ con-centration. Analysis of cross-relaxation process in the frame ofInokuti–Hirayama model has been done. The decay time of thefluorescence level are larger than those earlier reported for someSm3+ doped vanadate materials.
Acknowledgments
The research leading to these results has received funding fromthe European Community’s Seventh Framework Programme (FP7/2007-2013) under grant agreement No. II-20100377 EC.

M. Sobczyk, D. Szymański / Journal of Luminescence 142 (2013) 96–102102
References
[1] G. Blasse, in: K.A. Gschneidner Jr., L. Eyring (Eds.), Handbook on the Physicsand Chemistry of Rare Earths, 4, North-Holland, Amsterdam, 1979, p. 237.
[2] A. Bril, W.L. Wanmaker, Philos. Tech. Rev. 27 (1966) 22.[3] M. Yu, J. Lin, Z. Wang, J. Fu, S. Wang, H. Zhang, Y. Han, Chem. Mater. 14 (2002)
2224.[4] G. Panayiotakis, D. Cavouras, I. Kandarakis, C. Nomicos, Appl. Phys. A 62 (1996)
483.[5] J.P. Budin, M. Neubauer, M. Rondot, IEEE J. Quantum Electron. 14 (1978) 831.[6] J.E. Bernard, A.J. Alcock, Opt. Lett. 18 (1993) 968.[7] M. Sobczyk, Mater. Lett. 88 (2012) 86.[8] M. Sobczyk, J. Lumin. 129 (2009) 430.[9] M. Sobczyk, R. Lisiecki, P. Solarz, W. Ryba-Romanowski, J. Lumin. 130 (2010)
567.[10] M. Yu, J. Lin, Z. Wang, J. Fu, S. Wang, H.J. Zhang, Y.C. Han, Chem. Mater.
14 (2002) 2224.[11] M. Puchalska, E. Zych, J. Lumin. 132 (2012) 826.[12] P. Solarz, G. Dominiak-Dzik, W. Ryba-Romanowski, J. Alloys Compd.
362 (2004) 61.[13] C.-J. Duan, W.-F. Li, X.-Y. Wu, H.-H. Chen, X.X. Yang, J.-T. Zhao, Y.-B. Fu, Z.-M. Qi,
G.-B. Zhang, Z.-S. Shi, Mater. Sci. Eng. B 121 (2005) 272.[14] G. Dominiak-Dzik, J. Alloys Compd. 391 (2005) 26.[15] M. Kaczkan, Z. Fukacz, M. Malinowski, J. Alloys Compd.323–324 (2001) 736.[16] X. Wang, X. Yan, C. Kan, J. Lumin. 131 (2011) 2325.[17] G. Jia, Y. Song, M. Yang, Y. Huang, L. Zhang, H. You, Opt. Mater. 31 (2009) 1032.[18] Q. Su, Z. Pei, J. Lin, F. Xue, J. Alloys Compd. 225 (1995) 103.[19] M. Sobczyk, Opt. Mater. 35 (2013) 852.[20] inde x_eng.html 31 (2011) 12, accessed.
[21] R. Salmon, C. Parent, G. Le Flem, M. Vlasse, Acta Cryst. B (1976) 2799.[22] X.-Q. Su, B. Yan, J. Non-Cryst. Solids 351 (2005) 3542.[23] P. Solarz, M. Sobczyk, Opt. Mater. 34 (2012) 1826.[24] T. Nakajima, M. Isobe, T. Tsuchiya, Y. Ueda, T. Manabe, J. Phys. Chem. C
114 (2010) 5160.[25] Y.H. Wang, Y.Y. Zuo., Mater. Res. Bull. 41 (2006) 2147.[26] B.R. Judd, Phys. Rev. 127 (1962) 750.[27] G.S. Ofelt, J. Chem. Phys. 37 (1962) 511.[28] R.D. Peacock, Struct. Bond. 22 (1975) 83.[29] C.K. Jayasankar, P. Babu, J. Alloys Compd. 307 (2000) 82.[30] W.T. Carnall, P.R. Fields, K. Rajnak, J. Chem. Phys. 49 (1968) 4413.[31] B.F. Aull, H.P. Jenssen, IEEE J. Quantum Electron. 18 (1982) 925.[32] U. Rambubu, K. Rajamohan Reddy, K. Annapurna, T. Balaji, J.V. Satyanarayana,
S. Buddhudu, Mater. Lett. 27 (1996) 59.[33] X. He, L. Zhang, G. Chen, Y. Hang, J. Alloys Compd. 467 (2009) 366.[34] I. Arul Rayappan, K. Selvaraju, K. Marimuthu, Physica B 406 (2011) 548.[35] M. Inokuti, F. Hirayama, J. Chem. Phys. 43 (1965) 1978.[36] C. Gorller-Walrand, K. Binnemans, in: K.A. GschneidnerJr., L. Eyring (Eds.),
Handbook on the Physics and Chemistry of Rare Earths, 25, North-Holland,Amsterdam, 1998, Chapter 167.
[37] M. Inokuti, F. Hirayama, J. Chem. Phys. 43 (1965) 1978.[38] A. Strzęp, R. Lisiecki, P. Solarz, G. Dominiak-Dzik, W. Ryba-Romanowski,
M. Berkowski, Appl. Phys. B 106 (2012) 85.[39] M. Sobczyk, P. Starynowicz, R. Lisiecki, W. Ryba-Rymanowski, Opt. Mater.
30 (2008) 1571.[40] M. Yu, J. Lin, Z. Wang, J. Fu, S. Wang, H.J. Zhang, Y.C. Han, Chem. Mater.
14 (2002) 2224.[41] K. Vemasevana Raju, C. Nageswara Raju, S. Sailaja, S.J. Dhoble, B.
Sudhakar Reddy, J. Lumin. 134 (2013) 297.