![arXiv:0804.1355v1 [math.GT] 8 Apr 2008arXiv:0804.1355v1 [math.GT] 8 Apr 2008 METABELIAN REPRESENTATIONS, TWISTED ALEXANDER POLYNOMIALS, KNOT SLICING, AND MUTATION CHRIS HERALD, PAUL](https://static.fdocument.org/doc/165x107/5f8d8100ff950450d4784569/arxiv08041355v1-mathgt-8-apr-2008-arxiv08041355v1-mathgt-8-apr-2008-metabelian.jpg)
A helically twisted imine macrocycle that allows for ...A helically twisted imine macrocycle that...
15
S1 Supporting Information A helically twisted imine macrocycle that allows for determining the absolute configurations of α-amino carboxylates Min Jun Kim, Ye Rin Choi, Hae-Geun Jeon, Philjae Kang, Moon-Gun Choi, and Kyu-Sung Jeong* Department of Chemistry, Yonsei University, Seoul 120-749, Korea Fax: (+) 82-2-364-7050 Tel:( +) 82-2-2123-2643 E-mail: [email protected] Contents 1. Syntheses and spectroscopic properties of new compounds 2. 1D- and 2D- 1 H NMR spectra 3. Circular dichroism (CD) experiments 3.1 Time-dependent CD spectra for the formation of imine macrocycle 3a 3.2 Time-dependent CD spectra for the formation of imine macrocycle 3b 3.3 CD spectra and CD values of macrocycle 3b in the presence of anionic amino acids with different N-protective groups (Boc, Cbz, and Ac) 4. Computer modeling studies 5. X-ray crystallographic analysis Electronic Supplementary Material (ESI) for Chemical Communications This journal is © The Royal Society of Chemistry 2013
Transcript of A helically twisted imine macrocycle that allows for ...A helically twisted imine macrocycle that...
S1
Supporting Information
A helically twisted imine macrocycle that allows for determining the absolute configurations of α-amino carboxylates
Min Jun Kim, Ye Rin Choi, Hae-Geun Jeon, Philjae Kang, Moon-Gun Choi, and Kyu-Sung
Jeong*
Department of Chemistry, Yonsei University, Seoul 120-749, Korea
Fax: (+) 82-2-364-7050
Tel:( +) 82-2-2123-2643
E-mail: [email protected]
Contents
1. Syntheses and spectroscopic properties of new compounds
2. 1D- and 2D-1H NMR spectra
3. Circular dichroism (CD) experiments
3.1 Time-dependent CD spectra for the formation of imine macrocycle 3a
3.2 Time-dependent CD spectra for the formation of imine macrocycle 3b
3.3 CD spectra and CD values of macrocycle 3b in the presence of anionic amino
acids with different N-protective groups (Boc, Cbz, and Ac)
4. Computer modeling studies
5. X-ray crystallographic analysis
Electronic Supplementary Material (ESI) for Chemical CommunicationsThis journal is © The Royal Society of Chemistry 2013
S2
1. Syntheses and spectroscopic properties of new compounds
General: All chemicals were purchased from commercial suppliers and used without further
purification unless otherwise specified. Triethylamine (Et3N) and tetrahydrofuran (THF)
were purchased as anhydrous grade. Dichloromethane (CH2Cl2) was purified by drying over
calcium hydride (CaH2), followed by distillation. The chemical shifts of 1H NMR and 13C
NMR spectra were reported using the solvent signal as an internal reference, DMSO-d6 (2.50
ppm for 1H NMR, 39.5 ppm for 13C NMR) and dichloromethane-d2 (5.32 ppm for 1H NMR).
Column chromatography was performed using 230-400 mesh ultra pure silica. 1H NMR
and 13C NMR spectra were obtained on Bruker (Avance ІІ) 400 MHz spectrometer. FT-IR
spectra were observed on Bruker (Vertex70). MALDI-TOF mass spectrometric
measurements were performed on a Bruker (LRF20). Circular dichroism (CD) spectra were
conducted on a JASCO (J-815). Melting points were determined with a Barnsted
Electrochemical (IA9100). The elemental analysis data were obtained from Center for
research facilities at Yonsei University.
Br
OO
OO
S1
O H O H
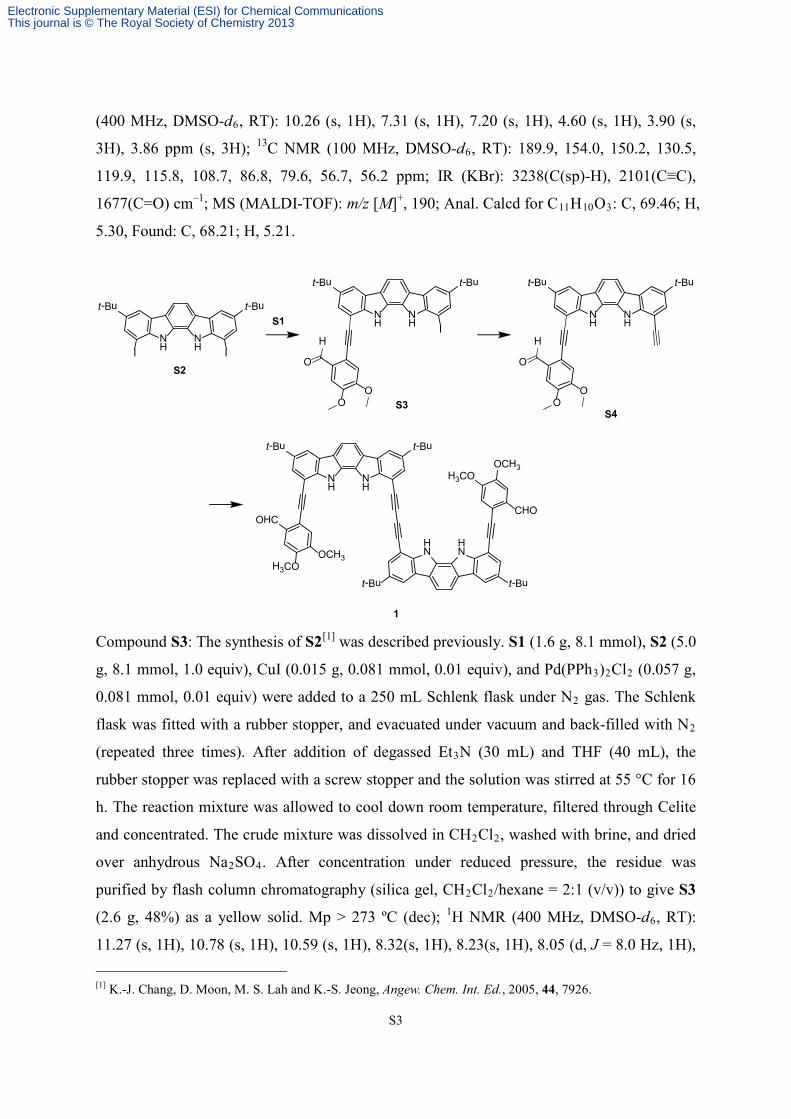
Compound S1: 2-Bromo-4,5-dimethoxy-benzaldehyde (2.3 g, 9.4 mmol), CuI (0.018 g, 0.094
mmol, 0.01 equiv), and Pd(PPh3)2Cl2 (0.066 g, 0.094 mmol, 0.01 equiv) were added to a 100
mL Schlenk flask under N2 gas. The flask was fitted with a rubber stopper, and then
evacuated under vacuum and back-filled with N2 (repeated three times). After addition of
degassed Et3N (40 mL), THF (40 mL), and trimethylsilylethyne (2.7 mL, 19 mmol), the
solution was stirred at 85 °C during 12 h. The reaction mixture was allowed to cool down to
room temperature, filtered through Celite and concentrated. The residue was dissolved in
CH2Cl2, washed with distilled water. After concentration, the crude mixture was dissolved in
CH2Cl2/MeOH = 2:1 (v/v) to which solution K2CO3 (0.13 g, 0.94 mmol, 0.1 equiv) was
added. After stirred for 1 h, the mixture was washed with water and brine, and dried over
anhydrous Na2SO4. The solution was concentrated under reduced pressure. The crude
mixture was purified by flash column chromatography (silica gel, CH2Cl2/hexane = 2:1 (v/v))
to give S1 (1.78 g, 98% for two steps) as a light yellow solid. Mp = 156-157 ºC; 1H NMR
Electronic Supplementary Material (ESI) for Chemical CommunicationsThis journal is © The Royal Society of Chemistry 2013
S3
(400 MHz, DMSO-d6, RT): 10.26 (s, 1H), 7.31 (s, 1H), 7.20 (s, 1H), 4.60 (s, 1H), 3.90 (s,
3H), 3.86 ppm (s, 3H); 13C NMR (100 MHz, DMSO-d6, RT): 189.9, 154.0, 150.2, 130.5,
119.9, 115.8, 108.7, 86.8, 79.6, 56.7, 56.2 ppm; IR (KBr): 3238(C(sp)-H), 2101(C≡C),
1677(C=O) cm–1; MS (MALDI-TOF): m/z [M]+, 190; Anal. Calcd for C11H10O3: C, 69.46; H,
5.30, Found: C, 68.21; H, 5.21.
NH
NHI I
t-Bu t-BuNH
NH I
t-Bu t-Bu
NH
NH
t-Bu t-Bu
OHC
OCH3H3CO
HN
HN
t-But-Bu
CHO
H3COOCH3
1
OO
O
H
S2
S3S4
NH
NH
t-Bu t-Bu
OO
O
H
S1
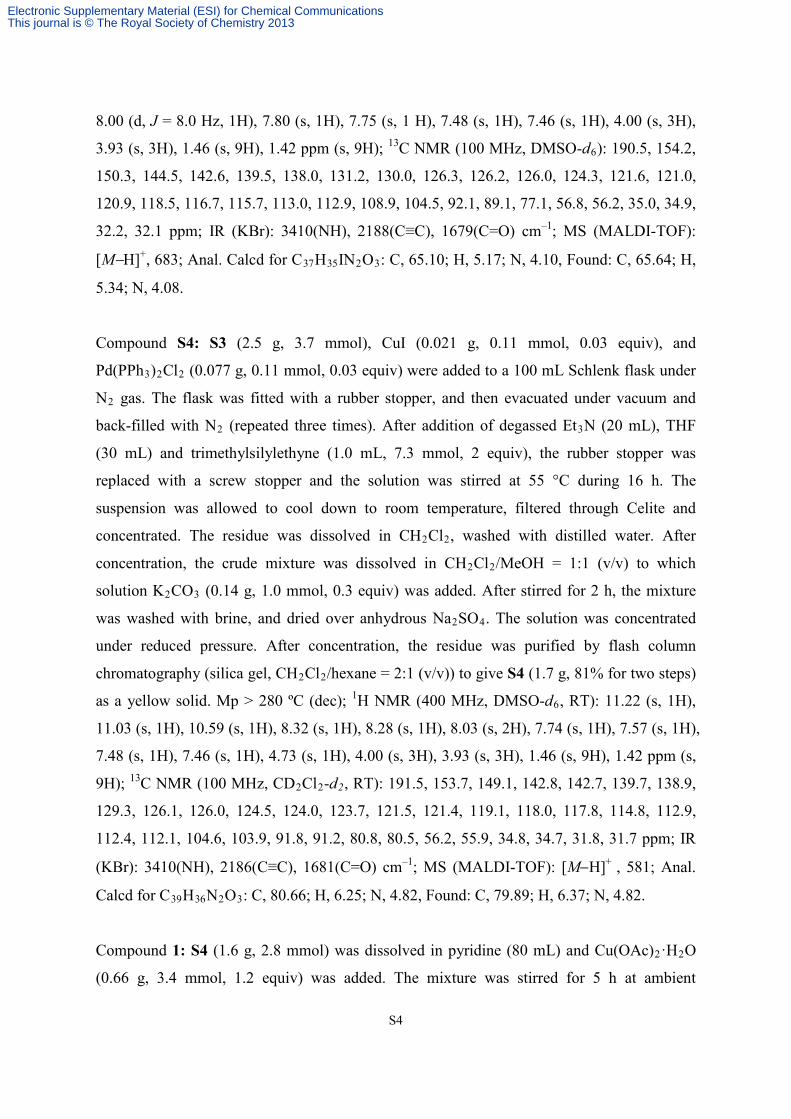
Compound S3: The synthesis of S2[1] was described previously. S1 (1.6 g, 8.1 mmol), S2 (5.0
g, 8.1 mmol, 1.0 equiv), CuI (0.015 g, 0.081 mmol, 0.01 equiv), and Pd(PPh3)2Cl2 (0.057 g,
0.081 mmol, 0.01 equiv) were added to a 250 mL Schlenk flask under N2 gas. The Schlenk
flask was fitted with a rubber stopper, and evacuated under vacuum and back-filled with N2
(repeated three times). After addition of degassed Et3N (30 mL) and THF (40 mL), the
rubber stopper was replaced with a screw stopper and the solution was stirred at 55 °C for 16
h. The reaction mixture was allowed to cool down room temperature, filtered through Celite
and concentrated. The crude mixture was dissolved in CH2Cl2, washed with brine, and dried
over anhydrous Na2SO4. After concentration under reduced pressure, the residue was
purified by flash column chromatography (silica gel, CH2Cl2/hexane = 2:1 (v/v)) to give S3
(2.6 g, 48%) as a yellow solid. Mp > 273 ºC (dec); 1H NMR (400 MHz, DMSO-d6, RT):
11.27 (s, 1H), 10.78 (s, 1H), 10.59 (s, 1H), 8.32(s, 1H), 8.23(s, 1H), 8.05 (d, J = 8.0 Hz, 1H), [1] K.-J. Chang, D. Moon, M. S. Lah and K.-S. Jeong, Angew. Chem. Int. Ed., 2005, 44, 7926.
Electronic Supplementary Material (ESI) for Chemical CommunicationsThis journal is © The Royal Society of Chemistry 2013
S4
8.00 (d, J = 8.0 Hz, 1H), 7.80 (s, 1H), 7.75 (s, 1 H), 7.48 (s, 1H), 7.46 (s, 1H), 4.00 (s, 3H),
3.93 (s, 3H), 1.46 (s, 9H), 1.42 ppm (s, 9H); 13C NMR (100 MHz, DMSO-d6): 190.5, 154.2,
150.3, 144.5, 142.6, 139.5, 138.0, 131.2, 130.0, 126.3, 126.2, 126.0, 124.3, 121.6, 121.0,
120.9, 118.5, 116.7, 115.7, 113.0, 112.9, 108.9, 104.5, 92.1, 89.1, 77.1, 56.8, 56.2, 35.0, 34.9,
32.2, 32.1 ppm; IR (KBr): 3410(NH), 2188(C≡C), 1679(C=O) cm–1; MS (MALDI-TOF):
[M−H]+, 683; Anal. Calcd for C37H35IN2O3: C, 65.10; H, 5.17; N, 4.10, Found: C, 65.64; H,
5.34; N, 4.08.
Compound S4: S3 (2.5 g, 3.7 mmol), CuI (0.021 g, 0.11 mmol, 0.03 equiv), and
Pd(PPh3)2Cl2 (0.077 g, 0.11 mmol, 0.03 equiv) were added to a 100 mL Schlenk flask under
N2 gas. The flask was fitted with a rubber stopper, and then evacuated under vacuum and
back-filled with N2 (repeated three times). After addition of degassed Et3N (20 mL), THF
(30 mL) and trimethylsilylethyne (1.0 mL, 7.3 mmol, 2 equiv), the rubber stopper was
replaced with a screw stopper and the solution was stirred at 55 °C during 16 h. The
suspension was allowed to cool down to room temperature, filtered through Celite and
concentrated. The residue was dissolved in CH2Cl2, washed with distilled water. After
concentration, the crude mixture was dissolved in CH2Cl2/MeOH = 1:1 (v/v) to which
solution K2CO3 (0.14 g, 1.0 mmol, 0.3 equiv) was added. After stirred for 2 h, the mixture
was washed with brine, and dried over anhydrous Na2SO4. The solution was concentrated
under reduced pressure. After concentration, the residue was purified by flash column
chromatography (silica gel, CH2Cl2/hexane = 2:1 (v/v)) to give S4 (1.7 g, 81% for two steps)
as a yellow solid. Mp > 280 ºC (dec); 1H NMR (400 MHz, DMSO-d6, RT): 11.22 (s, 1H),
11.03 (s, 1H), 10.59 (s, 1H), 8.32 (s, 1H), 8.28 (s, 1H), 8.03 (s, 2H), 7.74 (s, 1H), 7.57 (s, 1H),
7.48 (s, 1H), 7.46 (s, 1H), 4.73 (s, 1H), 4.00 (s, 3H), 3.93 (s, 3H), 1.46 (s, 9H), 1.42 ppm (s,
9H); 13C NMR (100 MHz, CD2Cl2-d2, RT): 191.5, 153.7, 149.1, 142.8, 142.7, 139.7, 138.9,
129.3, 126.1, 126.0, 124.5, 124.0, 123.7, 121.5, 121.4, 119.1, 118.0, 117.8, 114.8, 112.9,
112.4, 112.1, 104.6, 103.9, 91.8, 91.2, 80.8, 80.5, 56.2, 55.9, 34.8, 34.7, 31.8, 31.7 ppm; IR
(KBr): 3410(NH), 2186(C≡C), 1681(C=O) cm–1; MS (MALDI-TOF): [M−H]+ , 581; Anal.
Calcd for C39H36N2O3: C, 80.66; H, 6.25; N, 4.82, Found: C, 79.89; H, 6.37; N, 4.82.
Compound 1: S4 (1.6 g, 2.8 mmol) was dissolved in pyridine (80 mL) and Cu(OAc)2·H2O
(0.66 g, 3.4 mmol, 1.2 equiv) was added. The mixture was stirred for 5 h at ambient
Electronic Supplementary Material (ESI) for Chemical CommunicationsThis journal is © The Royal Society of Chemistry 2013
S5
temperature. The mixture was filtered through Celite and concentrated. The residue was taken
up in CH2Cl2, washed with saturated NaHCO3 solution and brine, and dried over anhydrous
Na2SO4. After concentration, the residue was purified by flash column chromatography
(silica gel, DCM/Hexane = 2:1 (v/v)) to give 1(0.96 g, 60%) as a yellow solid. Mp > 297 ºC
(dec); 1H NMR (400 MHz, DMSO-d6, RT): 11.40 (s, 2H; NH), 11.20 (s, 2H; NH), 10.53 (s,
2H), 8.42 (s, 2H), 8.33 (s, 2H), 8.09 (s, 4H), 7.73 (s, 4H), 7.40 (s, 2H), 7.25 (s, 2H), 3.85 (s,
6H), 3.70 (s, 6H), 1.47 ppm (s, 36H); 13C NMR (100 MHz, CD2Cl2-d2, RT): 191.7, 152.7,
147.8, 143.1, 142.2, 140.1, 140.0, 128.2, 126.0, 125.7, 125.6, 124.4, 122.7, 122.6, 121.4,
121.0, 118.5, 117.6, 116.6, 116.1, 114.8, 113.1, 111.5, 105.1, 103.7, 95.1, 91.2, 79,5, 77.9,
55.7, 54.4, 34.8, 34.7, 31.9, 31.7 ppm; IR (KBr): 3404(NH), 2193(C≡C), 1672(C=O) cm–1;
MS (ESI) [M-H]+, 1159.4; Anal. Calcd for C78H70N4O6·2H2O: C, 78.36; H, 6.24; N, 4.69,
Found: C, 78.15; H, 6.34; N, 4.75.
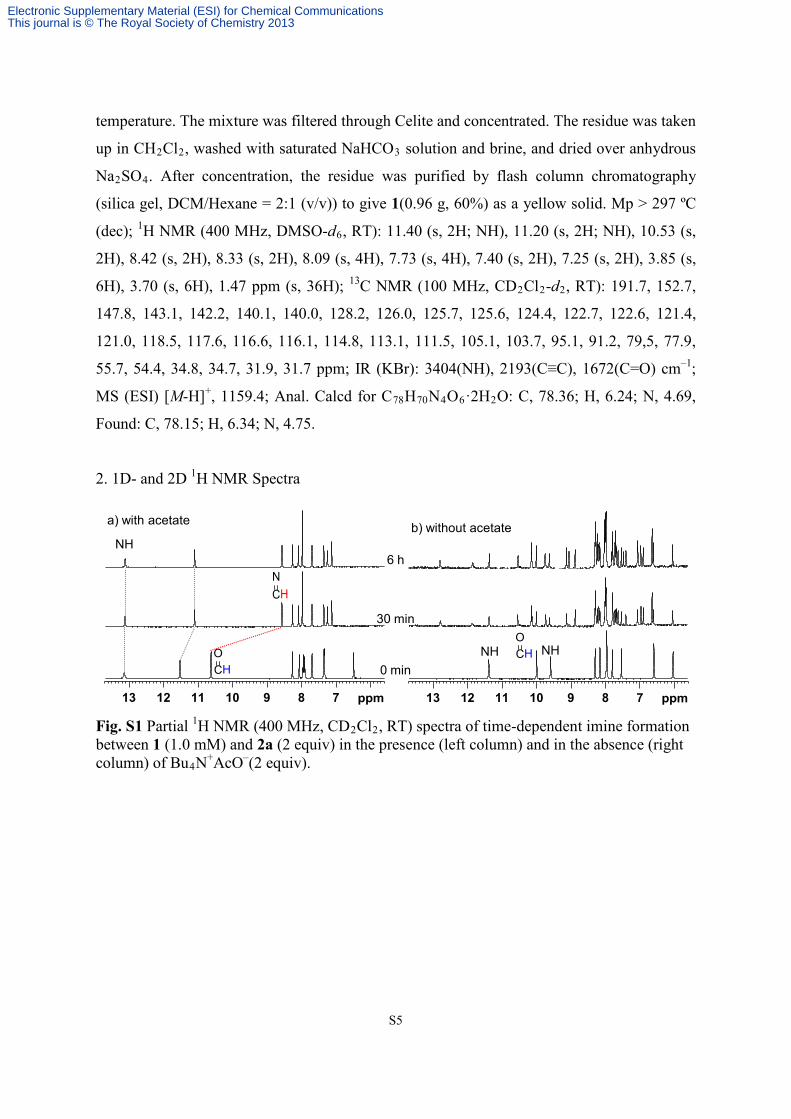
2. 1D- and 2D 1H NMR Spectra
Fig. S1 Partial 1H NMR (400 MHz, CD2Cl2, RT) spectra of time-dependent imine formation between 1 (1.0 mM) and 2a (2 equiv) in the presence (left column) and in the absence (right column) of Bu4N+AcO–(2 equiv).
78910111213 ppm 78910111213 ppm
b) without acetatea) with acetate
CHO
NH NHCHO
CHN
0 min
30 min
6 hNH
Electronic Supplementary Material (ESI) for Chemical CommunicationsThis journal is © The Royal Society of Chemistry 2013
S6
NH
NH
t-Bu t-Bu
OCH3H3CO
HN
HN
t-But-Bu
H3COOCH3
H
O
O
H
4
56 7
8
9
1
2
3
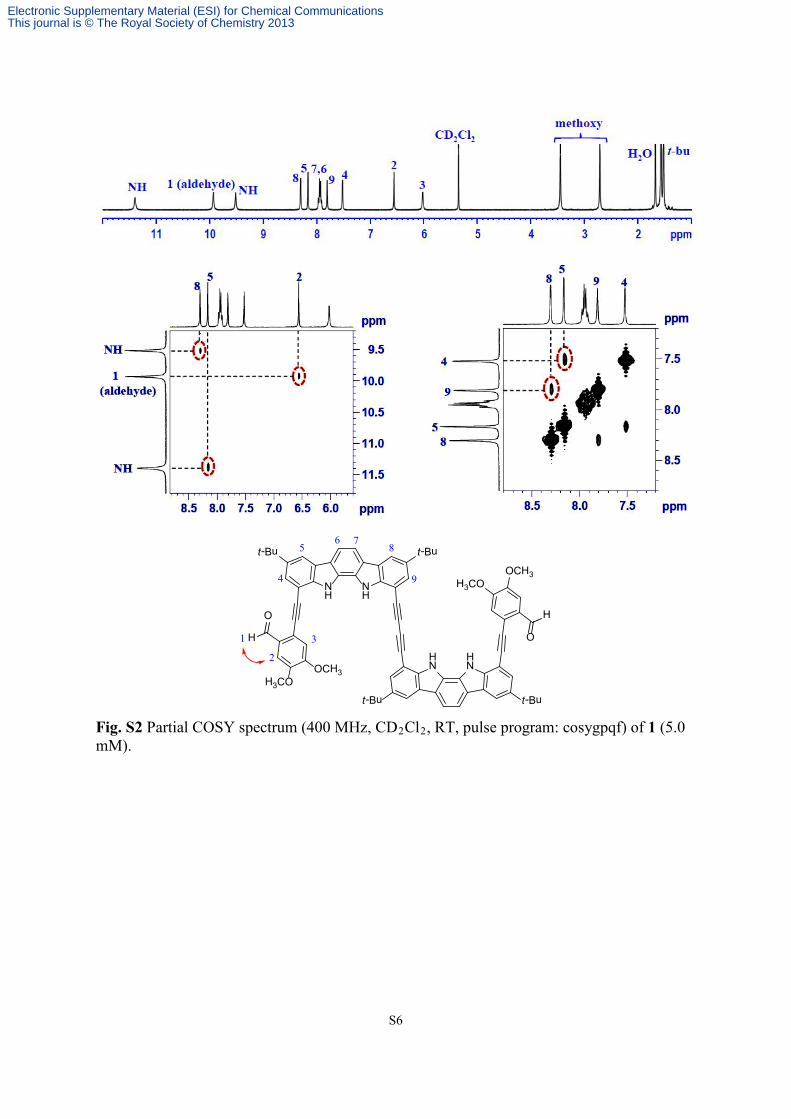
Fig. S2 Partial COSY spectrum (400 MHz, CD2Cl2, RT, pulse program: cosygpqf) of 1 (5.0 mM).
Electronic Supplementary Material (ESI) for Chemical CommunicationsThis journal is © The Royal Society of Chemistry 2013
S7
H3COOCH3
N
t-Bu
N
t-Bu
O
HH
NN
t-Bu
t-Bu
O
H H
AcO-
H3COOCH3
AcO-
H
HNH
NH
t-Bu t-Bu
OCH3H3CO
HN
HN
t-But-Bu
H3COOCH3
H
O
O
H
4
56 7
8
9
1
2
3
Me1
Me24
5
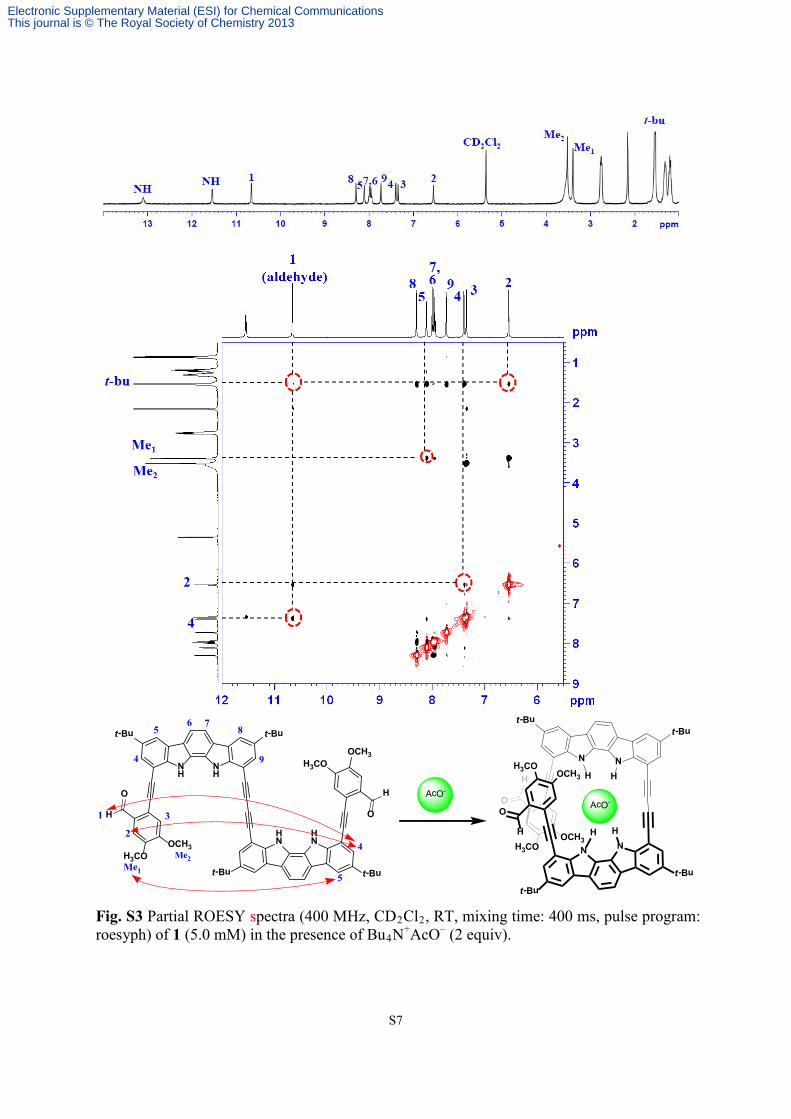
Fig. S3 Partial ROESY spectra (400 MHz, CD2Cl2, RT, mixing time: 400 ms, pulse program: roesyph) of 1 (5.0 mM) in the presence of Bu4N+AcO– (2 equiv).
Electronic Supplementary Material (ESI) for Chemical CommunicationsThis journal is © The Royal Society of Chemistry 2013
S8
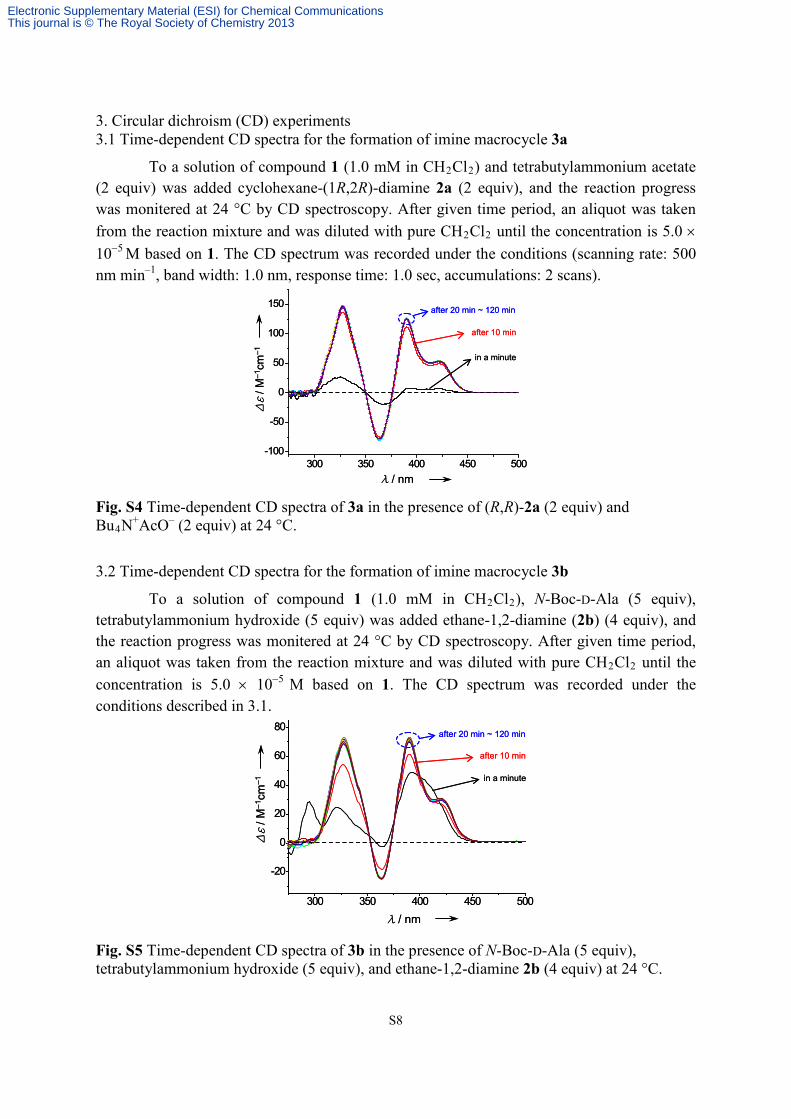
3. Circular dichroism (CD) experiments 3.1 Time-dependent CD spectra for the formation of imine macrocycle 3a
To a solution of compound 1 (1.0 mM in CH2Cl2) and tetrabutylammonium acetate (2 equiv) was added cyclohexane-(1R,2R)-diamine 2a (2 equiv), and the reaction progress was monitered at 24 °C by CD spectroscopy. After given time period, an aliquot was taken from the reaction mixture and was diluted with pure CH2Cl2 until the concentration is 5.0 × 10⁻⁵ M based on 1. The CD spectrum was recorded under the conditions (scanning rate: 500 nm min–1, band width: 1.0 nm, response time: 1.0 sec, accumulations: 2 scans).
Fig. S4 Time-dependent CD spectra of 3a in the presence of (R,R)-2a (2 equiv) and Bu4N+AcO– (2 equiv) at 24 °C.
3.2 Time-dependent CD spectra for the formation of imine macrocycle 3b
To a solution of compound 1 (1.0 mM in CH2Cl2), N-Boc-D-Ala (5 equiv), tetrabutylammonium hydroxide (5 equiv) was added ethane-1,2-diamine (2b) (4 equiv), and the reaction progress was monitered at 24 °C by CD spectroscopy. After given time period, an aliquot was taken from the reaction mixture and was diluted with pure CH2Cl2 until the concentration is 5.0 × 10⁻⁵ M based on 1. The CD spectrum was recorded under the conditions described in 3.1.
Fig. S5 Time-dependent CD spectra of 3b in the presence of N-Boc-D-Ala (5 equiv), tetrabutylammonium hydroxide (5 equiv), and ethane-1,2-diamine 2b (4 equiv) at 24 °C.
300 350 400 450 500-100
-50
0
50
100
150
λ / nm
Δε
/ M–1
cm–1 in a minute
after 10 min
after 20 min ~ 120 min
300 350 400 450 500-100
-50
0
50
100
150
λ / nm
Δε
/ M–1
cm–1 in a minute
after 10 min
after 20 min ~ 120 min
300 350 400 450 500
-20
0
20
40
60
80
λ / nm
Δε
/ M–1
cm–1 in a minute
after 10 min
after 20 min ~ 120 min
300 350 400 450 500
-20
0
20
40
60
80
λ / nm
Δε
/ M–1
cm–1 in a minute
after 10 min
after 20 min ~ 120 min
Electronic Supplementary Material (ESI) for Chemical CommunicationsThis journal is © The Royal Society of Chemistry 2013
S9
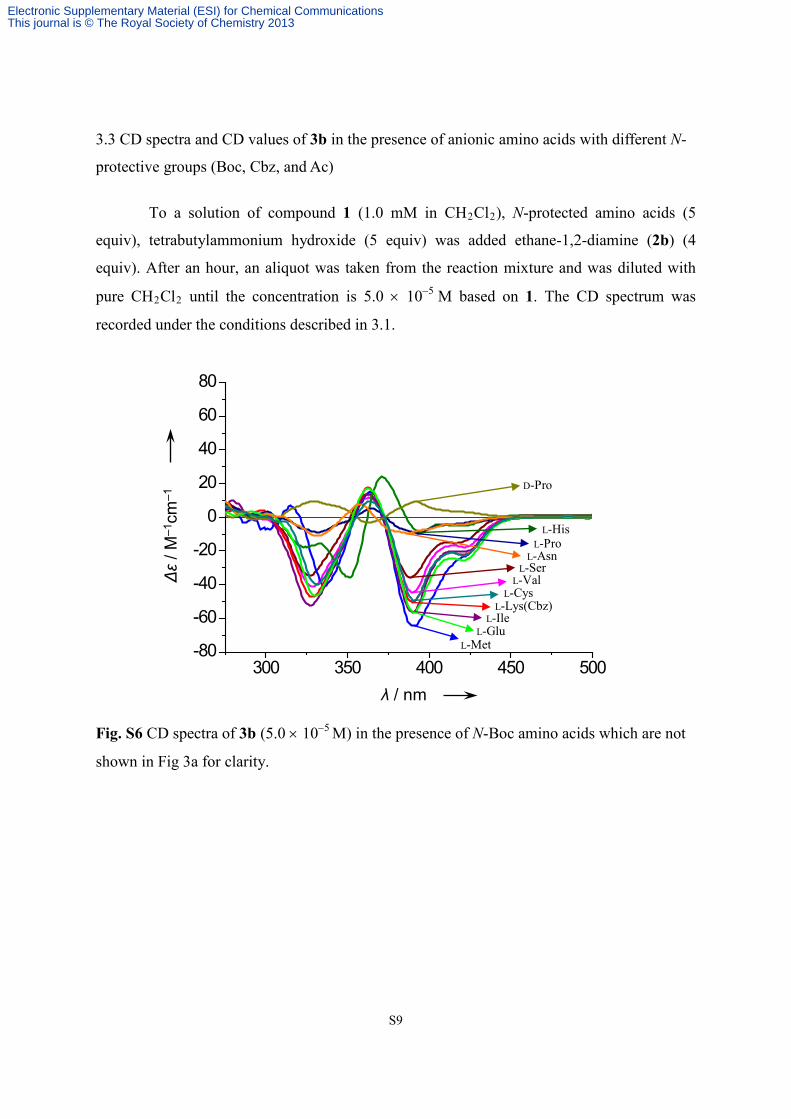
3.3 CD spectra and CD values of 3b in the presence of anionic amino acids with different N-
protective groups (Boc, Cbz, and Ac)
To a solution of compound 1 (1.0 mM in CH2Cl2), N-protected amino acids (5
equiv), tetrabutylammonium hydroxide (5 equiv) was added ethane-1,2-diamine (2b) (4
equiv). After an hour, an aliquot was taken from the reaction mixture and was diluted with
pure CH2Cl2 until the concentration is 5.0 × 10⁻⁵ M based on 1. The CD spectrum was
recorded under the conditions described in 3.1.
Fig. S6 CD spectra of 3b (5.0 × 10⁻⁵ M) in the presence of N-Boc amino acids which are not
shown in Fig 3a for clarity.
300 350 400 450 500-80
-60
-40
-20
0
20
40
60
80
λ / nm
Δε
/ M–1
cm–1
D-Pro
L-Asn
L-Cys
L-GluL-Met
L-IleL-Lys(Cbz)
L-ValL-Ser
L-HisL-Pro
Electronic Supplementary Material (ESI) for Chemical CommunicationsThis journal is © The Royal Society of Chemistry 2013
S10
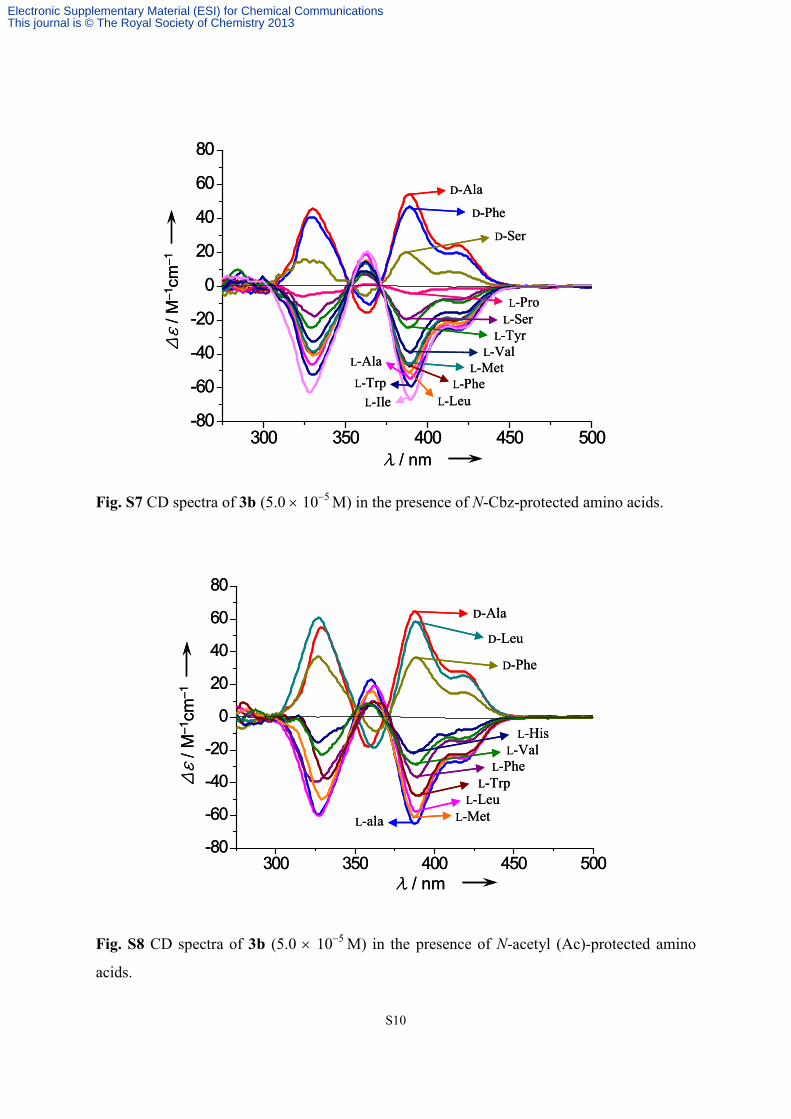
Fig. S7 CD spectra of 3b (5.0 × 10⁻⁵ M) in the presence of N-Cbz-protected amino acids.
Fig. S8 CD spectra of 3b (5.0 × 10⁻⁵ M) in the presence of N-acetyl (Ac)-protected amino
acids.
300 350 400 450 500-80
-60
-40
-20
0
20
40
60
80
D-Ala
D-Phe
L-IleL-Trp
L-LeuL-Phe
L-MetL-Val
D-Ser
L-Tyr L-Ser
L-Pro
λ / nm
Δε
/ M–1
cm–1
L-Ala
300 350 400 450 500-80
-60
-40
-20
0
20
40
60
80
D-Ala
D-Phe
L-IleL-Trp
L-LeuL-Phe
L-MetL-Val
D-Ser
L-Tyr L-Ser
L-Pro
λ / nm
Δε
/ M–1
cm–1
L-Ala
300 350 400 450 500-80
-60
-40
-20
0
20
40
60
80
D-Ala
D-Leu
L-alaL-Leu
L-Met
L-TrpL-Phe
L-Val
D-Phe
λ / nm
Δε
/ M–1
cm–1
L-His
300 350 400 450 500-80
-60
-40
-20
0
20
40
60
80
D-Ala
D-Leu
L-alaL-Leu
L-Met
L-TrpL-Phe
L-Val
D-Phe
λ / nm
Δε
/ M–1
cm–1
L-His
Electronic Supplementary Material (ESI) for Chemical CommunicationsThis journal is © The Royal Society of Chemistry 2013
S11
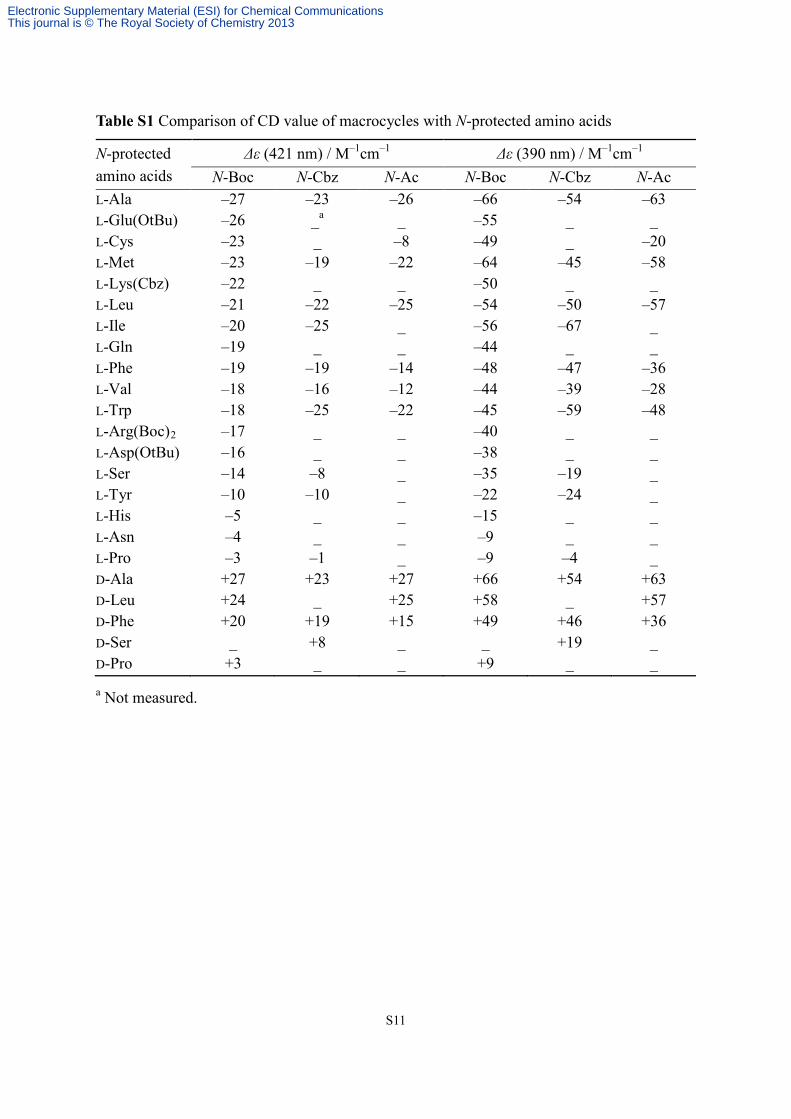
Table S1 Comparison of CD value of macrocycles with N-protected amino acids
N-protected amino acids
Δε (421 nm) / M–1cm–1 Δε (390 nm) / M–1cm–1 N-Boc N-Cbz N-Ac N-Boc N-Cbz N-Ac
L-Ala –27 –23 –26 –66 –54 –63 L-Glu(OtBu) –26 _a _ –55 _ _ L-Cys –23 _ –8 –49 _ –20 L-Met –23 –19 –22 –64 –45 –58 L-Lys(Cbz) –22 _ _ –50 _ _ L-Leu –21 –22 –25 –54 –50 –57 L-Ile –20 –25 _ –56 –67 _ L-Gln –19 _ _ –44 _ _ L-Phe –19 –19 –14 –48 –47 –36 L-Val –18 –16 –12 –44 –39 –28 L-Trp –18 –25 –22 –45 –59 –48 L-Arg(Boc)2 –17 _ _ –40 _ _ L-Asp(OtBu) –16 _ _ –38 _ _ L-Ser –14 –8 _ –35 –19 _ L-Tyr –10 –10 _ –22 –24 _ L-His –5 _ _ –15 _ _ L-Asn –4 _ _ –9 _ _ L-Pro –3 –1 _ –9 –4 _ D-Ala +27 +23 +27 +66 +54 +63 D-Leu +24 _ +25 +58 _ +57 D-Phe +20 +19 +15 +49 +46 +36 D-Ser _ +8 _ _ +19 _ D-Pro +3 _ _ +9 _ _ a Not measured.
Electronic Supplementary Material (ESI) for Chemical CommunicationsThis journal is © The Royal Society of Chemistry 2013
S12
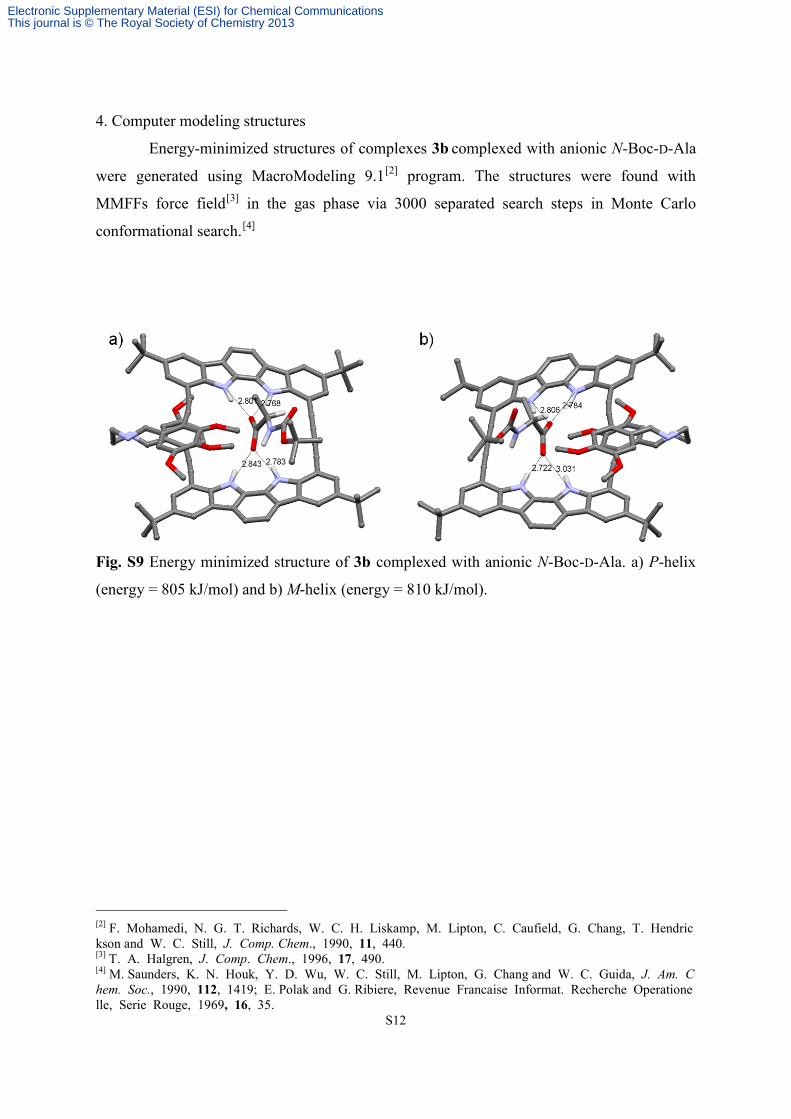
4. Computer modeling structures
Energy-minimized structures of complexes 3b complexed with anionic N-Boc-D-Ala
were generated using MacroModeling 9.1[2] program. The structures were found with
MMFFs force field[3] in the gas phase via 3000 separated search steps in Monte Carlo
conformational search.[4]
Fig. S9 Energy minimized structure of 3b complexed with anionic N-Boc-D-Ala. a) P-helix
(energy = 805 kJ/mol) and b) M-helix (energy = 810 kJ/mol).
[2] F. Mohamedi, N. G. T. Richards, W. C. H. Liskamp, M. Lipton, C. Caufield, G. Chang, T. Hendrickson and W. C. Still, J. Comp. Chem., 1990, 11, 440. [3] T. A. Halgren, J. Comp. Chem., 1996, 17, 490. [4] M. Saunders, K. N. Houk, Y. D. Wu, W. C. Still, M. Lipton, G. Chang and W. C. Guida, J. Am. Chem. Soc., 1990, 112, 1419; E. Polak and G. Ribiere, Revenue Francaise Informat. Recherche Operationelle, Serie Rouge, 1969, 16, 35.
Electronic Supplementary Material (ESI) for Chemical CommunicationsThis journal is © The Royal Society of Chemistry 2013
S13
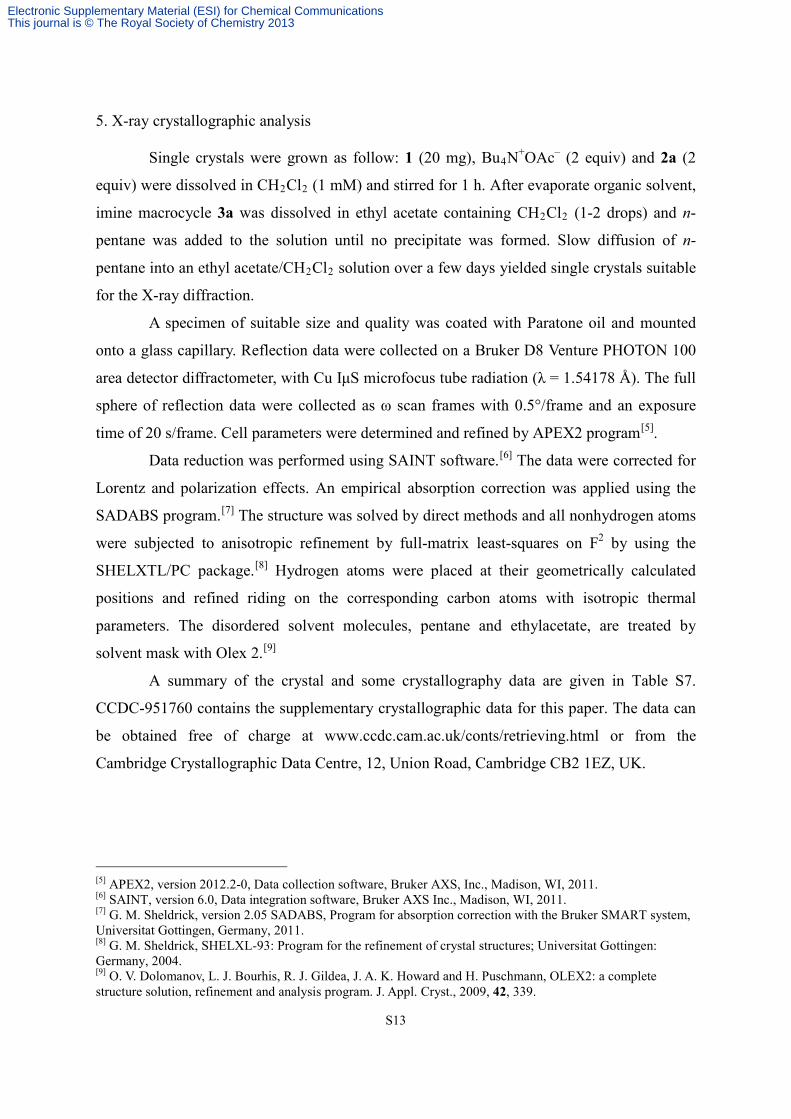
5. X-ray crystallographic analysis
Single crystals were grown as follow: 1 (20 mg), Bu4N+OAc– (2 equiv) and 2a (2
equiv) were dissolved in CH2Cl2 (1 mM) and stirred for 1 h. After evaporate organic solvent,
imine macrocycle 3a was dissolved in ethyl acetate containing CH2Cl2 (1-2 drops) and n-
pentane was added to the solution until no precipitate was formed. Slow diffusion of n-
pentane into an ethyl acetate/CH2Cl2 solution over a few days yielded single crystals suitable
for the X-ray diffraction.
A specimen of suitable size and quality was coated with Paratone oil and mounted
onto a glass capillary. Reflection data were collected on a Bruker D8 Venture PHOTON 100
area detector diffractometer, with Cu IμS microfocus tube radiation (λ = 1.54178 Å). The full
sphere of reflection data were collected as ω scan frames with 0.5°/frame and an exposure
time of 20 s/frame. Cell parameters were determined and refined by APEX2 program[5].
Data reduction was performed using SAINT software.[6] The data were corrected for
Lorentz and polarization effects. An empirical absorption correction was applied using the
SADABS program.[7] The structure was solved by direct methods and all nonhydrogen atoms
were subjected to anisotropic refinement by full-matrix least-squares on F2 by using the
SHELXTL/PC package.[8] Hydrogen atoms were placed at their geometrically calculated
positions and refined riding on the corresponding carbon atoms with isotropic thermal
parameters. The disordered solvent molecules, pentane and ethylacetate, are treated by
solvent mask with Olex 2.[9]
A summary of the crystal and some crystallography data are given in Table S7.
CCDC-951760 contains the supplementary crystallographic data for this paper. The data can
be obtained free of charge at www.ccdc.cam.ac.uk/conts/retrieving.html or from the
Cambridge Crystallographic Data Centre, 12, Union Road, Cambridge CB2 1EZ, UK.
[5] APEX2, version 2012.2-0, Data collection software, Bruker AXS, Inc., Madison, WI, 2011. [6] SAINT, version 6.0, Data integration software, Bruker AXS Inc., Madison, WI, 2011. [7] G. M. Sheldrick, version 2.05 SADABS, Program for absorption correction with the Bruker SMART system, Universitat Gottingen, Germany, 2011. [8] G. M. Sheldrick, SHELXL-93: Program for the refinement of crystal structures; Universitat Gottingen: Germany, 2004. [9] O. V. Dolomanov, L. J. Bourhis, R. J. Gildea, J. A. K. Howard and H. Puschmann, OLEX2: a complete structure solution, refinement and analysis program. J. Appl. Cryst., 2009, 42, 339.
Electronic Supplementary Material (ESI) for Chemical CommunicationsThis journal is © The Royal Society of Chemistry 2013
S14
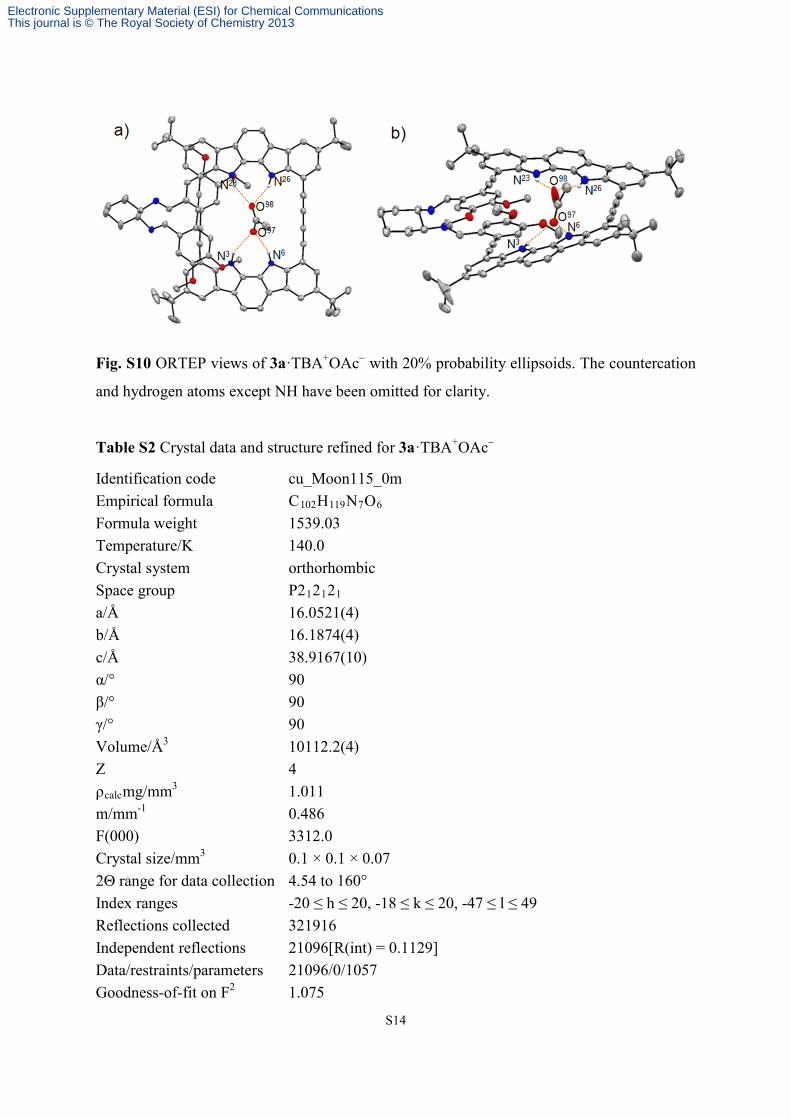
Fig. S10 ORTEP views of 3a·TBA+OAc− with 20% probability ellipsoids. The countercation
and hydrogen atoms except NH have been omitted for clarity.
Table S2 Crystal data and structure refined for 3a·TBA+OAc−
Identification code cu_Moon115_0m Empirical formula C102H119N7O6 Formula weight 1539.03 Temperature/K 140.0 Crystal system orthorhombic Space group P212121 a/Å 16.0521(4) b/Å 16.1874(4) c/Å 38.9167(10) α/° 90 β/° 90 γ/° 90 Volume/Å3 10112.2(4) Z 4 ρcalcmg/mm3 1.011 m/mm-1 0.486 F(000) 3312.0 Crystal size/mm3 0.1 × 0.1 × 0.07 2Θ range for data collection 4.54 to 160° Index ranges -20 ≤ h ≤ 20, -18 ≤ k ≤ 20, -47 ≤ l ≤ 49 Reflections collected 321916 Independent reflections 21096[R(int) = 0.1129] Data/restraints/parameters 21096/0/1057 Goodness-of-fit on F2 1.075
Electronic Supplementary Material (ESI) for Chemical CommunicationsThis journal is © The Royal Society of Chemistry 2013
S15
Final R indexes [I>=2σ (I)] R1 = 0.0674, wR2 = 0.1790 Final R indexes [all data] R1 = 0.0978, wR2 = 0.1956 Largest diff. peak/hole / e Å-3 1.43/-0.28 Flack parameter 0.12(8)
Table S3 Hydrogen bond distances and angles for 3a• Bu4N+OAc– [Å and °]
D-H...A d(D-H) d(H...A) d(D...A) <(DHA)
N3-H(N3)∙∙∙O97 0.88(3) 2.42(3) 3.19(5) 145(2)
N6-H(N6)∙∙∙O97 0.88(3) 2.03(3) 2.85(5) 156(2)
N23-H(N23)∙∙∙O98 0.88(3) 2.25(5) 3.03(6) 149(2)
N26-H(N26)∙∙∙O98 0.88(3) 2.03(5) 2.85(6) 156(3)
Electronic Supplementary Material (ESI) for Chemical CommunicationsThis journal is © The Royal Society of Chemistry 2013


![arXiv:0710.1625v2 [math.KT] 9 Jul 20084 BAI-LING WANG corresponding bundle of based spectra over X will be denoted by Pα(K) and Pα(MSpinc) respectively. Twisted K-cohomology groups](https://static.fdocument.org/doc/165x107/5f5f05e17ae4512650398008/arxiv07101625v2-mathkt-9-jul-2008-4-bai-ling-wang-corresponding-bundle-of-based.jpg)
![arXiv:math/0307181v2 [math.AG] 18 Jul 2003math.bu.edu/people/szczesny/Papers/CDR_orb.pdf · BRST differential and is quasi-isomorphic tothe deRham complex of Xg. Putting the twisted](https://static.fdocument.org/doc/165x107/5f736d0d2cee6d7f79258f99/arxivmath0307181v2-mathag-18-jul-brst-diierential-and-is-quasi-isomorphic.jpg)


![TWISTED BORCHERDS PRODUCTS ON HILBERT MODULAR … · 2018-10-22 · arXiv:math/0505177v2 [math.NT] 18 May 2005 TWISTED BORCHERDS PRODUCTS ON HILBERT MODULAR SURFACES AND THEIR CM](https://static.fdocument.org/doc/165x107/5f83aeafe2adb550132f17b1/twisted-borcherds-products-on-hilbert-modular-2018-10-22-arxivmath0505177v2.jpg)