Standards for providing Internet Services over Wireless Networks
A comparison of nitrogen dioxide (NO2) in nitrogen standards at 10 μmol/mol by Fourier Transform Infrared Spectroscopy (FT-IR) Page 1 of 76
A comparison of nitrogen dioxide (NO2) in nitrogen standards at 10 μmol/mol by Fourier Transform Infrared
Spectroscopy (FT-IR)
(Final report of the pilot study CCQM-P110-B1)
Edgar Flores*1, Faraz Idrees1, Philippe Moussay1, Joële Viallon1, Robert Wielgosz1, Teresa Fernández2, Andrés Rojo2, Sergio Ramírez2, Nobuyuki Aoki3, Kenji Kato.3, Lee Jeongsoon4, Dongmin Moon4 and Jin-Seog Kim4, A. Harling5, M. Milton5, Damian Smeulders6, Franklin R. Guenther7, Lyn Gameson7, Angelique Botha8, James Tshilongo8, Napo Godwill Ntsasa8, Miroslava Valková9, Leonid A. Konopelko10, Yury A. Kustikov10, Vladimir S. Ballandovich10, Elena V. Gromova10, Dirk Tuma11, Anka Kohl11 and Gert Schulz11.
1 Bureau International des Poids et Mesures (BIPM), Pavillon de Breteuil, F-92312 Sevres Cedex. 2 Centro Español de metrología (CEM), Calle Alfar, 2, 28760 Tres, Cantos (Madrid), Spain. 3 National Metrology Institute of Japan (NMIJ), 305-8563 1-1-1 Umesono, Tsukuba Ibaraki, Japan. 4 Korea Research Institute of Standards and Science (KRISS),1, Doryong-Dong, Yuseong-Gu, Daejeon 305-340, Korea 5 National Physical Laboratory (NPL), Hampton Road, Teddington, Middx, TW11 0LW, UK. 6 National Measurement Institute Australia (NMIA), Bradfield Road, P.O. Box 264, NSW 2070 Lindfield 7 National Institute of Standards and Technology (NIST), 100 Bureau Drive, Gaithersburg, MD 20899-8393, USA 8 National Metrology Institute of South Africa (NMISA), CSIR, Building 4 West, Meiring Naude Road Brummeria, 0184,
Pretoria, South Africa. 9 Slovak Institute of Metrology (SMU), Karloveská 63, SK-842 55 Bratislava, Slovak Republic. 10 D.I.Mendeleyev Institute for Metrology (VNIIM), 19 Moskovsky pr., St. Petersburg, 190005 Russia. 11 Federal Institute for Materials Research and Testing (BAM), Unter den Eichen 87, 12205 Berlin, Germany.
Coordinating laboratories: Bureau International des Poids et Mesures (BIPM) VSL Dutch Metrology Institute Study coordinator: Edgar Flores (BIPM)
Correspondence to be addressed to: Edgar Flores [email protected] (Tel: + 33 1 45 07 70 92)
Field: Amount of substance Organizing Body: CCQM
A comparison of nitrogen dioxide (NO2) in nitrogen standards at 10 μmol/mol by Fourier Transform Infrared Spectroscopy (FT-IR) Page 2 of 76
Index
1. RATIONAL FOR COMPARISON 4
2. QUANTITIES AND UNITS 4
3. SCHEDULE 4
4. MEASUREMENT STANDARDS 4
Preparation and value assignment 4
Purity analysis 5
Stability of the mixtures 6
Deviations from the protocol 6
5. REFERENCE VALUES FOR CYLINDERS 17
6. MEASUREMENT PROTOCOL 17
7. MEASUREMENT METHODS 18
8 RESULTS 18
9. DISCUSSION 24
10. CONCLUSION 26
ANNEX 1- BIPM VALUE ASSIGNMENT PROCEDURE 27
1. Description of the facility 27
2. Measurement protocol of the BIPM 30
3. BIPM measurement uncertainties and analyser response 31
4. Covariance between two dynamically generated gas mixtures 34
5. FT-IR analysis of gas standards 35
6. FT-IR Spectra acquisition procedure 35
7. Quantitative analysis of nitric acid 36
A comparison of nitrogen dioxide (NO2) in nitrogen standards at 10 μmol/mol by Fourier Transform Infrared Spectroscopy (FT-IR) Page 3 of 76
8. Uncertainty budget 36
9. Regression analysis 37
10. Determination and validation of analysis functions 37
ANNEX 2 - MEASUREMENT REPORTS OF PARTICIPANTS 38
Centro Español de metrología (CEM) 38
Korea Research Institute of Standards and Science (KRISS) 41
National Measurement Institute Australia (NMIA) 44
National Metrology institute of Japan (NIMJ) 46
National Institute of Standards and Technology (NIST) 49
National Physical Laboratory (NPL) 52
National Metrology Institute of South Africa (NMISA) 57
Slovak Institute of Metrology (SMU) 60
Mendeleyev Institute for Metrology (VNIIM) 68
Federal Institute for Materials Research and Testing (BAM) 71
Bureau International des Poids et Mesures (BIPM) 74
A comparison of nitrogen dioxide (NO2) in nitrogen standards at 10 μmol/mol by Fourier Transform Infrared Spectroscopy (FT-IR) Page 4 of 76
1. Rational for comparison This pilot study compares the performance of participants in analysing an unknown mixture of nitrogen dioxide in nitrogen (at a nominal mole fraction of 10 µmol/mol.) by comparison with their own standards using FT-IR spectroscopy. It uses the same standard gas mixtures as were used in the key comparison CCQM-K74 (1). The level of comparability between laboratories in this Pilot Study was evaluated and compared to that in CCQM-K74. In CCQM-K74, most participants used chemiluminescence, with a small number using UV absorption or FT-IR spectroscopy. These last two techniques are of particular interest because they do not exhibit any cross sensitivity to nitric acid (HNO3), which was known to be present in the mixtures used for the comparison.
2. Quantities and Units
In this protocol the measurand was the mole fraction of nitrogen dioxide in nitrogen*, with measurement results being expressed in mol/mol and its multiples μmol/mol or nmol/mol.
(*the nitrogen balance gas contains nominally 1000 µmol/mol of oxygen)
3. Schedule The revised schedule of the project was as follows: June 2009 Shipment of cylinders to the BIPM June 2009- August 2009 Analysis of mixtures at the BIPM September 2009 Shipment of cylinders from the BIPM to participants October 2009- January 2010 Analysis of mixtures by the participants February 2010 Shipment of cylinders back from participants to the BIPM March 2010 – May 2010 2nd set of analysis of mixtures at the BIPM February 2010 – May 2010 Reports of the participants July 2010 Distribution of Draft A of this report September 2011 Distribution of Draft B V0.1 of this report
4. Measurement standards
Preparation and value assignment
The gas mixtures were prepared by the Dutch Metrology Institute (VSL). The nitrogen dioxide gas mixtures were contained in passivated aluminium cylinders of 5 L. The cylinders were pressurized to about 12 MPa.
The nitrogen dioxide gas standards were produced by gravimetric preparation in accordance with the International Standard ISO 6142:20011.
1 ISO 6142:2001: Gas analysis-Preparation of calibration gas mixtures-Gravimetric method.
A comparison of nitrogen dioxide (NO2) in nitrogen standards at 10 μmol/mol by Fourier Transform Infrared Spectroscopy (FT-IR) Page 5 of 76
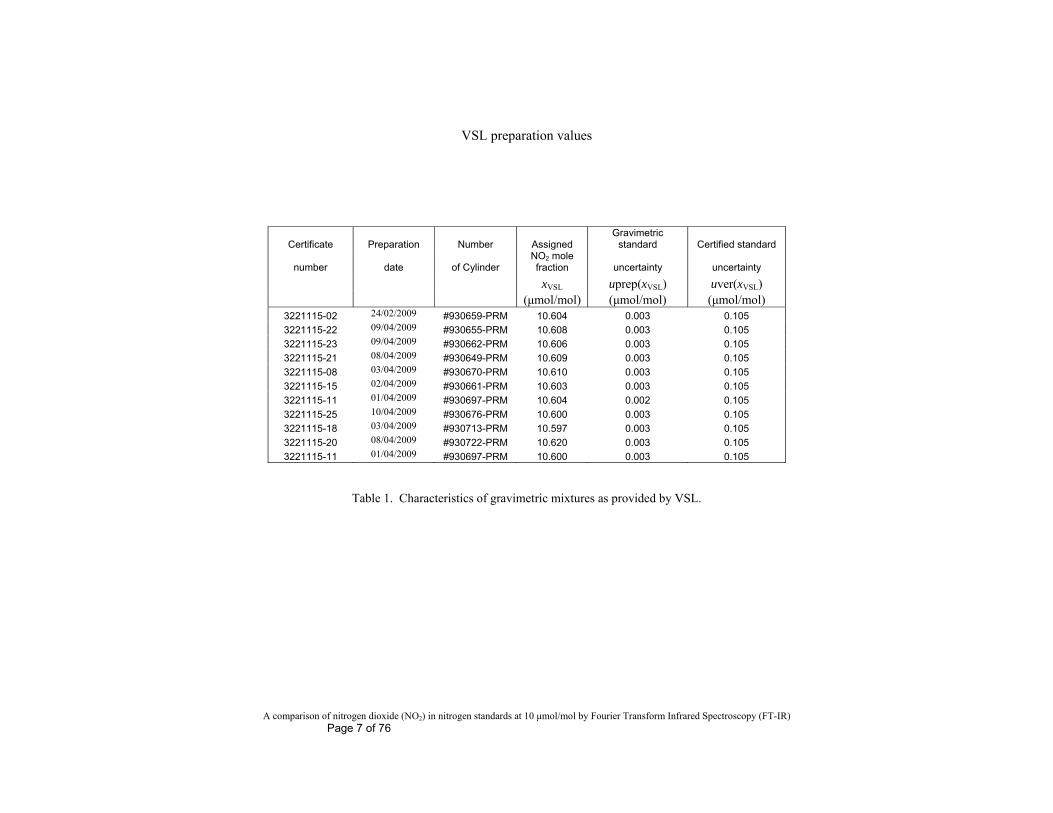
Each cylinder was value assigned by the BIPM, with its dynamic gas facility described in ANNEX 1, before and after the participant’s measurements. The VSL and BIPM values and measurements are given in Table 1 and Table 2 where: xVSL is the value assigned by VSL based on gravimetric preparation;
uprep(xVSL) the standard uncertainty of the VSL values with contributions due to gravimetry and purity analysis;
uver(xVSL) the standard uncertainty including contributions from verification associated with the assigned value xVSL;
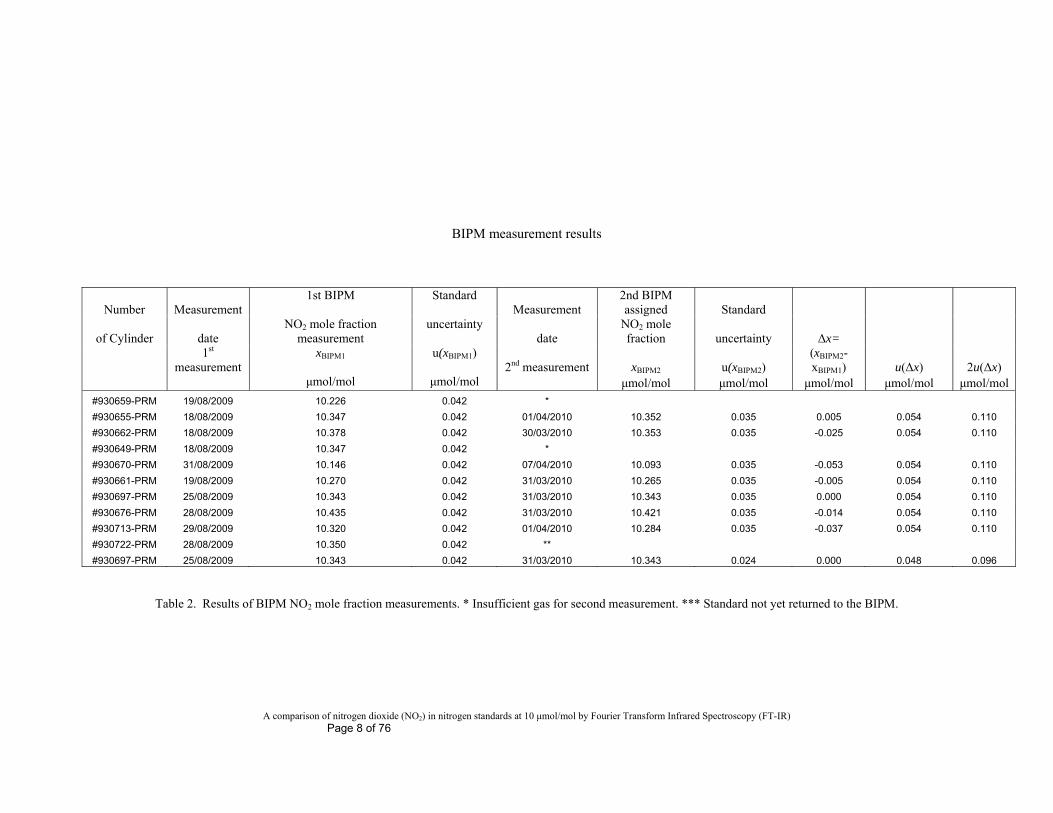
xBIPM1 the first BIPM measurement result (prior to sending out cylinders to participants);
u(xBIPM1) the standard uncertainty of the first BIPM measurement result, including losses and drift terms as explained in section 5;
xBIPM2 the second BIPM measurement result (on return of cylinders from participants);
u(xBIPM2) the standard uncertainty of the second BIPM measurement result;
Purity analysis
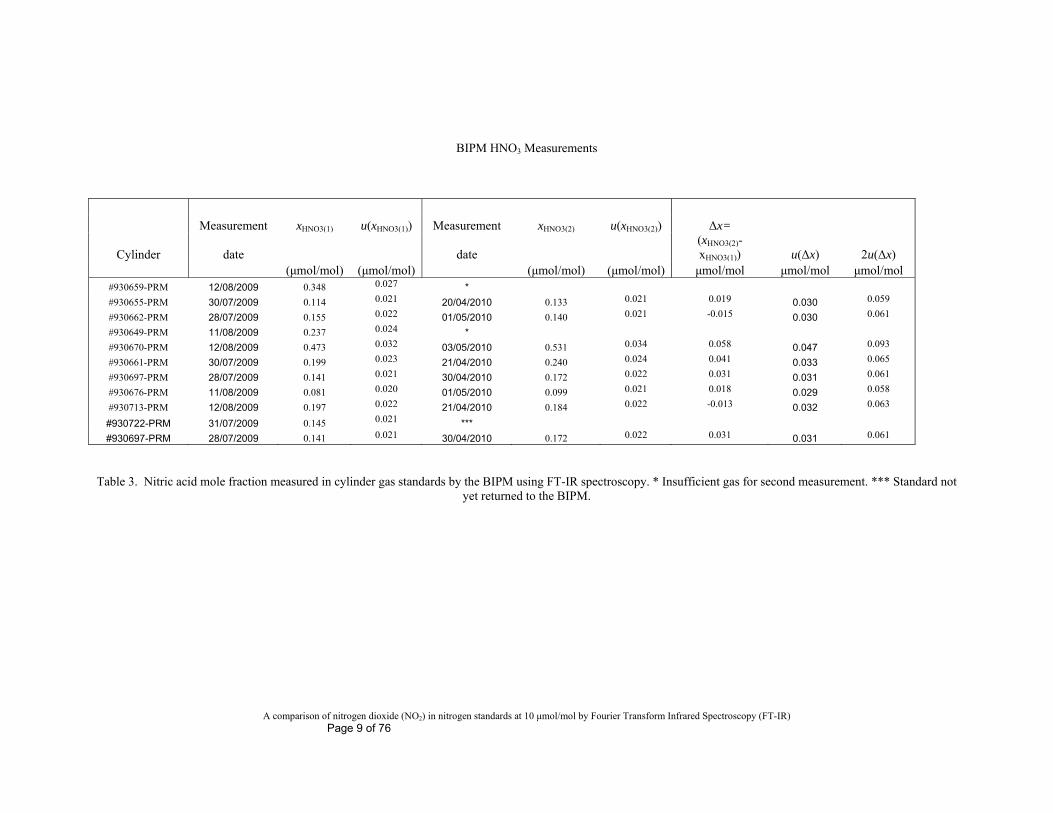
From previous studies carried out by the BIPM and VSL it was expected that the mixtures would contain quantifiable amounts of HNO3. The analysis of the gas mixtures at the BIPM with FT-IR spectroscopy confirmed the presence of and permitted the quantification of nitric acid in the gas mixtures. Table 3 list the nitric acid mole fractions found in the gas standards. To verify the stability of the gas mixtures the purity analysis was repeated when the gas mixtures were returned to the BIPM provided that the participants returned the cylinders with the minimum gas pressure required as described in the comparison protocol (see Table 4). Table 3 lists: Cylinder the identification code of the cylinder received by the participating
laboratory;
xHNO3(1) the mole fraction of nitric acid measured in the standard by the BIPM (prior to sending standards to participants);
u(xHNO3(1)) the standard uncertainty associated with the nitric acid mole fraction measurement;
xHNO3(2) the mole fraction of nitric acid measured in the standard by the BIPM (following return of standards to the BIPM);
u(xHNO3(2)) the standard uncertainty associated with the nitric acid determination by FT-IR spectroscopy after the participants measurements.
A comparison of nitrogen dioxide (NO2) in nitrogen standards at 10 μmol/mol by Fourier Transform Infrared Spectroscopy (FT-IR) Page 6 of 76
Stability of the mixtures
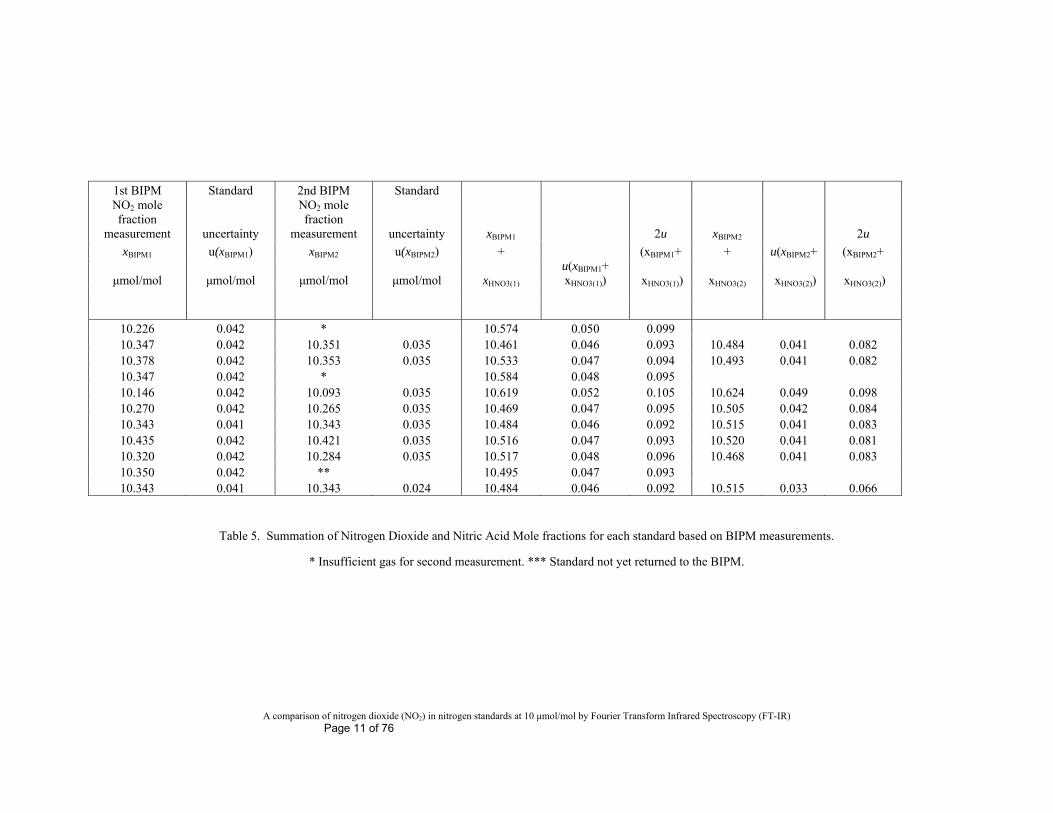
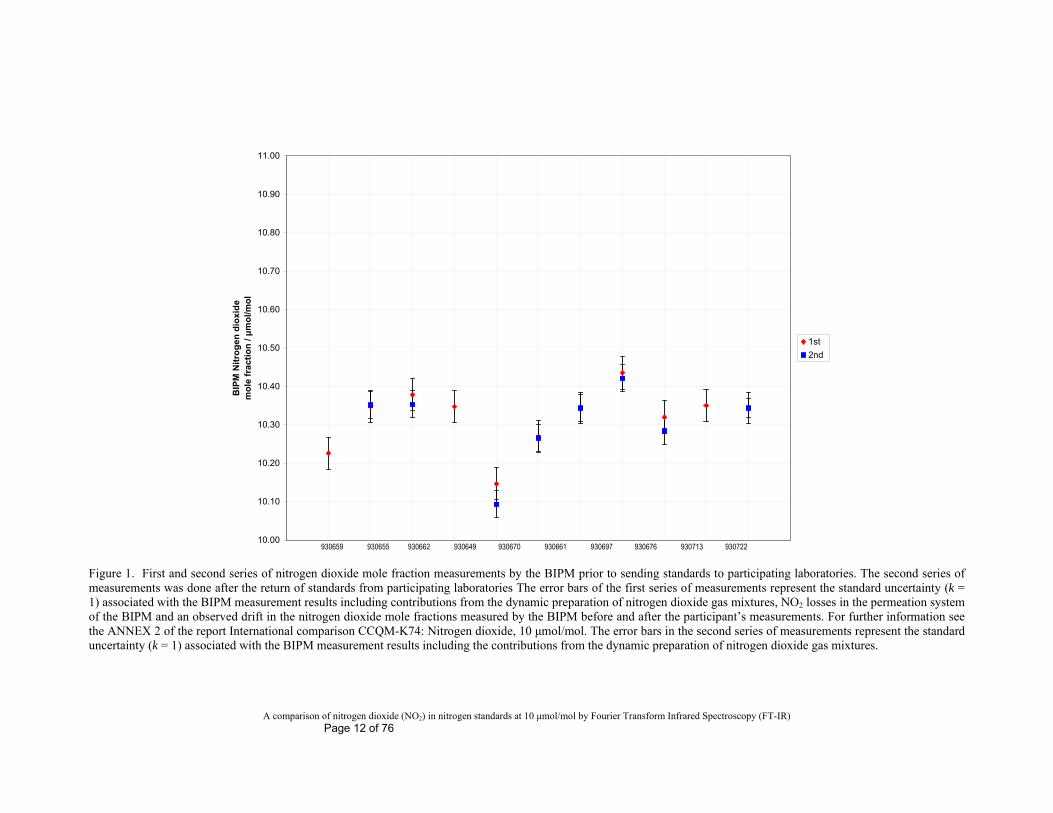
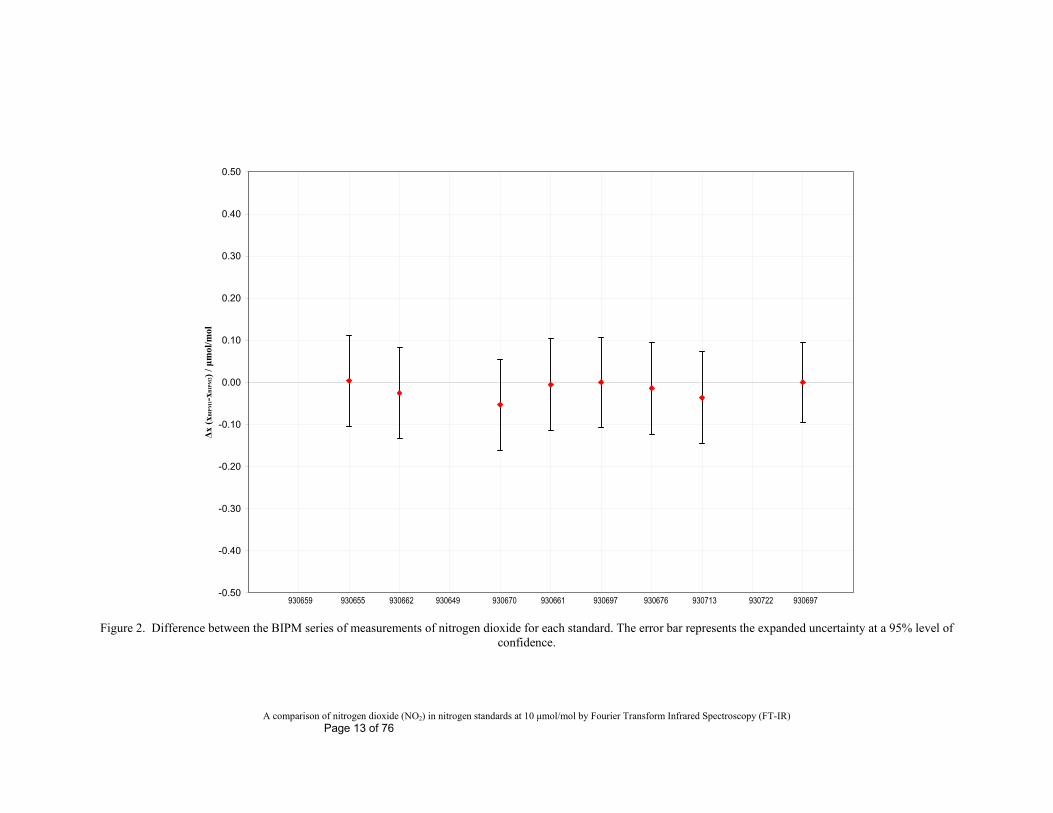
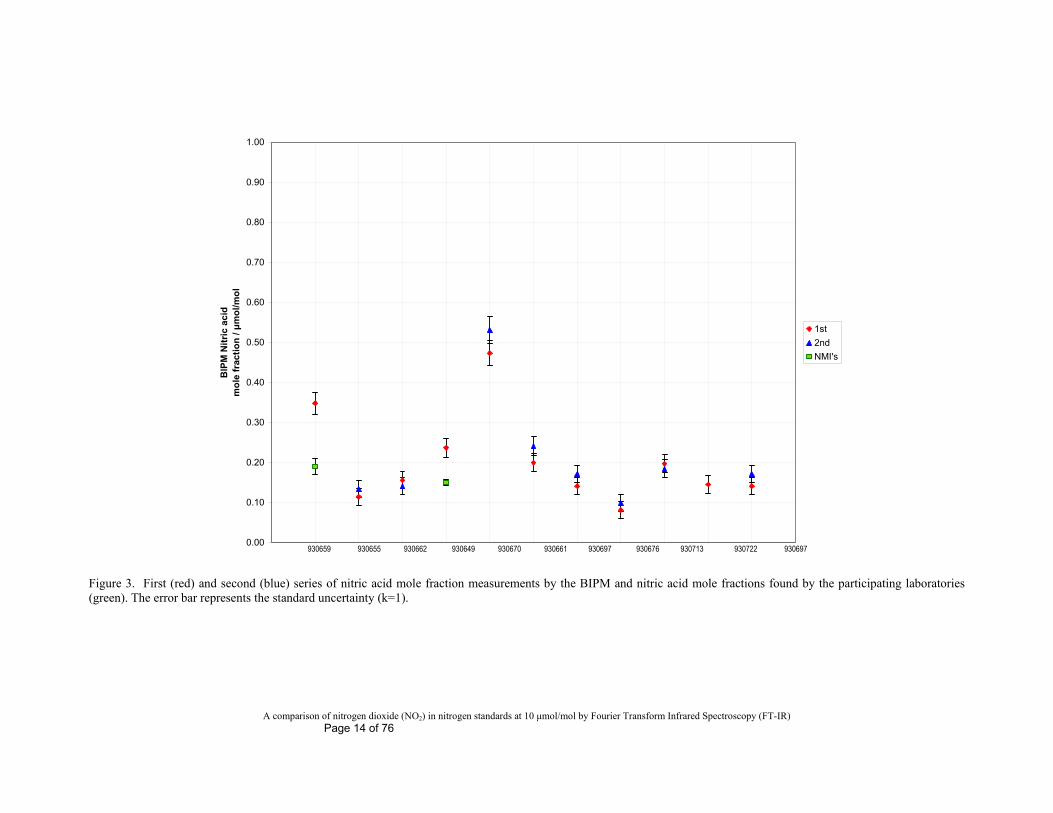
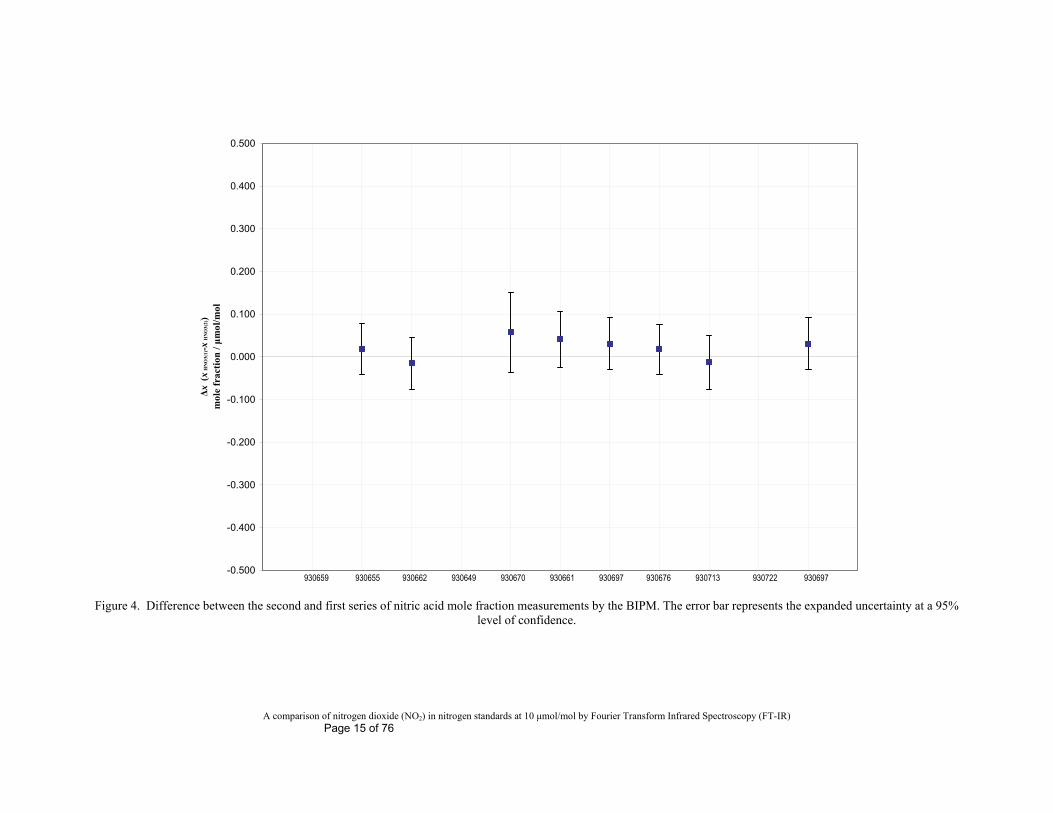
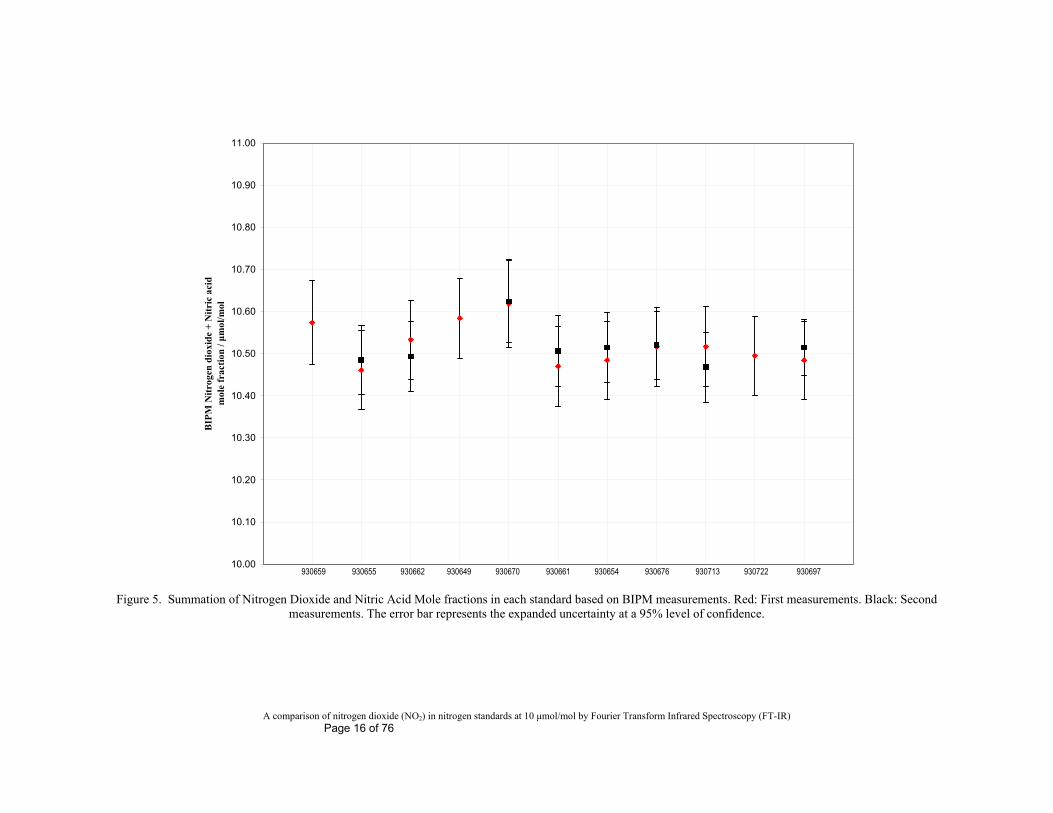
The nitrogen dioxide mole fractions measured by the BIPM before and after measurements by participants are shown in Figure 1. The error bars in the first series of measurements represent the standard uncertainty associated with the BIPM measurement results including contributions from the dynamic preparation of nitrogen dioxide gas mixtures, NO2 losses in the permeation system of the BIPM and an observed drift in the nitrogen dioxide mole fractions measured by the BIPM before and after the participant’s measurements. For further information see the ANNEX 2 of the report International comparison CCQM-K74: Nitrogen dioxide, 10 μmol/mol. The error bars in the second series of measurements represent the standard uncertainty associated with the BIPM measurement results including the contributions from the dynamic preparation of nitrogen dioxide gas mixtures. The difference between the BIPM series of measurements for each standard is plotted in Figure 2.The NO2 mole fraction in all cylinders was found to be in the range from 10.143 μmol/mol to 10.435 μmol/mol as measured by the BIPM. The amount of nitric acid found in each cylinder was consistent with the difference between the gravimetric preparation value and BIPM’s analytical value for the nitrogen dioxide amount fraction, and accounts for the conversion of nitrogen dioxide to nitric acid (reacting with residual water and oxygen in the gas standards) and limited by the amount of water present. Figure 3 plots the nitric acid mole fractions measured in each gas standard before and after measurements by the participants. Changes in the mole fractions of nitrogen dioxide and nitric acid in each cylinder during the period of the comparison were well within the measurement uncertainties of these values. The uncertainty budget for the BIPM measurement result contains a component which covers any change in value due to instability of the gas transfer standard. The difference between the series on nitric acid mole fractions measured by the BIPM was plotted in Figure 4. The mixtures stability can be confirmed in the summation of nitrogen dioxide and nitric acid mole fractions of the first and second series of measurements shown in Figure 5.
Deviations from the protocol The BIPM was unable to perform a second measurement of nitric acid content in gas mixtures 930659 and 930649, as the participating laboratories that had made measurements on these cylinders had not followed the comparison protocol and returned the cylinders with insufficient gas to make these measurements. Cylinder 930722 was not returned on time to the BIPM and no additional measurements could be made on this cylinder. Cylinder 930697 was analyzed by the BIPM to provide a BIPM result in this comparison. This cylinder was sent after to NIST2. Unlike other participants, the NIST performed its analysis on two different cylinders: cylinder 930654 during CCQM-K74 and cylinder 930697 during CCQM-P110. This should not impact the results as all reference values are given by the BIPM. 2 The cylinder 930697, originally assigned to the BIPM, was sent to NIST before the second series of measurements due that the internal pressure of NIST cylinder, 930654, was extremely low to take part in the present comparison after its participation in the Key comparison CCQM-K74.
A comparison of nitrogen dioxide (NO2) in nitrogen standards at 10 μmol/mol by Fourier Transform Infrared Spectroscopy (FT-IR) Page 7 of 76
VSL preparation values
Table 1. Characteristics of gravimetric mixtures as provided by VSL.
Certificate Preparation Number Assigned Gravimetric
standard Certified standard
number date of Cylinder NO2 mole fraction uncertainty uncertainty
xVSL uprep(xVSL) uver(xVSL) (μmol/mol) (μmol/mol) (μmol/mol)
3221115-02 24/02/2009 #930659-PRM 10.604 0.003 0.105
3221115-22 09/04/2009 #930655-PRM 10.608 0.003 0.105
3221115-23 09/04/2009 #930662-PRM 10.606 0.003 0.105
3221115-21 08/04/2009 #930649-PRM 10.609 0.003 0.105
3221115-08 03/04/2009 #930670-PRM 10.610 0.003 0.105
3221115-15 02/04/2009 #930661-PRM 10.603 0.003 0.105
3221115-11 01/04/2009 #930697-PRM 10.604 0.002 0.105
3221115-25 10/04/2009 #930676-PRM 10.600 0.003 0.105
3221115-18 03/04/2009 #930713-PRM 10.597 0.003 0.105
3221115-20 08/04/2009 #930722-PRM 10.620 0.003 0.105
3221115-11 01/04/2009 #930697-PRM 10.600 0.003 0.105
A comparison of nitrogen dioxide (NO2) in nitrogen standards at 10 μmol/mol by Fourier Transform Infrared Spectroscopy (FT-IR) Page 8 of 76
BIPM measurement results
Number Measurement 1st BIPM Standard
Measurement 2nd BIPM assigned Standard
of Cylinder date NO2 mole fraction
measurement uncertainty
date NO2 mole fraction uncertainty Δx=
1st
measurement xBIPM1 u(xBIPM1)
2nd measurement xBIPM2 u(xBIPM2) (xBIPM2-xBIPM1) u(Δx) 2u(Δx)
μmol/mol μmol/mol μmol/mol μmol/mol μmol/mol μmol/mol μmol/mol
#930659-PRM 19/08/2009 10.226 0.042 *
#930655-PRM 18/08/2009 10.347 0.042 01/04/2010 10.352 0.035 0.005 0.054 0.110
#930662-PRM 18/08/2009 10.378 0.042 30/03/2010 10.353 0.035 -0.025 0.054 0.110
#930649-PRM 18/08/2009 10.347 0.042 *
#930670-PRM 31/08/2009 10.146 0.042 07/04/2010 10.093 0.035 -0.053 0.054 0.110
#930661-PRM 19/08/2009 10.270 0.042 31/03/2010 10.265 0.035 -0.005 0.054 0.110
#930697-PRM 25/08/2009 10.343 0.042 31/03/2010 10.343 0.035 0.000 0.054 0.110
#930676-PRM 28/08/2009 10.435 0.042 31/03/2010 10.421 0.035 -0.014 0.054 0.110
#930713-PRM 29/08/2009 10.320 0.042 01/04/2010 10.284 0.035 -0.037 0.054 0.110
#930722-PRM 28/08/2009 10.350 0.042 **
#930697-PRM 25/08/2009 10.343 0.042 31/03/2010 10.343 0.024 0.000 0.048 0.096
Table 2. Results of BIPM NO2 mole fraction measurements. * Insufficient gas for second measurement. *** Standard not yet returned to the BIPM.
A comparison of nitrogen dioxide (NO2) in nitrogen standards at 10 μmol/mol by Fourier Transform Infrared Spectroscopy (FT-IR) Page 9 of 76
BIPM HNO3 Measurements
Measurement xHNO3(1) u(xHNO3(1)) Measurement xHNO3(2) u(xHNO3(2)) Δx=
Cylinder date date (xHNO3(2)-xHNO3(1)) u(Δx) 2u(Δx)
(μmol/mol) (μmol/mol) (μmol/mol) (μmol/mol) μmol/mol μmol/mol μmol/mol #930659-PRM 12/08/2009 0.348 0.027 *
#930655-PRM 30/07/2009 0.114 0.021 20/04/2010 0.133 0.021 0.019 0.030 0.059
#930662-PRM 28/07/2009 0.155 0.022 01/05/2010 0.140 0.021 -0.015 0.030 0.061
#930649-PRM 11/08/2009 0.237 0.024 *
#930670-PRM 12/08/2009 0.473 0.032 03/05/2010 0.531 0.034 0.058 0.047 0.093
#930661-PRM 30/07/2009 0.199 0.023 21/04/2010 0.240 0.024 0.041 0.033 0.065
#930697-PRM 28/07/2009 0.141 0.021 30/04/2010 0.172 0.022 0.031 0.031 0.061
#930676-PRM 11/08/2009 0.081 0.020 01/05/2010 0.099 0.021 0.018 0.029 0.058
#930713-PRM 12/08/2009 0.197 0.022 21/04/2010 0.184 0.022 -0.013 0.032 0.063
#930722-PRM 31/07/2009 0.145 0.021 ***
#930697-PRM 28/07/2009 0.141 0.021 30/04/2010 0.172 0.022 0.031 0.031 0.061
Table 3. Nitric acid mole fraction measured in cylinder gas standards by the BIPM using FT-IR spectroscopy. * Insufficient gas for second measurement. *** Standard not yet returned to the BIPM.

A comparison of nitrogen dioxide (NO2) in nitrogen standards at 10 μmol/mol by Fourier Transform Infrared Spectroscopy (FT-IR) Page 10 of 76
Certification Number Date of pressure on pressure on Lab date of Cylinder return departure return
Mpa Mpa NPL 24/02/2009 #930659-PRM 26-Jan-2010 9.0 4.0* SMU 09/04/2009 #930655-PRM 02-Feb-2010 10.0 7.5 NMIA 09/04/2009 #930662-PRM 26-Feb-2010 9.5 7.0
NMISA 08/04/2009 #930649-PRM 24-Feb-2010 10.5 2.5* NMIJ 19/03/2009 #930670-PRM 19-Feb-2010 10.0 7.0 KRISS 02/04/2009 #930661-PRM 26-Feb-2010 9.5 5.5 NIST 20/03/2009 #930697-PRM 15-Mar-2010 8.5 6.0 CEM 10/04/2009 #930676-PRM 02-Mar-2010 10.0 6.2
VNIIM 03/04/2009 #930713-PRM 16-Feb-2010 10.0 7.2 BAM 08/04/2009 #930722-PRM *** 9.8 BIPM 20/03/2009 #930697-PRM In place - -
Table 4. Departure and return pressure of the gas standards after being measured by the participating laboratories.
* Insufficient gas for 2nd series of BIPM measurements (≤5MPa). *** Standard not yet returned to the BIPM.
A comparison of nitrogen dioxide (NO2) in nitrogen standards at 10 μmol/mol by Fourier Transform Infrared Spectroscopy (FT-IR) Page 11 of 76
1st BIPM Standard 2nd BIPM Standard NO2 mole fraction
measurement uncertainty
NO2 mole fraction
measurement uncertainty xBIPM1 2u xBIPM2 2u
xBIPM1 u(xBIPM1) xBIPM2 u(xBIPM2) + (xBIPM1+ + u(xBIPM2+ (xBIPM2+
μmol/mol μmol/mol μmol/mol μmol/mol xHNO3(1) u(xBIPM1+ xHNO3(1)) xHNO3(1)) xHNO3(2) xHNO3(2)) xHNO3(2))
10.226 0.042 * 10.574 0.050 0.099 10.347 0.042 10.351 0.035 10.461 0.046 0.093 10.484 0.041 0.082 10.378 0.042 10.353 0.035 10.533 0.047 0.094 10.493 0.041 0.082 10.347 0.042 * 10.584 0.048 0.095 10.146 0.042 10.093 0.035 10.619 0.052 0.105 10.624 0.049 0.098 10.270 0.042 10.265 0.035 10.469 0.047 0.095 10.505 0.042 0.084 10.343 0.041 10.343 0.035 10.484 0.046 0.092 10.515 0.041 0.083 10.435 0.042 10.421 0.035 10.516 0.047 0.093 10.520 0.041 0.081 10.320 0.042 10.284 0.035 10.517 0.048 0.096 10.468 0.041 0.083 10.350 0.042 ** 10.495 0.047 0.093 10.343 0.041 10.343 0.024 10.484 0.046 0.092 10.515 0.033 0.066
Table 5. Summation of Nitrogen Dioxide and Nitric Acid Mole fractions for each standard based on BIPM measurements.
* Insufficient gas for second measurement. *** Standard not yet returned to the BIPM.
A comparison of nitrogen dioxide (NO2) in nitrogen standards at 10 μmol/mol by Fourier Transform Infrared Spectroscopy (FT-IR) Page 12 of 76
10.00
10.10
10.20
10.30
10.40
10.50
10.60
10.70
10.80
10.90
11.00
BIP
M N
itro
gen
dio
xid
e m
ole
fra
ctio
n / μm
ol/m
ol
1st
2nd
930659 930655 930662 930649 930670 930661 930697 930676 930713 930722
Figure 1. First and second series of nitrogen dioxide mole fraction measurements by the BIPM prior to sending standards to participating laboratories. The second series of measurements was done after the return of standards from participating laboratories The error bars of the first series of measurements represent the standard uncertainty (k = 1) associated with the BIPM measurement results including contributions from the dynamic preparation of nitrogen dioxide gas mixtures, NO2 losses in the permeation system of the BIPM and an observed drift in the nitrogen dioxide mole fractions measured by the BIPM before and after the participant’s measurements. For further information see the ANNEX 2 of the report International comparison CCQM-K74: Nitrogen dioxide, 10 μmol/mol. The error bars in the second series of measurements represent the standard uncertainty (k = 1) associated with the BIPM measurement results including the contributions from the dynamic preparation of nitrogen dioxide gas mixtures.
A comparison of nitrogen dioxide (NO2) in nitrogen standards at 10 μmol/mol by Fourier Transform Infrared Spectroscopy (FT-IR) Page 13 of 76
-0.50
-0.40
-0.30
-0.20
-0.10
0.00
0.10
0.20
0.30
0.40
0.50
Δx (
x BIP
M1-
x BIP
M2)
/ μm
ol/m
ol
930659 930655 930662 930649 930670 930661 930697 930676 930713 930722 930697
Figure 2. Difference between the BIPM series of measurements of nitrogen dioxide for each standard. The error bar represents the expanded uncertainty at a 95% level of confidence.
A comparison of nitrogen dioxide (NO2) in nitrogen standards at 10 μmol/mol by Fourier Transform Infrared Spectroscopy (FT-IR) Page 14 of 76
0.00
0.10
0.20
0.30
0.40
0.50
0.60
0.70
0.80
0.90
1.00
BIP
M N
itri
c ac
id
mo
le f
ract
ion
/ μm
ol/m
ol
1st
2nd
NMI's
930659 930655 930662 930649 930670 930661 930697 930676 930713 930722 930697
Figure 3. First (red) and second (blue) series of nitric acid mole fraction measurements by the BIPM and nitric acid mole fractions found by the participating laboratories (green). The error bar represents the standard uncertainty (k=1).
A comparison of nitrogen dioxide (NO2) in nitrogen standards at 10 μmol/mol by Fourier Transform Infrared Spectroscopy (FT-IR) Page 15 of 76
-0.500
-0.400
-0.300
-0.200
-0.100
0.000
0.100
0.200
0.300
0.400
0.500
Δx (
xH
NO
3(1)-x
HN
O3(
2))
mol
e fr
acti
on / μm
ol/m
ol
930659 930655 930662 930649 930670 930661 930697 930676 930713 930722 930697
Figure 4. Difference between the second and first series of nitric acid mole fraction measurements by the BIPM. The error bar represents the expanded uncertainty at a 95% level of confidence.
A comparison of nitrogen dioxide (NO2) in nitrogen standards at 10 μmol/mol by Fourier Transform Infrared Spectroscopy (FT-IR) Page 16 of 76
10.00
10.10
10.20
10.30
10.40
10.50
10.60
10.70
10.80
10.90
11.00
BIP
M N
itro
gen
dio
xid
e +
Nit
ric
acid
m
ole
frac
tion
/ μm
ol/m
ol
930659 930655 930662 930649 930670 930661 930654 930676 930713 930722 930697
Figure 5. Summation of Nitrogen Dioxide and Nitric Acid Mole fractions in each standard based on BIPM measurements. Red: First measurements. Black: Second measurements. The error bar represents the expanded uncertainty at a 95% level of confidence.
A comparison of nitrogen dioxide (NO2) in nitrogen standards at 10 μmol/mol by Fourier Transform Infrared Spectroscopy (FT-IR) Page 17 of 76
5. Reference Values for Cylinders During the 24th and 25th meetings of the CCQM GAWG it was agreed that the reference value for this comparison was to be based on BIPM measurement results prior to distribution of gas standards to participants. The BIPM’s measurements clearly indicate the presence of nitric acid in the gas mixtures ranging from 100 nmol/mol to 350 nmol/mol. The nitrogen dioxide gravimetric preparation values provided by VSL were not used as the reference values for the comparison as they do not account for the presence of nitric acid in the standards, arising from the conversion of NO2 to nitric acid through the reaction with oxygen and residual water in the cylinders. The current hypothesis is that the water must have been present on the cylinder coatings. In the current version of the report, laboratory results are compared to BIPM values, since they correctly account for the presence of nitric acid in the gas mixtures. Furthermore, the agreement between the summation of nitric acid and nitrogen dioxide mole fractions with the initial amount of nitrogen dioxide (prior to any reaction) expected from static gravimetric preparation values further confirms the hypothesis of the loss mechanism of NO2 in the cylinders. For each cylinder, the reference value is the NO2 mole fraction assigned by the BIPM (first measurement). Following the CCQM GAWG guidance, it was decided that the standard uncertainty of the reference value (xref) was to be calculated from the following equation
222
2 ))(())(())((2 DriftLossesNOBIPMNOref xuxuxuxu (1)
where )( BIPMxu is the uncertainty associated with the value assigned by the BIPM,
)( 2LossesNOxu the uncertainty contribution due to NO2 losses equivalent to 5.7 nmol/mol
and )( Driftxu the uncertainty contribution due to observed drift in NO2 estimated to be
21 nmol/mol. This leads to an overall standard uncertainty of the reference value of 0.041 μmol/mol. A full discussion of the uncertainty of the reference value is included in the report International comparison CCQM-K74: Nitrogen dioxide, 10μmol/mol. The permeation of nitric acid from NO2 permeation tubes was detected and quantified by the BIPM, and the BIPM’s values are corrected to avoid systematic errors caused by this issue. This is fully described in ANNEX 1- BIPM Value assignment procedure.
6. Measurement protocol The measurement protocol requested participants to use FT-IR spectroscopy methods calibrated and traceable to gas standards. Likewise, it was requested that participants provide the value and uncertainty of the nitrogen dioxide mole fraction measured by the laboratory, a complete uncertainty budget and a description of their gas analysis procedure. The participant’s reports are included in ANNEX 2 - Measurement reports of participants.
A comparison of nitrogen dioxide (NO2) in nitrogen standards at 10 μmol/mol by Fourier Transform Infrared Spectroscopy (FT-IR) Page 18 of 76
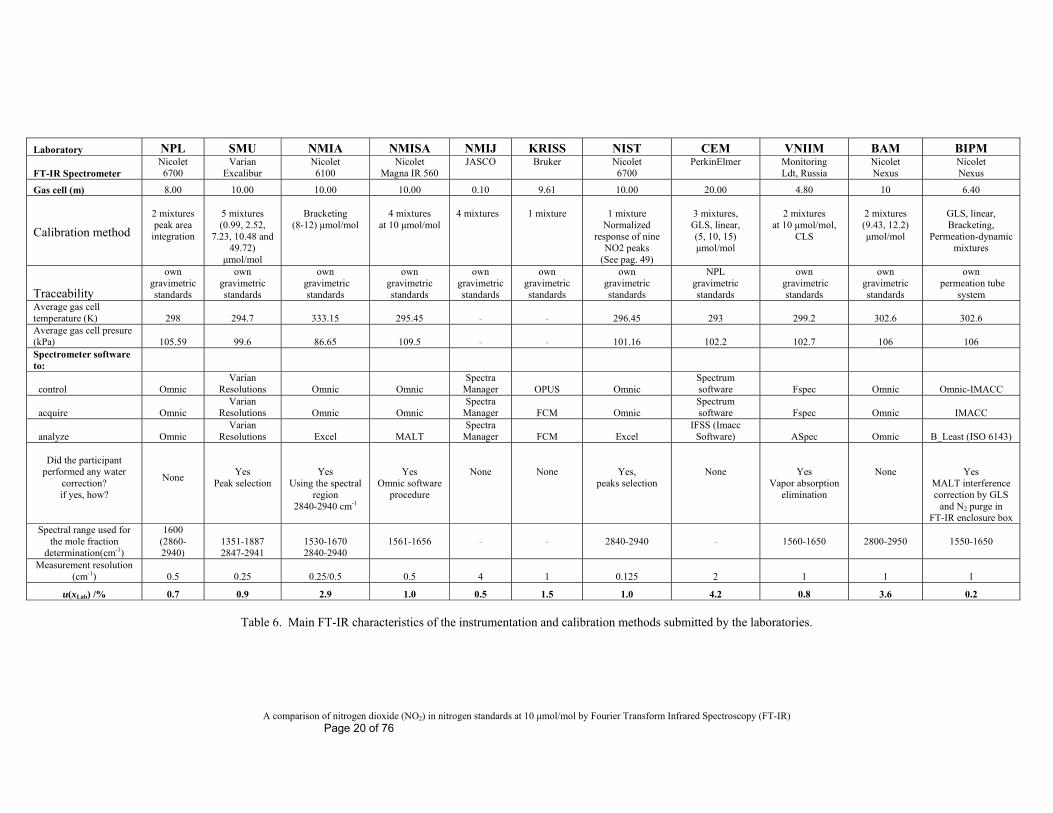
7. Measurement methods As mentioned above, the protocol for this pilot study required participants to use FT-IR spectroscopy. Table 6 summarizes the main characteristics of the instrumentation and calibration methods need by each laboratory. From Table 6 we can conclude that:
- five of the ten participating laboratories used Nicolet spectrometers and Omnic acquisition software;
- of the participating laboratories nine used gas mixtures contained in high pressure cylinders as calibration references and just the BIPM used mixtures from its permeation facility;
- of the ten laboratories using gas mixtures as standards nine were traceable to their own gravimetric standards
- nearly all participants measured their gas mixtures near ambient conditions (297 K and ~100 kPa);
- more than half of the participants performed water corrections; - half of the participants used a spectral region within the range (1500-1800)
cm-1 and half used the spectral region within the range (2800-300) cm-1 or both;
- the resolution range used by the participants was (0.25 to 4) cm-1; and - eight of the ten participating laboratories used an optical path length between
the range of (4.8-10) m, one 0.1m and one 20 m; and - two of the ten participating laboratories confirmed the presence of nitric acid
in their gas mixture.
8 Results
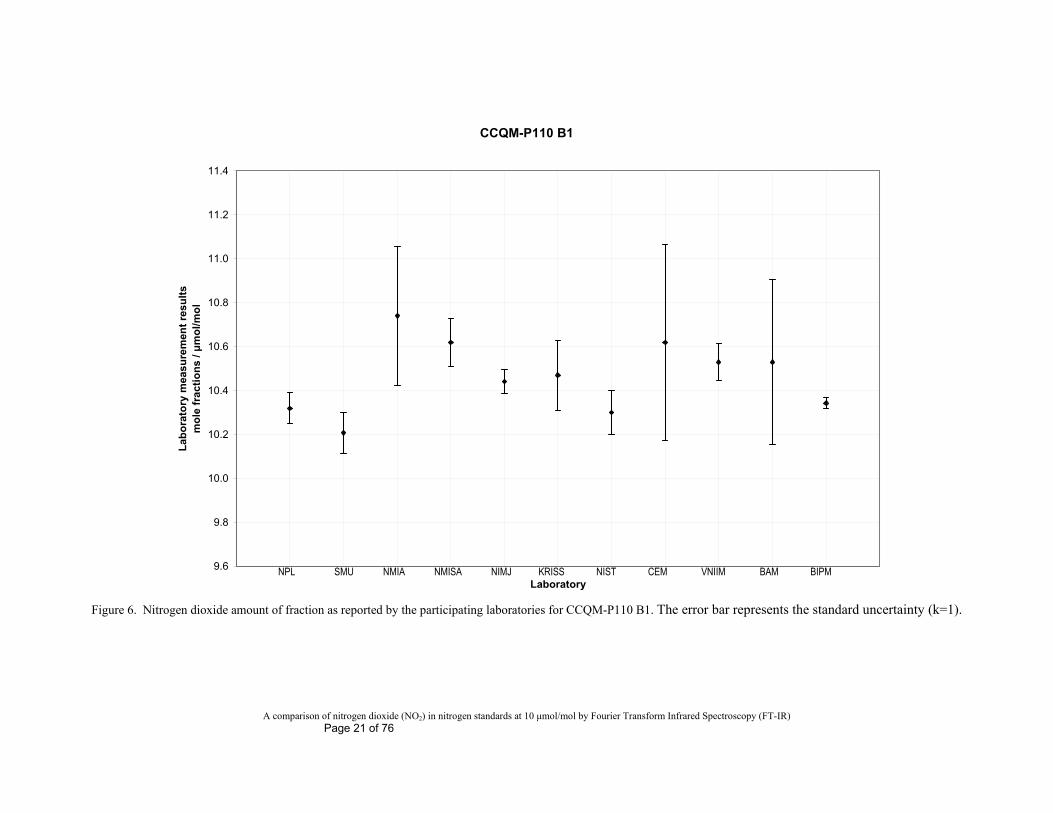
The results submitted by the participants are plotted in Figure 6. The evaluation of the level of consistency between the participating laboratories was done by comparison between the reported nitrogen dioxide mole fractions by participating laboratories and the BIPM FT-IR measurements (1st series) for each cylinder.
The consistency between the participating laboratory’s results and the BIPM reference values is presented in terms of a difference (D) defined as: refNMI xxD (2)
where NMIx denotes the amount of substance fraction as measured by the participating
national metrology institute (NMI) and refx the reference value given by the BIPM.
The standard uncertainty in D is:
22)( refNMI uuDu (3)
and the expanded uncertainty at 95% confidence level
A comparison of nitrogen dioxide (NO2) in nitrogen standards at 10 μmol/mol by Fourier Transform Infrared Spectroscopy (FT-IR) Page 19 of 76
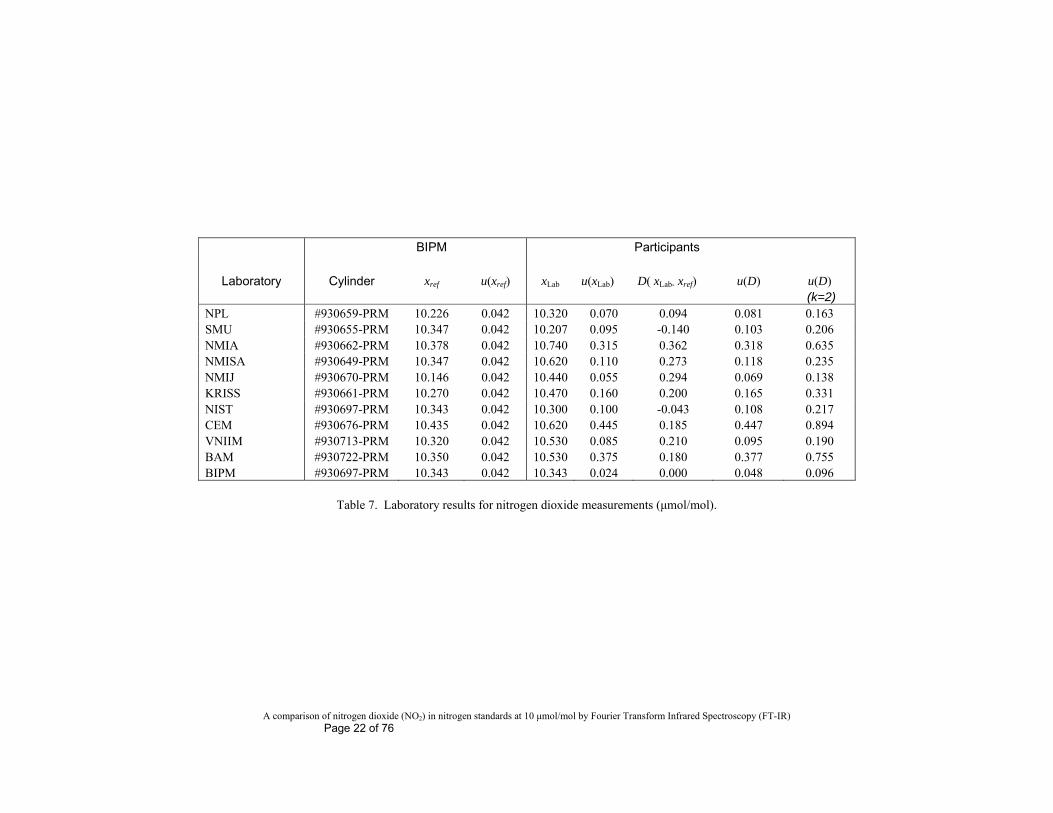
)()( DukDU (4) where k denotes the coverage factor, taken as k = 2 (normal distribution, approximately 95% level of confidence). The differences between BIPM and NMI’s assigned values for each of the circulated gas standards are listed in Table 7 where: Laboratory is the acronym of the participating national metrology institute;
Cylinder the identification code of the cylinder received by the participating laboratory;
xref the reference value (1st series of BIPM measurement results);
u(xref) the uncertainty of the reference value;;
xLab the result as reported by the participating laboratory;
u(xLab) the standard uncertainty of the reported value xLab as reported by the participating laboratory ;
D the difference in amount of substance fraction as measured by the laboratory and BIPMx the BIPM value; and
u(D) the standard uncertainty of the difference of amount of substance;
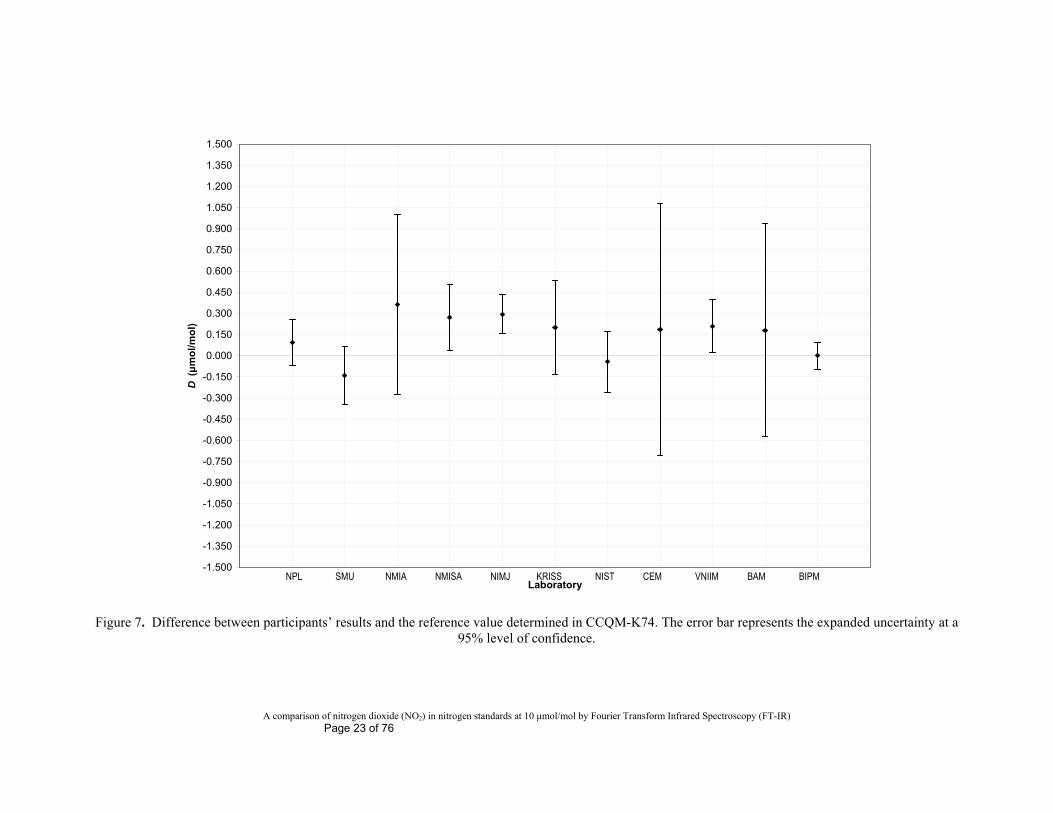
The difference (D) in nitrogen dioxide reported values by participating laboratories and the BIPM are plotted in Figure 7. In this figure, the result attributed to the BIPM is based on the second analysis of a particular cylinder (#930697-PRM), using the first measurement made on this gas mixture as reference value.The method used by the BIPM to calculated its uncertainty value, u(xLab), is carefully described elsewhere(1).
A comparison of nitrogen dioxide (NO2) in nitrogen standards at 10 μmol/mol by Fourier Transform Infrared Spectroscopy (FT-IR) Page 20 of 76
Laboratory NPL SMU NMIA NMISA NMIJ KRISS NIST CEM VNIIM BAM BIPM
FT-IR Spectrometer Nicolet 6700
Varian Excalibur
Nicolet 6100
Nicolet Magna IR 560
JASCO
Bruker
Nicolet 6700
PerkinElmer
Monitoring Ldt, Russia
Nicolet Nexus
Nicolet Nexus
Gas cell (m) 8.00 10.00 10.00 10.00 0.10 9.61 10.00 20.00 4.80 10 6.40
Calibration method
2 mixtures peak area
integration
5 mixtures (0.99, 2.52,
7.23, 10.48 and 49.72)
μmol/mol
Bracketing (8-12) μmol/mol
4 mixtures at 10 μmol/mol
4 mixtures
1 mixture
1 mixture Normalized
response of nine NO2 peaks
(See pag. 49)
3 mixtures, GLS, linear, (5, 10, 15) μmol/mol
2 mixtures at 10 μmol/mol,
CLS
2 mixtures (9.43, 12.2) μmol/mol
GLS, linear, Bracketing,
Permeation-dynamic mixtures
Traceability
own gravimetric standards
own gravimetric standards
own gravimetric
standards
own gravimetric standards
own gravimetric standards
own gravimetric standards
own gravimetric standards
NPL gravimetric standards
own gravimetric
standards
own gravimetric standards
own permeation tube
system Average gas cell temperature (K) 298 294.7 333.15 295.45 - - 296.45 293 299.2 302.6 302.6 Average gas cell presure (kPa) 105.59 99.6 86.65 109.5 - - 101.16 102.2 102.7 106 106 Spectrometer software to:
control Omnic Varian
Resolutions Omnic Omnic Spectra
Manager OPUS Omnic Spectrum software Fspec Omnic Omnic-IMACC
acquire Omnic Varian
Resolutions Omnic Omnic Spectra
Manager FCM Omnic Spectrum software Fspec Omnic IMACC
analyze Omnic Varian
Resolutions Excel MALT Spectra
Manager FCM Excel IFSS (Imacc
Software) ASpec Omnic B_Least (ISO 6143)
Did the participant performed any water
correction? if yes, how?
None
Yes Peak selection
Yes
Using the spectral region
2840-2940 cm-1
Yes Omnic software
procedure
None
None
Yes, peaks selection
None
Yes Vapor absorption
elimination
None
Yes MALT interference correction by GLS
and N2 purge in FT-IR enclosure box
Spectral range used for the mole fraction
determination(cm-1)
1600 (2860-2940)
1351-1887 2847-2941
1530-1670 2840-2940
1561-1656
-
-
2840-2940
-
1560-1650
2800-2950
1550-1650
Measurement resolution (cm-1) 0.5 0.25 0.25/0.5 0.5 4 1 0.125 2 1 1 1
u(xLab) /% 0.7 0.9 2.9 1.0 0.5 1.5 1.0 4.2 0.8 3.6 0.2
Table 6. Main FT-IR characteristics of the instrumentation and calibration methods submitted by the laboratories.
A comparison of nitrogen dioxide (NO2) in nitrogen standards at 10 μmol/mol by Fourier Transform Infrared Spectroscopy (FT-IR) Page 21 of 76
CCQM-P110 B1
9.6
9.8
10.0
10.2
10.4
10.6
10.8
11.0
11.2
11.4
Laboratory
Lab
ora
tory
mea
sure
men
t re
sult
s m
ole
fra
ctio
ns
/ μm
ol/
mo
l
NPL SMU NMIA NMISA NIMJ KRISS NIST CEM VNIIM BAM BIPM
Figure 6. Nitrogen dioxide amount of fraction as reported by the participating laboratories for CCQM-P110 B1. The error bar represents the standard uncertainty (k=1).
A comparison of nitrogen dioxide (NO2) in nitrogen standards at 10 μmol/mol by Fourier Transform Infrared Spectroscopy (FT-IR) Page 22 of 76
Table 7. Laboratory results for nitrogen dioxide measurements (μmol/mol).
BIPM Participants
Laboratory Cylinder xref u(xref) xLab u(xLab) D( xLab- xref) u(D) u(D) (k=2)
NPL #930659-PRM 10.226 0.042 10.320 0.070 0.094 0.081 0.163 SMU #930655-PRM 10.347 0.042 10.207 0.095 -0.140 0.103 0.206 NMIA #930662-PRM 10.378 0.042 10.740 0.315 0.362 0.318 0.635 NMISA #930649-PRM 10.347 0.042 10.620 0.110 0.273 0.118 0.235 NMIJ #930670-PRM 10.146 0.042 10.440 0.055 0.294 0.069 0.138 KRISS #930661-PRM 10.270 0.042 10.470 0.160 0.200 0.165 0.331 NIST #930697-PRM 10.343 0.042 10.300 0.100 -0.043 0.108 0.217 CEM #930676-PRM 10.435 0.042 10.620 0.445 0.185 0.447 0.894 VNIIM #930713-PRM 10.320 0.042 10.530 0.085 0.210 0.095 0.190 BAM #930722-PRM 10.350 0.042 10.530 0.375 0.180 0.377 0.755 BIPM #930697-PRM 10.343 0.042 10.343 0.024 0.000 0.048 0.096
A comparison of nitrogen dioxide (NO2) in nitrogen standards at 10 μmol/mol by Fourier Transform Infrared Spectroscopy (FT-IR) Page 23 of 76
-1.500
-1.350
-1.200
-1.050
-0.900
-0.750
-0.600
-0.450
-0.300
-0.150
0.000
0.150
0.300
0.450
0.600
0.750
0.900
1.050
1.200
1.350
1.500
Laboratory
D (μm
ol/m
ol)
NPL SMU NMIA NMISA NIMJ KRISS NIST CEM VNIIM BAM BIPM
Figure 7. Difference between participants’ results and the reference value determined in CCQM-K74. The error bar represents the expanded uncertainty at a
95% level of confidence.
A comparison of nitrogen dioxide (NO2) in nitrogen standards at 10 μmol/mol by Fourier Transform Infrared Spectroscopy (FT-IR) Page 24 of 76
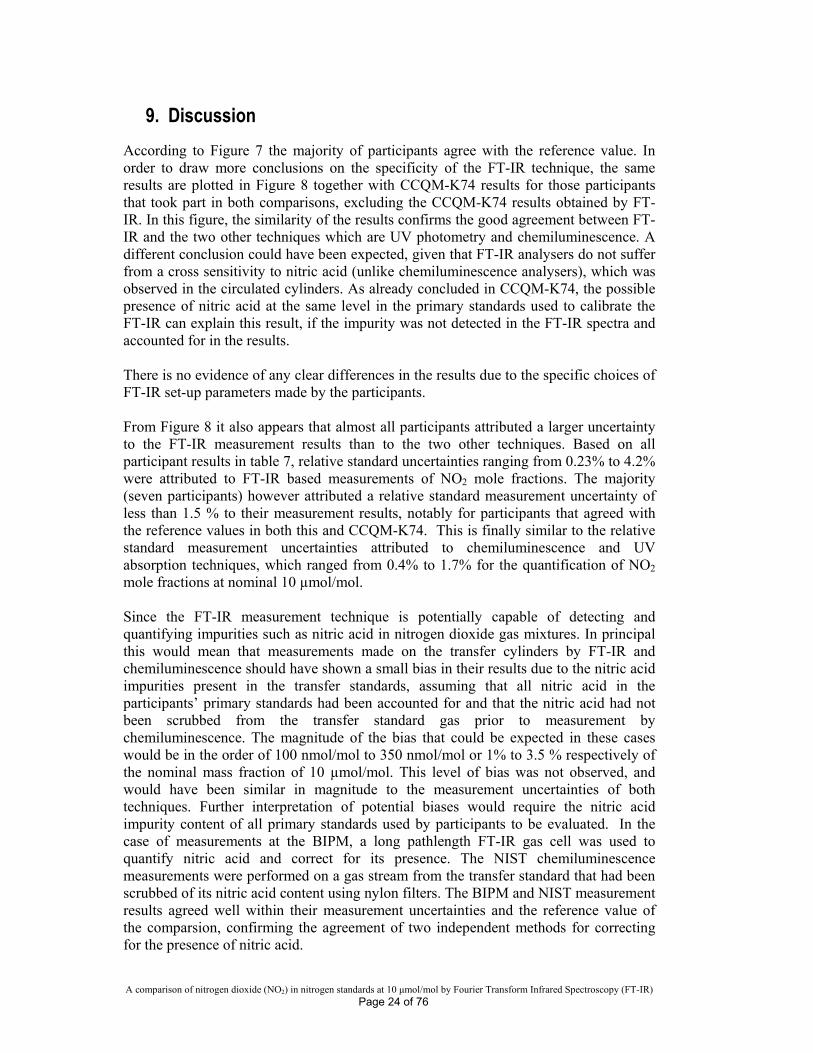
9. Discussion
According to Figure 7 the majority of participants agree with the reference value. In order to draw more conclusions on the specificity of the FT-IR technique, the same results are plotted in Figure 8 together with CCQM-K74 results for those participants that took part in both comparisons, excluding the CCQM-K74 results obtained by FT-IR. In this figure, the similarity of the results confirms the good agreement between FT-IR and the two other techniques which are UV photometry and chemiluminescence. A different conclusion could have been expected, given that FT-IR analysers do not suffer from a cross sensitivity to nitric acid (unlike chemiluminescence analysers), which was observed in the circulated cylinders. As already concluded in CCQM-K74, the possible presence of nitric acid at the same level in the primary standards used to calibrate the FT-IR can explain this result, if the impurity was not detected in the FT-IR spectra and accounted for in the results. There is no evidence of any clear differences in the results due to the specific choices of FT-IR set-up parameters made by the participants. From Figure 8 it also appears that almost all participants attributed a larger uncertainty to the FT-IR measurement results than to the two other techniques. Based on all participant results in table 7, relative standard uncertainties ranging from 0.23% to 4.2% were attributed to FT-IR based measurements of NO2 mole fractions. The majority (seven participants) however attributed a relative standard measurement uncertainty of less than 1.5 % to their measurement results, notably for participants that agreed with the reference values in both this and CCQM-K74. This is finally similar to the relative standard measurement uncertainties attributed to chemiluminescence and UV absorption techniques, which ranged from 0.4% to 1.7% for the quantification of NO2 mole fractions at nominal 10 µmol/mol. Since the FT-IR measurement technique is potentially capable of detecting and quantifying impurities such as nitric acid in nitrogen dioxide gas mixtures. In principal this would mean that measurements made on the transfer cylinders by FT-IR and chemiluminescence should have shown a small bias in their results due to the nitric acid impurities present in the transfer standards, assuming that all nitric acid in the participants’ primary standards had been accounted for and that the nitric acid had not been scrubbed from the transfer standard gas prior to measurement by chemiluminescence. The magnitude of the bias that could be expected in these cases would be in the order of 100 nmol/mol to 350 nmol/mol or 1% to 3.5 % respectively of the nominal mass fraction of 10 µmol/mol. This level of bias was not observed, and would have been similar in magnitude to the measurement uncertainties of both techniques. Further interpretation of potential biases would require the nitric acid impurity content of all primary standards used by participants to be evaluated. In the case of measurements at the BIPM, a long pathlength FT-IR gas cell was used to quantify nitric acid and correct for its presence. The NIST chemiluminescence measurements were performed on a gas stream from the transfer standard that had been scrubbed of its nitric acid content using nylon filters. The BIPM and NIST measurement results agreed well within their measurement uncertainties and the reference value of the comparsion, confirming the agreement of two independent methods for correcting for the presence of nitric acid.
A comparison of nitrogen dioxide (NO2) in nitrogen standards at 10 μmol/mol by Fourier Transform Infrared Spectroscopy (FT-IR) Page 25 of 76
-1.50
-1.20
-0.90
-0.60
-0.30
0.00
0.30
0.60
0.90
1.20
1.50
Laboratory
D (μm
ol/
mo
l)
CCQM-P110 B1 (FT-IR) CCQM-K74
NPL SMU NMISA KRISS NIST CEM VNIIM
CLD
CLD
CLD CLD
UV
CLD
CLD
Figure 8. Difference between participant results and the reference values in this pilot study and in the key comparison CCQM-K74. The error bars represents the expanded uncertainty at a 95% level of confidence. The measurement techniques used by participants for CCQM-K74 were: NPL; UV photometry. SMU, NMISA, KRISS, NIST, CEM and VNIIM; Chemiluminescence
A comparison of nitrogen dioxide (NO2) in nitrogen standards at 10 μmol/mol by Fourier Transform Infrared Spectroscopy (FT-IR) Page 26 of 76
10. Conclusion
The results of this pilot study indicate good consistency for the measurements against in-house standards by FT-IR spectroscopy. The level of agreement between participants is very similar to that reported in CCQM -K74 for which CLD and UV methods were used. In addition, the relative standard uncertainties attributed to the FT-IR measurement results in this study reached similar values as those reported for the chemiluminescence and UV absorption techniques in CCQM-K74. This confirms that FT-IR can be operated as a comparison method when calibrated with appropriate gas standards for nitrogen dioxide measurements at the μmol/mol level, and can achieve similar measurement uncertainties to chemiluminescence and UV absorption techniques. The pilot study reported here addressed nitrogen dioxide at a relatively low amount fraction, the measurement of which can be subject to spectral interference. This choice was made in order to show the performance of FT-IR as a comparison method for a compound at a low amount fraction, and under conditions where some spectral interface is present. Very many measurements of standard gas mixtures are made at significantly higher amount fractions, and in mixtures for which there is no significant spectral interference. We expect the performance of FT-IR spectroscopy as a comparison method under such conditions to be as good as is reported here, and in some cases better. An additional pilot study (CCQM-P110-B2) was conducted on the same gas mixtures in parallel with this pilot study. The second study addressed FT-IR spectroscopy when used to measure the gas mixtures with respect to reference spectra. The results of this second study will be reported elsewhere.
A comparison of nitrogen dioxide (NO2) in nitrogen standards at 10 μmol/mol by Fourier Transform Infrared Spectroscopy (FT-IR) Page 27 of 76
ANNEX 1- BIPM Value assignment procedure
1. Description of the facility
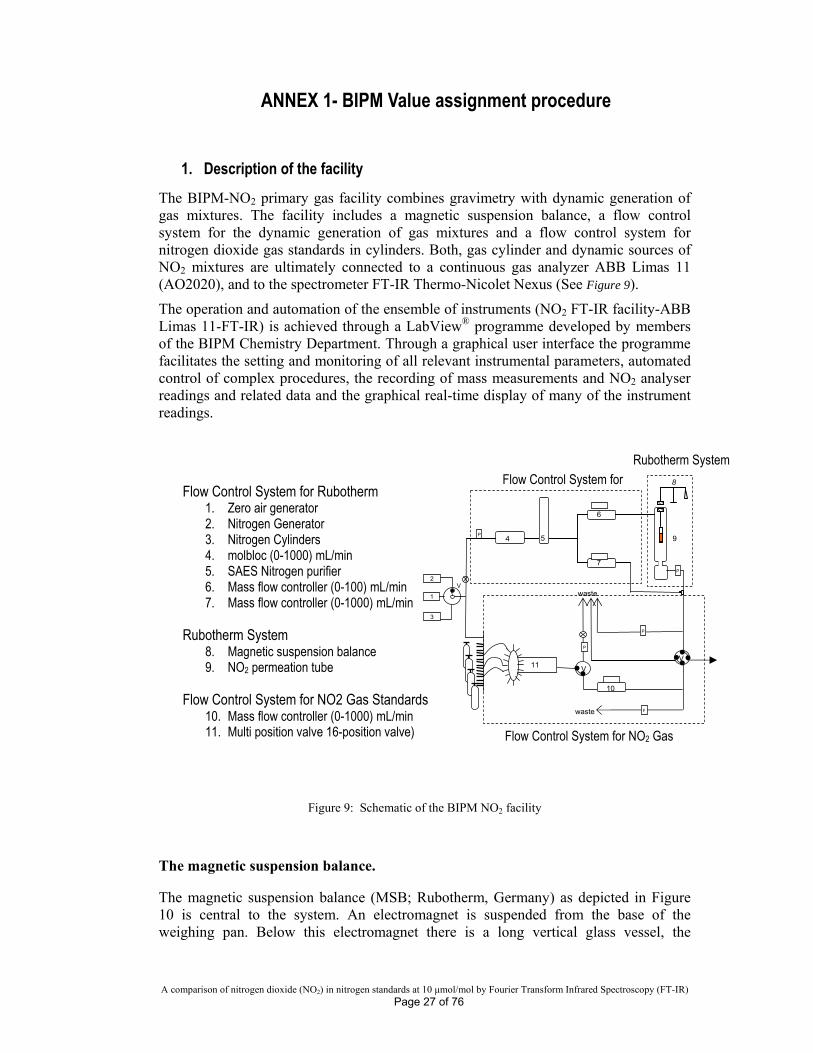
The BIPM-NO2 primary gas facility combines gravimetry with dynamic generation of gas mixtures. The facility includes a magnetic suspension balance, a flow control system for the dynamic generation of gas mixtures and a flow control system for nitrogen dioxide gas standards in cylinders. Both, gas cylinder and dynamic sources of NO2 mixtures are ultimately connected to a continuous gas analyzer ABB Limas 11 (AO2020), and to the spectrometer FT-IR Thermo-Nicolet Nexus (See Figure 9).
The operation and automation of the ensemble of instruments (NO2 FT-IR facility-ABB Limas 11-FT-IR) is achieved through a LabView® programme developed by members of the BIPM Chemistry Department. Through a graphical user interface the programme facilitates the setting and monitoring of all relevant instrumental parameters, automated control of complex procedures, the recording of mass measurements and NO2 analyser readings and related data and the graphical real-time display of many of the instrument readings.
Figure 9: Schematic of the BIPM NO2 facility
The magnetic suspension balance.
The magnetic suspension balance (MSB; Rubotherm, Germany) as depicted in Figure 10 is central to the system. An electromagnet is suspended from the base of the weighing pan. Below this electromagnet there is a long vertical glass vessel, the
Flow Control System for Rubotherm 1. Zero air generator 2. Nitrogen Generator 3. Nitrogen Cylinders 4. molbloc (0-1000) mL/min 5. SAES Nitrogen purifier 6. Mass flow controller (0-100) mL/min 7. Mass flow controller (0-1000) mL/min
Rubotherm System
8. Magnetic suspension balance 9. NO2 permeation tube
Flow Control System for NO2 Gas Standards
10. Mass flow controller (0-1000) mL/min 11. Multi position valve 16-position valve)
4
11
waste
waste
10
V
8Flow Control System for
Flow Control System for NO2 Gas
9
V
P
P
P
P
P
1
V
3
2
6
7
5
Rubotherm System
A comparison of nitrogen dioxide (NO2) in nitrogen standards at 10 μmol/mol by Fourier Transform Infrared Spectroscopy (FT-IR) Page 28 of 76
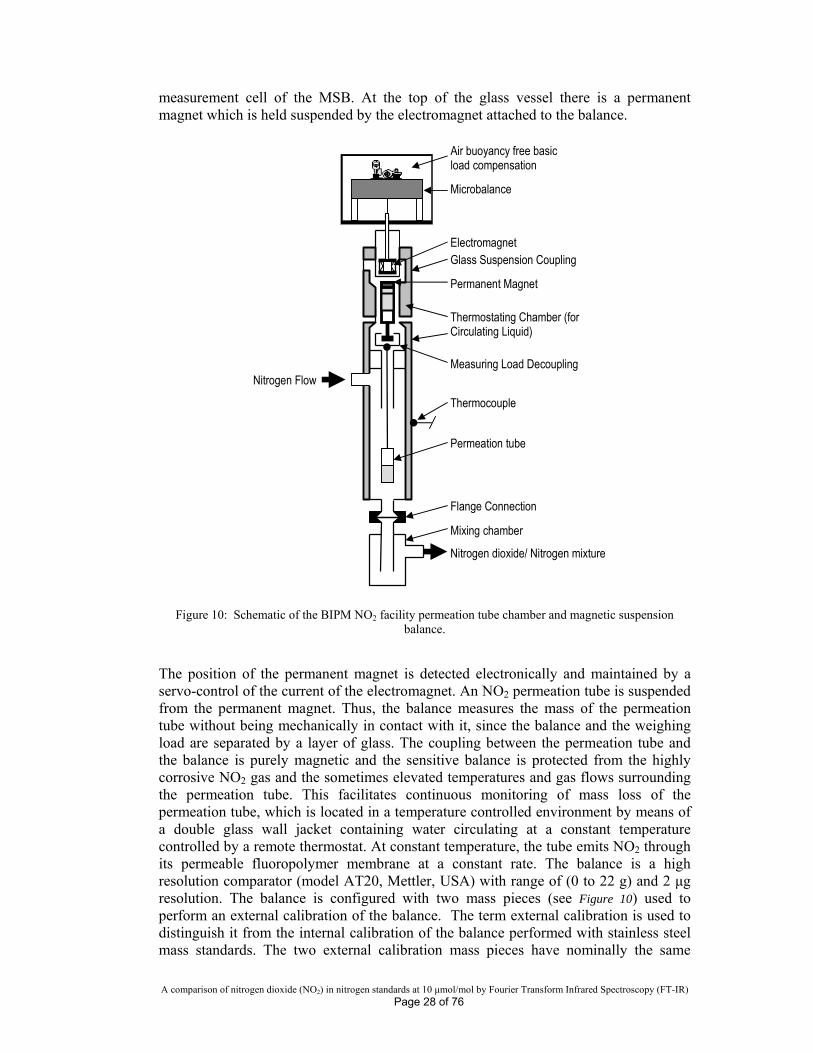
measurement cell of the MSB. At the top of the glass vessel there is a permanent magnet which is held suspended by the electromagnet attached to the balance.
Figure 10: Schematic of the BIPM NO2 facility permeation tube chamber and magnetic suspension balance.
The position of the permanent magnet is detected electronically and maintained by a servo-control of the current of the electromagnet. An NO2 permeation tube is suspended from the permanent magnet. Thus, the balance measures the mass of the permeation tube without being mechanically in contact with it, since the balance and the weighing load are separated by a layer of glass. The coupling between the permeation tube and the balance is purely magnetic and the sensitive balance is protected from the highly corrosive NO2 gas and the sometimes elevated temperatures and gas flows surrounding the permeation tube. This facilitates continuous monitoring of mass loss of the permeation tube, which is located in a temperature controlled environment by means of a double glass wall jacket containing water circulating at a constant temperature controlled by a remote thermostat. At constant temperature, the tube emits NO2 through its permeable fluoropolymer membrane at a constant rate. The balance is a high resolution comparator (model AT20, Mettler, USA) with range of (0 to 22 g) and 2 μg resolution. The balance is configured with two mass pieces (see Figure 10) used to perform an external calibration of the balance. The term external calibration is used to distinguish it from the internal calibration of the balance performed with stainless steel mass standards. The two external calibration mass pieces have nominally the same
Nitrogen Flow
Nitrogen dioxide/ Nitrogen mixture
Electromagnet Glass Suspension Coupling
Permanent Magnet
Thermostating Chamber (for Circulating Liquid)
Measuring Load Decoupling
Flange Connection
Permeation tube
Mixing chamber
Thermocouple
Air buoyancy free basic load compensation
Microbalance
A comparison of nitrogen dioxide (NO2) in nitrogen standards at 10 μmol/mol by Fourier Transform Infrared Spectroscopy (FT-IR) Page 29 of 76
volume but different mass, as one is made of titanium (Ti) and the other of stainless steel (SS). Briefly, they are used to correct for an effect on the mass measurements arising from changes in the density of the ambient atmosphere surrounding the balance itself. Since it was important to know the mass difference of the Ti and SS pieces with a small uncertainty, they were calibrated in mass and volume in collaboration with the BIPM Mass Department.
The flow control system for the magnetic suspension balance To generate primary mixtures using the MSB, a well characterized flow of NO2-free gas (nitrogen) is required. Once the flow controls system receives a pre-selected gas it delivers two well characterized flows to the balance. The total gas flow is characterized by means of a molbloc®/molbox® facility3, which was calibrated at the LNE. An electronic digital pressure controller is used to maintain the pressure of the incoming gas entering the molbloc at about 2700 hPa that is the optimal pressure to minimize the uncertainty of the molbloc flow measurement (~0.1 %). The gas flow is then introduced to a gas purifier that removes the remaining water and oxygen that may leak into the gas. The gas flow is then divided in two streams, a carrier and a diluent, both regulated by two mass flow controllers (MFC’s). The flow of the carrier stream is set at a constant value, 100 mL/min, mixing with the NO2 emerging at constant rate from the permeation tube. The pressure conditions of the permeation chamber are controlled by an electronic digital pressure to avoid any buoyancy variation. The gas mixture of the carrier line is afterwards diluted by a larger flow, the diluent stream, varied within the range (0.3 to 5) L/min in order to, dynamically, generate primary NO2 mixtures in nitrogen (or air) at various concentrations in the range (1-15) μmol/mol. Permeation tubes with permeation rates in the range (5000-10000) ng/min are used for this purpose. The flow control system for NO2 gas standards
The third module, namely the flow control system for NO2 gas standards, enables comparison between the dynamically generated gas mixtures and cylinder standards of NO2 in nitrogen contained in high pressure cylinders (and, alternatively, comparison between various cylinder mixtures). This comparison is achieved via the response of the NO2 analyser, whether ABB Limas 11 or FT-IR. The continuous gas analyzers ABB Limas 11 (part of the AO2020 series) operates according to the NDUV (Non Dispersive Ultraviolet Absorption) measurement principle. The measuring effect is specific radiation absorption of the measured gas component in the UV spectra region to detect NO2. The FT-IR analyser is a Thermo Nicolet Nexus model enclosed in an isolation box fully described in Section 6.1.
3 A molbox® facility is a support unit for making gas flow measurements using molbloc mass flow elements. The molbox® hardware reads calibration data off the molbloc® facility and measures molbloc® upstream and downstream pressure using built-in high precision Reference Pressure Transducers (RPTs). The key molbloc®L measurement is the differential pressure across the element, which is roughly proportional to the mass flow rate through it. The molbloc® elements are calibrated to be used at an absolute pressure which remains nearly constant, while the differential pressure varies with flow rate.
A comparison of nitrogen dioxide (NO2) in nitrogen standards at 10 μmol/mol by Fourier Transform Infrared Spectroscopy (FT-IR) Page 30 of 76
The flow control system enables the sequential sampling of up to 15 standards contained in cylinders by means of a 16 position valve (MPV-16). V2 is a 4-port 2-position valve. It is used to select which sample stream, from either the MSB or from a cylinder, is directed to the analysers, the other stream being directed to waste, without perturbing the flow of either stream.
2. Measurement protocol of the BIPM
On receipt by the BIPM, all cylinders were allowed to equilibrate at laboratory temperature for one week. All cylinders were rolled for 60 minutes to ensure homogeneity of the mixture.
Each cylinder was connected to one inlet of a 16-inlet automatic gas sampler connected to the FT-IR spectrometer and to the BIPM NO2 dynamic generation facility.
The pressure reducers of each cylinder were flushed nine times with the mixture. The cylinder valves were then closed leaving the high pressure side of the pressure reducer at the cylinder pressure and the low pressure side of the pressure reducer at ~300 kPa. The cylinders were left to stand for at least 24 hours, to allow conditioning of the pressure reducers.
Immediately prior to an analysis, each cylinder valve was opened again and the pressure reducer flushed three times. The suite of cylinders was analysed sequentially.
For the FT-IR spectra acquisition 120 scans were co-added over a period of 2 minutes to provide one single beam spectrum of a sample. This single beam spectrum was then ratioed with a similar spectrum of ultra pure nitrogen collected under similar conditions to provide an absorbance spectrum of the gas sample (relative to ultra pure nitrogen).
For each analyser, a calibration line was evaluated using the Generalised Least Squares approach described by ISO 6143:20014.
The assigned BIPM nitrogen dioxide value was then equal to the predicted value from a calibration line calculated from a set of dynamic nitrogen dioxide primary gas mixtures obtained from the BIPM Nitrogen Dioxide (NO2) Primary Facility.
4 ISO 6143:2001: Gas analysis- Comparison methods for determining and checking the composition of calibration gas mixtures.
A comparison of nitrogen dioxide (NO2) in nitrogen standards at 10 μmol/mol by Fourier Transform Infrared Spectroscopy (FT-IR) Page 31 of 76
3. BIPM measurement uncertainties and analyser response
The mole fractions of the dynamically produced gas mixtures obtained with the BIPM facility was calculated by the expression below:
22
33
2
2
NO
impimp
NO
HNOHNO
NO
mNO M
xM
M
xM
Mq
VPx
v
(5)
where:
2NOx is the NO2 mole fraction in μmol/mol;
P is the NO2 permeation rate in ng/min-1;
Vm = 22.4038 L/mol, is the molar volume of air/N2 at standard conditions (273.15 K, 101.3 kPa);
2NOM = 46.0055 g/mol, is the molar mass of NO2;
qv is the total flow of N2 given by the sum of carrier nitrogen (qv molbloc2) and the diluent nitrogen (Fmolbloc1 and) flows in Ml/min-1 at standard conditions (273.15 K, 101.325 kPa); xHNO3 is the HNO3 mole fraction in μmol/mol measured by FT-IR spectroscopy;
3HNOM = 60.005 g/mol is the molar mass of HNO3;
ximp are the mole fractions of the impurities in μmol/mol measured by FT-IR Spectroscopy; and
impM are the molar mass of the impurities;
Applying the uncertainty propagation law and assuming no correlation between the input quantities the following uncertainty budget was developed:
)()()()()( 2
2
NONO
2
2
NO
NOm
2
2
m
NO2
2
NONO
2 2
2
2
222
2Fu
q
xMu
M
xVu
V
xPu
P
xxu
v
)()()()( 2
2
NO2
2
NO2
2
3
NO2
2
3
NO 22
3
2
3
2
impimp
impimp
HNOHNO
HNOHNO
MuM
xxu
x
xMu
M
xxu
x
x
(6)
The permeation standard uncertainty, considering a permeation device with a permeation equivalent to P ≈ 8357 ng/min, was estimated Pu 4.18 ng/min where
Pu is the probability that the value of P lies within the interval ±6.17 ng/min with rectangular distribution.
The uncertainty in NO2 molar mass of 0.00047 g/mol, 0.001 % relative, can be derived from the IUPAC Table of Atomic Weights.
A comparison of nitrogen dioxide (NO2) in nitrogen standards at 10 μmol/mol by Fourier Transform Infrared Spectroscopy (FT-IR) Page 32 of 76
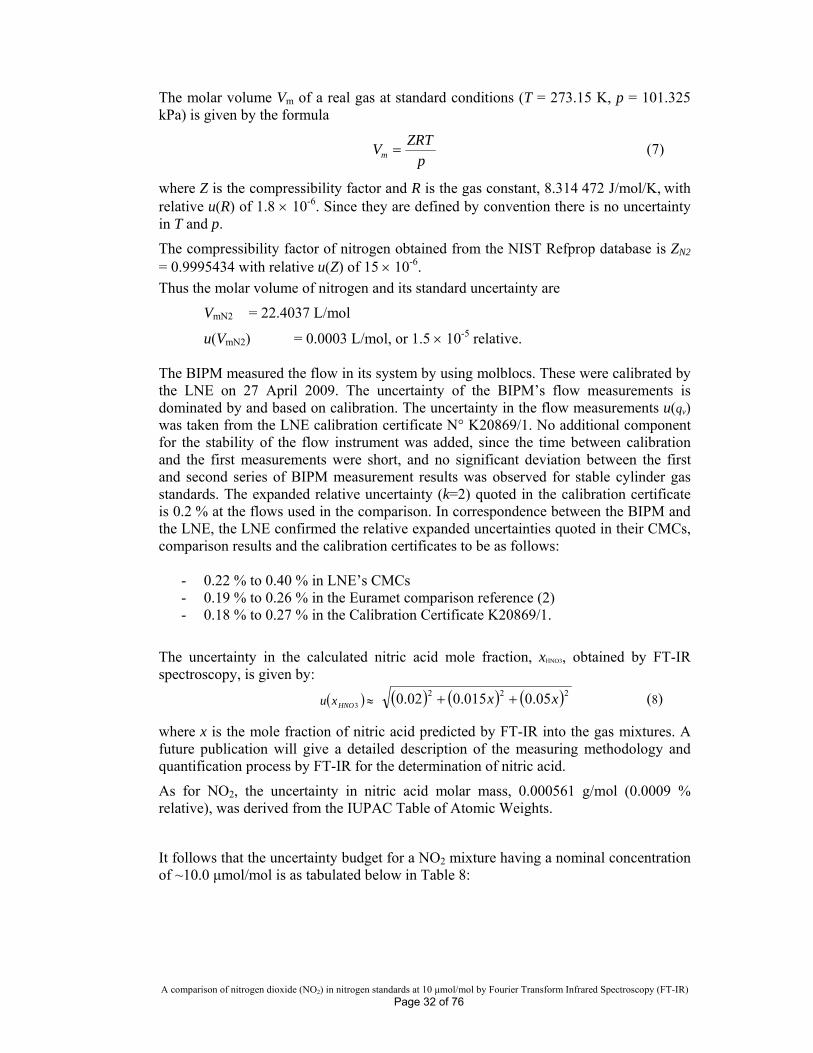
The molar volume Vm of a real gas at standard conditions (T = 273.15 K, p = 101.325 kPa) is given by the formula
p
ZRTVm (7)
where Z is the compressibility factor and R is the gas constant, 8.314 472 J/mol/K, with relative u(R) of 1.8 10-6. Since they are defined by convention there is no uncertainty in T and p.
The compressibility factor of nitrogen obtained from the NIST Refprop database is ZN2 = 0.9995434 with relative u(Z) of 15 10-6.
Thus the molar volume of nitrogen and its standard uncertainty are
VmN2 = 22.4037 L/mol
u(VmN2) = 0.0003 L/mol, or 1.5 10-5 relative. The BIPM measured the flow in its system by using molblocs. These were calibrated by the LNE on 27 April 2009. The uncertainty of the BIPM’s flow measurements is dominated by and based on calibration. The uncertainty in the flow measurements u(qv) was taken from the LNE calibration certificate N° K20869/1. No additional component for the stability of the flow instrument was added, since the time between calibration and the first measurements were short, and no significant deviation between the first and second series of BIPM measurement results was observed for stable cylinder gas standards. The expanded relative uncertainty (k=2) quoted in the calibration certificate is 0.2 % at the flows used in the comparison. In correspondence between the BIPM and the LNE, the LNE confirmed the relative expanded uncertainties quoted in their CMCs, comparison results and the calibration certificates to be as follows:
- 0.22 % to 0.40 % in LNE’s CMCs - 0.19 % to 0.26 % in the Euramet comparison reference (2) - 0.18 % to 0.27 % in the Calibration Certificate K20869/1.
The uncertainty in the calculated nitric acid mole fraction, xHNO3, obtained by FT-IR spectroscopy, is given by:
3HNOxu 222 05.0015.002.0 xx (8)
where x is the mole fraction of nitric acid predicted by FT-IR into the gas mixtures. A future publication will give a detailed description of the measuring methodology and quantification process by FT-IR for the determination of nitric acid.
As for NO2, the uncertainty in nitric acid molar mass, 0.000561 g/mol (0.0009 % relative), was derived from the IUPAC Table of Atomic Weights.
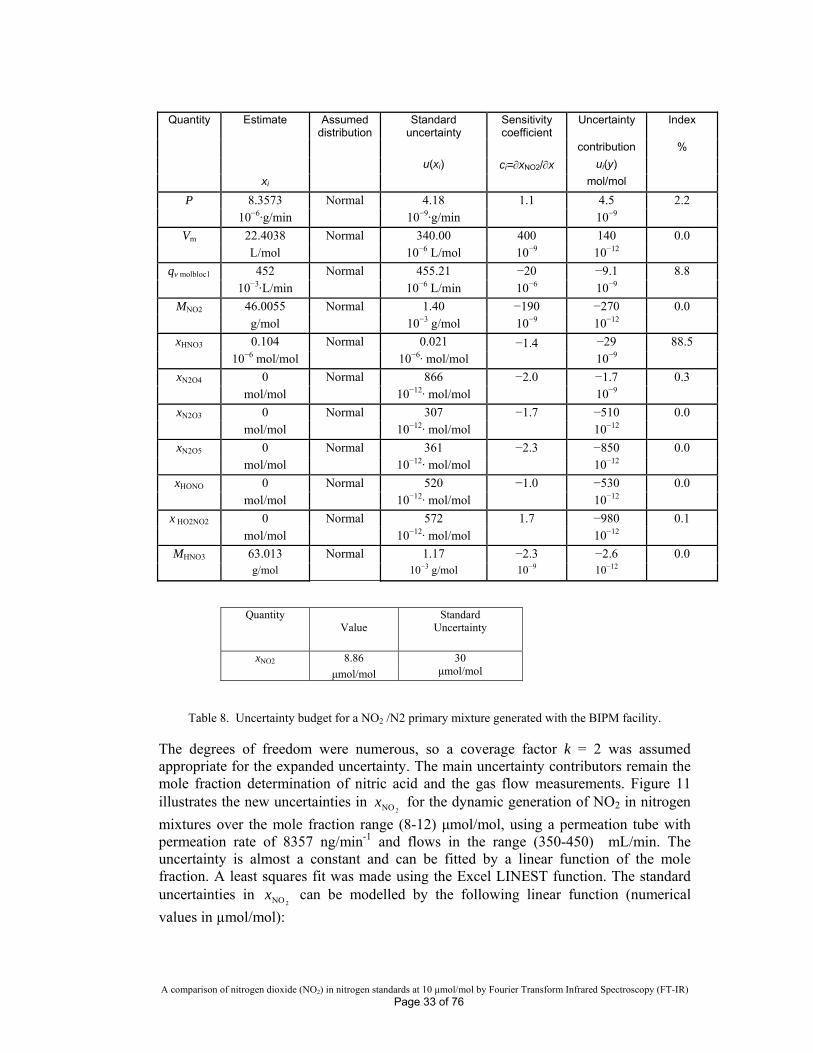
It follows that the uncertainty budget for a NO2 mixture having a nominal concentration of ~10.0 μmol/mol is as tabulated below in Table 8:
A comparison of nitrogen dioxide (NO2) in nitrogen standards at 10 μmol/mol by Fourier Transform Infrared Spectroscopy (FT-IR) Page 33 of 76
Estimate Standard uncertainty
Sensitivity coefficient
Uncertainty Index
contribution %
u(xi) ci=xNO2/x ui(y)
Quantity
xi
Assumed distribution
mol/mol
8.3573 4.18 4.5 P 10−6·g/min
Normal 10−9·g/min
1.1 10−9
2.2
22.4038 340.00 400 140 Vm L/mol
Normal 10−6 L/mol 10−9 10−12
0.0
452 455.21 −20 −9.1 qv molbloc1 10−3·L/min
Normal 10−6 L/min 10−6 10−9
8.8
46.0055 1.40 −190 −270 MNO2 g/mol
Normal 10−3 g/mol 10−9 10−12
0.0
0.104 0.021 −1.4 −29 xHNO3 10−6 mol/mol
Normal 10−6· mol/mol 10−9
88.5
0 866 −2.0 −1.7 xN2O4 mol/mol
Normal 10−12· mol/mol 10−9
0.3
0 307 −1.7 −510 xN2O3 mol/mol
Normal 10−12· mol/mol 10−12
0.0
0 361 −2.3 −850 xN2O5 mol/mol
Normal 10−12· mol/mol 10−12
0.0
0 520 −1.0 −530 xHONO mol/mol
Normal 10−12· mol/mol 10−12
0.0
0 572 1.7 −980 x HO2NO2 mol/mol
Normal 10−12· mol/mol 10−12
0.1
63.013 1.17 −2.3 −2.6 MHNO3 g/mol
Normal 10−3 g/mol 10−9 10−12
0.0
Quantity Value
Standard Uncertainty
xNO2 8.86 30
μmol/mol μmol/mol
Table 8. Uncertainty budget for a NO2 /N2 primary mixture generated with the BIPM facility.
The degrees of freedom were numerous, so a coverage factor k = 2 was assumed appropriate for the expanded uncertainty. The main uncertainty contributors remain the mole fraction determination of nitric acid and the gas flow measurements. Figure 11 illustrates the new uncertainties in
2NOx for the dynamic generation of NO2 in nitrogen
mixtures over the mole fraction range (8-12) μmol/mol, using a permeation tube with permeation rate of 8357 ng/min-1 and flows in the range (350-450) mL/min. The uncertainty is almost a constant and can be fitted by a linear function of the mole fraction. A least squares fit was made using the Excel LINEST function. The standard uncertainties in
2NOx can be modelled by the following linear function (numerical
values in µmol/mol):
A comparison of nitrogen dioxide (NO2) in nitrogen standards at 10 μmol/mol by Fourier Transform Infrared Spectroscopy (FT-IR) Page 34 of 76
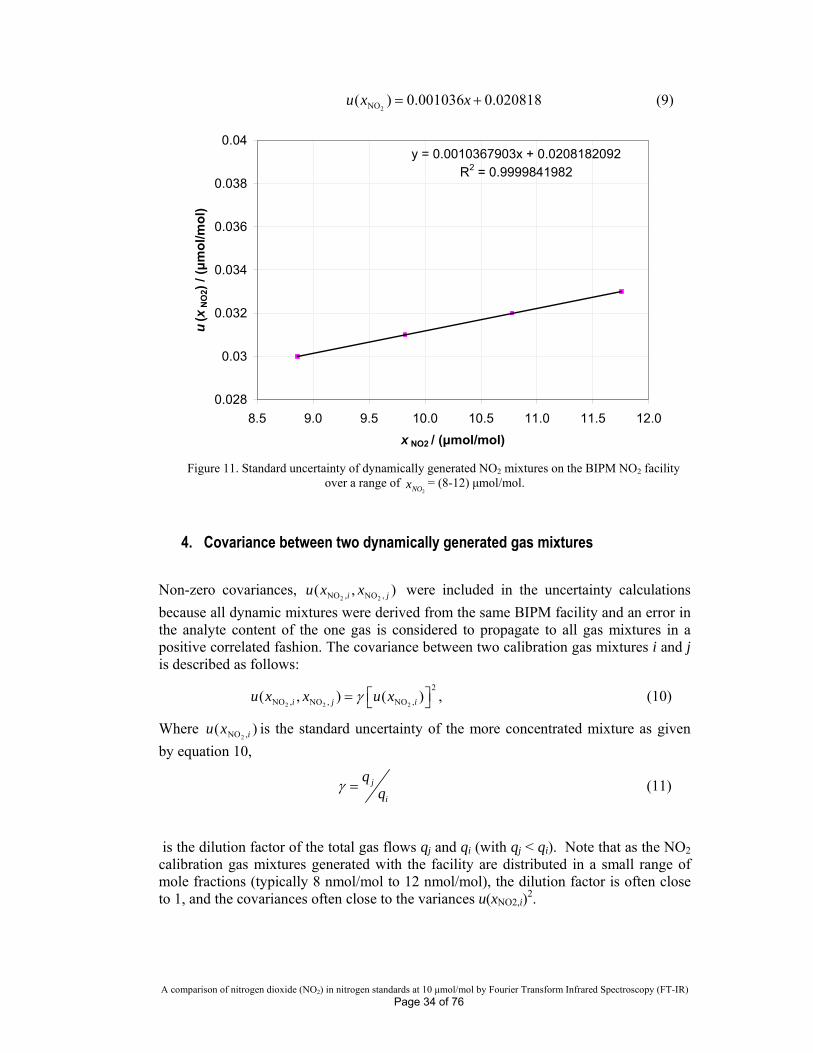
2NO( ) 0.001036 0.020818u x x (9)
y = 0.0010367903x + 0.0208182092
R2 = 0.9999841982
0.028
0.03
0.032
0.034
0.036
0.038
0.04
8.5 9.0 9.5 10.0 10.5 11.0 11.5 12.0
x NO2 / (μmol/mol)
u(x
NO
2)
/ (μm
ol/m
ol)
Figure 11. Standard uncertainty of dynamically generated NO2 mixtures on the BIPM NO2 facility
over a range of 2NOx = (8-12) μmol/mol.
4. Covariance between two dynamically generated gas mixtures
Non-zero covariances, 2 2NO , NO ,( , )i ju x x were included in the uncertainty calculations
because all dynamic mixtures were derived from the same BIPM facility and an error in the analyte content of the one gas is considered to propagate to all gas mixtures in a positive correlated fashion. The covariance between two calibration gas mixtures i and j is described as follows:
2 2 2
2
NO , NO , NO ,( , ) ( )i j iu x x u x , (10)
Where )( ,NO2 ixu is the standard uncertainty of the more concentrated mixture as given
by equation 10,
j
i
qq (11)
is the dilution factor of the total gas flows qj and qi (with qj < qi). Note that as the NO2 calibration gas mixtures generated with the facility are distributed in a small range of mole fractions (typically 8 nmol/mol to 12 nmol/mol), the dilution factor is often close to 1, and the covariances often close to the variances u(xNO2,i)
2.
A comparison of nitrogen dioxide (NO2) in nitrogen standards at 10 μmol/mol by Fourier Transform Infrared Spectroscopy (FT-IR) Page 35 of 76
5. FT-IR analysis of gas standards Analysis of all gas standards was undertaken to quantify nitric acid within the gas standards, and to compare these with the impurities and their uncertainties reported by the participating laboratories.
6. FT-IR Spectra acquisition procedure
A ThemoNicolet Nexus FT-IR spectrometer was configured with a MCT-high D* liquid N2-cooled mid-infrared detector and a 6.4 m pathlength multipass White cell (Gemini Scientific Instruments, USA) for the purposes of quantitative analysis for gas reference standards. The White cell has wetted surfaces of only electropolished stainless steel and gold (mirror coatings) to minimise surface interactions with reactive gas phase species. To keep the internal optical path of the spectrometer free of any interference species this ensemble has been placed in stainless steel enclosure which is constantly purged with ultra high purity nitrogen (dewpoint ~-95°C, i.e. ~200 nmol/mol-1 H2O) flowing at ~15 L/min-1.
The gas sample, from either the Rubotherm MSB or from a high pressure cylinder, flows from the NO2 facility sampling manifold through the White cell, and then to waste. The sample flow rate is controlled immediately downstream of the White cell at ~400 mL/min-1. The sample pressure and temperature are measured on real time by means of a calibrated barometer (Series 6000 Digital Pressure Transducer, Mensor, USA) and a calibrated 100 Ω RTD temperature probe attached to the White cell.
The spectrometer user interface is by means of the IMACC software. IMACC allows the automatic setting of all instrument parameters into Thermo's proprietary Omnic software for the control, spectra acquisition and on-line analysis.
For the acquisition of high quality spectra suitable for quantitative analysis, 120 scans are co-added over a period of 2 minutes to provide one single beam spectrum of a sample. This single beam spectrum was then ratioed with a similar spectrum of ultra pure nitrogen collected under similar conditions to provide an absorbance spectrum of the gas sample (relative to ultra pure nitrogen).
The White cell has a volume of ~750 mL and the sample flows at ~400 mL/min. Assuming perfect mixing in the cell we estimate that an initial sample at time t = 0 s has been 99.9 % replaced after 10 min of flow, and 99.9999 % replaced after 20 min. Accordingly, to ensure complete exchange of sample, spectrum acquisition started at t = 0 but only the measured spectra obtained after flowing the sample through the White cell for 35 min were used for the mole fraction determination. We also empirically verified that after 30 min of flow, the sample was completely exchanged, within the bounds of measurement uncertainty.
The absorbance spectra of gas reference standards obtained following this procedure had a very high signal: noise ratio, with the level of noise in the baseline being typically ~2 × 10⁻⁴ abs10 peak-peak. By comparison the main NO2 peak had absorbance in the range (0.04-0.16) abs10.
A comparison of nitrogen dioxide (NO2) in nitrogen standards at 10 μmol/mol by Fourier Transform Infrared Spectroscopy (FT-IR) Page 36 of 76
As the FT-IR was calibrated with our permeation device, its sole contributing uncertainty component is the type A uncertainty. From times series analysis the uncertainty in the response of the FT-IR spectrometer was estimated in 20 nmol/mol for 2 min averaging time.
7. Quantitative analysis of nitric acid
The determination of nitric acid was assessed configuring the FT-IR facility with a multi pass white cells with an optical path of (48±1.2) m. Spectra were analysed by a non-linear least-square fitting of the measured absorption spectra with synthetic spectra using the program MALT4.4. This program included the calculation of synthetic spectra from the HITRAN database of infrared absorption line parameters using the core of the program MALT (an acronym for Multiple Atmospheric Layer Transmission) software developed at the University of Wollongong described in detail by Griffith in 1996(3). The program convolved a stick spectrum calculated from the line parameters with the temperature, pressure, path length, resolution and instrument line shape function specified by the user. Spectra were calculated iteratively from an initial estimate of all input parameters following a modified Levenberg-Marquart algorithm until a least squares best fit to the measured spectrum was obtained. Gas concentrations in the sample were iteratively adjusted during the fit. The quality of the fit could be improved by choosing a proper spectra window of the measured spectrum. Spectra which had been acquired across a total wavelength range of (1660-1850) cm-1 were fitted on spectral windows according to the impurities of interest, in this case nitric acid.
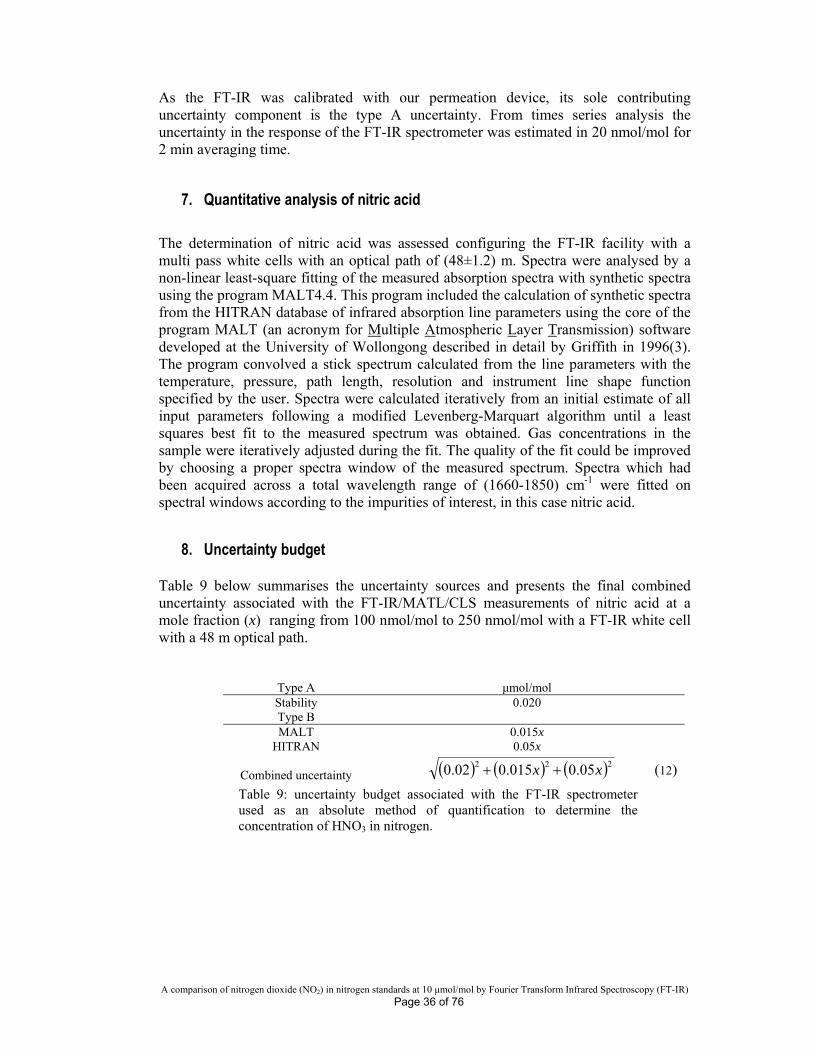
8. Uncertainty budget Table 9 below summarises the uncertainty sources and presents the final combined uncertainty associated with the FT-IR/MATL/CLS measurements of nitric acid at a mole fraction (x) ranging from 100 nmol/mol to 250 nmol/mol with a FT-IR white cell with a 48 m optical path.
Type A μmol/mol Stability 0.020 Type B MALT 0.015x
HITRAN 0.05x
Combined uncertainty 222 05.0015.002.0 xx (12)
Table 9: uncertainty budget associated with the FT-IR spectrometer used as an absolute method of quantification to determine the concentration of HNO3 in nitrogen.
A comparison of nitrogen dioxide (NO2) in nitrogen standards at 10 μmol/mol by Fourier Transform Infrared Spectroscopy (FT-IR) Page 37 of 76
9. Regression analysis
The procedure outlined in ISO 6143:2001 (Gas analysis-Comparison methods for determining and checking the composition of calibration gas mixtures) was used for the analysis of the data from the comparison. This required:
- the determination of the analysis function x=G(y) which expressed analyte contents in relation to corresponding measured responses;
- the validation of the analysis function; and
- the prediction of the mole fraction values from the measured responses and comparison to VSL and NMI’s values.
10. Determination and validation of analysis functions All calculations were performed with B_LEAST, a computer programme which implemented the methodology of ISO 6143:2001, and takes into consideration uncertainties in both axes for regression analysis.
Validation studies performed by the BIPM to be published shortly will confirm the linearity of the FT-IR response in the xNO2 range (4.5-15.5) μmol/mol.
A comparison of nitrogen dioxide (NO2) in nitrogen standards at 10 μmol/mol by Fourier Transform Infrared Spectroscopy (FT-IR) Page 38 of 76
ANNEX 2 - Measurement reports of participants
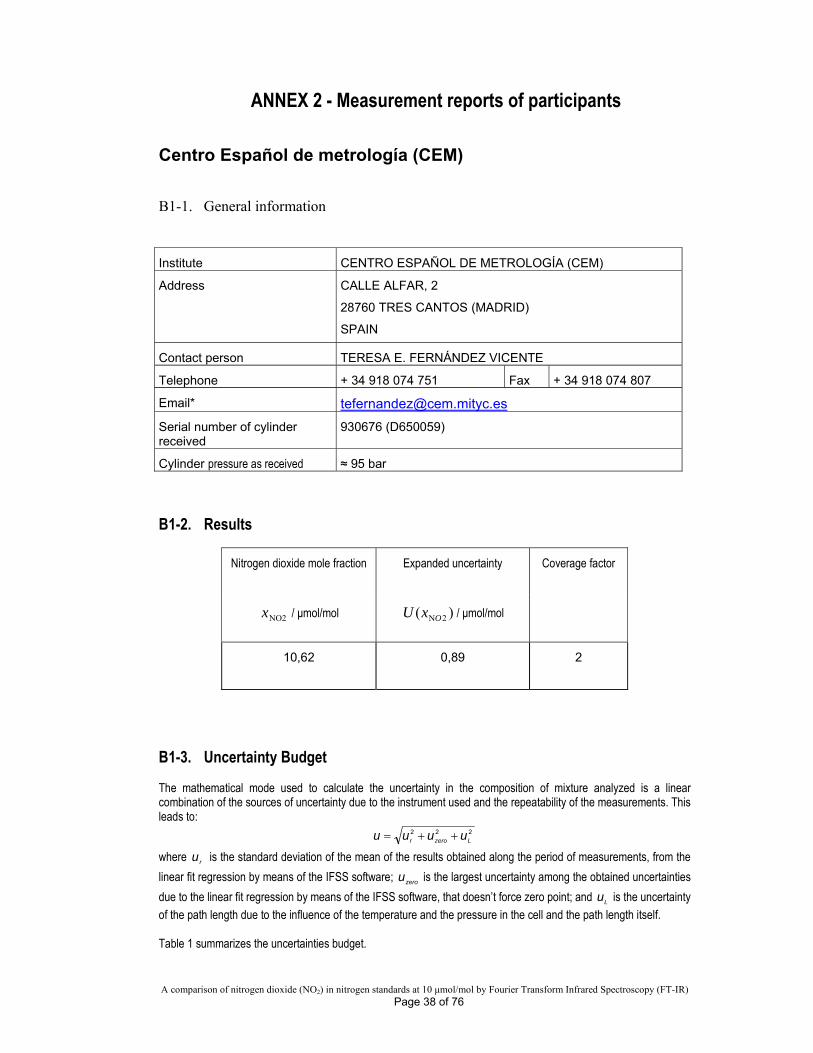
Centro Español de metrología (CEM) B1-1. General information
Institute CENTRO ESPAÑOL DE METROLOGÍA (CEM)
Address CALLE ALFAR, 2
28760 TRES CANTOS (MADRID)
SPAIN
Contact person TERESA E. FERNÁNDEZ VICENTE
Telephone + 34 918 074 751 Fax + 34 918 074 807
Email* [email protected]
Serial number of cylinder received
930676 (D650059)
Cylinder pressure as received ≈ 95 bar
B1-2. Results
Nitrogen dioxide mole fraction Expanded uncertainty Coverage factor
NO2x / μmol/mol )( 2NOxU / μmol/mol
10,62 0,89 2
B1-3. Uncertainty Budget The mathematical mode used to calculate the uncertainty in the composition of mixture analyzed is a linear combination of the sources of uncertainty due to the instrument used and the repeatability of the measurements. This leads to:
222
Lzeror uuuu
where ru is the standard deviation of the mean of the results obtained along the period of measurements, from the
linear fit regression by means of the IFSS software; zerou is the largest uncertainty among the obtained uncertainties
due to the linear fit regression by means of the IFSS software, that doesn’t force zero point; and Lu is the uncertainty of the path length due to the influence of the temperature and the pressure in the cell and the path length itself. Table 1 summarizes the uncertainties budget.
A comparison of nitrogen dioxide (NO2) in nitrogen standards at 10 μmol/mol by Fourier Transform Infrared Spectroscopy (FT-IR) Page 39 of 76
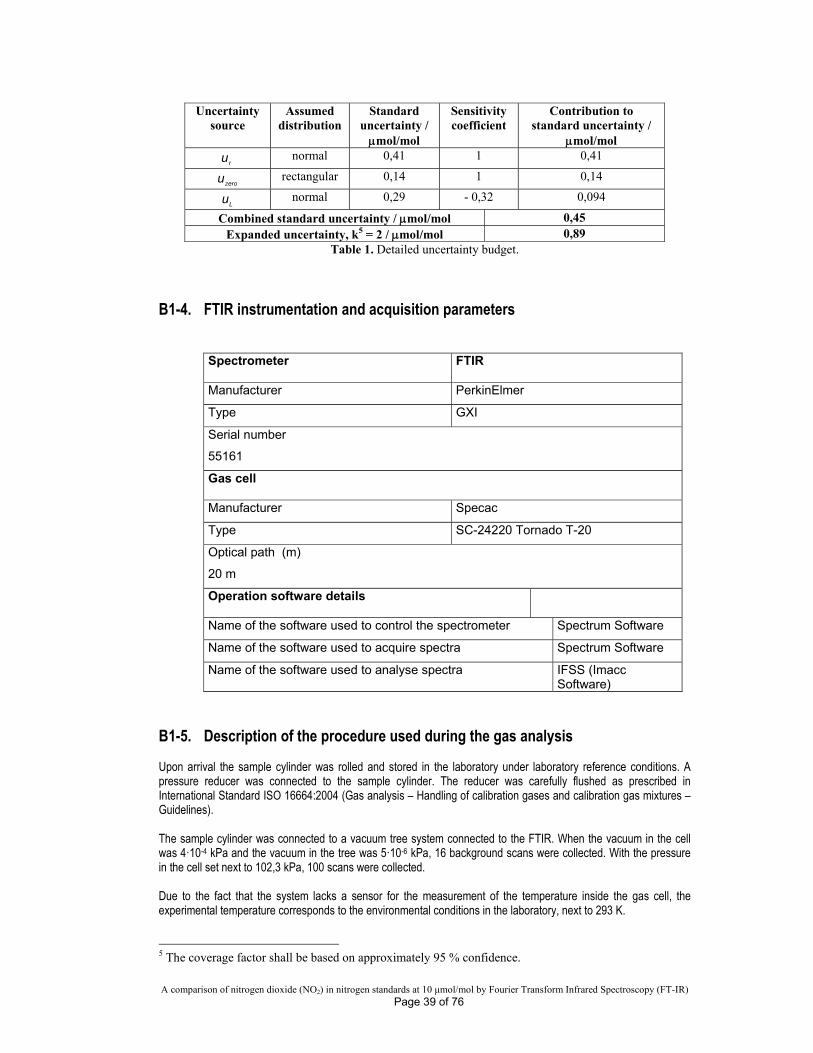
Uncertainty
source Assumed
distribution Standard
uncertainty / mol/mol
Sensitivity coefficient
Contribution to standard uncertainty /
mol/mol
ru normal 0,41 1 0,41
zerou rectangular 0,14 1 0,14
Lu normal 0,29 - 0,32 0,094
Combined standard uncertainty / mol/mol 0,45 Expanded uncertainty, k5 = 2 / mol/mol 0,89
Table 1. Detailed uncertainty budget.
B1-4. FTIR instrumentation and acquisition parameters
Spectrometer
FTIR
Manufacturer PerkinElmer
Type GXI
Serial number
55161
Gas cell Manufacturer Specac
Type SC-24220 Tornado T-20
Optical path (m)
20 m
Operation software details
Name of the software used to control the spectrometer Spectrum Software
Name of the software used to acquire spectra Spectrum Software
Name of the software used to analyse spectra IFSS (Imacc Software)
B1-5. Description of the procedure used during the gas analysis Upon arrival the sample cylinder was rolled and stored in the laboratory under laboratory reference conditions. A pressure reducer was connected to the sample cylinder. The reducer was carefully flushed as prescribed in International Standard ISO 16664:2004 (Gas analysis – Handling of calibration gases and calibration gas mixtures – Guidelines). The sample cylinder was connected to a vacuum tree system connected to the FTIR. When the vacuum in the cell was 4·10-4 kPa and the vacuum in the tree was 5·10-6 kPa, 16 background scans were collected. With the pressure in the cell set next to 102,3 kPa, 100 scans were collected. Due to the fact that the system lacks a sensor for the measurement of the temperature inside the gas cell, the experimental temperature corresponds to the environmental conditions in the laboratory, next to 293 K.
5 The coverage factor shall be based on approximately 95 % confidence.
A comparison of nitrogen dioxide (NO2) in nitrogen standards at 10 μmol/mol by Fourier Transform Infrared Spectroscopy (FT-IR) Page 40 of 76
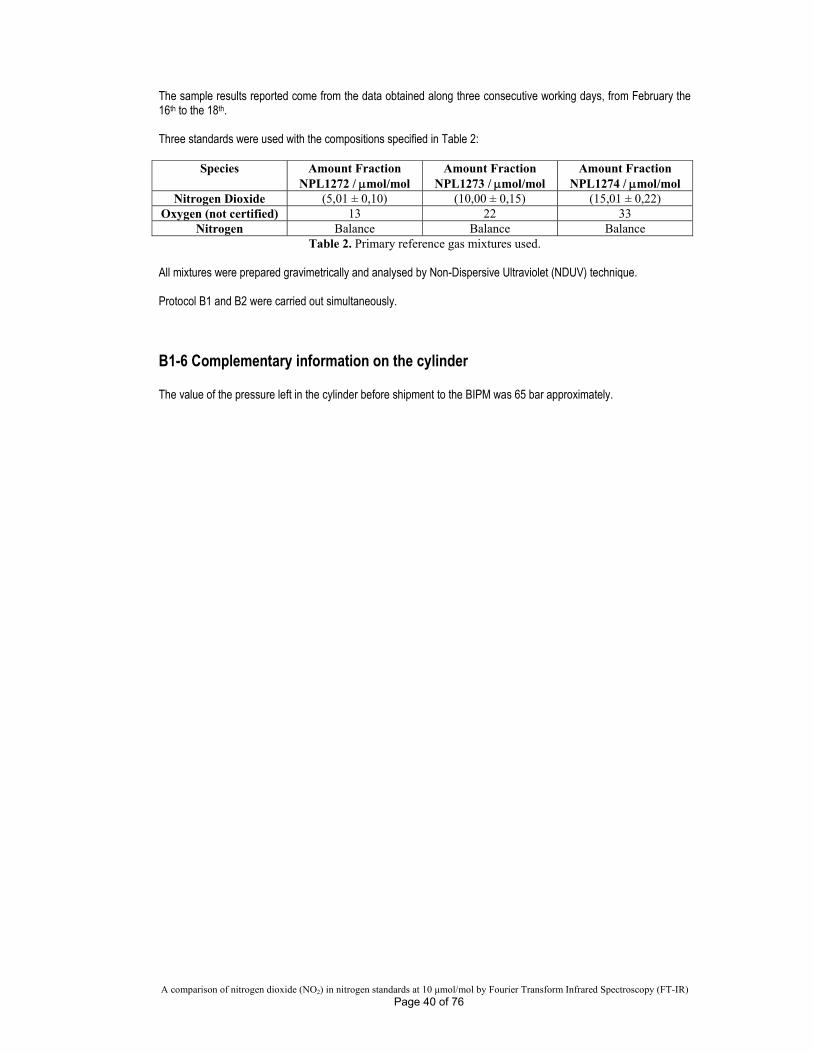
The sample results reported come from the data obtained along three consecutive working days, from February the 16th to the 18th. Three standards were used with the compositions specified in Table 2:
Species Amount Fraction NPL1272 / mol/mol
Amount Fraction NPL1273 / mol/mol
Amount Fraction NPL1274 / mol/mol
Nitrogen Dioxide (5,01 ± 0,10) (10,00 ± 0,15) (15,01 ± 0,22) Oxygen (not certified) 13 22 33
Nitrogen Balance Balance Balance Table 2. Primary reference gas mixtures used.
All mixtures were prepared gravimetrically and analysed by Non-Dispersive Ultraviolet (NDUV) technique. Protocol B1 and B2 were carried out simultaneously. B1-6 Complementary information on the cylinder The value of the pressure left in the cylinder before shipment to the BIPM was 65 bar approximately.
A comparison of nitrogen dioxide (NO2) in nitrogen standards at 10 μmol/mol by Fourier Transform Infrared Spectroscopy (FT-IR) Page 41 of 76
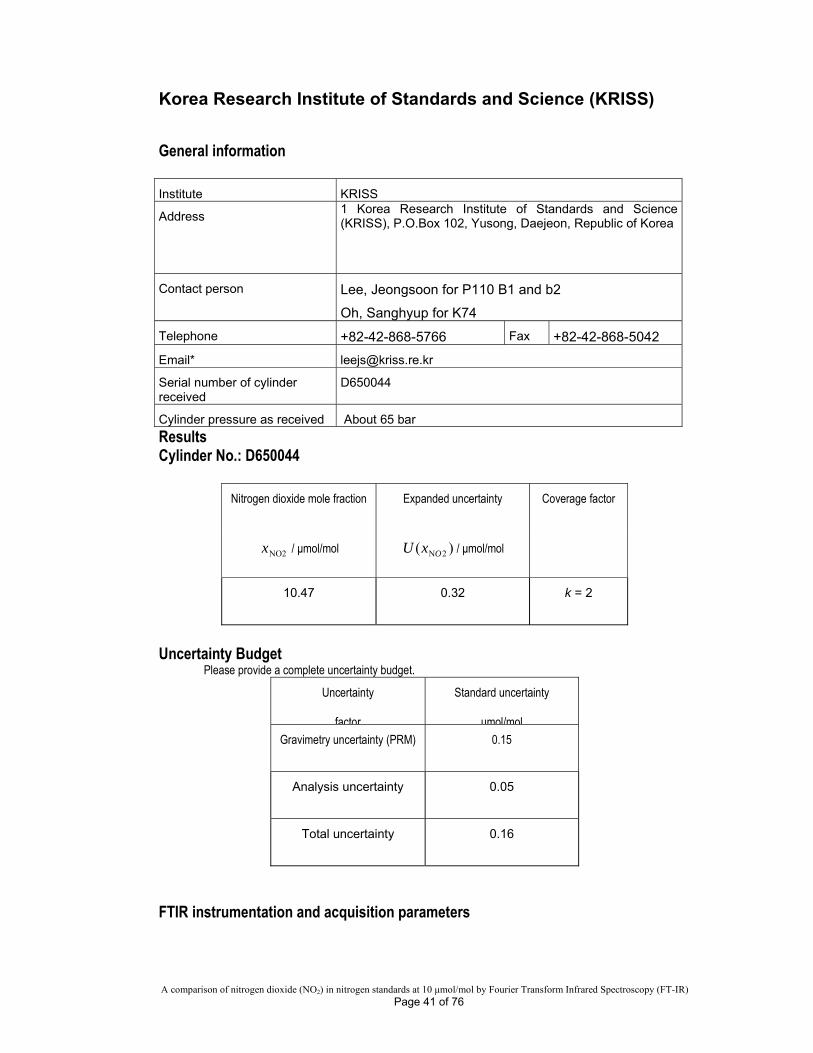
Korea Research Institute of Standards and Science (KRISS)
General information Institute KRISS
Address 1 Korea Research Institute of Standards and Science (KRISS), P.O.Box 102, Yusong, Daejeon, Republic of Korea
Contact person Lee, Jeongsoon for P110 B1 and b2
Oh, Sanghyup for K74
Telephone +82-42-868-5766 Fax +82-42-868-5042
Email* [email protected]
Serial number of cylinder received
D650044
Cylinder pressure as received About 65 bar
Results Cylinder No.: D650044
Nitrogen dioxide mole fraction Expanded uncertainty Coverage factor
NO2x / μmol/mol )( 2NOxU / μmol/mol
10.47 0.32 k = 2
Uncertainty Budget
Please provide a complete uncertainty budget.
Uncertainty
factor
Standard uncertainty
μmol/mol Gravimetry uncertainty (PRM) 0.15
Analysis uncertainty 0.05
Total uncertainty 0.16
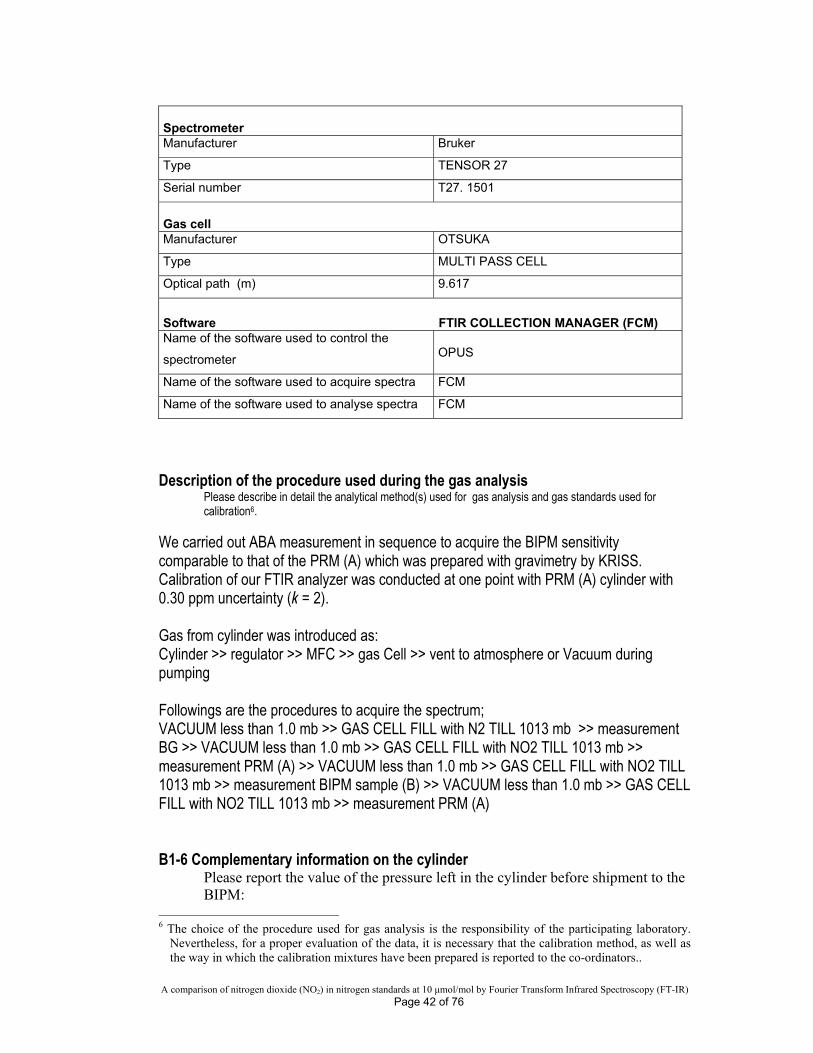
FTIR instrumentation and acquisition parameters
A comparison of nitrogen dioxide (NO2) in nitrogen standards at 10 μmol/mol by Fourier Transform Infrared Spectroscopy (FT-IR) Page 42 of 76
Spectrometer Manufacturer Bruker
Type TENSOR 27
Serial number T27. 1501
Gas cell Manufacturer OTSUKA
Type MULTI PASS CELL
Optical path (m) 9.617
Software FTIR COLLECTION MANAGER (FCM) Name of the software used to control the
spectrometer
OPUS
Name of the software used to acquire spectra FCM
Name of the software used to analyse spectra FCM
Description of the procedure used during the gas analysis
Please describe in detail the analytical method(s) used for gas analysis and gas standards used for calibration6.
We carried out ABA measurement in sequence to acquire the BIPM sensitivity comparable to that of the PRM (A) which was prepared with gravimetry by KRISS. Calibration of our FTIR analyzer was conducted at one point with PRM (A) cylinder with 0.30 ppm uncertainty (k = 2). Gas from cylinder was introduced as: Cylinder >> regulator >> MFC >> gas Cell >> vent to atmosphere or Vacuum during pumping Followings are the procedures to acquire the spectrum; VACUUM less than 1.0 mb >> GAS CELL FILL with N2 TILL 1013 mb >> measurement BG >> VACUUM less than 1.0 mb >> GAS CELL FILL with NO2 TILL 1013 mb >> measurement PRM (A) >> VACUUM less than 1.0 mb >> GAS CELL FILL with NO2 TILL 1013 mb >> measurement BIPM sample (B) >> VACUUM less than 1.0 mb >> GAS CELL FILL with NO2 TILL 1013 mb >> measurement PRM (A) B1-6 Complementary information on the cylinder
Please report the value of the pressure left in the cylinder before shipment to the BIPM:
6 The choice of the procedure used for gas analysis is the responsibility of the participating laboratory.
Nevertheless, for a proper evaluation of the data, it is necessary that the calibration method, as well as the way in which the calibration mixtures have been prepared is reported to the co-ordinators..
A comparison of nitrogen dioxide (NO2) in nitrogen standards at 10 μmol/mol by Fourier Transform Infrared Spectroscopy (FT-IR) Page 43 of 76
PRESSURE LEFT: 52 BAR If any other component other than NO2, nitrogen and oxygen was detected and/or quantified please report its mole fraction in the table below: N.A.
Component Mole fraction /
nmol/mol Expanded uncertainty Coverage factor Measurement
technique
A comparison of nitrogen dioxide (NO2) in nitrogen standards at 10 μmol/mol by Fourier Transform Infrared Spectroscopy (FT-IR) Page 44 of 76
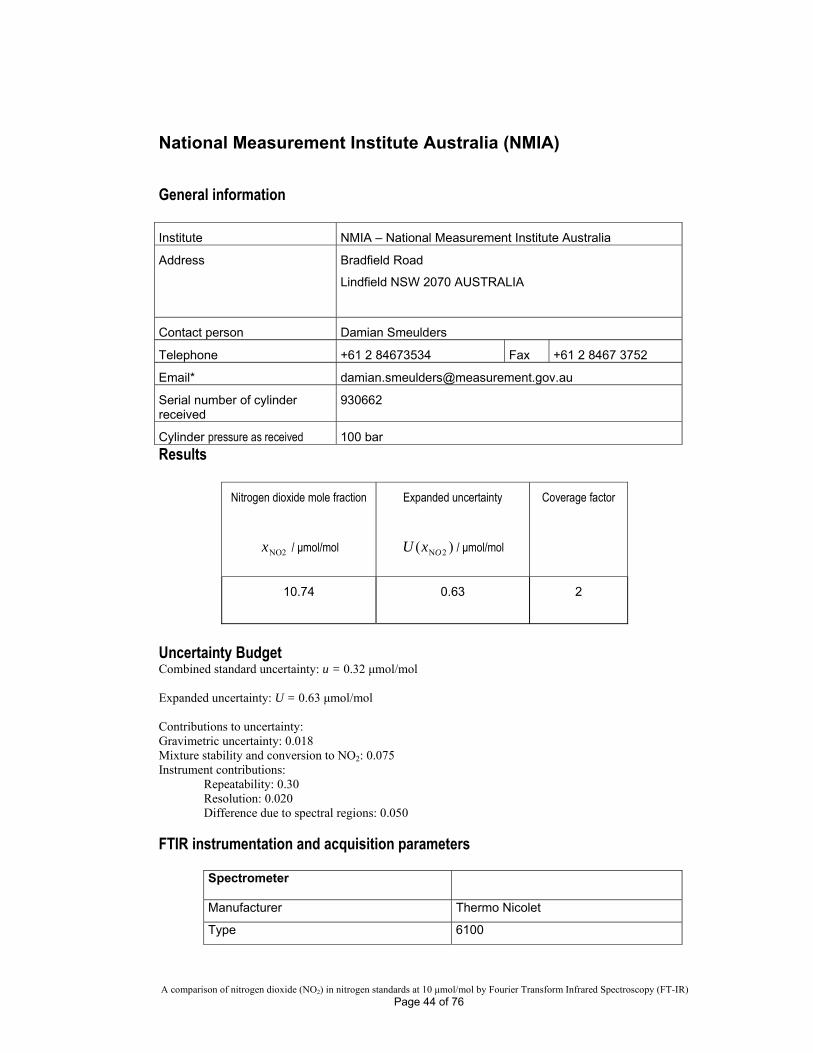
National Measurement Institute Australia (NMIA)
General information Institute NMIA – National Measurement Institute Australia
Address Bradfield Road
Lindfield NSW 2070 AUSTRALIA
Contact person Damian Smeulders
Telephone +61 2 84673534 Fax +61 2 8467 3752
Email* [email protected]
Serial number of cylinder received
930662
Cylinder pressure as received 100 bar
Results
Nitrogen dioxide mole fraction Expanded uncertainty Coverage factor
NO2x / μmol/mol )( 2NOxU / μmol/mol
10.74 0.63 2
Uncertainty Budget Combined standard uncertainty: u = 0.32 μmol/mol Expanded uncertainty: U = 0.63 μmol/mol Contributions to uncertainty: Gravimetric uncertainty: 0.018 Mixture stability and conversion to NO2: 0.075 Instrument contributions:
Repeatability: 0.30 Resolution: 0.020 Difference due to spectral regions: 0.050
FTIR instrumentation and acquisition parameters
Spectrometer
Manufacturer Thermo Nicolet
Type 6100
A comparison of nitrogen dioxide (NO2) in nitrogen standards at 10 μmol/mol by Fourier Transform Infrared Spectroscopy (FT-IR) Page 45 of 76
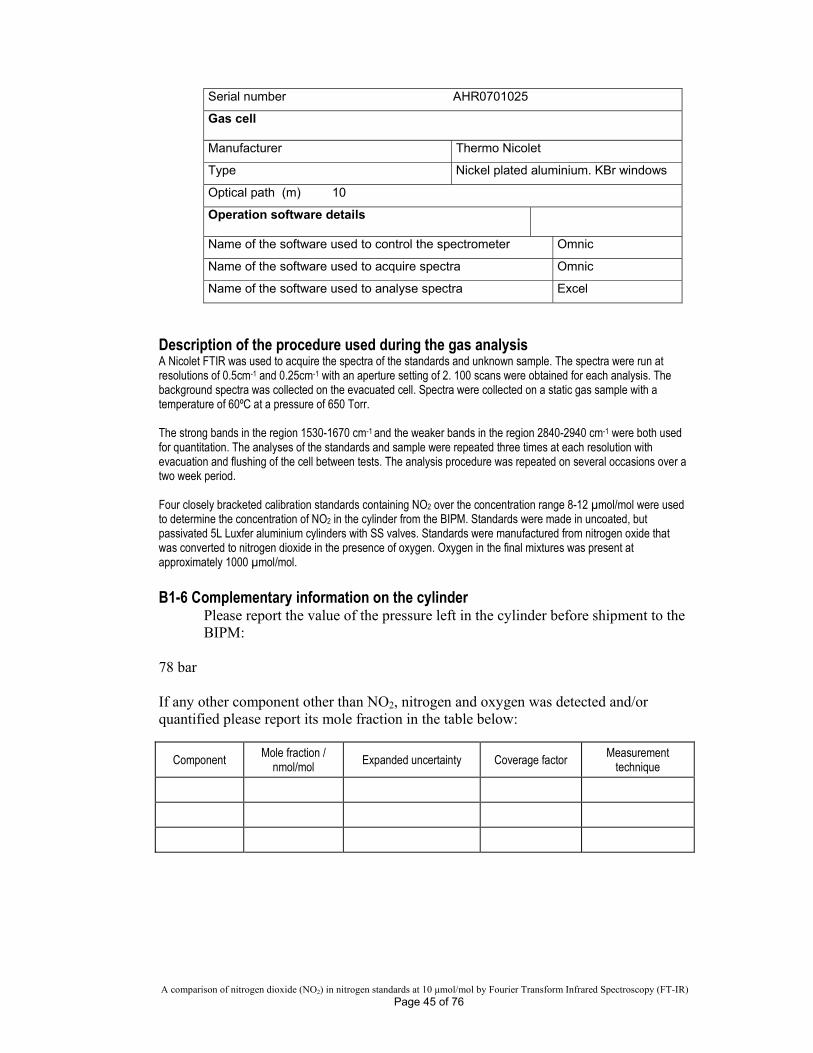
Serial number AHR0701025
Gas cell Manufacturer Thermo Nicolet
Type Nickel plated aluminium. KBr windows
Optical path (m) 10
Operation software details
Name of the software used to control the spectrometer Omnic
Name of the software used to acquire spectra Omnic
Name of the software used to analyse spectra Excel
Description of the procedure used during the gas analysis A Nicolet FTIR was used to acquire the spectra of the standards and unknown sample. The spectra were run at resolutions of 0.5cm-1 and 0.25cm-1 with an aperture setting of 2. 100 scans were obtained for each analysis. The background spectra was collected on the evacuated cell. Spectra were collected on a static gas sample with a temperature of 60ºC at a pressure of 650 Torr. The strong bands in the region 1530-1670 cm-1 and the weaker bands in the region 2840-2940 cm-1 were both used for quantitation. The analyses of the standards and sample were repeated three times at each resolution with evacuation and flushing of the cell between tests. The analysis procedure was repeated on several occasions over a two week period. Four closely bracketed calibration standards containing NO2 over the concentration range 8-12 µmol/mol were used to determine the concentration of NO2 in the cylinder from the BIPM. Standards were made in uncoated, but passivated 5L Luxfer aluminium cylinders with SS valves. Standards were manufactured from nitrogen oxide that was converted to nitrogen dioxide in the presence of oxygen. Oxygen in the final mixtures was present at approximately 1000 µmol/mol. B1-6 Complementary information on the cylinder
Please report the value of the pressure left in the cylinder before shipment to the BIPM:
78 bar If any other component other than NO2, nitrogen and oxygen was detected and/or quantified please report its mole fraction in the table below:
Component Mole fraction /
nmol/mol Expanded uncertainty Coverage factor Measurement
technique
A comparison of nitrogen dioxide (NO2) in nitrogen standards at 10 μmol/mol by Fourier Transform Infrared Spectroscopy (FT-IR) Page 46 of 76
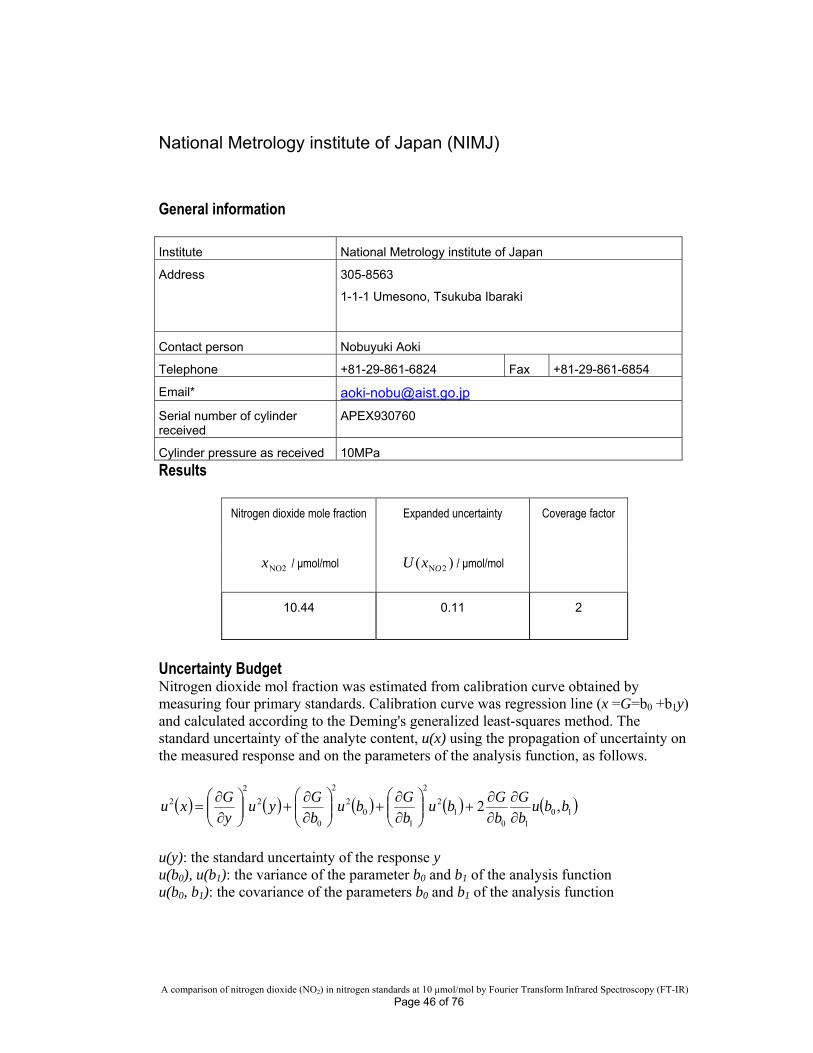
National Metrology institute of Japan (NIMJ)
General information Institute National Metrology institute of Japan
Address 305-8563
1-1-1 Umesono, Tsukuba Ibaraki
Contact person Nobuyuki Aoki
Telephone +81-29-861-6824 Fax +81-29-861-6854
Email* [email protected]
Serial number of cylinder received
APEX930760
Cylinder pressure as received 10MPa
Results
Nitrogen dioxide mole fraction Expanded uncertainty Coverage factor
NO2x / μmol/mol )( 2NOxU / μmol/mol
10.44 0.11 2
Uncertainty Budget Nitrogen dioxide mol fraction was estimated from calibration curve obtained by measuring four primary standards. Calibration curve was regression line (x =G=b0 +b1y) and calculated according to the Deming's generalized least-squares method. The standard uncertainty of the analyte content, u(x) using the propagation of uncertainty on the measured response and on the parameters of the analysis function, as follows.
1010
12
2
10
2
2
0
2
2
2 ,2 bbub
G
b
Gbu
b
Gbu
b
Gyu
y
Gxu
u(y): the standard uncertainty of the response y u(b0), u(b1): the variance of the parameter b0 and b1 of the analysis function u(b0, b1): the covariance of the parameters b0 and b1 of the analysis function
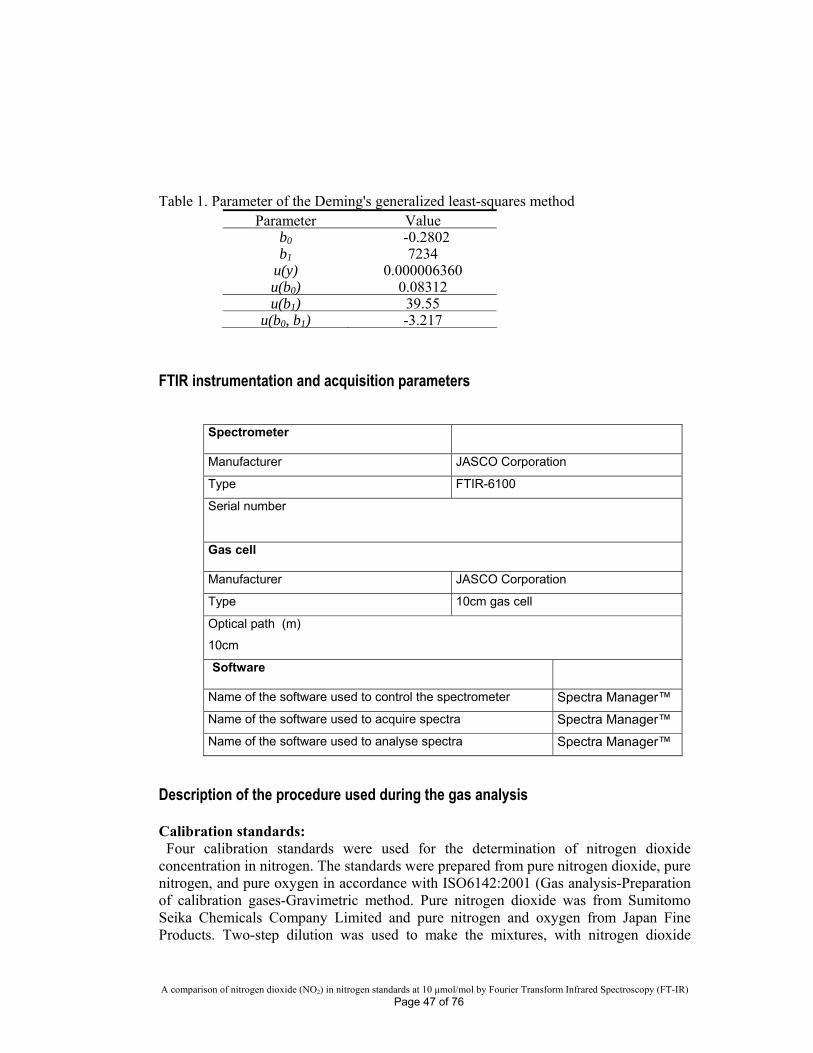
A comparison of nitrogen dioxide (NO2) in nitrogen standards at 10 μmol/mol by Fourier Transform Infrared Spectroscopy (FT-IR) Page 47 of 76
Table 1. Parameter of the Deming's generalized least-squares method
Parameter Value b0 -0.2802 b1 7234
u(y) 0.000006360 u(b0) 0.08312 u(b1) 39.55
u(b0, b1) -3.217
FTIR instrumentation and acquisition parameters
Spectrometer
Manufacturer JASCO Corporation
Type FTIR-6100
Serial number
Gas cell Manufacturer JASCO Corporation
Type 10cm gas cell
Optical path (m)
10cm
Software
Name of the software used to control the spectrometer Spectra Manager™
Name of the software used to acquire spectra Spectra Manager™
Name of the software used to analyse spectra Spectra Manager™
Description of the procedure used during the gas analysis Calibration standards: Four calibration standards were used for the determination of nitrogen dioxide
concentration in nitrogen. The standards were prepared from pure nitrogen dioxide, pure nitrogen, and pure oxygen in accordance with ISO6142:2001 (Gas analysis-Preparation of calibration gases-Gravimetric method. Pure nitrogen dioxide was from Sumitomo Seika Chemicals Company Limited and pure nitrogen and oxygen from Japan Fine Products. Two-step dilution was used to make the mixtures, with nitrogen dioxide
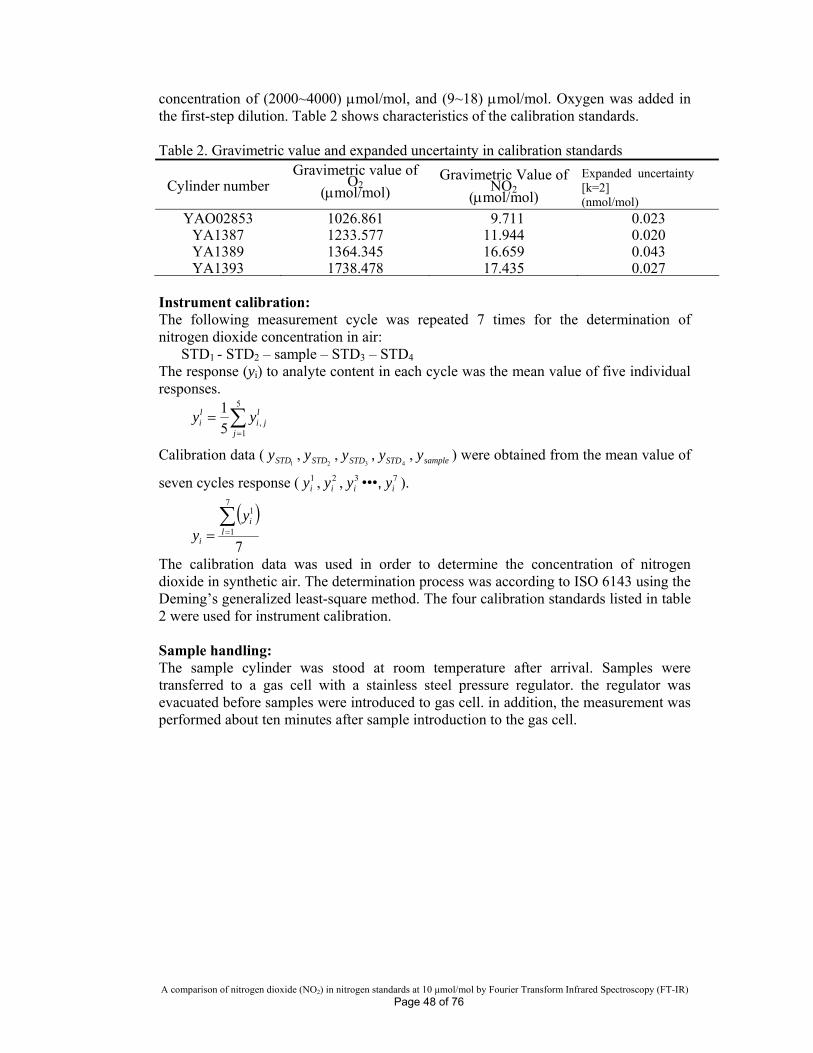
A comparison of nitrogen dioxide (NO2) in nitrogen standards at 10 μmol/mol by Fourier Transform Infrared Spectroscopy (FT-IR) Page 48 of 76
concentration of (2000~4000) mol/mol, and (9~18) mol/mol. Oxygen was added in the first-step dilution. Table 2 shows characteristics of the calibration standards. Table 2. Gravimetric value and expanded uncertainty in calibration standards
Cylinder number Gravimetric value of
O2 (mol/mol)
Gravimetric Value of NO2
(mol/mol)
Expanded uncertainty [k=2] (nmol/mol)
YAO02853 1026.861 9.711 0.023 YA1387 1233.577 11.944 0.020 YA1389 1364.345 16.659 0.043 YA1393 1738.478 17.435 0.027
Instrument calibration: The following measurement cycle was repeated 7 times for the determination of nitrogen dioxide concentration in air:
STD1 - STD2 – sample – STD3 – STD4 The response (yi) to analyte content in each cycle was the mean value of five individual responses.
5
1,5
1
j
lji
li yy
Calibration data (1STDy ,
2STDy ,3STDy ,
4STDy , sampley ) were obtained from the mean value of
seven cycles response ( 1iy , 2
iy , 3iy •••, 7
iy ).
7
7
1
1 l
i
i
yy
The calibration data was used in order to determine the concentration of nitrogen dioxide in synthetic air. The determination process was according to ISO 6143 using the Deming’s generalized least-square method. The four calibration standards listed in table 2 were used for instrument calibration. Sample handling: The sample cylinder was stood at room temperature after arrival. Samples were transferred to a gas cell with a stainless steel pressure regulator. the regulator was evacuated before samples were introduced to gas cell. in addition, the measurement was performed about ten minutes after sample introduction to the gas cell.
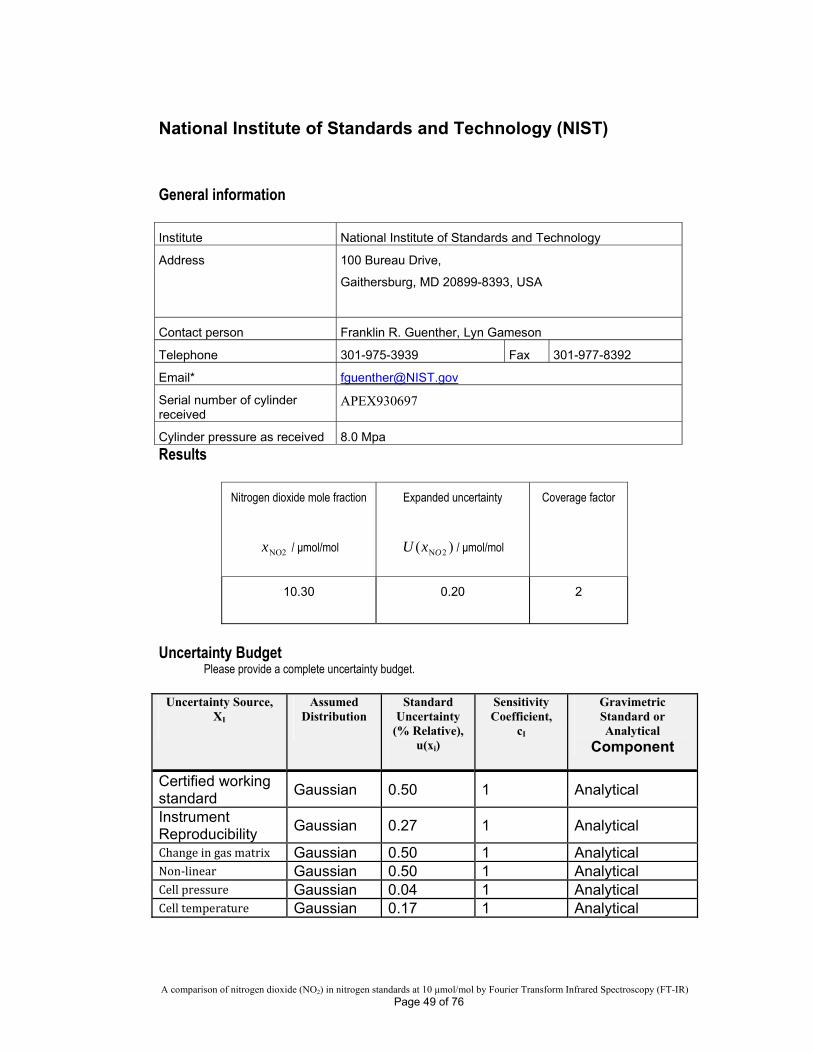
A comparison of nitrogen dioxide (NO2) in nitrogen standards at 10 μmol/mol by Fourier Transform Infrared Spectroscopy (FT-IR) Page 49 of 76
National Institute of Standards and Technology (NIST)
General information Institute National Institute of Standards and Technology
Address 100 Bureau Drive,
Gaithersburg, MD 20899-8393, USA
Contact person Franklin R. Guenther, Lyn Gameson
Telephone 301-975-3939 Fax 301-977-8392
Email* [email protected]
Serial number of cylinder received
APEX930697
Cylinder pressure as received 8.0 Mpa
Results
Nitrogen dioxide mole fraction Expanded uncertainty Coverage factor
NO2x / μmol/mol )( 2NOxU / μmol/mol
10.30 0.20 2
Uncertainty Budget
Please provide a complete uncertainty budget.
Uncertainty Source, XI
Assumed Distribution
Standard Uncertainty
(% Relative), u(xi)
Sensitivity Coefficient,
cI
Gravimetric Standard or Analytical
Component
Certified working standard
Gaussian 0.50 1 Analytical
Instrument Reproducibility
Gaussian 0.27 1 Analytical
Change in gas matrix Gaussian 0.50 1 Analytical Non‐linear Gaussian 0.50 1 Analytical Cell pressure Gaussian 0.04 1 Analytical Cell temperature Gaussian 0.17 1 Analytical

A comparison of nitrogen dioxide (NO2) in nitrogen standards at 10 μmol/mol by Fourier Transform Infrared Spectroscopy (FT-IR) Page 50 of 76
FTIR instrumentation and acquisition parameters
Spectrometer
Manufacturer Nicolet
Type Nexus 670 (MCT Detector)
Serial number AEQ9900262
Gas cell Manufacturer Specac
Type Cyclone 10C (Quartz)
Optical path (m) 10
Software
Name of the software used to control the spectrometer OMNIC V7.1
Name of the software used to acquire spectra OMNIC V7.1
Name of the software used to analyse spectra In-House
Description of the procedure used during the gas analysis Please describe in detail the analytical method(s) used for gas analysis and gas standards used for calibration7.
FTIR Collection Parameters:
Parameter Value
Number of Scans 512 Apodization Boxcar Resolution 0.125 cm-1
Standard used (in balance air):
Cylinder# NOx (µmol/mol) HNO3 (µmol/mol) NO2 (µmol/mol
AAL069155 9.263 ± 0.050 0.403 ± 0.071 8.860 ± 0.087 FTIR Response – summation of the following NO2 peak areas: Start (cm-1) End (cm-1)
7 The choice of the procedure used for gas analysis is the responsibility of the participating laboratory.
Nevertheless, for a proper evaluation of the data, it is necessary that the calibration method, as well as the way in which the calibration mixtures have been prepared is reported to the co-ordinators..
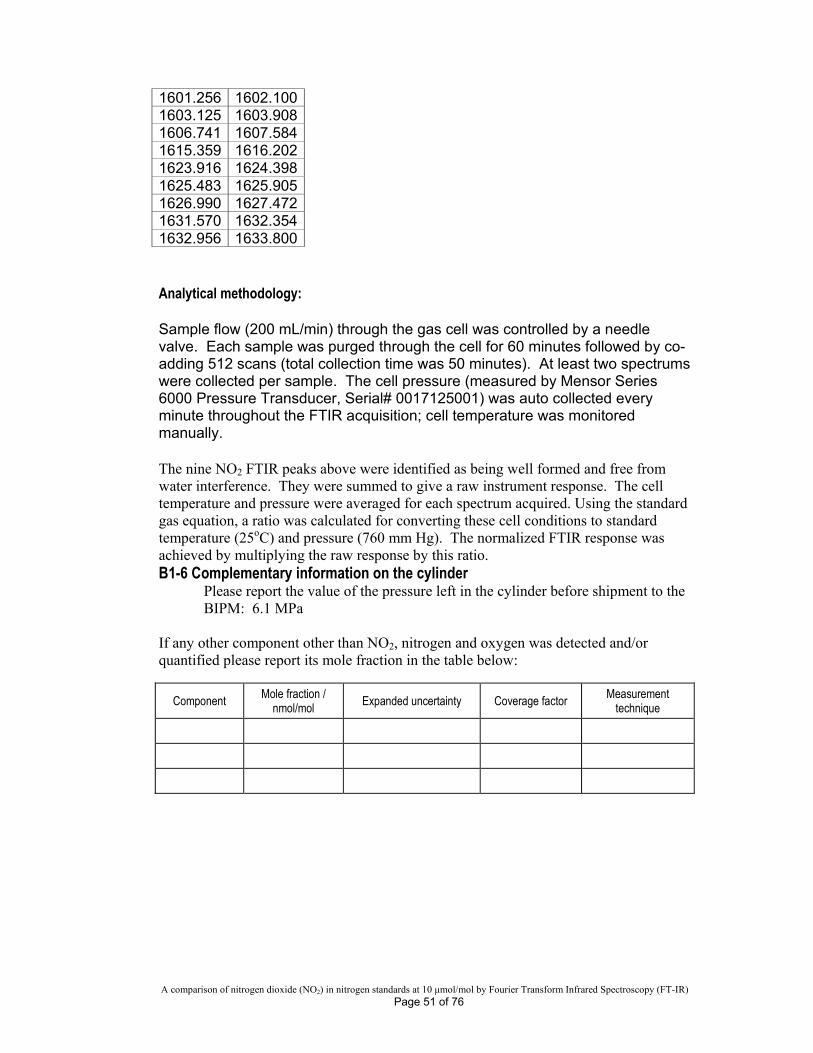
A comparison of nitrogen dioxide (NO2) in nitrogen standards at 10 μmol/mol by Fourier Transform Infrared Spectroscopy (FT-IR) Page 51 of 76
1601.256 1602.100 1603.125 1603.908 1606.741 1607.584 1615.359 1616.202 1623.916 1624.398 1625.483 1625.905 1626.990 1627.472 1631.570 1632.354 1632.956 1633.800 Analytical methodology: Sample flow (200 mL/min) through the gas cell was controlled by a needle valve. Each sample was purged through the cell for 60 minutes followed by co-adding 512 scans (total collection time was 50 minutes). At least two spectrums were collected per sample. The cell pressure (measured by Mensor Series 6000 Pressure Transducer, Serial# 0017125001) was auto collected every minute throughout the FTIR acquisition; cell temperature was monitored manually. The nine NO2 FTIR peaks above were identified as being well formed and free from water interference. They were summed to give a raw instrument response. The cell temperature and pressure were averaged for each spectrum acquired. Using the standard gas equation, a ratio was calculated for converting these cell conditions to standard temperature (25oC) and pressure (760 mm Hg). The normalized FTIR response was achieved by multiplying the raw response by this ratio. B1-6 Complementary information on the cylinder
Please report the value of the pressure left in the cylinder before shipment to the BIPM: 6.1 MPa
If any other component other than NO2, nitrogen and oxygen was detected and/or quantified please report its mole fraction in the table below:
Component Mole fraction / nmol/mol Expanded uncertainty Coverage factor Measurement
technique
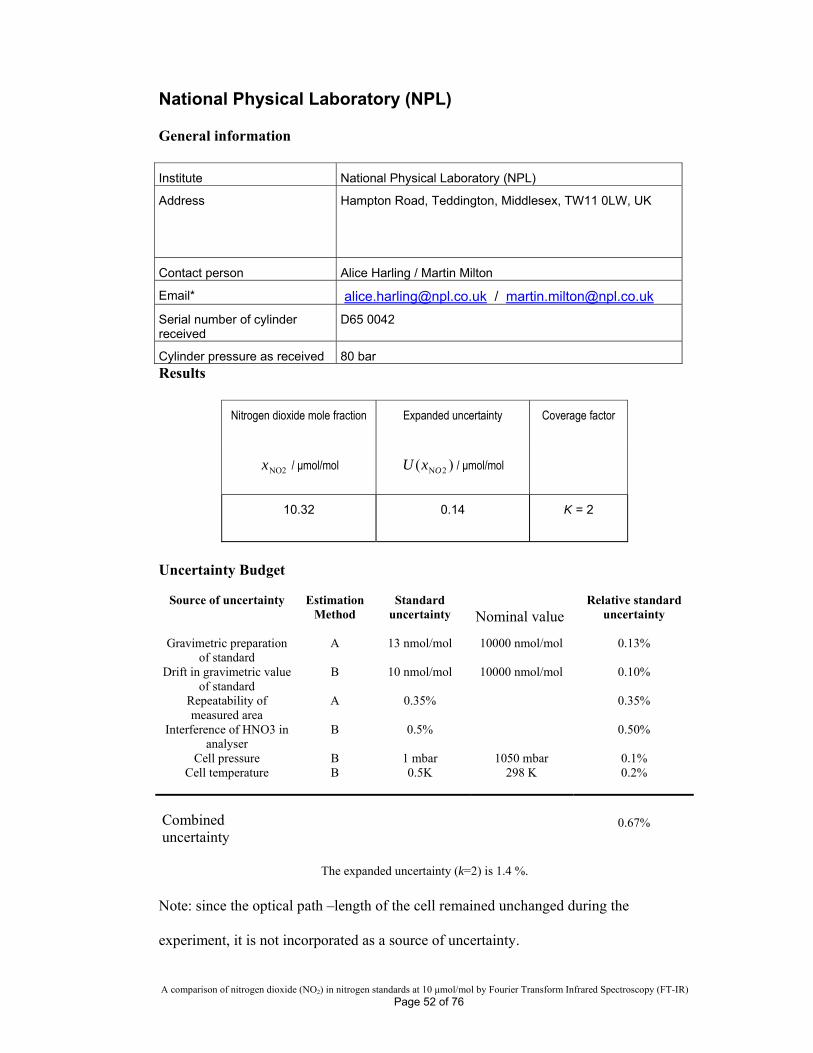
A comparison of nitrogen dioxide (NO2) in nitrogen standards at 10 μmol/mol by Fourier Transform Infrared Spectroscopy (FT-IR) Page 52 of 76
National Physical Laboratory (NPL) General information Institute National Physical Laboratory (NPL)
Address Hampton Road, Teddington, Middlesex, TW11 0LW, UK
Contact person Alice Harling / Martin Milton
Email* [email protected] / [email protected]
Serial number of cylinder received
D65 0042
Cylinder pressure as received 80 bar Results
Nitrogen dioxide mole fraction Expanded uncertainty Coverage factor
NO2x / μmol/mol )( 2NOxU / μmol/mol
10.32 0.14 K = 2
Uncertainty Budget
Source of uncertainty Estimation Method
Standard uncertainty
Nominal value
Relative standard uncertainty
Gravimetric preparation of standard
A 13 nmol/mol 10000 nmol/mol 0.13%
Drift in gravimetric value of standard
B 10 nmol/mol 10000 nmol/mol 0.10%
Repeatability of measured area
A 0.35% 0.35%
Interference of HNO3 in analyser
B 0.5% 0.50%
Cell pressure B 1 mbar 1050 mbar 0.1% Cell temperature B 0.5K 298 K 0.2%
Combined uncertainty
0.67%
The expanded uncertainty (k=2) is 1.4 %.
Note: since the optical path –length of the cell remained unchanged during the
experiment, it is not incorporated as a source of uncertainty.
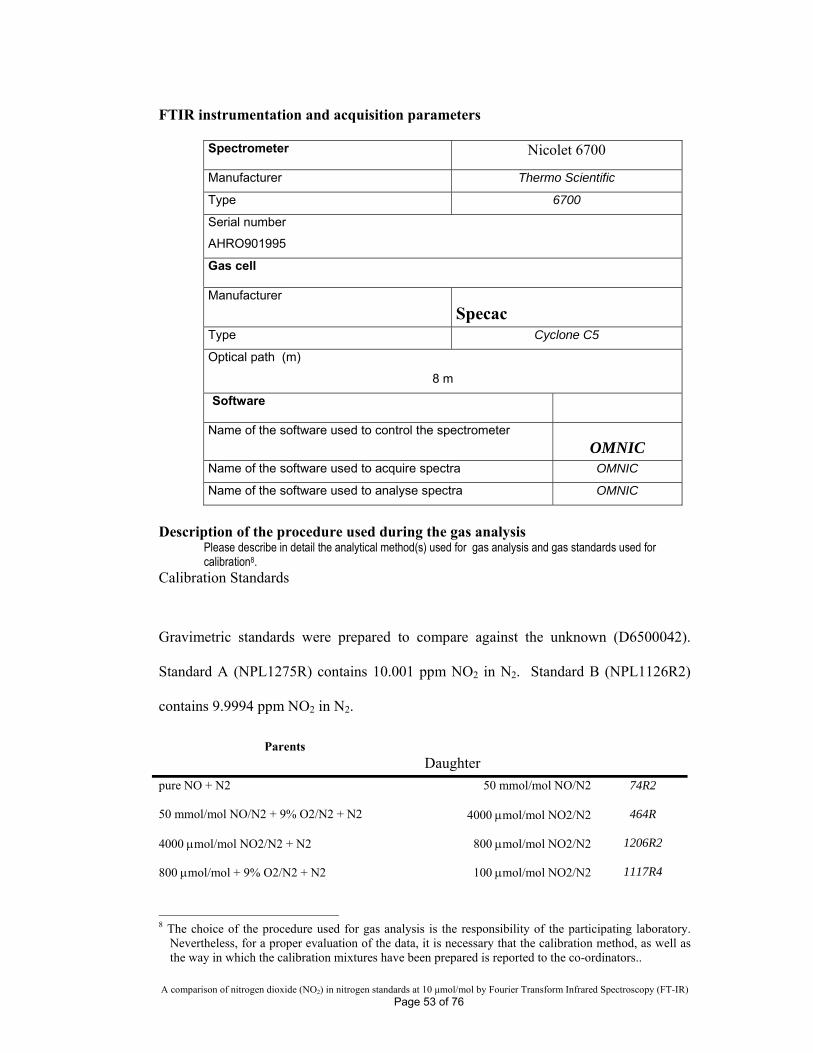
A comparison of nitrogen dioxide (NO2) in nitrogen standards at 10 μmol/mol by Fourier Transform Infrared Spectroscopy (FT-IR) Page 53 of 76
FTIR instrumentation and acquisition parameters
Spectrometer
Nicolet 6700
Manufacturer Thermo Scientific
Type 6700
Serial number
AHRO901995
Gas cell Manufacturer
Specac Type Cyclone C5
Optical path (m)
8 m
Software
Name of the software used to control the spectrometer
OMNIC Name of the software used to acquire spectra OMNIC
Name of the software used to analyse spectra OMNIC
Description of the procedure used during the gas analysis
Please describe in detail the analytical method(s) used for gas analysis and gas standards used for calibration8.
Calibration Standards
Gravimetric standards were prepared to compare against the unknown (D6500042).
Standard A (NPL1275R) contains 10.001 ppm NO2 in N2. Standard B (NPL1126R2)
contains 9.9994 ppm NO2 in N2.
Parents Daughter
pure NO + N2 50 mmol/mol NO/N2 74R2
50 mmol/mol NO/N2 + 9% O2/N2 + N2 4000 mol/mol NO2/N2 464R
4000 mol/mol NO2/N2 + N2 800 mol/mol NO2/N2 1206R2
800 mol/mol + 9% O2/N2 + N2 100 mol/mol NO2/N2 1117R4
8 The choice of the procedure used for gas analysis is the responsibility of the participating laboratory.
Nevertheless, for a proper evaluation of the data, it is necessary that the calibration method, as well as the way in which the calibration mixtures have been prepared is reported to the co-ordinators..
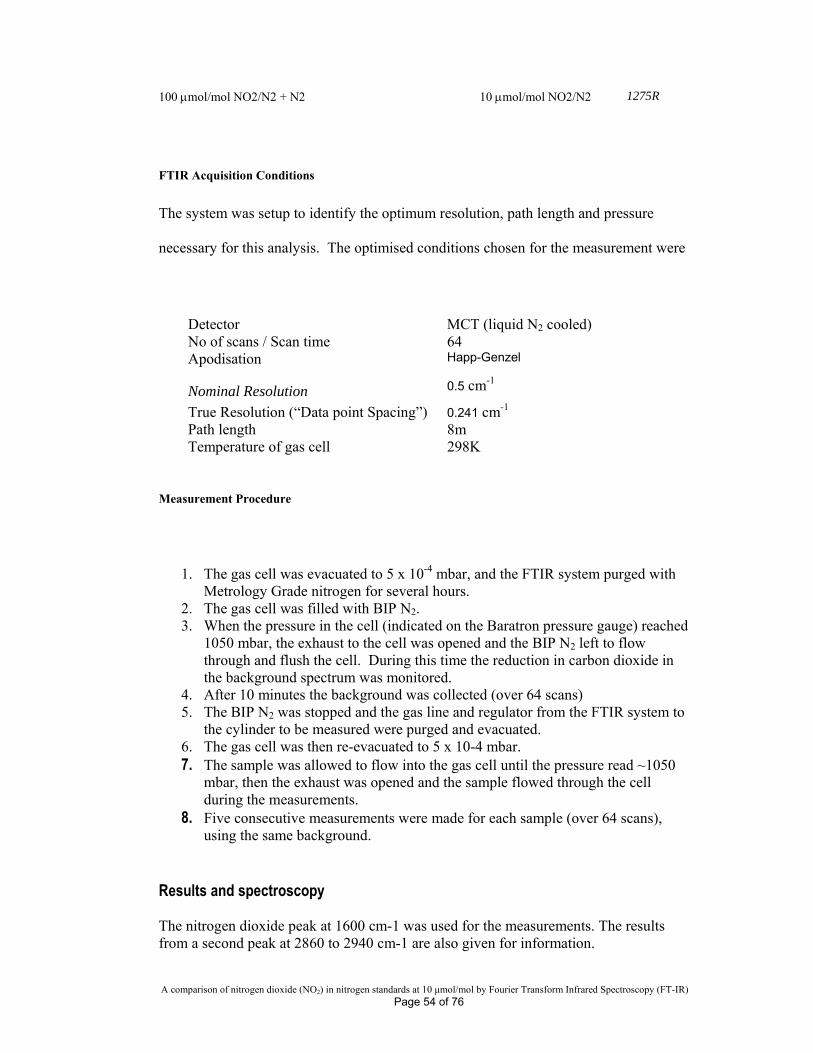
A comparison of nitrogen dioxide (NO2) in nitrogen standards at 10 μmol/mol by Fourier Transform Infrared Spectroscopy (FT-IR) Page 54 of 76
100 mol/mol NO2/N2 + N2 10 mol/mol NO2/N2 1275R
FTIR Acquisition Conditions
The system was setup to identify the optimum resolution, path length and pressure
necessary for this analysis. The optimised conditions chosen for the measurement were
Detector MCT (liquid N2 cooled) No of scans / Scan time 64 Apodisation Happ-Genzel
Nominal Resolution 0.5 cm-1
True Resolution (“Data point Spacing”) 0.241 cm-1 Path length 8m Temperature of gas cell 298K
Measurement Procedure
1. The gas cell was evacuated to 5 x 10⁻⁴ mbar, and the FTIR system purged with Metrology Grade nitrogen for several hours.
2. The gas cell was filled with BIP N2. 3. When the pressure in the cell (indicated on the Baratron pressure gauge) reached
1050 mbar, the exhaust to the cell was opened and the BIP N2 left to flow through and flush the cell. During this time the reduction in carbon dioxide in the background spectrum was monitored.
4. After 10 minutes the background was collected (over 64 scans) 5. The BIP N2 was stopped and the gas line and regulator from the FTIR system to
the cylinder to be measured were purged and evacuated. 6. The gas cell was then re-evacuated to 5 x 10⁻⁴ mbar. 7. The sample was allowed to flow into the gas cell until the pressure read ~1050
mbar, then the exhaust was opened and the sample flowed through the cell during the measurements.
8. Five consecutive measurements were made for each sample (over 64 scans), using the same background.
Results and spectroscopy The nitrogen dioxide peak at 1600 cm-1 was used for the measurements. The results from a second peak at 2860 to 2940 cm-1 are also given for information.
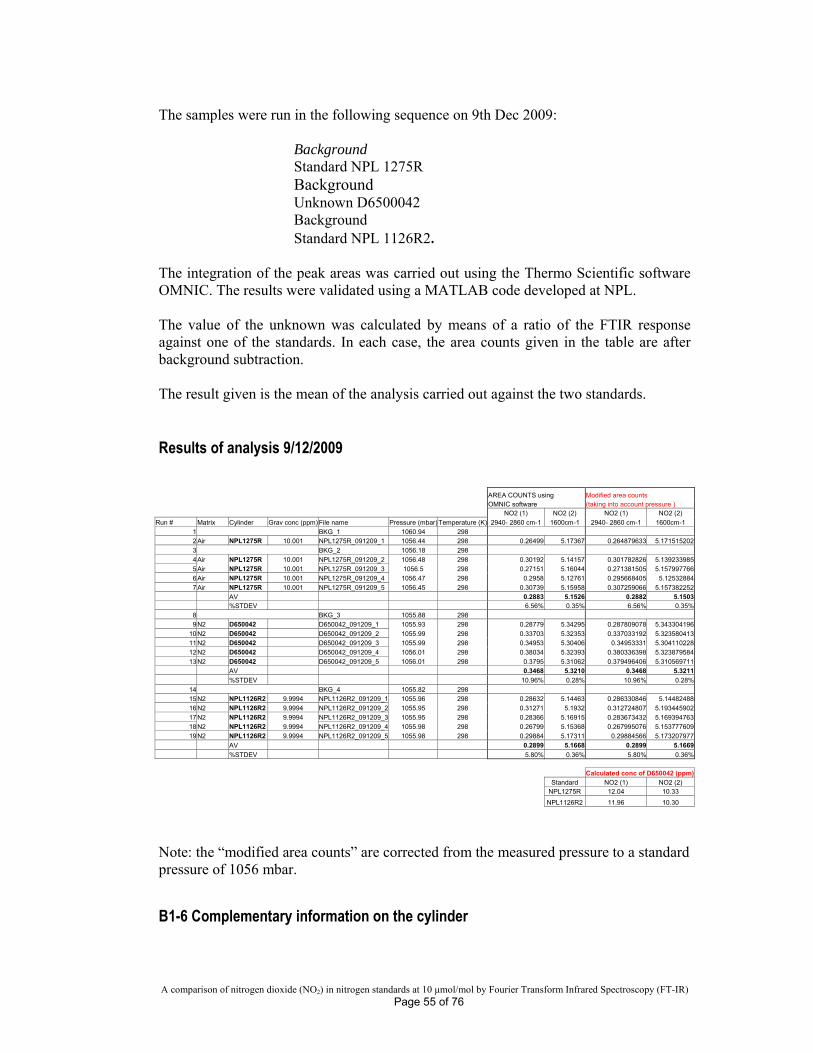
A comparison of nitrogen dioxide (NO2) in nitrogen standards at 10 μmol/mol by Fourier Transform Infrared Spectroscopy (FT-IR) Page 55 of 76
The samples were run in the following sequence on 9th Dec 2009:
Background Standard NPL 1275R Background Unknown D6500042 Background Standard NPL 1126R2.
The integration of the peak areas was carried out using the Thermo Scientific software OMNIC. The results were validated using a MATLAB code developed at NPL. The value of the unknown was calculated by means of a ratio of the FTIR response against one of the standards. In each case, the area counts given in the table are after background subtraction. The result given is the mean of the analysis carried out against the two standards. Results of analysis 9/12/2009
Note: the “modified area counts” are corrected from the measured pressure to a standard pressure of 1056 mbar.
B1-6 Complementary information on the cylinder
AREA COUNTS using Modified area counts OMNIC software (taking into account pressure ) NO2 (1) NO2 (2) NO2 (1) NO2 (2)
Run # Matrix Cylinder Grav conc (ppm) File name Pressure (mbar)Temperature (K) 2940- 2860 cm-1 1600cm-1 2940- 2860 cm-1 1600cm-1
1 BKG_1 1060.94 298 2 Air NPL1275R 10.001 NPL1275R_091209_1 1056.44 298 0.26499 5.17367 0.264879633 5.171515202
3 BKG_2 1056.18 298
4 Air NPL1275R 10.001 NPL1275R_091209_2 1056.48 298 0.30192 5.14157 0.301782826 5.139233985
5 Air NPL1275R 10.001 NPL1275R_091209_3 1056.5 298 0.27151 5.16044 0.271381505 5.157997766
6 Air NPL1275R 10.001 NPL1275R_091209_4 1056.47 298 0.2958 5.12761 0.295668405 5.12532884
7 Air NPL1275R 10.001 NPL1275R_091209_5 1056.45 298 0.30739 5.15958 0.307259066 5.157382252
AV 0.2883 5.1526 0.2882 5.1503 %STDEV 6.56% 0.35% 6.56% 0.35%
8 BKG_3 1055.88 298
9 N2 D650042 D650042_091209_1 1055.93 298 0.28779 5.34295 0.287809078 5.343304196
10 N2 D650042 D650042_091209_2 1055.99 298 0.33703 5.32353 0.337033192 5.323580413
11 N2 D650042 D650042_091209_3 1055.99 298 0.34953 5.30406 0.34953331 5.304110228
12 N2 D650042 D650042_091209_4 1056.01 298 0.38034 5.32393 0.380336398 5.323879584
13 N2 D650042 D650042_091209_5 1056.01 298 0.3795 5.31062 0.379496406 5.310569711
AV 0.3468 5.3210 0.3468 5.3211
%STDEV 10.96% 0.28% 10.96% 0.28%
14 BKG_4 1055.82 298 15 N2 NPL1126R2 9.9994 NPL1126R2_091209_1 1055.96 298 0.28632 5.14463 0.286330846 5.14482488
16 N2 NPL1126R2 9.9994 NPL1126R2_091209_2 1055.95 298 0.31271 5.1932 0.312724807 5.193445902
17 N2 NPL1126R2 9.9994 NPL1126R2_091209_3 1055.95 298 0.28366 5.16915 0.283673432 5.169394763
18 N2 NPL1126R2 9.9994 NPL1126R2_091209_4 1055.98 298 0.26799 5.15368 0.267995076 5.153777609
19 N2 NPL1126R2 9.9994 NPL1126R2_091209_5 1055.98 298 0.29884 5.17311 0.29884566 5.173207977
AV 0.2899 5.1668 0.2899 5.1669
%STDEV 5.80% 0.36% 5.80% 0.36%
Calculated conc of D650042 (ppm)
Standard NO2 (1) NO2 (2) NPL1275R 12.04 10.33
NPL1126R2 11.96 10.30
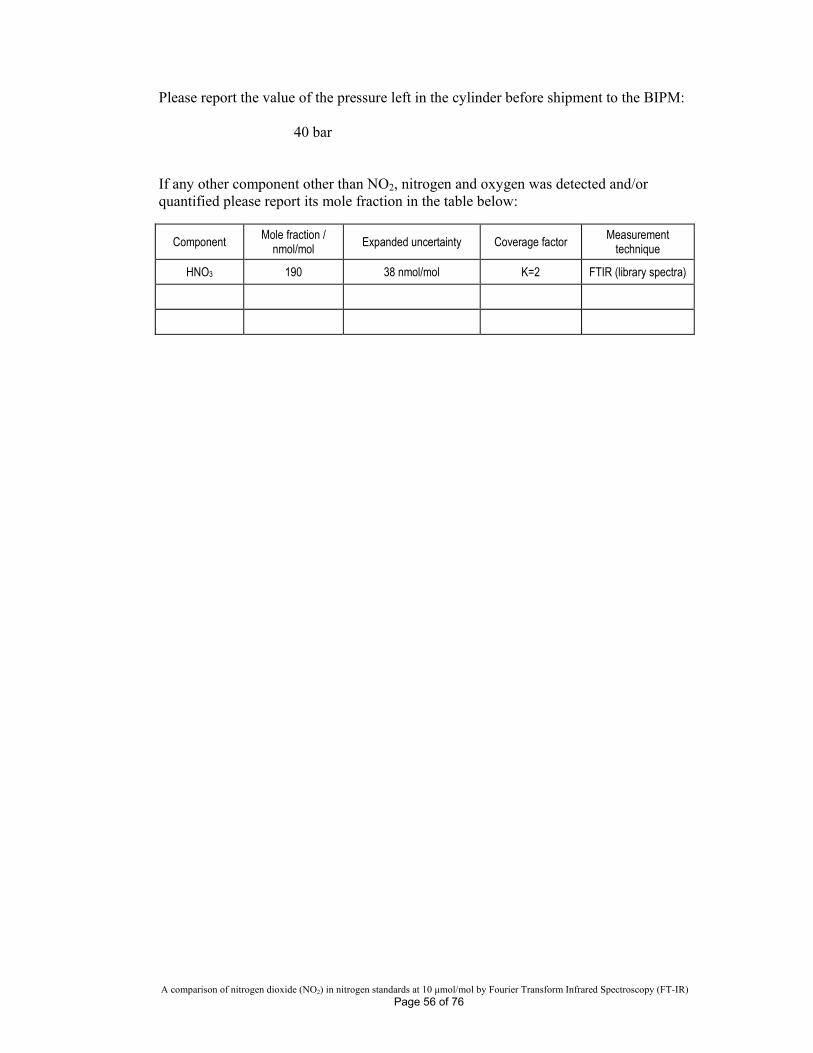
A comparison of nitrogen dioxide (NO2) in nitrogen standards at 10 μmol/mol by Fourier Transform Infrared Spectroscopy (FT-IR) Page 56 of 76
Please report the value of the pressure left in the cylinder before shipment to the BIPM: 40 bar If any other component other than NO2, nitrogen and oxygen was detected and/or quantified please report its mole fraction in the table below:
Component Mole fraction /
nmol/mol Expanded uncertainty Coverage factor Measurement
technique
HNO3 190 38 nmol/mol K=2 FTIR (library spectra)
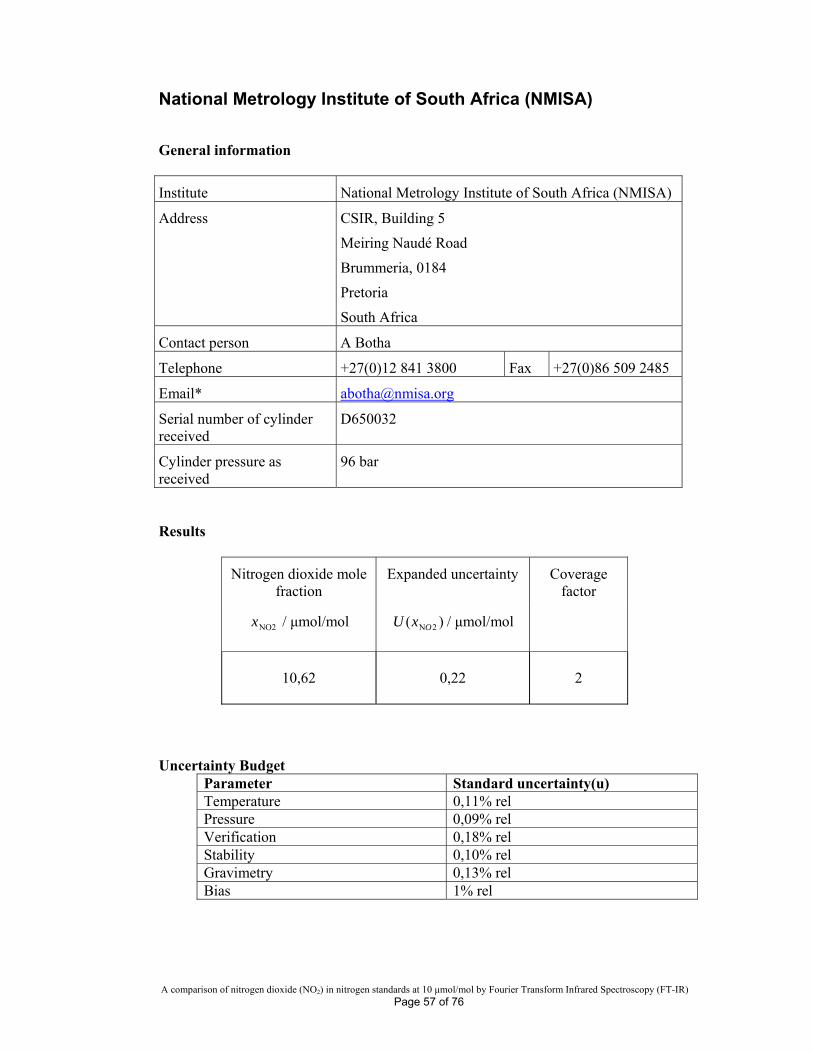
A comparison of nitrogen dioxide (NO2) in nitrogen standards at 10 μmol/mol by Fourier Transform Infrared Spectroscopy (FT-IR) Page 57 of 76
National Metrology Institute of South Africa (NMISA) General information
Institute National Metrology Institute of South Africa (NMISA)
Address CSIR, Building 5
Meiring Naudé Road
Brummeria, 0184
Pretoria
South Africa
Contact person A Botha
Telephone +27(0)12 841 3800 Fax +27(0)86 509 2485
Email* [email protected]
Serial number of cylinder received
D650032
Cylinder pressure as received
96 bar
Results
Nitrogen dioxide mole fraction
Expanded uncertainty Coverage factor
NO2x / μmol/mol )( 2NOxU / μmol/mol
10,62
0,22
2
Uncertainty Budget
Parameter Standard uncertainty(u) Temperature 0,11% rel Pressure 0,09% rel Verification 0,18% rel Stability 0,10% rel Gravimetry 0,13% rel Bias 1% rel
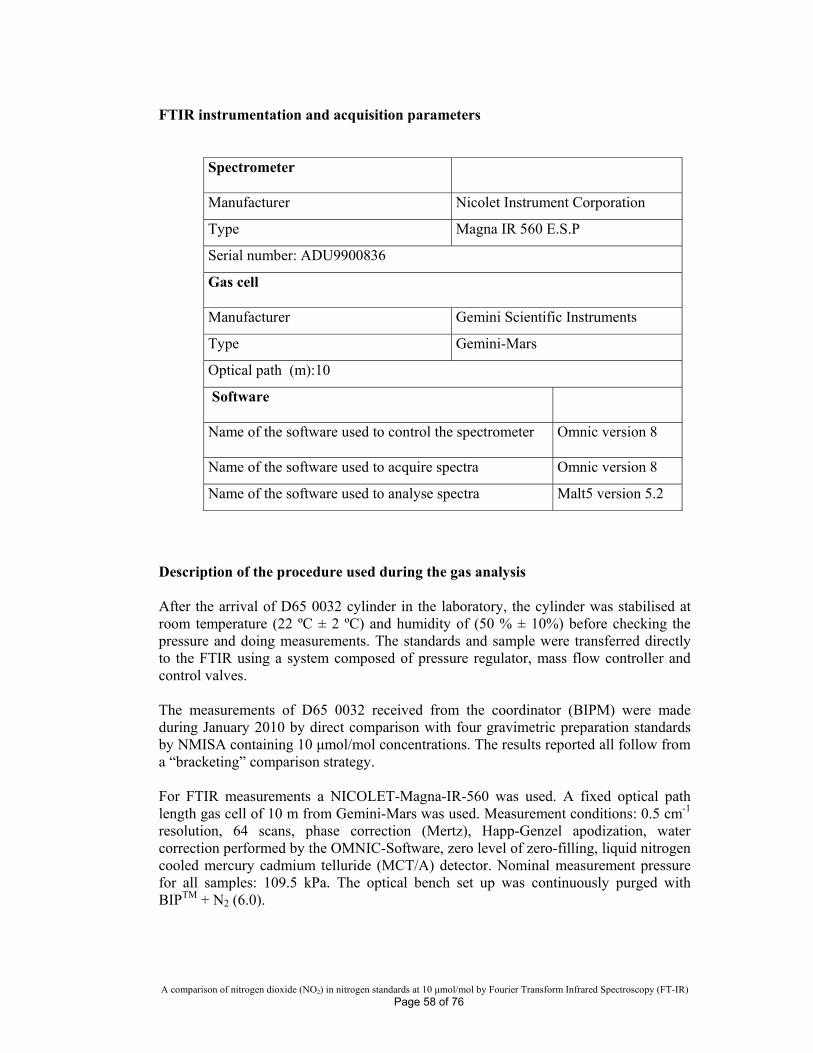
A comparison of nitrogen dioxide (NO2) in nitrogen standards at 10 μmol/mol by Fourier Transform Infrared Spectroscopy (FT-IR) Page 58 of 76
FTIR instrumentation and acquisition parameters
Spectrometer
Manufacturer Nicolet Instrument Corporation
Type Magna IR 560 E.S.P
Serial number: ADU9900836
Gas cell Manufacturer Gemini Scientific Instruments
Type Gemini-Mars
Optical path (m):10
Software
Name of the software used to control the spectrometer Omnic version 8
Name of the software used to acquire spectra Omnic version 8
Name of the software used to analyse spectra Malt5 version 5.2
Description of the procedure used during the gas analysis After the arrival of D65 0032 cylinder in the laboratory, the cylinder was stabilised at room temperature (22 ºC ± 2 ºC) and humidity of (50 % ± 10%) before checking the pressure and doing measurements. The standards and sample were transferred directly to the FTIR using a system composed of pressure regulator, mass flow controller and control valves. The measurements of D65 0032 received from the coordinator (BIPM) were made during January 2010 by direct comparison with four gravimetric preparation standards by NMISA containing 10 μmol/mol concentrations. The results reported all follow from a “bracketing” comparison strategy. For FTIR measurements a NICOLET-Magna-IR-560 was used. A fixed optical path length gas cell of 10 m from Gemini-Mars was used. Measurement conditions: 0.5 cm-1 resolution, 64 scans, phase correction (Mertz), Happ-Genzel apodization, water correction performed by the OMNIC-Software, zero level of zero-filling, liquid nitrogen cooled mercury cadmium telluride (MCT/A) detector. Nominal measurement pressure for all samples: 109.5 kPa. The optical bench set up was continuously purged with BIPTM + N2 (6.0).
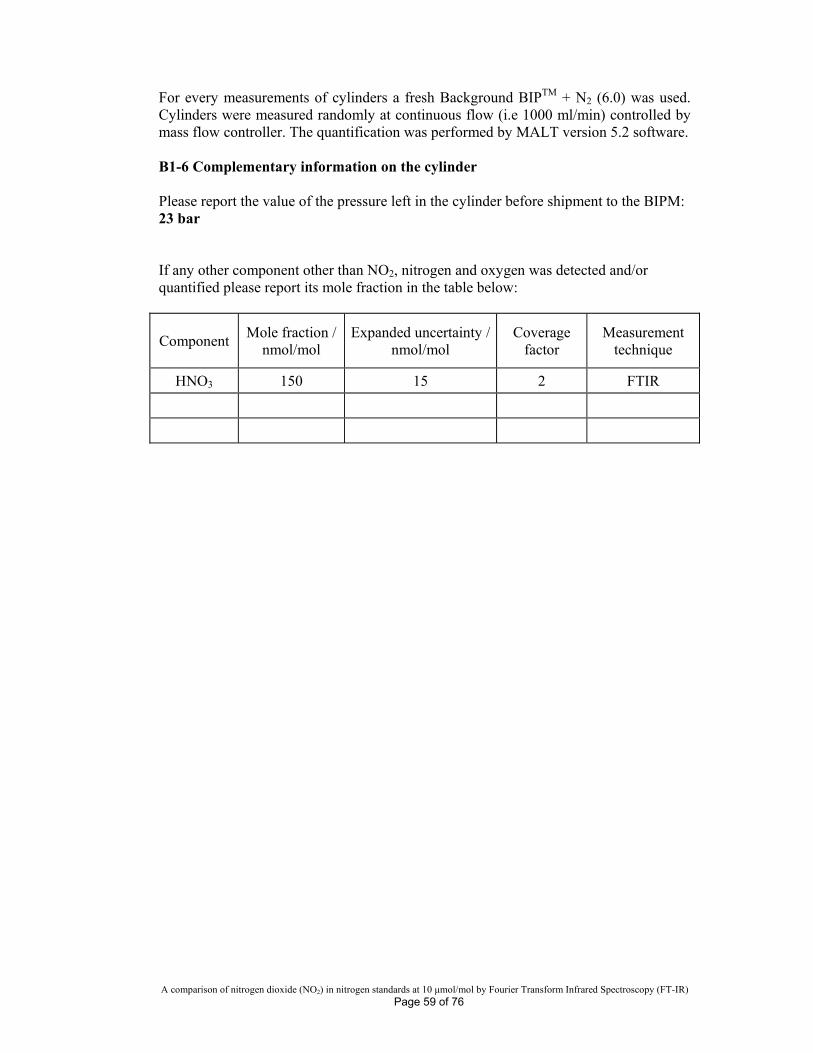
A comparison of nitrogen dioxide (NO2) in nitrogen standards at 10 μmol/mol by Fourier Transform Infrared Spectroscopy (FT-IR) Page 59 of 76
For every measurements of cylinders a fresh Background BIPTM + N2 (6.0) was used. Cylinders were measured randomly at continuous flow (i.e 1000 ml/min) controlled by mass flow controller. The quantification was performed by MALT version 5.2 software.
B1-6 Complementary information on the cylinder Please report the value of the pressure left in the cylinder before shipment to the BIPM: 23 bar If any other component other than NO2, nitrogen and oxygen was detected and/or quantified please report its mole fraction in the table below:
Component Mole fraction /
nmol/mol Expanded uncertainty /
nmol/mol Coverage
factor Measurement
technique
HNO3 150 15 2 FTIR
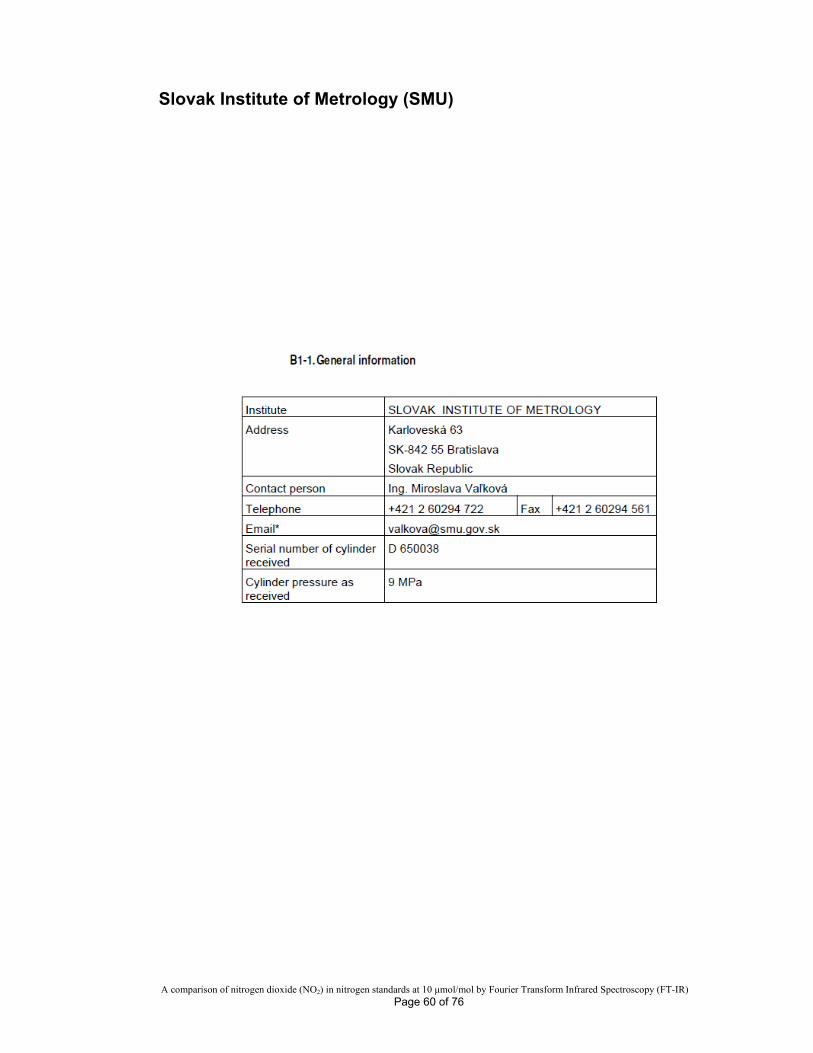
A comparison of nitrogen dioxide (NO2) in nitrogen standards at 10 μmol/mol by Fourier Transform Infrared Spectroscopy (FT-IR) Page 60 of 76
Slovak Institute of Metrology (SMU)
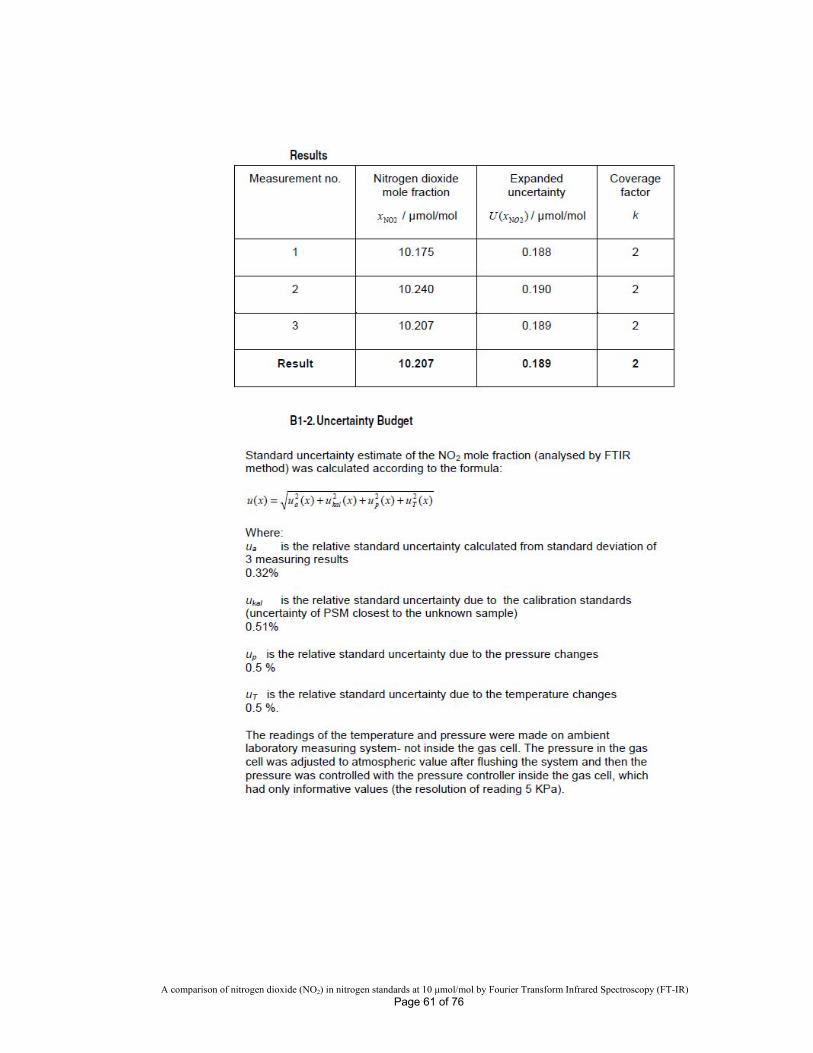
A comparison of nitrogen dioxide (NO2) in nitrogen standards at 10 μmol/mol by Fourier Transform Infrared Spectroscopy (FT-IR) Page 61 of 76
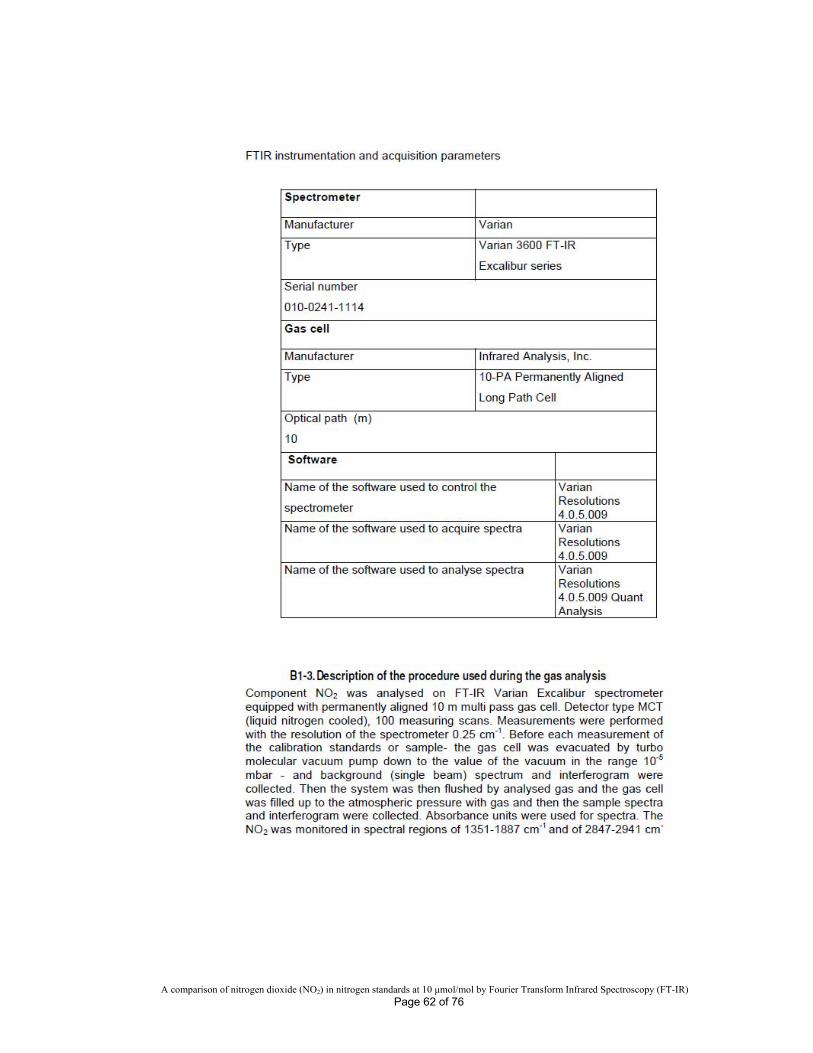
A comparison of nitrogen dioxide (NO2) in nitrogen standards at 10 μmol/mol by Fourier Transform Infrared Spectroscopy (FT-IR) Page 62 of 76
A comparison of nitrogen dioxide (NO2) in nitrogen standards at 10 μmol/mol by Fourier Transform Infrared Spectroscopy (FT-IR) Page 63 of 76
A comparison of nitrogen dioxide (NO2) in nitrogen standards at 10 μmol/mol by Fourier Transform Infrared Spectroscopy (FT-IR) Page 64 of 76
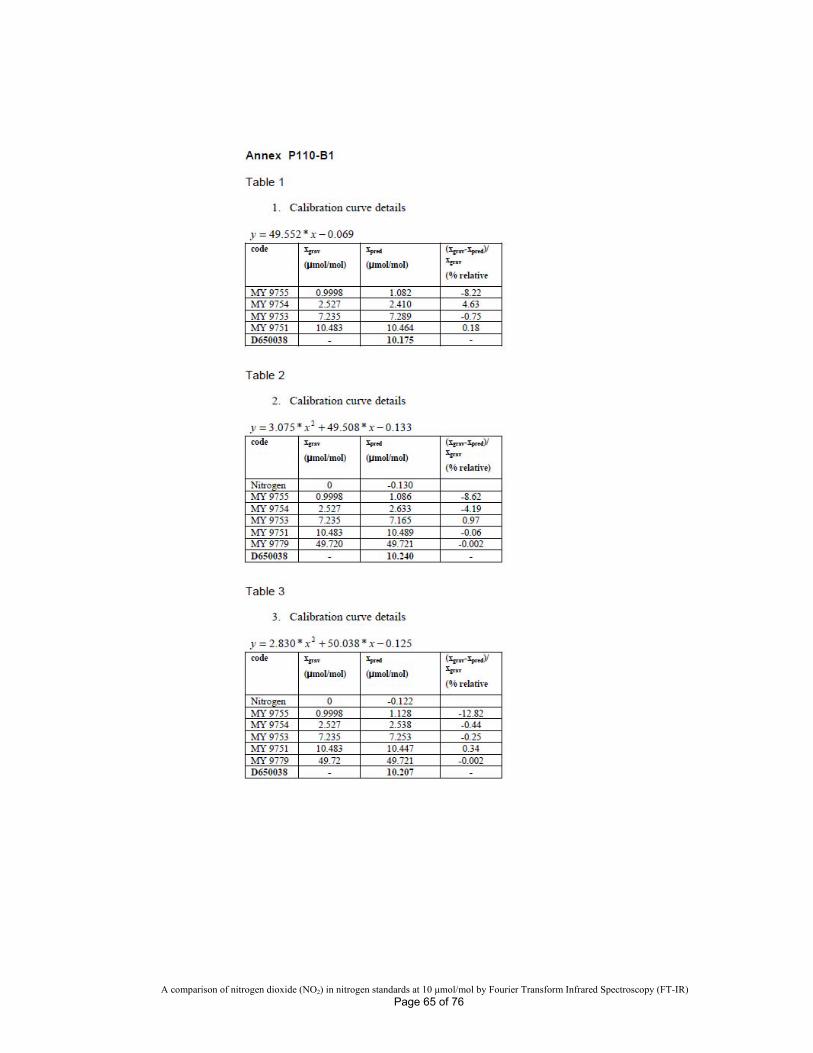
A comparison of nitrogen dioxide (NO2) in nitrogen standards at 10 μmol/mol by Fourier Transform Infrared Spectroscopy (FT-IR) Page 65 of 76
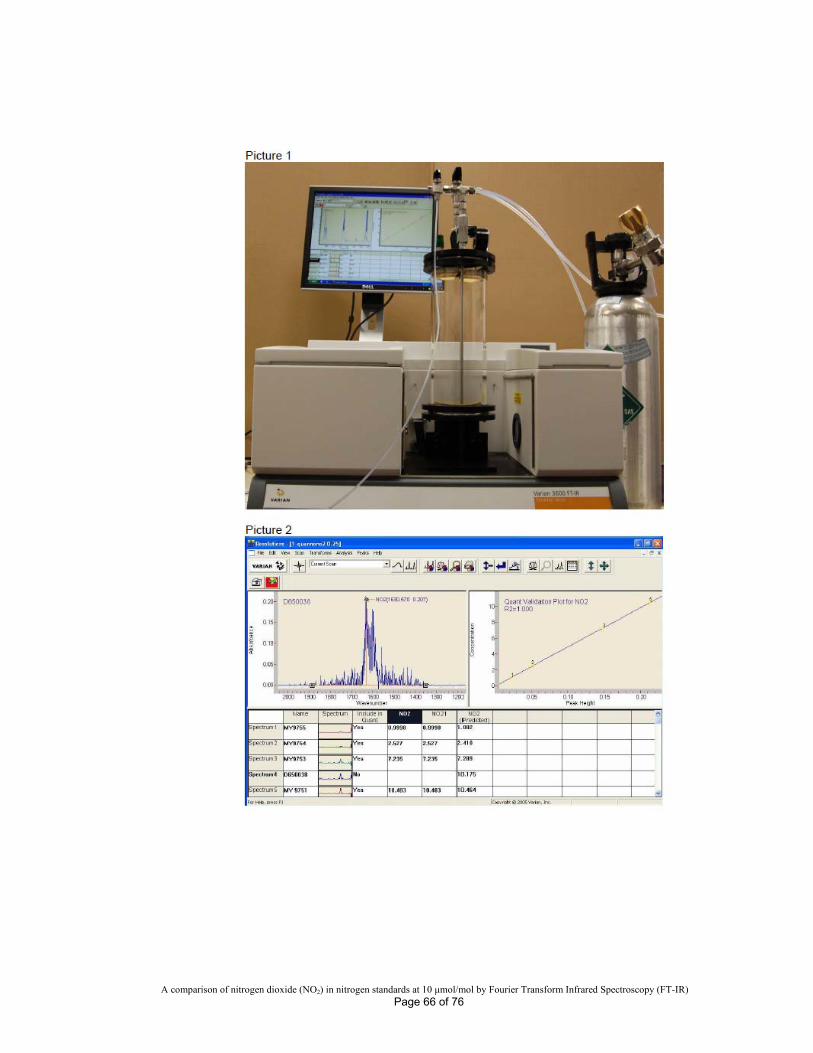
A comparison of nitrogen dioxide (NO2) in nitrogen standards at 10 μmol/mol by Fourier Transform Infrared Spectroscopy (FT-IR) Page 66 of 76
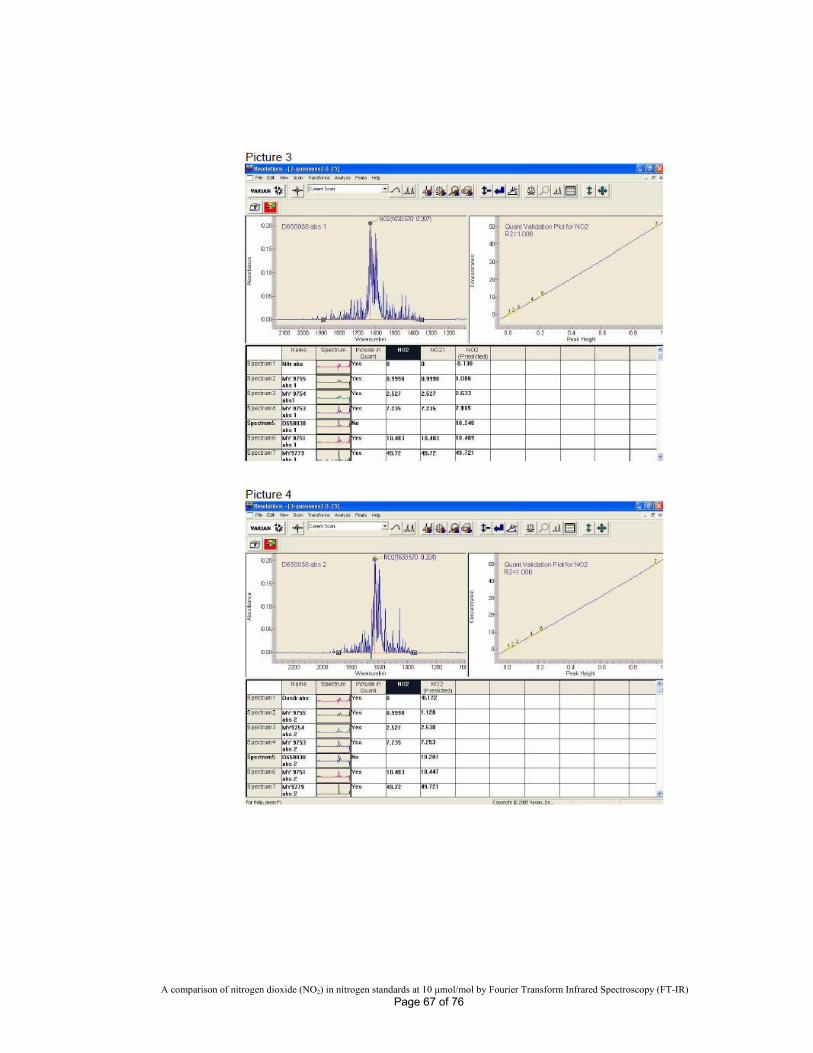
A comparison of nitrogen dioxide (NO2) in nitrogen standards at 10 μmol/mol by Fourier Transform Infrared Spectroscopy (FT-IR) Page 67 of 76
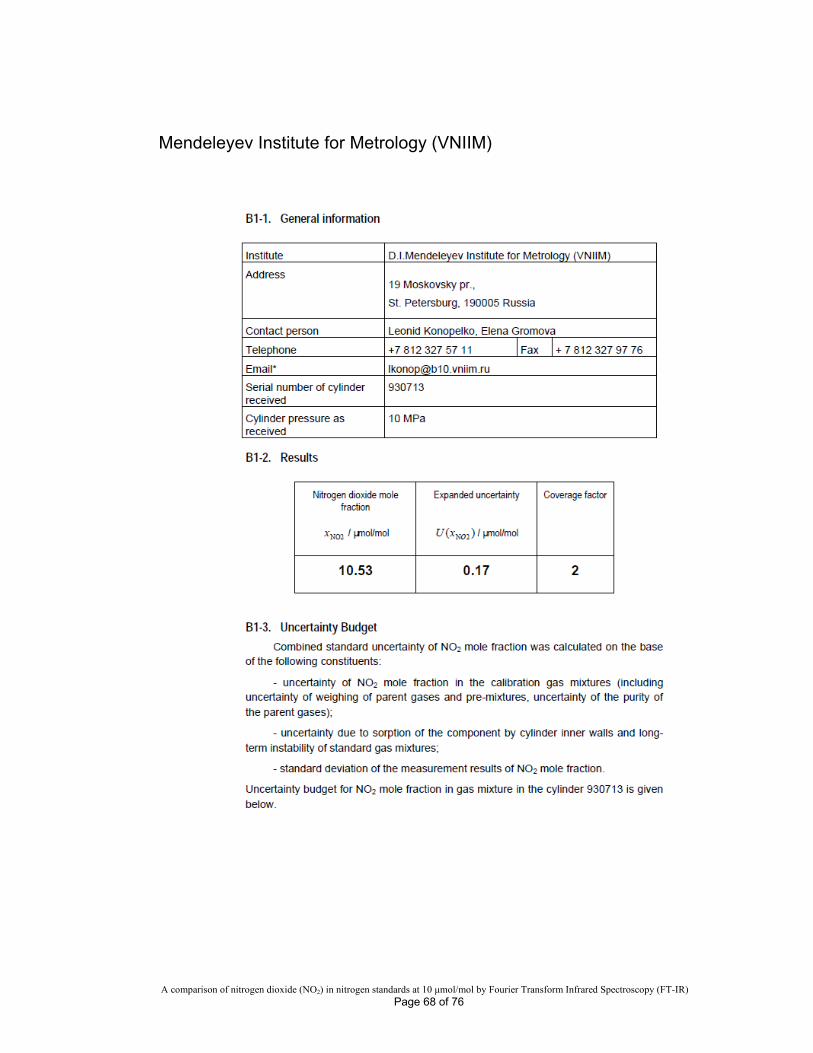
A comparison of nitrogen dioxide (NO2) in nitrogen standards at 10 μmol/mol by Fourier Transform Infrared Spectroscopy (FT-IR) Page 68 of 76
Mendeleyev Institute for Metrology (VNIIM)
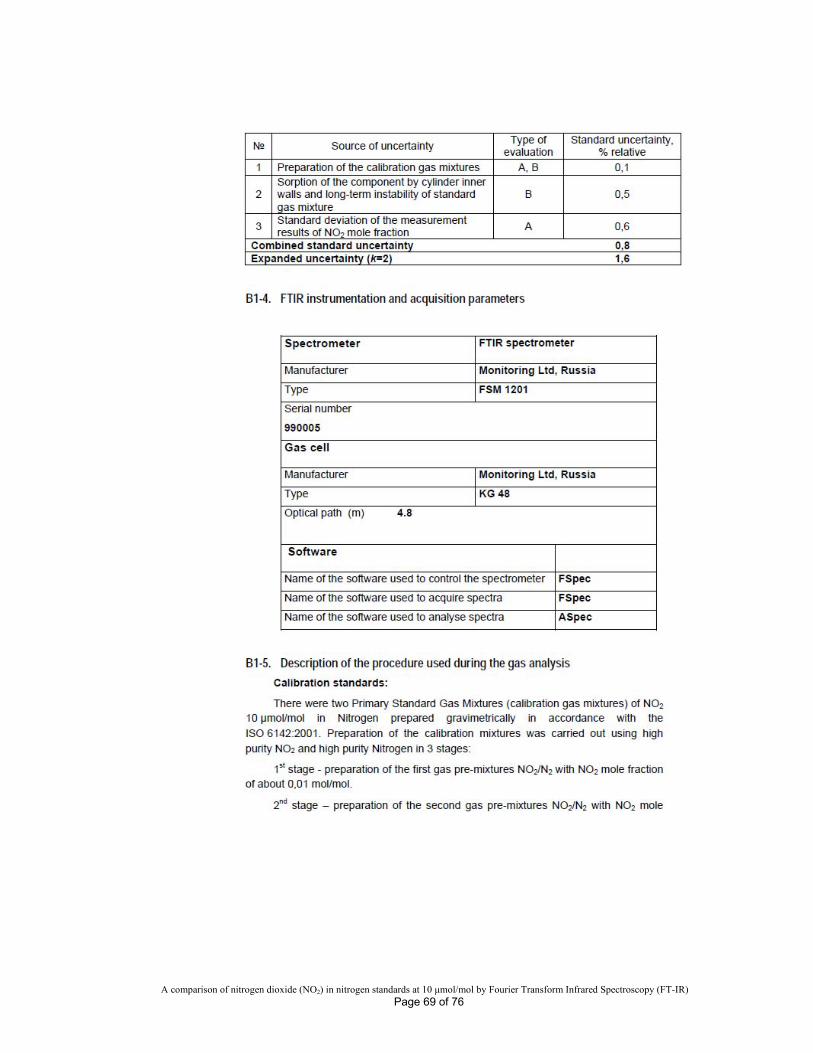
A comparison of nitrogen dioxide (NO2) in nitrogen standards at 10 μmol/mol by Fourier Transform Infrared Spectroscopy (FT-IR) Page 69 of 76
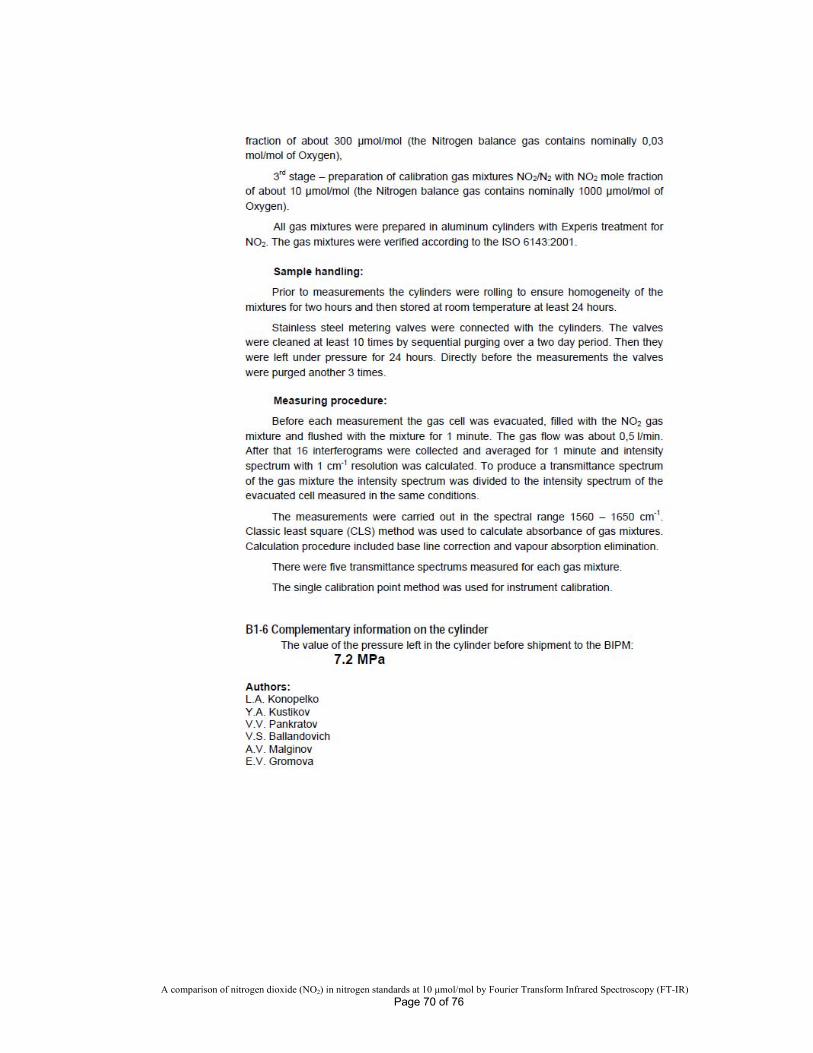
A comparison of nitrogen dioxide (NO2) in nitrogen standards at 10 μmol/mol by Fourier Transform Infrared Spectroscopy (FT-IR) Page 70 of 76
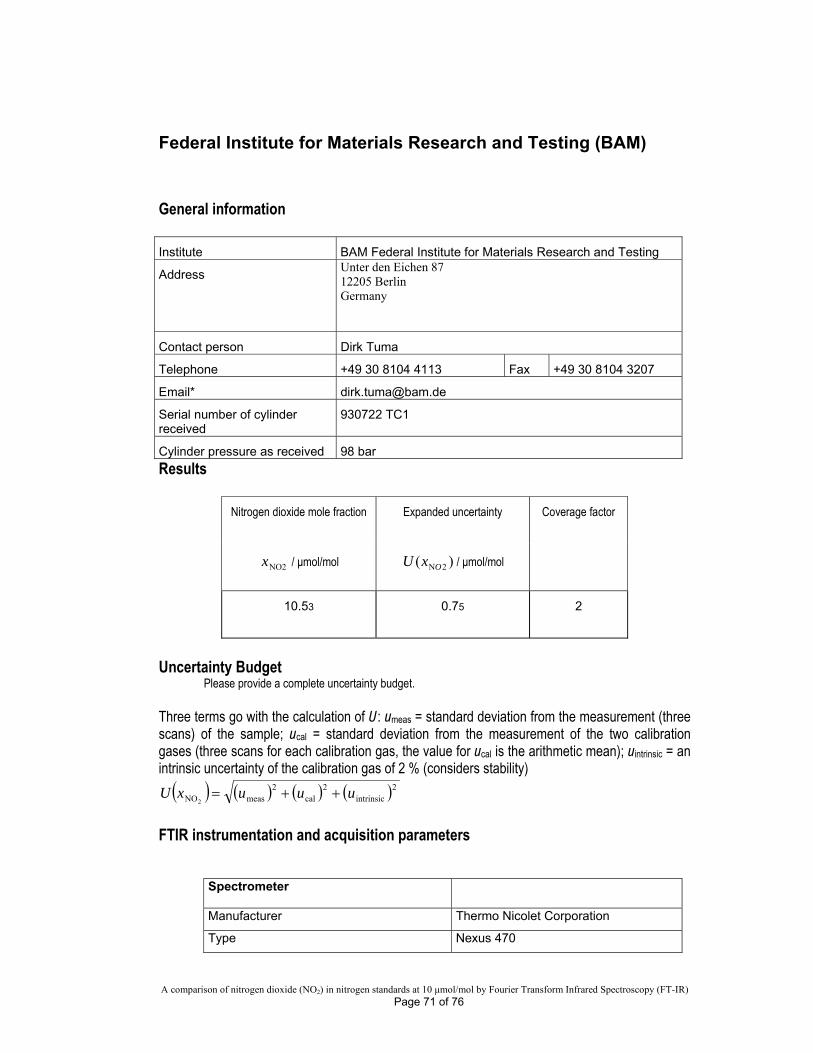
A comparison of nitrogen dioxide (NO2) in nitrogen standards at 10 μmol/mol by Fourier Transform Infrared Spectroscopy (FT-IR) Page 71 of 76
Federal Institute for Materials Research and Testing (BAM)
General information Institute BAM Federal Institute for Materials Research and Testing
Address Unter den Eichen 87 12205 Berlin Germany
Contact person Dirk Tuma
Telephone +49 30 8104 4113 Fax +49 30 8104 3207
Email* [email protected]
Serial number of cylinder received
930722 TC1
Cylinder pressure as received 98 bar
Results
Nitrogen dioxide mole fraction Expanded uncertainty Coverage factor
NO2x / μmol/mol )( 2NOxU / μmol/mol
10.53 0.75 2
Uncertainty Budget
Please provide a complete uncertainty budget. Three terms go with the calculation of U: umeas = standard deviation from the measurement (three scans) of the sample; ucal = standard deviation from the measurement of the two calibration gases (three scans for each calibration gas, the value for ucal is the arithmetic mean); uintrinsic = an intrinsic uncertainty of the calibration gas of 2 % (considers stability)
2intrinsic
2cal
2measNO2
uuuxU
FTIR instrumentation and acquisition parameters
Spectrometer
Manufacturer Thermo Nicolet Corporation
Type Nexus 470
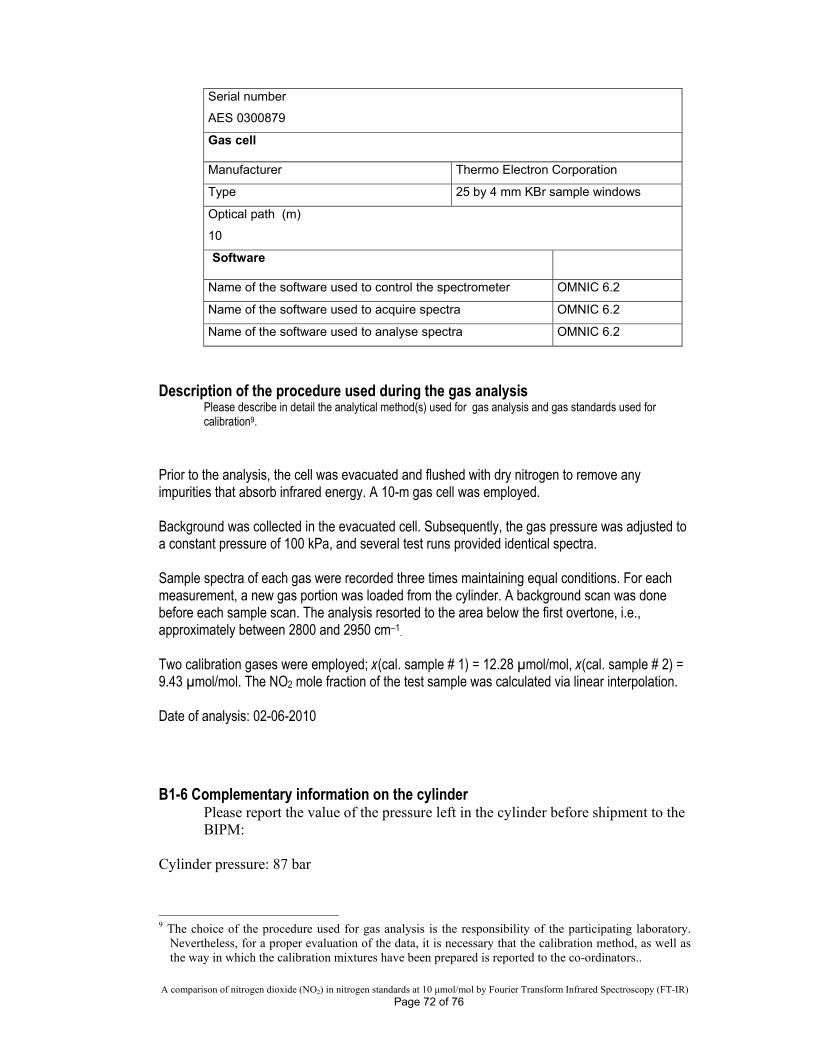
A comparison of nitrogen dioxide (NO2) in nitrogen standards at 10 μmol/mol by Fourier Transform Infrared Spectroscopy (FT-IR) Page 72 of 76
Serial number
AES 0300879
Gas cell Manufacturer Thermo Electron Corporation
Type 25 by 4 mm KBr sample windows
Optical path (m)
10
Software
Name of the software used to control the spectrometer OMNIC 6.2
Name of the software used to acquire spectra OMNIC 6.2
Name of the software used to analyse spectra OMNIC 6.2
Description of the procedure used during the gas analysis
Please describe in detail the analytical method(s) used for gas analysis and gas standards used for calibration9.
Prior to the analysis, the cell was evacuated and flushed with dry nitrogen to remove any impurities that absorb infrared energy. A 10-m gas cell was employed. Background was collected in the evacuated cell. Subsequently, the gas pressure was adjusted to a constant pressure of 100 kPa, and several test runs provided identical spectra. Sample spectra of each gas were recorded three times maintaining equal conditions. For each measurement, a new gas portion was loaded from the cylinder. A background scan was done before each sample scan. The analysis resorted to the area below the first overtone, i.e., approximately between 2800 and 2950 cm–1. Two calibration gases were employed; x(cal. sample # 1) = 12.28 µmol/mol, x(cal. sample # 2) = 9.43 µmol/mol. The NO2 mole fraction of the test sample was calculated via linear interpolation. Date of analysis: 02-06-2010
B1-6 Complementary information on the cylinder Please report the value of the pressure left in the cylinder before shipment to the BIPM:
Cylinder pressure: 87 bar 9 The choice of the procedure used for gas analysis is the responsibility of the participating laboratory.
Nevertheless, for a proper evaluation of the data, it is necessary that the calibration method, as well as the way in which the calibration mixtures have been prepared is reported to the co-ordinators..
A comparison of nitrogen dioxide (NO2) in nitrogen standards at 10 μmol/mol by Fourier Transform Infrared Spectroscopy (FT-IR) Page 73 of 76
If any other component other than NO2, nitrogen and oxygen was detected and/or quantified please report its mole fraction in the table below:
Component Mole fraction / nmol/mol Expanded uncertainty Coverage factor Measurement
technique
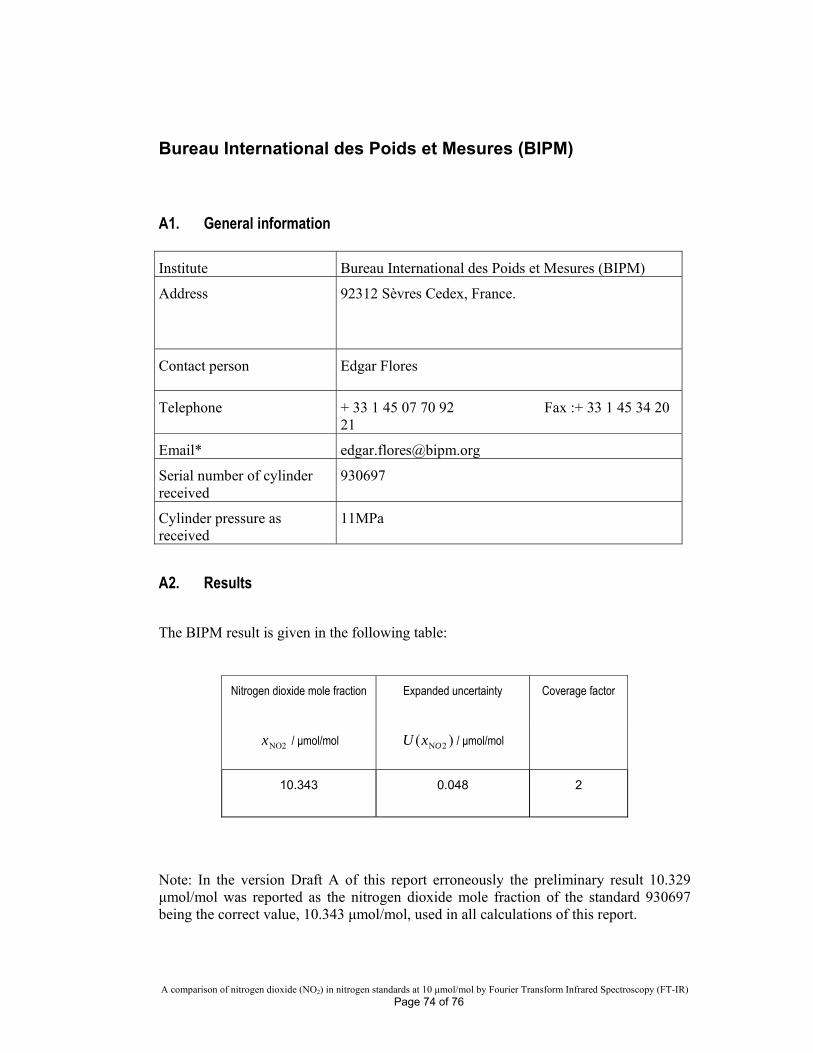
A comparison of nitrogen dioxide (NO2) in nitrogen standards at 10 μmol/mol by Fourier Transform Infrared Spectroscopy (FT-IR) Page 74 of 76
Bureau International des Poids et Mesures (BIPM) A1. General information
Institute Bureau International des Poids et Mesures (BIPM)
Address 92312 Sèvres Cedex, France.
Contact person Edgar Flores
Telephone + 33 1 45 07 70 92 Fax :+ 33 1 45 34 20 21
Email* [email protected]
Serial number of cylinder received
930697
Cylinder pressure as received
11MPa
A2. Results The BIPM result is given in the following table:
Nitrogen dioxide mole fraction Expanded uncertainty Coverage factor
NO2x / μmol/mol )( 2NOxU / μmol/mol
10.343 0.048 2
Note: In the version Draft A of this report erroneously the preliminary result 10.329 μmol/mol was reported as the nitrogen dioxide mole fraction of the standard 930697 being the correct value, 10.343 μmol/mol, used in all calculations of this report.
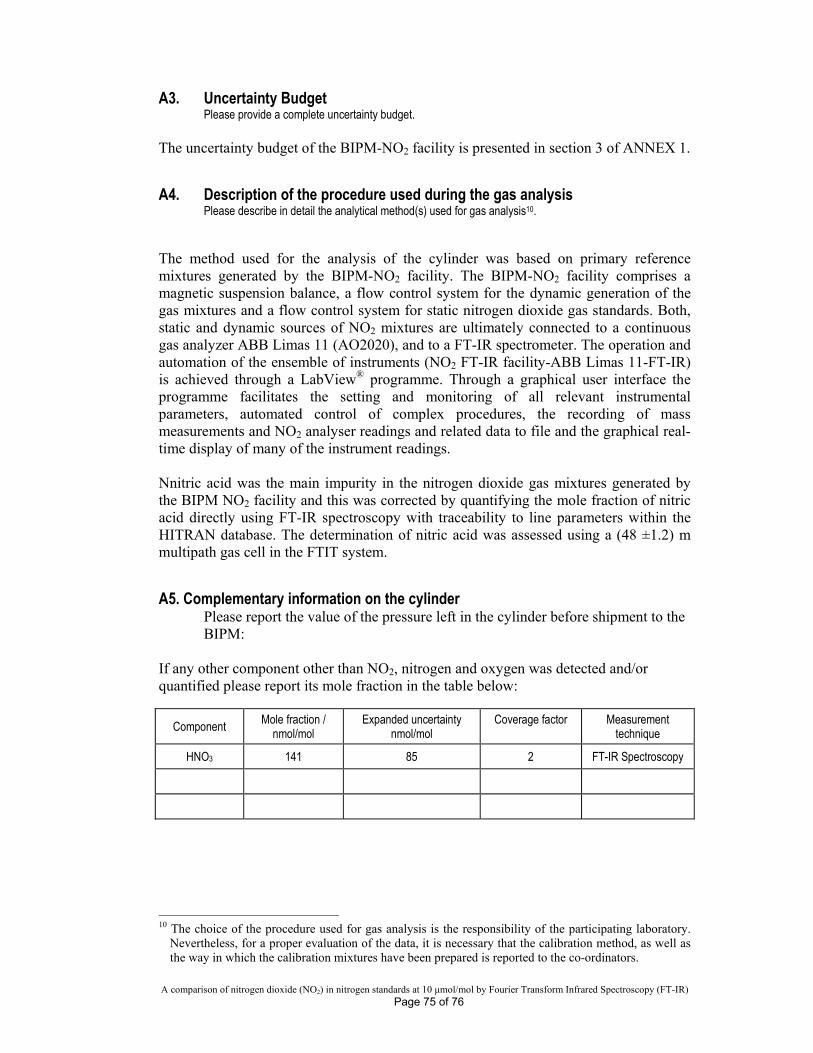
A comparison of nitrogen dioxide (NO2) in nitrogen standards at 10 μmol/mol by Fourier Transform Infrared Spectroscopy (FT-IR) Page 75 of 76
A3. Uncertainty Budget Please provide a complete uncertainty budget.
The uncertainty budget of the BIPM-NO2 facility is presented in section 3 of ANNEX 1.
A4. Description of the procedure used during the gas analysis Please describe in detail the analytical method(s) used for gas analysis10.
The method used for the analysis of the cylinder was based on primary reference mixtures generated by the BIPM-NO2 facility. The BIPM-NO2 facility comprises a magnetic suspension balance, a flow control system for the dynamic generation of the gas mixtures and a flow control system for static nitrogen dioxide gas standards. Both, static and dynamic sources of NO2 mixtures are ultimately connected to a continuous gas analyzer ABB Limas 11 (AO2020), and to a FT-IR spectrometer. The operation and automation of the ensemble of instruments (NO2 FT-IR facility-ABB Limas 11-FT-IR) is achieved through a LabView® programme. Through a graphical user interface the programme facilitates the setting and monitoring of all relevant instrumental parameters, automated control of complex procedures, the recording of mass measurements and NO2 analyser readings and related data to file and the graphical real-time display of many of the instrument readings. Nnitric acid was the main impurity in the nitrogen dioxide gas mixtures generated by the BIPM NO2 facility and this was corrected by quantifying the mole fraction of nitric acid directly using FT-IR spectroscopy with traceability to line parameters within the HITRAN database. The determination of nitric acid was assessed using a (48 ±1.2) m multipath gas cell in the FTIT system. A5. Complementary information on the cylinder
Please report the value of the pressure left in the cylinder before shipment to the BIPM:
If any other component other than NO2, nitrogen and oxygen was detected and/or quantified please report its mole fraction in the table below:
Component Mole fraction / nmol/mol
Expanded uncertainty nmol/mol
Coverage factor
Measurement technique
HNO3 141 85 2 FT-IR Spectroscopy
10 The choice of the procedure used for gas analysis is the responsibility of the participating laboratory.
Nevertheless, for a proper evaluation of the data, it is necessary that the calibration method, as well as the way in which the calibration mixtures have been prepared is reported to the co-ordinators.
A comparison of nitrogen dioxide (NO2) in nitrogen standards at 10 μmol/mol by Fourier Transform Infrared Spectroscopy (FT-IR) Page 76 of 76
Bibliography (1) Flores E., Moussay P., Viallon J., Wielgosz R., Fernández T., Ramírez S., Rojo A., Shinji U.,
Waldén J., Sega M., Sang-Hyub H., Macé T., Couret C., Qiao H., Smeulders D., Guenther F., J Thorn W., Tshilongo J., Godwill Ntsasa N., Štovcík V., Valková M., Konopelko L., Gromova E., Nieuwenkamp G., Wessel R., Milton M., Harling A., Vargha G., Tuma D., Kohl A. and Schulz G.: Final report on international comparison CCQM-K74: Nitrogen dioxide, 10 µmol/mol Metrologia, 49, Tech. Suppl., 08005 (2012 ).
(2) AIJaZM C. Probert: An intercomparison of low flow gas facilities at eleven European laboratories using a Molbloc transfer package: EURAMET.MM.FF-S3 (EURAMET Project no 806) Metrologia 45, Tec. Sup. (2008).
(3) DWT Griffith: Synthetic calibration and quantitative analysis of gas phase FTIR spectra. Applied spectroscopy 50 (1996) 59-70


![[PPT]Propelling Broadband through ITU-T Standards Bilel_ITU.ppt · Web viewTitle Propelling Broadband through ITU-T Standards Author Mauree, Venkatesen Last modified by dop Document](https://static.fdocument.org/doc/165x107/5aa1f8287f8b9a1f6d8c9bdb/pptpropelling-broadband-through-itu-t-bilelitupptweb-viewtitle-propelling-broadband.jpg)