82 - ΕΚΠΑ - Προσωπικές Ιστοσελίδεςusers.uoa.gr/~jalexopoulos/papers/28...
17
82
Transcript of 82 - ΕΚΠΑ - Προσωπικές Ιστοσελίδεςusers.uoa.gr/~jalexopoulos/papers/28...

82
jalexopoulos
Rectangle

Elaboration of GIS based multidisciplinary data for microzoning studies
By
Papadopoulos T .D., Voulgaris N . and Alexopoulos J.
Abstract
The elaboration of analytical microzoning studies involves a multidisciplinary
approach comprising geological, geotechnical, seismological, geophysical and
dynamic soil analysis data. In an attempt to incorporate the maximum available
amount of information and in the view of the continuously expanding use of GIS, as a
tool for analyzing and integrating data, a new software environment called AUTO-
SEISMO-GEOTECH has been developed for handling these multi-parameter data.
This user friendly package is presently implemented for the cities of Heraklion (Crete
island) and Thiva (province of Beotia) in Greece.
The pilot methodologies applied in these urban areas, aimed also at determining a
minimum package of tasks/methods needed for the elaboration of a microzoning
study, are described and evaluated here. Next, a data bank with appropriate
architecture was formed in order to handle all available geo-information for each city
separately and produce thematic maps, such as geological, tectonic, hydrogeological,
seismic hazard and microzonation ones. These maps can be easily reproduced,
integrated and be used for building safer constructions contributing so to mitigation of
earthquake consequences.
Geo-information obtained by a) existing regional seismicty maps and installation of
local portable seismographic networks around in both cities, to monitor the
microseismic activity and define possible active fault zones, b) geological mapping of
the broader urban area in scale 1:5000, c) evaluation of existing geotechnical data as
well as new data coming from boreholes, d) geophysical data resulted from surface
and borehole techniques, for Vp, Vs and dynamic elastic parameters estimation and e)
consideration of historical seismological data for seismic hazard estimation, have
been incorporated in this GIS based platform, to be easily handled for further use. The
output of this information combined with the dynamic soil analysis produces detailed
microzonation maps. Such maps are valuable in city planners and urban designers.
Introduction
During the last two decades microzoning studies in Greece have been considered as a
primary tool towards seismic risk mitigation. Such studies were usually carried out in
cities that had previously suffered severe damages as a result of a strong earthquake,
or in areas that are characterized by high seismic risk. By definition microzonation
studies require a multidisciplinary approach based on geological, geotechnical,
seismological, geophysical dynamic soil analysis methodologies while the final
product is usually expressed as a map or series of maps providing detailed
information for strong motion amplification and frequency content in the investigated
areas. However, the application of various methodologies from the different fields of
geosciences, although required in order to guarantee a successflil approach, is linked
to a large volume of non-uniform data creating information management, analysis,
integration and evaluation problems. Due to the inherent spatial attributes of the data a
Geographical Information System (GIS) platform coupled with a user friendly
environment represents the best possible solution to this problem. AUTO-SEISMO-
GEOTECH represents such a multidisciplinary microzonation environment presently
implemented for the cities of Heraklion (Crete island) and Thiva (Beotia) (figure 1).
Designed with the characteristics of an open system AUTO-SEISMO-GEOTECH
2

provides the possibility to integrate additional data as they become available, while
already existing geoinformation can support additional environmental tasks in the
same areas.
20' 22" 24" 26' 28"
22- 24" 26" 28"
Figure 1. The two investigated areas.
System Architecture
The architecture of the AUTO-SEISMO-GEOTECH can be better understood i f the
system is examined from a GIS point of view in terms of layers, while several layers
can also be combined in groups based on their common characteristics or origins.
Processing and analysis of a given layer or layer combinations can produce new
layers and so forth (figure 2).
3

U F E U N E S i
J
t| B U I L D I N G STQCK|i'
1 r-I | T O P Q G F W H 7 | i
I I LAND USE| j
I I G E O L O G I C A L [ -
I
I D E M J
M O R P H O L O G I C A L ! A N A L Y S I S wj
HTECTOr>aC
SEISMICITY
L _
HYDRO LITHIC j CHARACTtRIZATIQN j
SEISMIC HAZARD ESTIMATES
- j i GEOPHYSICALl j
HBOREHOLE
I liN s r r u l I
LABORATORY TESTING
L ROCK-SOIL
C HAR ACTE RIZATIO N
BASEMEKT MORPHOLOGY
MICROZONATION|
AWaFICATTON F R E Q U E N C E :
Figure 2. The AUTO-SEISMO-GEOTECH. GIS based architecture
The first group is farmed by all layers corresponding to the basic type of data that are
expected to be available for the area under investigation such as topography, building
stock, road and lifeline networks (using a scale of 1:5000). This initial group forms
the basis of the system and must be therefore created beforehand. Morphological
element analysis and Digital Elevation Models (DEM) could represent some of the
resulting layers for this first group.
In the second group layers resulting from geological, tectonic, seismicity and seismic
hazard studies are included. Hydrohthic, rock-soil characterization (borehole data and
in situ measurements) and geotechnical mapping could be some of the resuhing layers
in this group.
The third and final group contains all these layers that are associated with extensive
field work operations aiming at determining the basement morphology as well as the
spatial and depth variations of rock properties and elastic constants (Young moduli
etc) in the investigated areas. Furthermore, location map layers of geophysical

measurements and boreholes "hot" linked to the actual data and interpretation logs
could provide the most efficient method for organizing and archiving measurements.
In this case these "location" layers should be considered as initial or main layers while
basement morphology, or rock property represent resuhing layers.
The three main layer groups with the corresponding resuhing layers have been
described above. However, for the next level of operations where dynamic soil
analysis is carried out combination of data from the second and third group is
required. The same applies for the compilation of the microzonation map with the
required addition of layers also from the first group.
Multi-parameter data management
The system architecture described previously was the basis for developing the AUTO-
SEISMO-GEOTECH platform for handling non graphical (tables, etc.) and graphical
(maps, etc.) simuhaneously. "Hotspot" definition techniques were used in order to
provide the links necessary for displaying data and results obtained by the different
studies while continuously operating within the GIS environment.
The actual development of the platform was carried out in parallel with field
operations and research activities in Heraklion where initial testing was performed.
Additional tests were carried out in Thiva area and the results were introduced in the
basic environment that was already developed, thus providing an opportunity for
evaluating the flexibility of the system and its adaptive capabilities.
A combined example for the first layer group including topographic relief, building
stock and roads for the city of Heraklion is given in figure 3. As mentioned previously
slope and aspect maps can be constructed based on this primary data layers.
5
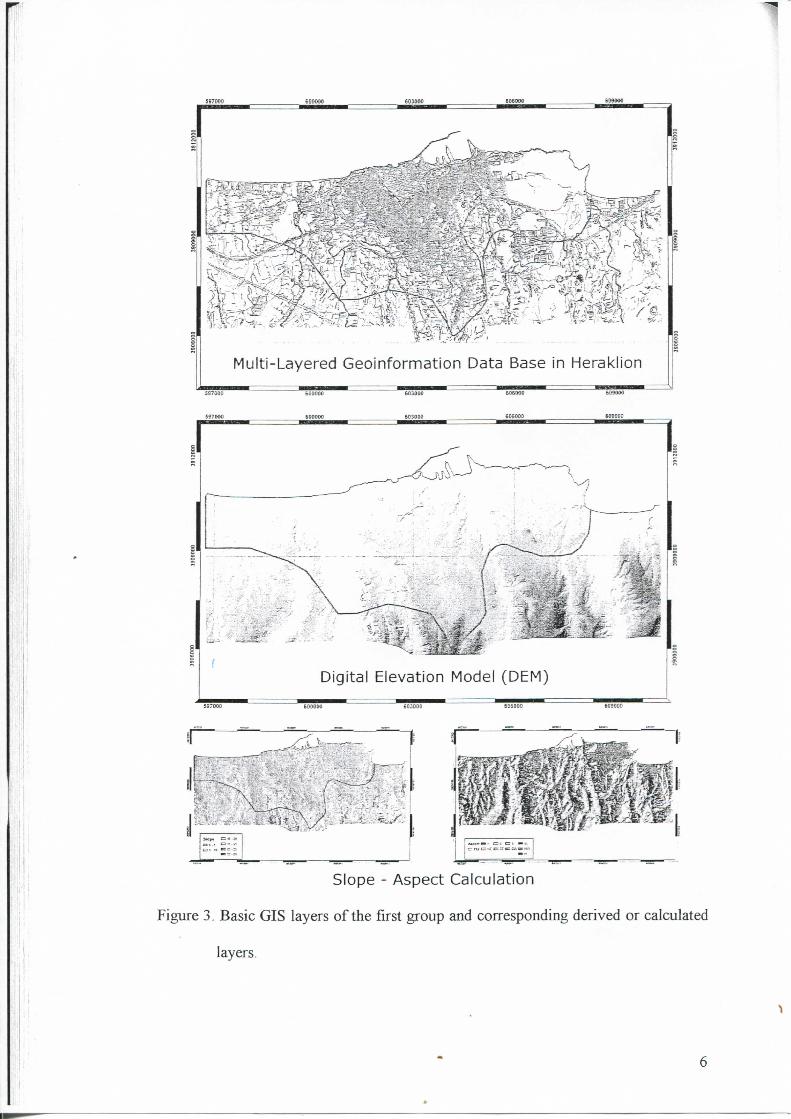
Mul t i -Layered Geo i n f o rma t i on Data Base in Herak l ion
Dig i ta l E levat ion Model (DEM)
Slope - Aspec t Ca lcu la t ion
Figure 3. Basic GIS layers of the first group and corresponding derived or calculated
layers.
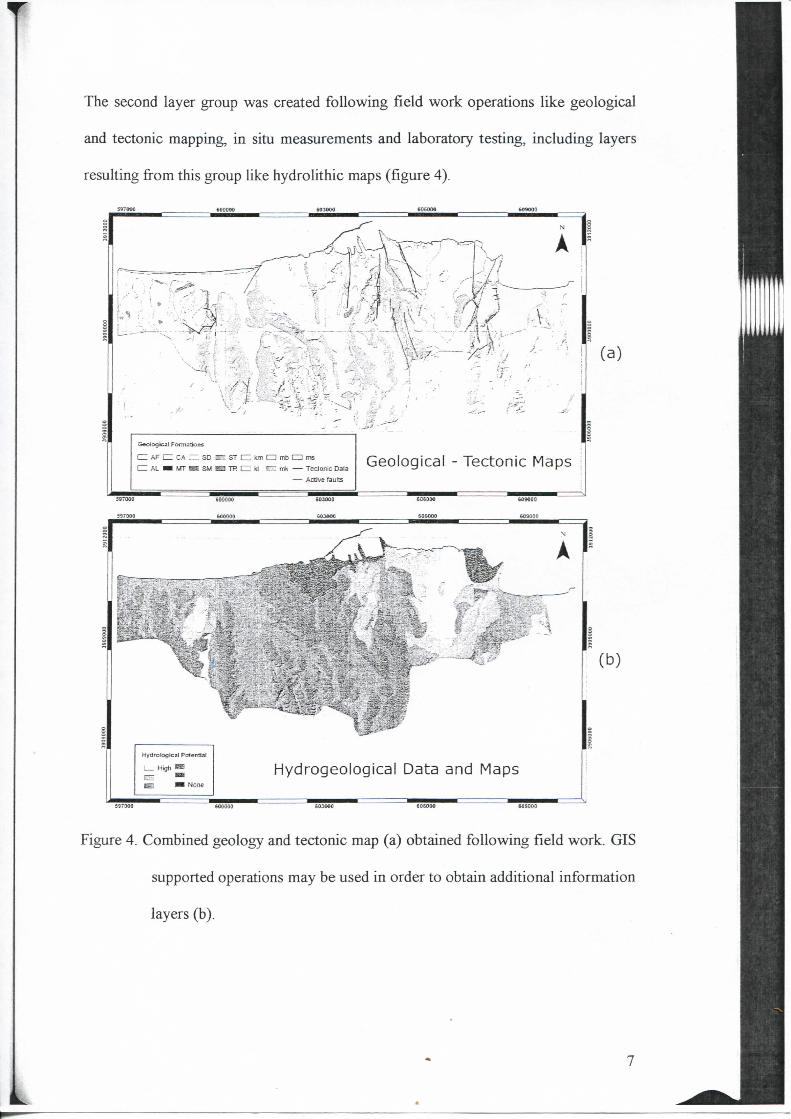
The second layer group was created following field work operations like geological
and tectonic mapping, in situ measurements and laboratory testing, including layers
resulting from this group like hydrolithic maps (figure 4).
(a )
Geological Formations
AF nz CA SZ.SD ST d km • mb ms
I ALiMMT SW TRCZkt EZmK Tedonic Data — Active faults
Geolog ica l - Tecton ic Maps \
Hydrogeo log i ca l Data and Maps
Figure 4. Combined geology and tectonic map (a) obtained following field work. GIS
supported operations may be used in order to obtain additional information
layers (b).
7
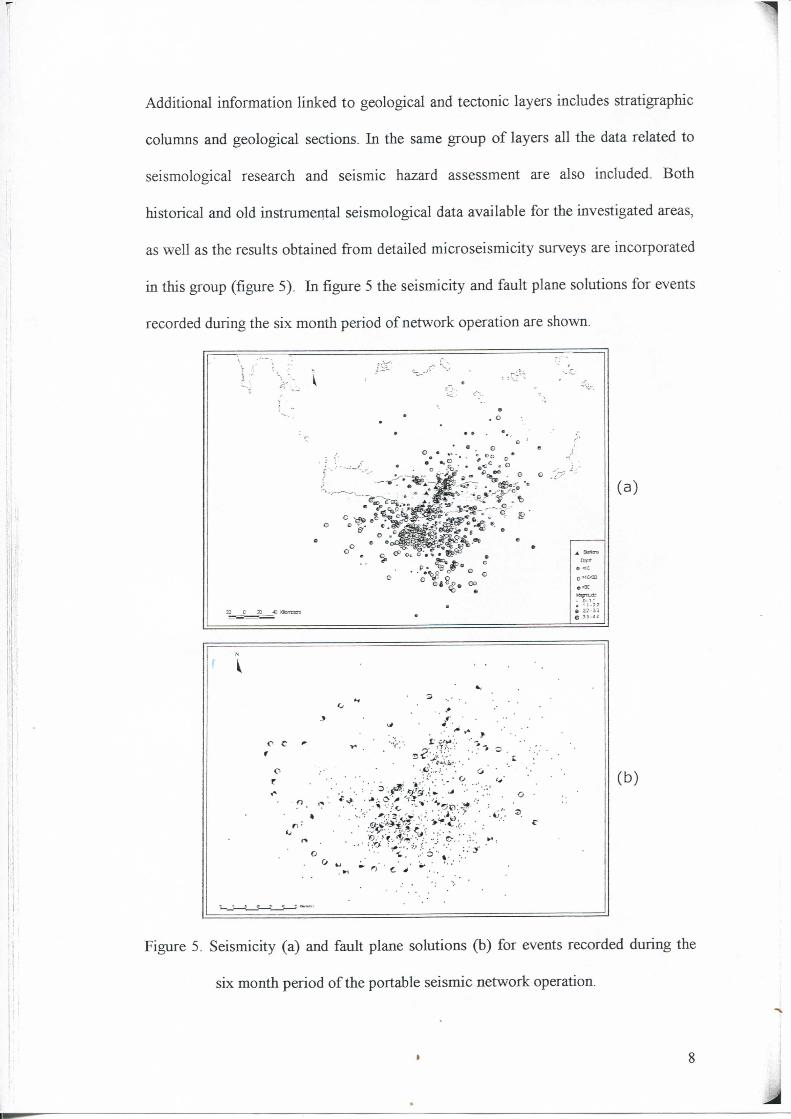
Additional information linked to geological and tectonic layers includes stratigraphic
columns and geological sections. In the same group of layers all the data related to
seismological research and seismic hazard assessment are also included. Both
historical and old instrumental seismological data available for the investigated areas,
as well as the results obtained from detailed microseismicity surveys are incorporated
in this group (figure 5). In figure 5 the seismicity and fauk plane solutions for events
recorded during the six month period of network operation are shown.
ZD C 20 « KtoTcttre
c t o u
3
A Srtcra
0>1C<30
, . 3 C
(a)
(b)
Figure 5. Seismicity (a) and fault plane solutions (b) for events recorded during the
six month period of the portable seismic network operation.
In a first step towards seismic hazard estimation, purely statistical methodologies
were used to define maximum expected earthquake magnitudes. Next, by combining
seismological data layers with the available tectonic information, the seismic sources
which are expected to contribute to the seismic hazard of each area were defined and
their seismic potential was calculated. Since a variety of seismic hazard assessment
methodologies are usually applied requiring different parameterization of these
sources (linear, area or dipping) a number of source model GIS layers can be created.
Applying the different seismic hazard estimation algorithms (Cornell 1968, Mortgat
and Shah 1989, McGuire 1976, McGuire, 1978) for two return periods of 475 and 949
years, several seismic hazard maps displaying maximum expected peak ground
acceleration and velocity values at the bedrock were created and introduced into the
system (Stavrakakis et al., 1997). The final maximum expected PGA and PGV maps
which were used later to create the microzonation map were derived through map
algebra fi-om the previous layers.
Finally, the third layer group encompasses all the data related to the geophysical
surveys and borehole geological and geotechnical data. A first objective for
geophysical and drilling data is to assist the delineation of basement morphology and
character in relation to the surface geology already described in the previous layer
group (figure 6c). This task was accomplished using surface seismic methods
(reflection - refi-action) and geolectrical methods (VES methods). Interpretation was
assisted by geophysical measurements within boreholes which were used for
calibration purposes (figure 6b).

•4
f
, , . f
I
'ii- • i^^^i^'f^'^lft'^ A I ^
(a)
- J ; - • SI
Geophysical Surface Measurements "Ho t spo t " Locat ion
VES / Geology Crosshole - Seismic Methods
1640 P 1=20-16=0 :,v's
1295: 13000 13O50 1310C 13150 1 320: 132SO 13300 13350 134C0 13450 13500 DISTANCE Inij
Velocity Vp (m/s)
I E ; : 1550 160C' iS50 Mtc :TSO I E C : ;85O I S : : I M O 3 C : : 2050
(b)
Figure 6. Geophysical measurements location and results.
The geophysical measurements within boreholes served also to achieve a second
objective, the determination of the elastic parameters to be used in order to describe
the dynamic behavior of the local soU and rock formations overlying the seismic
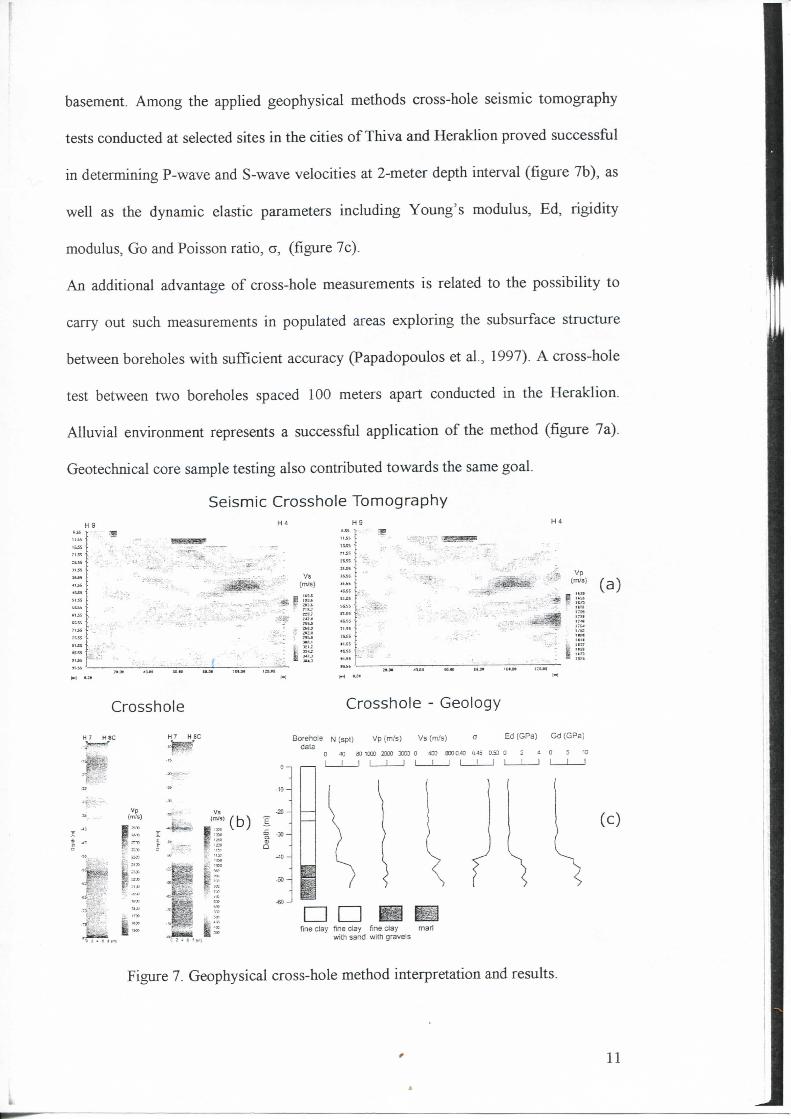
basement. Among the apphed geophysical methods cross-hole seismic tomography
tests conducted at selected sites in the cities of Thiva and HerakJion proved successful
in determining P-wave and S-wave velocities at 2-meter depth interval (figure 7b), as
well as the dynamic elastic parameters including Young's modulus, Ed, rigidity
modulus. Go and Poisson ratio, a, (figure 7c).
An additional advantage of cross-hole measurements is related to the possibility to
carry out such measurements in populated areas exploring the subsurface structure
between boreholes with sufficient accuracy (Papadopoulos et al , 1997). A cross-hole
test between two boreholes spaced 100 meters apart conducted in the Heraklion.
Alluvial environment represents a successful application of the method (figure 7a).
Geotechnical core sample testing also contributed towards the same goal.
Seismic Crosshole T omog raphy H9
V s (m/s)
V p (m/s)
(a )
Crosshole Crossho le - Geology
4 w . t ' ( b ) I
0 -1
- 1 0 -
- 2 0 -
Borehois N (spl) Vp (m/s) Vs (m.'s) a (Jala
0 « eo 10C0 2000 3000 0 CT 6000,40 0 45 0.53 0
I I 1 : I : I ! I L
Ed (GPa) Gd (GPa)
4 0 5 10
- J 1 I I
(c )
• c fine clay fine day fine clay marl
with sand with gravels
Figure 7. Geophysical cross-hole method interpretation and results.
11

The GIS platform on which the application was based proved indispensable during the
procedure of defining the hard rock basement, by combining all the above mentioned
data types and resuhs in a user fiiendly envirormient. All available data (electrical
soundings, cross-sections, tomographic images, electric/seismic-bedrock maps,
general information maps, tables, etc.) could be accessed independently or in
combined interpretations by clicking on predefined "hotspots" located on the main
map (figure 6a).
Geotectinical CI
CZ Haid Rock
Hard Soil
Geotechnical Mapping Rocl</Soil Character izat ion
Dynamic Soil Analysis
Figure 8. Dynamic soil analysis resuhs obtained by combining all available
information.
The geoinformation organized in the three layer groups described above, serves as the
basis for generating the next informational layer related to dynamic soil analysis
(figure 8). The main components contributing to the calculations required for this
12

generation process are those related to the geological, geophysical, geotechnical and
seismic hazard assessment, which can provide bedrock to surface amplification
estimates through well known algorithms such as the SHAKE program proposed by
Idriss and Sun (1992). Following the application of such analysis procedures at
selected representative test sites within the investigated areas and by combining the
obtained results with the available surface and basement morphology and geological
information, the final microzonation map for each area has been compiled based on
the various norms as defined by the Aseismic Building Code of Greece or the
Eurocode 8 of the EU (figure 9).
All these layers introduced into the GIS spatial database system, using a predefined
logical design in order to support automatic processing, can be readily examined by
the user who can also make comparisons and evaluation of the results according to his
specific needs. Furthermore, since this platform provides an open spatial database
system alternative or additional data, calculations and results can be introduced at any
time.
f
Discussion - Future Plans
As mentioned previously the aim for developing the AUTO-SEISMO-GEOTECH
platform was to provide an environment in order to support microzonation related
research activities. Presently the platform has been installed and is operational in the
municipalities of Heraklion and Thiva for five years. Feedback obtained from the
users revealed that several lines of action could contribute significantly to the
improvement and the usefulness of this platform. A first task appears to be related to
the necessity of automatic or semi-automatic database and map updates as new
information becomes available during additional surveys, including revision of
13

microzonation maps. In addition, improvement could also be made in the direction of
incorporating new advances emerging in each discipline involved, such as new, more
efficient methodologies with improved accuracy which could be incorporated in the
platform.
SSTMO 600000 6D3O00 606000 609000^
5 9 7 » 0 0 W O O O O 6 D 3 0 0 0 606000 609000
Figure 9. Final microzonation maps compiled by adopting two norms defined by the
Aseismic Building Code of Greece (NEAK) and Eurocode 8 (EC8).
14
Presently, the final output of the platform can be summarised in terms of a
microzonation map, expressing a detail image of seismic hazard variations wfithin the
two areas it has been implemented until now. This represents a very important task
towards seismic risk mitigation mainly related to pre-disaster policies and actions.
However, a further extension of the platform in order to include seismic risk
assessment related databases and map layers would flirther enhance its contribution
towards seismic risk mitigation by supporting retrofitting and emergency planning
during the pre-earthquake phase and emergency response and reconstruction activities
during the short and long term following a destructive earthquake. Before such a task
can be realised it would be necessary to create a detailed database of the existing
building stock for the two areas including specific information regarding the
characteristics required for calculating the vulnerability and the economic value of
each unit. Once these two additional layers are created a detailed seismic risk map
could be derived by using simple or complex map algebra.
Finally, a last possible course of system improvement, which appears to be related to
the capabiUties incorporated into it as a result of the open architecture provided by the
supporting GIS platform, would be to provide the necessary structures and extensions
for its application in additional aspects of municipal management. Such aspects,
dominated by the spatial character of their attributes and the necessity to use data
already available by the system, could include, land use, hydrological resource
management, environmental and urban planning.
References
1. Connell, C.A. (1986). Engineering seismic risk analysis. Bull. Seism. Soc.
Am. 58, 1583-1606. *
15
2. Idriss, I .M. and Sun, H.I . (1992). SHAKE91 A computer program for
conducting equivalent linear seismic response analyses on horizontally layered
soil deposits. Center for Geotechnical Modelling Department of Civil and
Environmental Engineering, University of California, Davis, California,
November, 1992, 20p.
3. McGuire, R.K. (1976). Fortran computer program for seismic risk analysis,
U.S. Geol. Survey, Open-File Rep. 67-76.
4. McGuire, R.K. (1978). FRISK: Computer program for seismic risk analysis
using faults as earthquake sources, U.S. Geol. Survey, Open-File Rep. 78-
1007.
5. Mortgat, CP. and Shah H.C. (1979). A Bayesian model foe seismic hazard
mapping, Bull. Seism. Soc. Am. 69, 1237-1251.
6. Papadopoulos, T.D., Stavrakakis, G.N., Alexopoulos, J.D., Kambouris, P.J. &
Voulgaris, N.S. (1997). Combined geophysical methods for subsurface
characterization in the framework of microzoning studies. Proc. of the lAEG
Intern. Symp. on Engineering Geology and the Environment, Vol 2, pp. 1419-
1424, P.G. Marinos, G.C. Koukis, G.C. Tsiambaos and GC. Stoumaras eds.,
A. A. Balkema, 1997.
7. Stavrakakis, G.N., Papadopoulos, T.D., Voulgaris, N.S. and Drakopoulos, J.K.
(1997). Seismic hazard estimation in the framework of microzonation studies.
Proc. of the lAEG Intern. Symp on Engineering Geology and the
Environment, Vol 2, pp. 1493-1498, P.G. Marinos, G.C. Koukis, G.C.
Tsiambaos and G.C. Stournaras eds, A.A. Balkema, 1997. '
16


![ft - ΕΚΠΑ - Προσωπικές Ιστοσελίδεςusers.uoa.gr/~nchilak/vivlio/Parts/17 P.pdf · Cartesian parabola, Kapt&cnavi] ... parabolic branch (of a curve), na ...](https://static.fdocument.org/doc/165x107/5ab961647f8b9ad13d8d9e0a/ft-usersuoagrnchilakvivlioparts17.jpg)