-6 MV VACUUM VOLTMETER DEVELOPMENT
7
-6 MV VACUUM VOLTMETER DEVELOPMENT ∗ B. V. Weber ξ Plasma Physics Division, Naval Research Laboratory , R. J. Allen, R. J. Commisso, D. D. Hinshelwood, D. G. Phipps, S. B. Swanekamp + Washington, DC 20375 USA ∗ Work supported by the US DOE through Sandia National Laboratories ξ email: [email protected] + L-3 Communications/Titan Group. Abstract A standard voltmeter designed for measuring up to ± 2 MV in vacuum was modified to operate at -4 to -6 MV, appropriate levels for measuring the convolute voltage during z-pinch experiments on Z. Field shaping structures are used to eliminate electron emission from the voltmeter grading rings. The voltmeter operated as expected during tests at -4 MV on the Mercury generator, indicating this voltmeter could work for the lower voltage range expected on Z. At -6 MV on Mercury, the voltmeter did not operate correctly, probably because of electron emission. Particle-in-cell modeling is consistent with the observed voltmeter response. An improved field shaper could extend the voltmeter operation to -6 MV. I. VVM DESIGN FOR -6 MV A commercial voltage divider (model PSI-VVM-16, available from L-3 Pulsed Sciences, San Leandro, CA) is shown in Fig. 1.[1] The high voltage terminal is connected to the base through a liquid resistor in the form of a cylindrical shell. A cylindrical pickoff close to the grounded base provides a signal that is about 60 times smaller than at the high voltage end. This signal is further attenuated about 100 times with a conventional resistive divider built into the output housing. The construction of the VVM is such that the resistive and capacitive divisions are equal. A stacked insulator consisting of 17 (acrylic or rexolite) insulators and 16 aluminum grading rings operates at pulsed voltages up to 2 MV (or -2 MV if the insulators are reversed). The draw rod compresses o-ring seals between the insulators and rings to allow operation in vacuum. The insulator outer surfaces are coated lightly with diffusion pump oil prior to use in vacuum. This VVM has proven useful for measuring the ~ 1 MV voltage waveform at the convolute of z-pinch experiments on the Saturn generator.[2] The present work is aimed at extending the voltage range for similar measurements on the Z generator at Sandia. A sketch of the proposed setup to measure the convolute voltage is shown in Fig. 2. The post-hole convolute exposes the negative high-voltage electrode close to the z-pinch load, allowing connections to the VVM without perturbing the transmission lines. The convolute voltage is estimated to increase during the implosion to -4 MV for a typical 20 mm diameter load and to -6 MV for a 65 mm diameter nested shell load.[3] The VVM resistance is adjusted (by changing the sodium thiosulphate concentration) so it is high enough to not perturb the load, but low enough to allow fast time response. The VVM was extended in length to increase the voltage range by constructing an equivalent liquid resistor with the same radial dimensions but double the length of the 2 MV VVM. This extension is connected to the 2 MV VVM as shown in Fig. 3. The solutions in the two liquid resistors have the same resistivity so the voltage drop across each insulator is constant. Figure 1. VVM cross section (model PSI-VVM-16) 1339 9781-4244-4065-8/09/$25.00 ©2009 IEEE
Transcript of -6 MV VACUUM VOLTMETER DEVELOPMENT
-6 MV VACUUM VOLTMETER DEVELOPMENT∗
B. V. Weberξ
Plasma Physics Division, Naval Research Laboratory
, R. J. Allen, R. J. Commisso, D. D. Hinshelwood, D. G. Phipps, S. B. Swanekamp+
Washington, DC 20375 USA
∗ Work supported by the US DOE through Sandia National Laboratories ξ email: [email protected] + L-3 Communications/Titan Group.
Abstract A standard voltmeter designed for measuring up to ± 2 MV in vacuum was modified to operate at -4 to -6 MV, appropriate levels for measuring the convolute voltage during z-pinch experiments on Z. Field shaping structures are used to eliminate electron emission from the voltmeter grading rings. The voltmeter operated as expected during tests at -4 MV on the Mercury generator, indicating this voltmeter could work for the lower voltage range expected on Z. At -6 MV on Mercury, the voltmeter did not operate correctly, probably because of electron emission. Particle-in-cell modeling is consistent with the observed voltmeter response. An improved field shaper could extend the voltmeter operation to -6 MV.
I. VVM DESIGN FOR -6 MV A commercial voltage divider (model PSI-VVM-16, available from L-3 Pulsed Sciences, San Leandro, CA) is shown in Fig. 1.[1] The high voltage terminal is connected to the base through a liquid resistor in the form of a cylindrical shell. A cylindrical pickoff close to the grounded base provides a signal that is about 60 times smaller than at the high voltage end. This signal is further attenuated about 100 times with a conventional resistive divider built into the output housing. The construction of the VVM is such that the resistive and capacitive divisions are equal. A stacked insulator consisting of 17 (acrylic or rexolite) insulators and 16 aluminum grading rings operates at pulsed voltages up to 2 MV (or -2 MV if the insulators are reversed). The draw rod compresses o-ring seals between the insulators and rings to allow operation in vacuum. The insulator outer surfaces are coated lightly with diffusion pump oil prior to use in vacuum. This VVM has proven useful for measuring the ~ 1 MV voltage waveform at the convolute of z-pinch experiments on the Saturn generator.[2] The present work is aimed at extending the voltage range for similar measurements on the Z generator at Sandia. A sketch of the proposed setup to measure the convolute voltage is
shown in Fig. 2. The post-hole convolute exposes the negative high-voltage electrode close to the z-pinch load, allowing connections to the VVM without perturbing the transmission lines. The convolute voltage is estimated to increase during the implosion to -4 MV for a typical 20 mm diameter load and to -6 MV for a 65 mm diameter nested shell load.[3] The VVM resistance is adjusted (by changing the sodium thiosulphate concentration) so it is high enough to not perturb the load, but low enough to allow fast time response. The VVM was extended in length to increase the voltage range by constructing an equivalent liquid resistor with the same radial dimensions but double the length of the 2 MV VVM. This extension is connected to the 2 MV VVM as shown in Fig. 3. The solutions in the two liquid resistors have the same resistivity so the voltage drop across each insulator is constant.
Figure 1. VVM cross section (model PSI-VVM-16)
13399781-4244-4065-8/09/$25.00 ©2009 IEEE
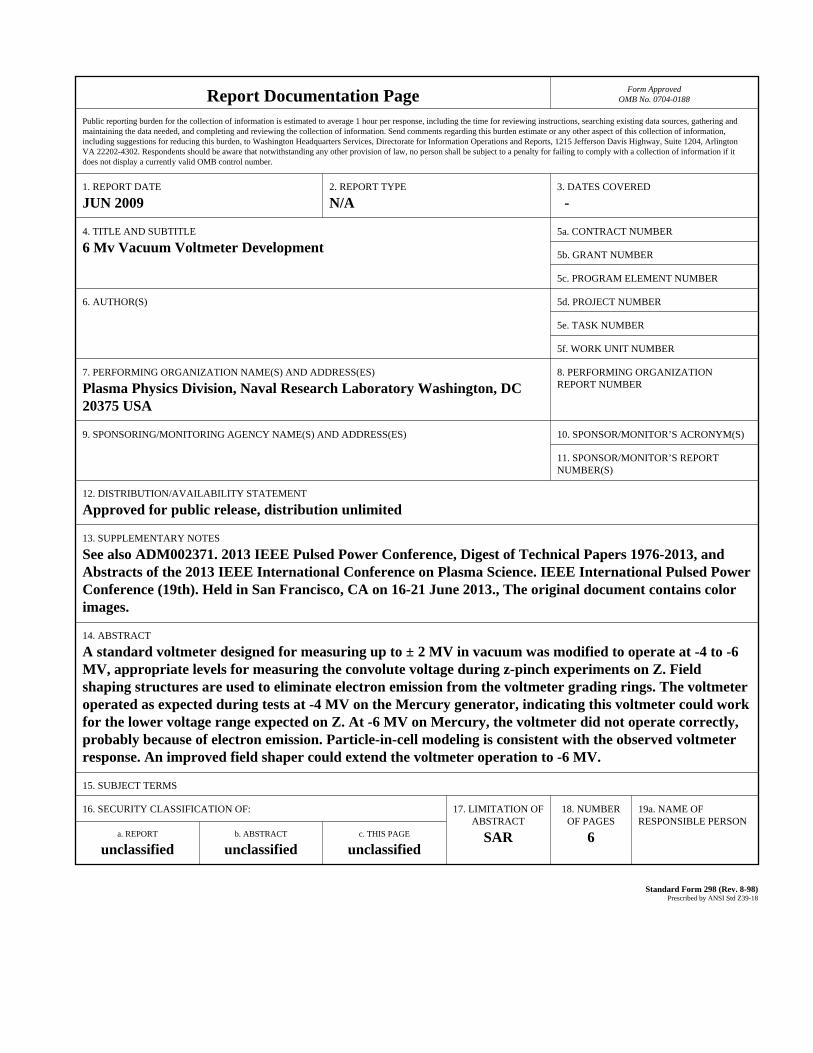
Report Documentation Page Form ApprovedOMB No. 0704-0188
Public reporting burden for the collection of information is estimated to average 1 hour per response, including the time for reviewing instructions, searching existing data sources, gathering andmaintaining the data needed, and completing and reviewing the collection of information. Send comments regarding this burden estimate or any other aspect of this collection of information,including suggestions for reducing this burden, to Washington Headquarters Services, Directorate for Information Operations and Reports, 1215 Jefferson Davis Highway, Suite 1204, ArlingtonVA 22202-4302. Respondents should be aware that notwithstanding any other provision of law, no person shall be subject to a penalty for failing to comply with a collection of information if itdoes not display a currently valid OMB control number.
1. REPORT DATE JUN 2009
2. REPORT TYPE N/A
3. DATES COVERED -
4. TITLE AND SUBTITLE 6 Mv Vacuum Voltmeter Development
5a. CONTRACT NUMBER
5b. GRANT NUMBER
5c. PROGRAM ELEMENT NUMBER
6. AUTHOR(S) 5d. PROJECT NUMBER
5e. TASK NUMBER
5f. WORK UNIT NUMBER
7. PERFORMING ORGANIZATION NAME(S) AND ADDRESS(ES) Plasma Physics Division, Naval Research Laboratory Washington, DC20375 USA
8. PERFORMING ORGANIZATIONREPORT NUMBER
9. SPONSORING/MONITORING AGENCY NAME(S) AND ADDRESS(ES) 10. SPONSOR/MONITOR’S ACRONYM(S)
11. SPONSOR/MONITOR’S REPORT NUMBER(S)
12. DISTRIBUTION/AVAILABILITY STATEMENT Approved for public release, distribution unlimited
13. SUPPLEMENTARY NOTES See also ADM002371. 2013 IEEE Pulsed Power Conference, Digest of Technical Papers 1976-2013, andAbstracts of the 2013 IEEE International Conference on Plasma Science. IEEE International Pulsed PowerConference (19th). Held in San Francisco, CA on 16-21 June 2013., The original document contains color images.
14. ABSTRACT A standard voltmeter designed for measuring up to ± 2 MV in vacuum was modified to operate at -4 to -6MV, appropriate levels for measuring the convolute voltage during z-pinch experiments on Z. Fieldshaping structures are used to eliminate electron emission from the voltmeter grading rings. The voltmeteroperated as expected during tests at -4 MV on the Mercury generator, indicating this voltmeter could workfor the lower voltage range expected on Z. At -6 MV on Mercury, the voltmeter did not operate correctly,probably because of electron emission. Particle-in-cell modeling is consistent with the observed voltmeterresponse. An improved field shaper could extend the voltmeter operation to -6 MV.
15. SUBJECT TERMS
16. SECURITY CLASSIFICATION OF: 17. LIMITATION OF ABSTRACT
SAR
18. NUMBEROF PAGES
6
19a. NAME OFRESPONSIBLE PERSON
a. REPORT unclassified
b. ABSTRACT unclassified
c. THIS PAGE unclassified
Standard Form 298 (Rev. 8-98) Prescribed by ANSI Std Z39-18
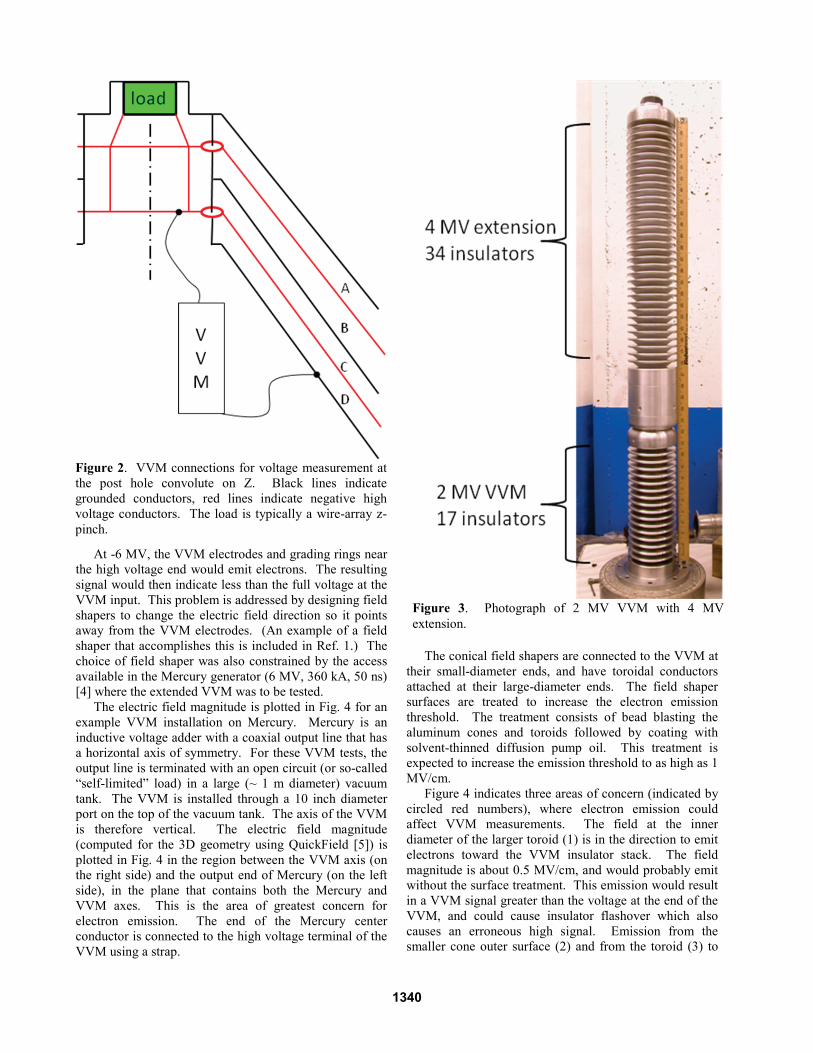
At -6 MV, the VVM electrodes and grading rings near the high voltage end would emit electrons. The resulting signal would then indicate less than the full voltage at the VVM input. This problem is addressed by designing field shapers to change the electric field direction so it points away from the VVM electrodes. (An example of a field shaper that accomplishes this is included in Ref. 1.) The choice of field shaper was also constrained by the access available in the Mercury generator (6 MV, 360 kA, 50 ns) [4] where the extended VVM was to be tested. The electric field magnitude is plotted in Fig. 4 for an example VVM installation on Mercury. Mercury is an inductive voltage adder with a coaxial output line that has a horizontal axis of symmetry. For these VVM tests, the output line is terminated with an open circuit (or so-called “self-limited” load) in a large (~ 1 m diameter) vacuum tank. The VVM is installed through a 10 inch diameter port on the top of the vacuum tank. The axis of the VVM is therefore vertical. The electric field magnitude (computed for the 3D geometry using QuickField [5]) is plotted in Fig. 4 in the region between the VVM axis (on the right side) and the output end of Mercury (on the left side), in the plane that contains both the Mercury and VVM axes. This is the area of greatest concern for electron emission. The end of the Mercury center conductor is connected to the high voltage terminal of the VVM using a strap.
The conical field shapers are connected to the VVM at their small-diameter ends, and have toroidal conductors attached at their large-diameter ends. The field shaper surfaces are treated to increase the electron emission threshold. The treatment consists of bead blasting the aluminum cones and toroids followed by coating with solvent-thinned diffusion pump oil. This treatment is expected to increase the emission threshold to as high as 1 MV/cm. Figure 4 indicates three areas of concern (indicated by circled red numbers), where electron emission could affect VVM measurements. The field at the inner diameter of the larger toroid (1) is in the direction to emit electrons toward the VVM insulator stack. The field magnitude is about 0.5 MV/cm, and would probably emit without the surface treatment. This emission would result in a VVM signal greater than the voltage at the end of the VVM, and could cause insulator flashover which also causes an erroneous high signal. Emission from the smaller cone outer surface (2) and from the toroid (3) to
Figure 2. VVM connections for voltage measurement at the post hole convolute on Z. Black lines indicate grounded conductors, red lines indicate negative high voltage conductors. The load is typically a wire-array z-pinch.
Figure 3. Photograph of 2 MV VVM with 4 MV extension.
1340
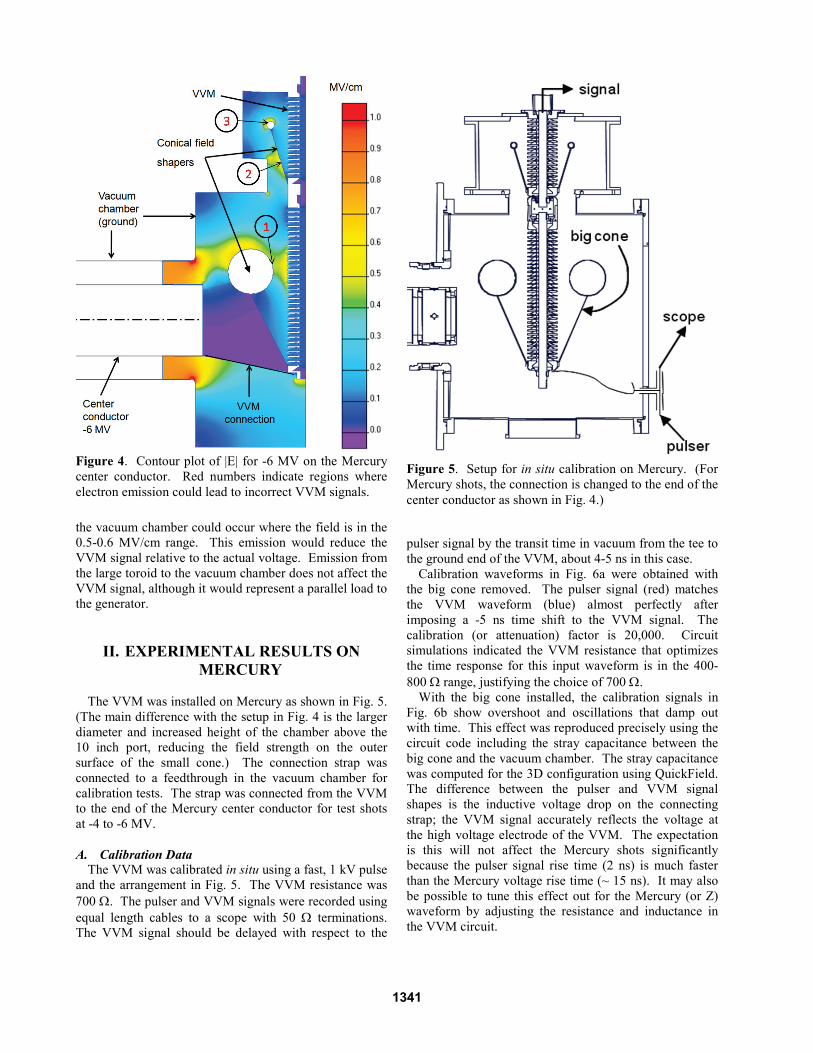
the vacuum chamber could occur where the field is in the 0.5-0.6 MV/cm range. This emission would reduce the VVM signal relative to the actual voltage. Emission from the large toroid to the vacuum chamber does not affect the VVM signal, although it would represent a parallel load to the generator.
II. EXPERIMENTAL RESULTS ON MERCURY
The VVM was installed on Mercury as shown in Fig. 5. (The main difference with the setup in Fig. 4 is the larger diameter and increased height of the chamber above the 10 inch port, reducing the field strength on the outer surface of the small cone.) The connection strap was connected to a feedthrough in the vacuum chamber for calibration tests. The strap was connected from the VVM to the end of the Mercury center conductor for test shots at -4 to -6 MV.
A. Calibration Data The VVM was calibrated in situ using a fast, 1 kV pulse and the arrangement in Fig. 5. The VVM resistance was 700 Ω. The pulser and VVM signals were recorded using equal length cables to a scope with 50 Ω terminations. The VVM signal should be delayed with respect to the
pulser signal by the transit time in vacuum from the tee to the ground end of the VVM, about 4-5 ns in this case. Calibration waveforms in Fig. 6a were obtained with the big cone removed. The pulser signal (red) matches the VVM waveform (blue) almost perfectly after imposing a -5 ns time shift to the VVM signal. The calibration (or attenuation) factor is 20,000. Circuit simulations indicated the VVM resistance that optimizes the time response for this input waveform is in the 400-800 Ω range, justifying the choice of 700 Ω. With the big cone installed, the calibration signals in Fig. 6b show overshoot and oscillations that damp out with time. This effect was reproduced precisely using the circuit code including the stray capacitance between the big cone and the vacuum chamber. The stray capacitance was computed for the 3D configuration using QuickField. The difference between the pulser and VVM signal shapes is the inductive voltage drop on the connecting strap; the VVM signal accurately reflects the voltage at the high voltage electrode of the VVM. The expectation is this will not affect the Mercury shots significantly because the pulser signal rise time (2 ns) is much faster than the Mercury voltage rise time (~ 15 ns). It may also be possible to tune this effect out for the Mercury (or Z) waveform by adjusting the resistance and inductance in the VVM circuit.
Figure 4. Contour plot of |E| for -6 MV on the Mercury center conductor. Red numbers indicate regions where electron emission could lead to incorrect VVM signals.
Figure 5. Setup for in situ calibration on Mercury. (For Mercury shots, the connection is changed to the end of the center conductor as shown in Fig. 4.)
1341
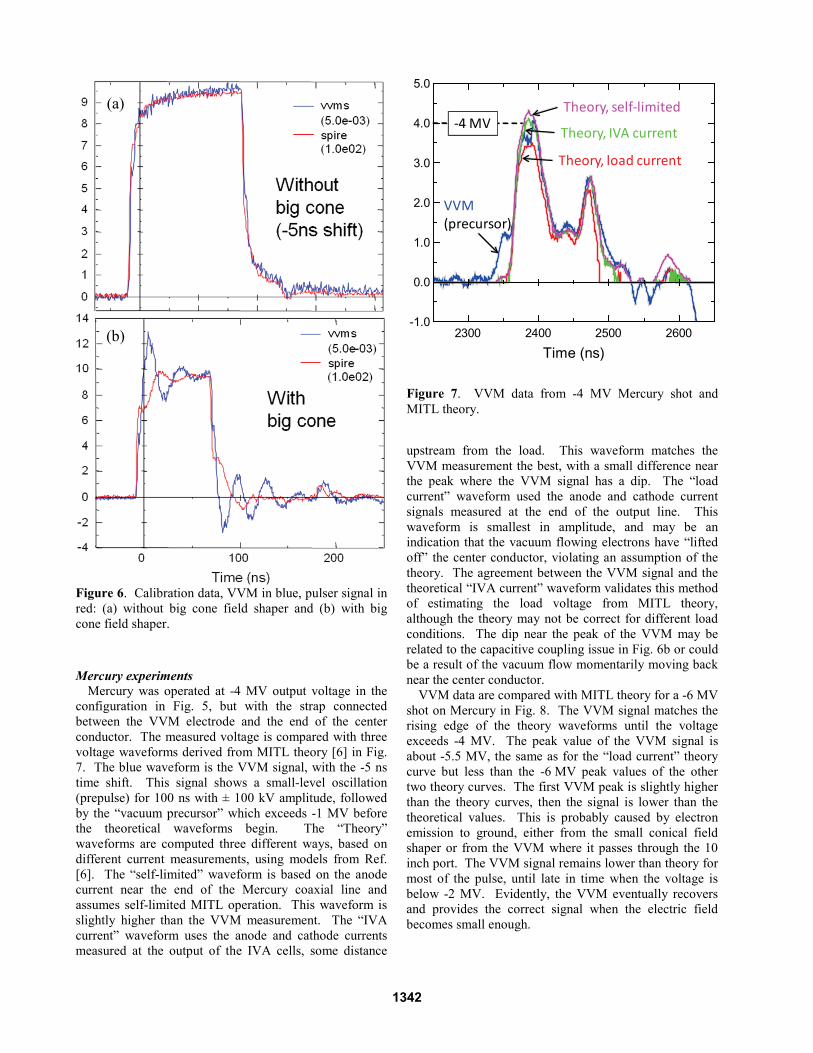
Mercury experiments Mercury was operated at -4 MV output voltage in the configuration in Fig. 5, but with the strap connected between the VVM electrode and the end of the center conductor. The measured voltage is compared with three voltage waveforms derived from MITL theory [6] in Fig. 7. The blue waveform is the VVM signal, with the -5 ns time shift. This signal shows a small-level oscillation (prepulse) for 100 ns with ± 100 kV amplitude, followed by the “vacuum precursor” which exceeds -1 MV before the theoretical waveforms begin. The “Theory” waveforms are computed three different ways, based on different current measurements, using models from Ref. [6]. The “self-limited” waveform is based on the anode current near the end of the Mercury coaxial line and assumes self-limited MITL operation. This waveform is slightly higher than the VVM measurement. The “IVA current” waveform uses the anode and cathode currents measured at the output of the IVA cells, some distance
upstream from the load. This waveform matches the VVM measurement the best, with a small difference near the peak where the VVM signal has a dip. The “load current” waveform used the anode and cathode current signals measured at the end of the output line. This waveform is smallest in amplitude, and may be an indication that the vacuum flowing electrons have “lifted off” the center conductor, violating an assumption of the theory. The agreement between the VVM signal and the theoretical “IVA current” waveform validates this method of estimating the load voltage from MITL theory, although the theory may not be correct for different load conditions. The dip near the peak of the VVM may be related to the capacitive coupling issue in Fig. 6b or could be a result of the vacuum flow momentarily moving back near the center conductor. VVM data are compared with MITL theory for a -6 MV shot on Mercury in Fig. 8. The VVM signal matches the rising edge of the theory waveforms until the voltage exceeds -4 MV. The peak value of the VVM signal is about -5.5 MV, the same as for the “load current” theory curve but less than the -6 MV peak values of the other two theory curves. The first VVM peak is slightly higher than the theory curves, then the signal is lower than the theoretical values. This is probably caused by electron emission to ground, either from the small conical field shaper or from the VVM where it passes through the 10 inch port. The VVM signal remains lower than theory for most of the pulse, until late in time when the voltage is below -2 MV. Evidently, the VVM eventually recovers and provides the correct signal when the electric field becomes small enough.
Figure 6. Calibration data, VVM in blue, pulser signal in red: (a) without big cone field shaper and (b) with big cone field shaper.
-1.0
0.0
1.0
2.0
3.0
4.0
5.0
2300 2400 2500 2600
Time (ns)
VVM(precursor)
Theory, self-limited
Theory, load current
Theory, IVA current-4 MV
Figure 7. VVM data from -4 MV Mercury shot and MITL theory.
(a)
(b)
1342
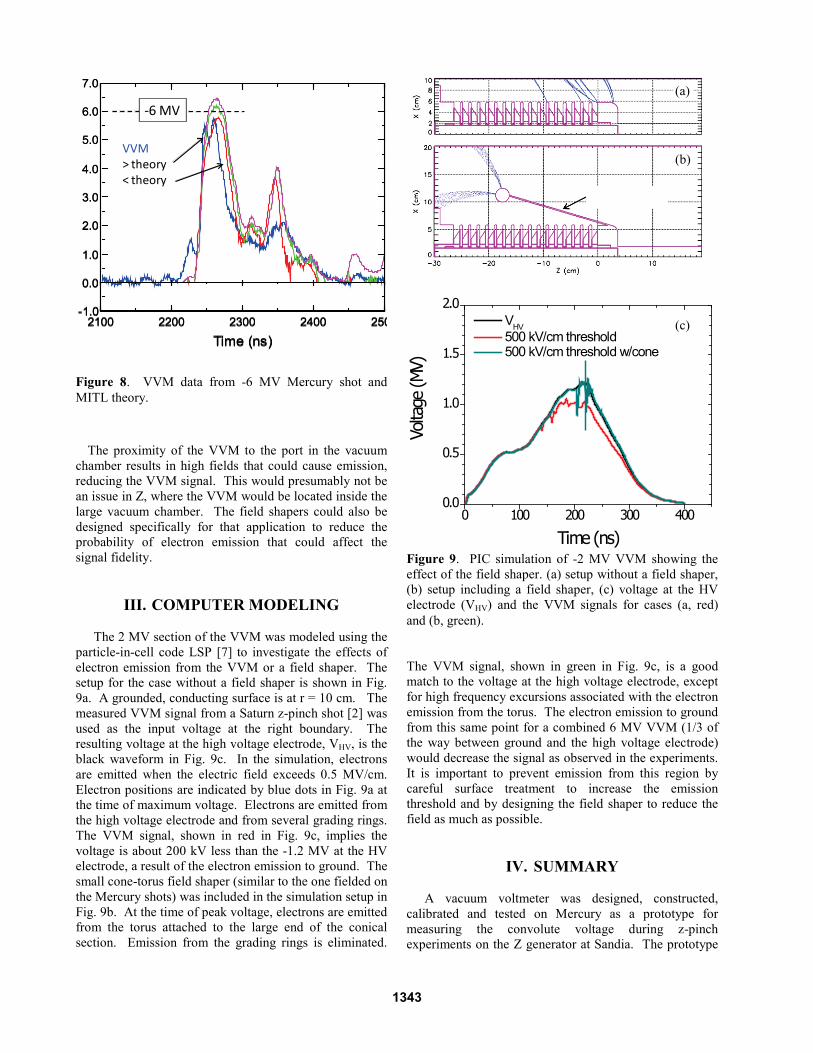
The proximity of the VVM to the port in the vacuum chamber results in high fields that could cause emission, reducing the VVM signal. This would presumably not be an issue in Z, where the VVM would be located inside the large vacuum chamber. The field shapers could also be designed specifically for that application to reduce the probability of electron emission that could affect the signal fidelity.
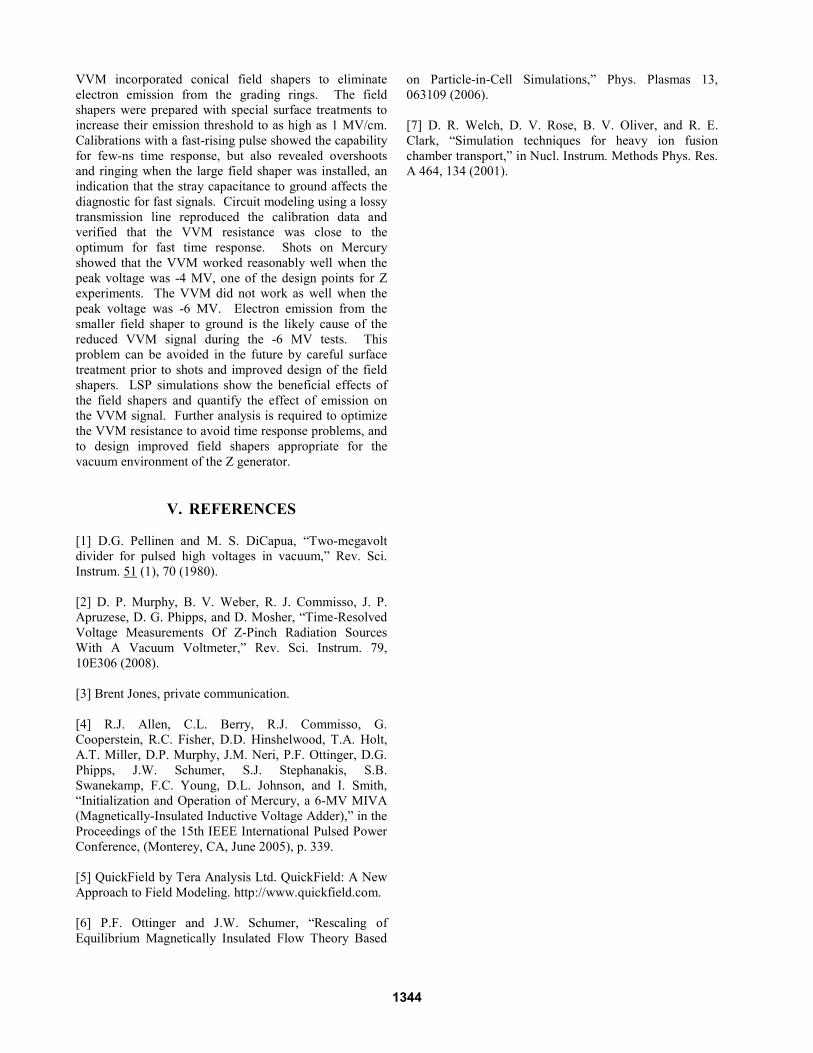
III. COMPUTER MODELING The 2 MV section of the VVM was modeled using the particle-in-cell code LSP [7] to investigate the effects of electron emission from the VVM or a field shaper. The setup for the case without a field shaper is shown in Fig. 9a. A grounded, conducting surface is at r = 10 cm. The measured VVM signal from a Saturn z-pinch shot [2] was used as the input voltage at the right boundary. The resulting voltage at the high voltage electrode, VHV, is the black waveform in Fig. 9c. In the simulation, electrons are emitted when the electric field exceeds 0.5 MV/cm. Electron positions are indicated by blue dots in Fig. 9a at the time of maximum voltage. Electrons are emitted from the high voltage electrode and from several grading rings. The VVM signal, shown in red in Fig. 9c, implies the voltage is about 200 kV less than the -1.2 MV at the HV electrode, a result of the electron emission to ground. The small cone-torus field shaper (similar to the one fielded on the Mercury shots) was included in the simulation setup in Fig. 9b. At the time of peak voltage, electrons are emitted from the torus attached to the large end of the conical section. Emission from the grading rings is eliminated.
The VVM signal, shown in green in Fig. 9c, is a good match to the voltage at the high voltage electrode, except for high frequency excursions associated with the electron emission from the torus. The electron emission to ground from this same point for a combined 6 MV VVM (1/3 of the way between ground and the high voltage electrode) would decrease the signal as observed in the experiments. It is important to prevent emission from this region by careful surface treatment to increase the emission threshold and by designing the field shaper to reduce the field as much as possible.
IV. SUMMARY A vacuum voltmeter was designed, constructed, calibrated and tested on Mercury as a prototype for measuring the convolute voltage during z-pinch experiments on the Z generator at Sandia. The prototype
-1.0
0.0
1.0
2.0
3.0
4.0
5.0
6.0
7.0
2100 2200 2300 2400 250
Time (ns)
-1.0
0.0
1.0
2.0
3.0
4.0
5.0
6.0
7.0
2100 2200 2300 2400 250
Time (ns)
VVM> theory< theory
-6 MV
Figure 8. VVM data from -6 MV Mercury shot and MITL theory.
0 100 200 300 4000.0
0.5
1.0
1.5
2.0 VHV 500 kV/cm threshold 500 kV/cm threshold w/cone
Volta
ge (M
V)
Time (ns) Figure 9. PIC simulation of -2 MV VVM showing the effect of the field shaper. (a) setup without a field shaper, (b) setup including a field shaper, (c) voltage at the HV electrode (VHV) and the VVM signals for cases (a, red) and (b, green).
(a)
(b)
(c)
1343
VVM incorporated conical field shapers to eliminate electron emission from the grading rings. The field shapers were prepared with special surface treatments to increase their emission threshold to as high as 1 MV/cm. Calibrations with a fast-rising pulse showed the capability for few-ns time response, but also revealed overshoots and ringing when the large field shaper was installed, an indication that the stray capacitance to ground affects the diagnostic for fast signals. Circuit modeling using a lossy transmission line reproduced the calibration data and verified that the VVM resistance was close to the optimum for fast time response. Shots on Mercury showed that the VVM worked reasonably well when the peak voltage was -4 MV, one of the design points for Z experiments. The VVM did not work as well when the peak voltage was -6 MV. Electron emission from the smaller field shaper to ground is the likely cause of the reduced VVM signal during the -6 MV tests. This problem can be avoided in the future by careful surface treatment prior to shots and improved design of the field shapers. LSP simulations show the beneficial effects of the field shapers and quantify the effect of emission on the VVM signal. Further analysis is required to optimize the VVM resistance to avoid time response problems, and to design improved field shapers appropriate for the vacuum environment of the Z generator.
V. REFERENCES [1] D.G. Pellinen and M. S. DiCapua, “Two-megavolt divider for pulsed high voltages in vacuum,” Rev. Sci. Instrum. 51
(1), 70 (1980).
[2] D. P. Murphy, B. V. Weber, R. J. Commisso, J. P. Apruzese, D. G. Phipps, and D. Mosher, “Time-Resolved Voltage Measurements Of Z-Pinch Radiation Sources With A Vacuum Voltmeter,” Rev. Sci. Instrum. 79, 10E306 (2008). [3] Brent Jones, private communication. [4] R.J. Allen, C.L. Berry, R.J. Commisso, G. Cooperstein, R.C. Fisher, D.D. Hinshelwood, T.A. Holt, A.T. Miller, D.P. Murphy, J.M. Neri, P.F. Ottinger, D.G. Phipps, J.W. Schumer, S.J. Stephanakis, S.B. Swanekamp, F.C. Young, D.L. Johnson, and I. Smith, “Initialization and Operation of Mercury, a 6-MV MIVA (Magnetically-Insulated Inductive Voltage Adder),” in the Proceedings of the 15th IEEE International Pulsed Power Conference, (Monterey, CA, June 2005), p. 339. [5] QuickField by Tera Analysis Ltd. QuickField: A New Approach to Field Modeling. http://www.quickfield.com. [6] P.F. Ottinger and J.W. Schumer, “Rescaling of Equilibrium Magnetically Insulated Flow Theory Based
on Particle-in-Cell Simulations,” Phys. Plasmas 13, 063109 (2006). [7] D. R. Welch, D. V. Rose, B. V. Oliver, and R. E. Clark, “Simulation techniques for heavy ion fusion chamber transport,” in Nucl. Instrum. Methods Phys. Res. A 464, 134 (2001).
1344