2.1 Samples: Synthesis of MWCNT, GO and rGO10.1007... · Web viewSEM (b) TEM (c) HRTEM images of...
6
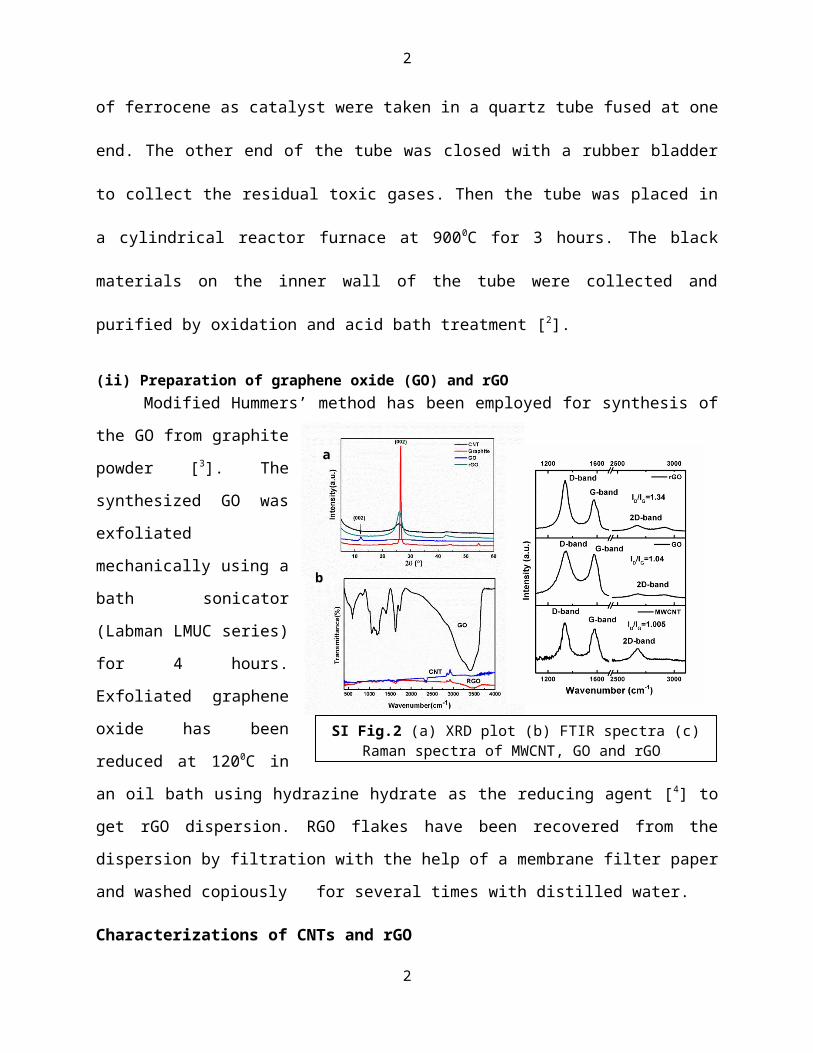
SI Fig.1 (a) SEM (b) TEM (c) HRTEM images of MWCNT (d) SEM of GO (e) SEM of rGO (f) TEM and (g) HRTEM image of rGO a b c f g d 200 nm 5 μm e 2 μm 500 nm 20 nm 20 nm 100 nm 1 Investigation of opto-electrical properties of MWCNT/rGO -Poly[3-hexylthiophene] ternary composites Prakash Chandra Mahakul 1 , Kadambinee Sa 1 , B.V.R.S. Subramanyam 1 , Khirod Chandra Patra 2 , Pitamber Mahanandia 1* 1 Department of Physics and Astronomy, National Institute of Technology, Rourkela, 769008, India 2 Institute Of Physics, Sachivalaya Marg, Bhubaneswar, 751005, India 2.1 Samples: Synthesis of MWCNT, GO and rGO (i) Preparation of MWCNT MWCNTs have been synthesized by pyrolyzing benzene in a cylindrical quartz tube at 900° as per our earlier reported article [ 1] . In short, around 3 ml of precursor benzene and 20 mg 1
Transcript of 2.1 Samples: Synthesis of MWCNT, GO and rGO10.1007... · Web viewSEM (b) TEM (c) HRTEM images of...
1
Investigation of opto-electrical properties of MWCNT/rGO -Poly[3-hexylthiophene] ternary composites
Prakash Chandra Mahakul1, Kadambinee Sa1, B.V.R.S. Subramanyam1, Khirod Chandra Patra2,
Pitamber Mahanandia1*
1Department of Physics and Astronomy, National Institute of Technology, Rourkela, 769008, India2 Institute Of Physics, Sachivalaya Marg, Bhubaneswar, 751005, India
2.1 Samples: Synthesis of MWCNT, GO and rGO
(i) Preparation of MWCNT
MWCNTs have been synthesized by pyrolyzing benzene in a cylindrical quartz tube at
900° as per our earlier reported article [1]. In short, around 3 ml of precursor benzene and 20 mg
of ferrocene as catalyst were taken in a quartz tube fused at one end. The other end of the tube
was closed with a rubber bladder to collect the residual toxic gases. Then the tube was placed in
a cylindrical reactor furnace at 9000C for 3 hours. The black materials on the inner wall of the
tube were collected and purified by oxidation and acid bath treatment [2].
1
100 nm 20 nm
20 nm500 nm2 μm
e
5 μm 200 nm
d gf
cba
SI Fig.1 (a) SEM (b) TEM (c) HRTEM images of MWCNT (d) SEM of GO (e) SEM of rGO (f) TEM and (g) HRTEM image of rGO
2
(ii) Preparation of graphene oxide (GO) and rGOModified Hummers’ method has been employed for synthesis of the GO from graphite
powder [3]. The synthesized
GO was exfoliated
mechanically using a bath
sonicator (Labman LMUC
series) for 4 hours. Exfoliated
graphene oxide has been
reduced at 1200C in an oil
bath using hydrazine hydrate
as the reducing agent [4] to
get rGO dispersion. RGO
flakes have been recovered
from the dispersion by
filtration with the help of a
membrane filter paper and washed copiously for several times with distilled water.
Characterizations of CNTs and rGO
SI Fig.1 represents SEM, TEM and HRTEM images of CNTs, graphite, GO and rGO as
labelled in the figure. From the SEM and TEM micrograph [SI fig: 1 (a and b)] the tube like
structure of the
synthesized CNTs
can be observed. The
HRTEM image (SI
Fig.1c) confirms the
multiwalled nature of
the synthesized
CNTs. The SEM
image of the
exfoliated GO
prepared from highly
stacked graphite flakes has been presented in fig.3d. The GO sheets could be observed to be
2
b
ca
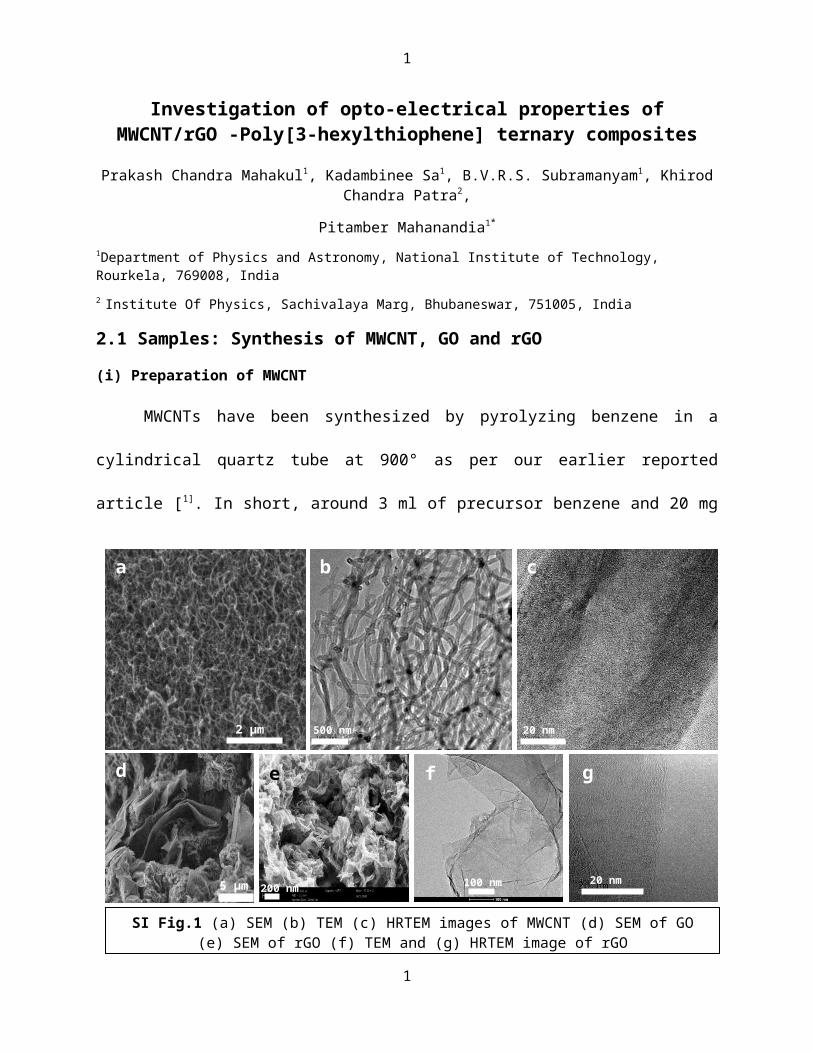
SI Fig.2 (a) XRD plot (b) FTIR spectra (c) Raman spectra of MWCNT, GO and rGO
5 µm 5 µm
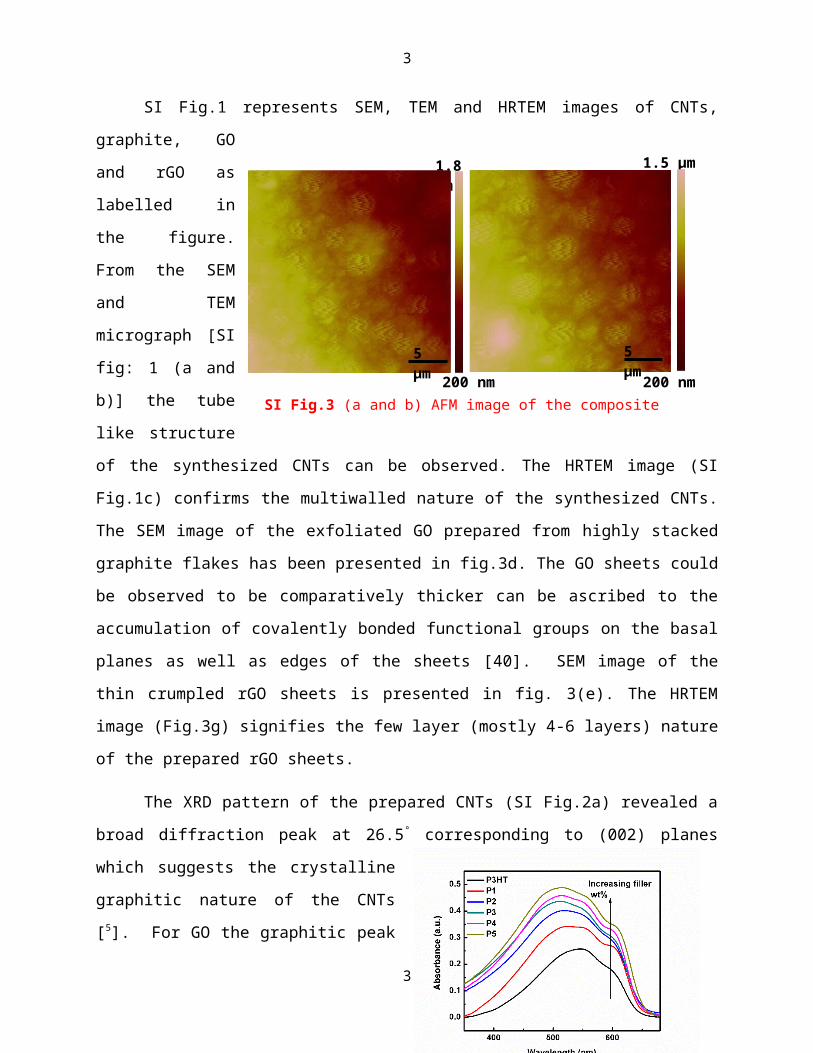
1.5 µm
SI Fig.3 (a and b) AFM image of the composite 200 nm
1.8 µm
200 nm
3
comparatively thicker can be ascribed to the accumulation of covalently bonded functional
groups on the basal planes as well as edges of the sheets [40]. SEM image of the thin crumpled
rGO sheets is presented in fig. 3(e). The HRTEM image (Fig.3g) signifies the few layer (mostly
4-6 layers) nature of the prepared rGO sheets.
The XRD pattern of the prepared CNTs (SI Fig.2a) revealed a broad diffraction peak at
26.5° corresponding to (002) planes which suggests the crystalline graphitic nature of the CNTs
[5]. For GO the graphitic peak is shifted
towards 10.25° with d-spacing 0.821nm.
Again this broad reflection peak was shifted to
26.5° with inter-planar spacing of 3.33 nm
after reduction using hydrazine hydrate in case
of rGO. From the FTIR spectra of MWCNT,
GO and rGO shown in SI fig.2b, the broad
absorption band observed around 3550 cm-1
represents the adsorbed –OH groups on the
surface. In addition the functional groups
C=C, C-O, C=O, C-OH, COOH observed from the spectra of GO as labelled in the fig.2b
confirms the adherence of oxygen functional groups on graphite surface during oxidation [6].
However, almost all the functional groups are diminished in the spectra of rGO that signify the
efficient elimination of the functional groups during the reduction process. Likewise, the
absorption peak observed around 1635 cm-1 in the FTIR spectra of MWCNT corresponds to the
3
SI Fig.4 Solid state absorption spectra of CNT:rGO:p3HT composites
ba
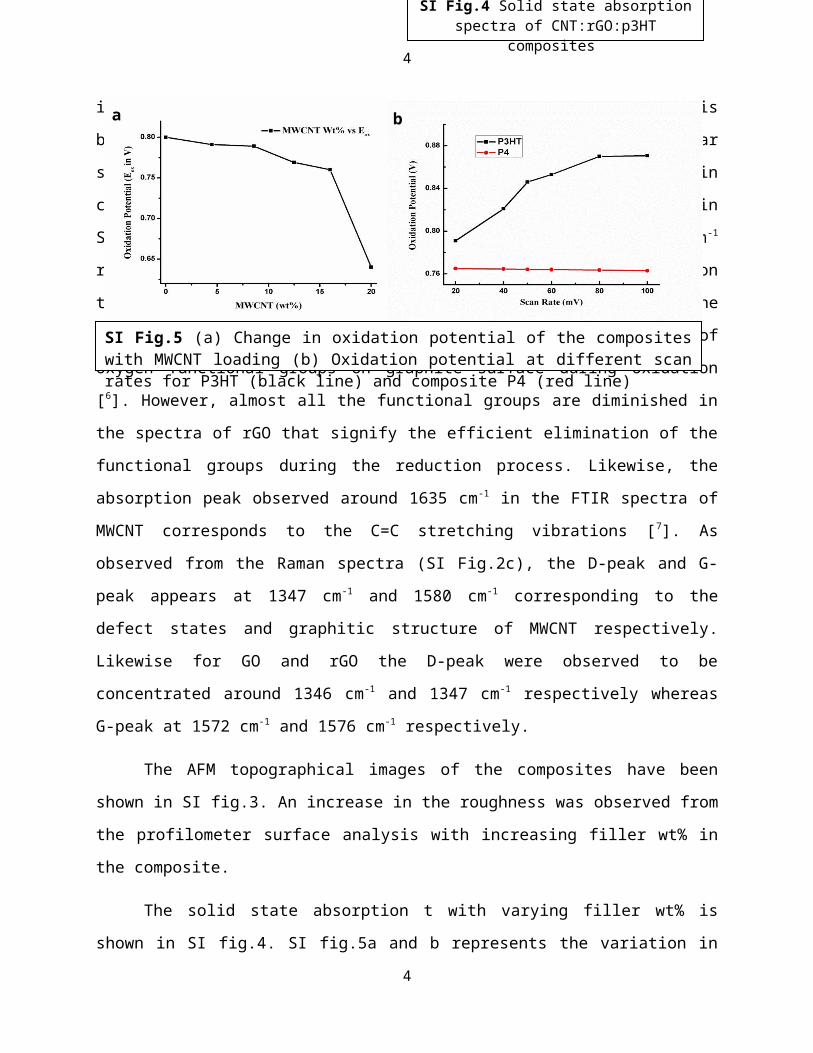
SI Fig.5 (a) Change in oxidation potential of the composites with MWCNT loading (b) Oxidation potential at different scan rates for P3HT (black line) and composite P4 (red line)
SI Fig.4 Solid state absorption spectra of CNT:rGO:p3HT composites
SI Fig.4 Solid state absorption spectra of CNT:rGO:p3HT composites
4
C=C stretching vibrations [7]. As observed from the Raman spectra (SI Fig.2c), the D-peak and
G-peak appears at 1347 cm-1 and 1580 cm-1 corresponding to the defect states and graphitic
structure of MWCNT respectively. Likewise for GO and rGO the D-peak were observed to be
concentrated around 1346 cm-1 and 1347 cm-1 respectively whereas G-peak at 1572 cm-1 and
1576 cm-1 respectively.
The AFM topographical images of the composites have been shown in SI fig.3. An
increase in the roughness was observed from the profilometer surface analysis with increasing
filler wt% in the composite.
The solid state absorption t with varying filler wt% is shown in SI fig.4. SI fig.5a and b
represents the variation in oxidation potential with respect to CNT wt% and scan rate
respectively. Oxidation potential was observed to decrease with filler wt% in the composites
compared to P3HT.
4

1 . P Mahanandia, KK Nanda, (2008) A one-step technique to prepare aligned arrays of carbon nanotubes, Nanotechnology, 19, 15, 155602.
2 . P Mahanandia, P N Vishwakarma, K K Nanda, V Prasad, K Barai, A K Mondal, S Sarangi, G K Dey and S V Subramanyam, (2008) Synthesis of multi-wall carbon nanotubes by simple pyrolysis, Solid State Commun. 145 143-148.
3 . WS Hummers and RE Offeman, (1958) Preparation of Graphitic Oxide, J. Am. Chem. Soc., 80, 1339-1339.4 . Sasha Stankovich, Dmitriy A. Dikin, Richard D. Piner, Kevin A. Kohlhaas, Alfred Kleinhammes, Yuanyuan Jia,
Yue Wu, SonBinh T. Nguyen, Rodney S. Ruoff, (2007) Synthesis of graphene-based nanosheets via chemical reduction of exfoliated graphite oxide, Carbon, 45, 1558–1565
5 . Z Wang, D Ba, F Liu, P Cao, T Yang, Y Gu and H Gao, (2005) Synthesis and characterization of large area well-aligned carbon nanotubes by ECR-CVD without substrate bias, Vacuum, 77, 139–144.
6 . M Acik, G Lee, C Mattevi, M Chhowalla, K Cho, and YJ Chabal, (2010) Unusual infrared-absorption mechanism in thermally reduced graphene oxide, Nat. Mater. 9, 840-845.
7 . L Stobinski, B Lesiak, L Kover, J Toth, S Biniak, G Trykowski, and J Judek, (2010) Multiwall carbon nanotubes purification and oxidation by nitric acid studied by the FTIR and electron spectroscopy methods, J. Alloys Compd., 501, 77–84.