2011 ASCP Fellowship & Job Market Surveys - American Society of
24
Inhibition of Human α-Thrombin with Small Covalent Inhibitors and r-Hirudin Carol Eddy Biochemistry Comprehensive Thesis April 2008
Transcript of 2011 ASCP Fellowship & Job Market Surveys - American Society of
Inhibition of Human α-Thrombin with Small Covalent Inhibitors and r-Hirudin
Carol Eddy
Biochemistry Comprehensive Thesis
April 2008
1
Abstract.
Thrombin is a key serine protease involved in the blood cascade. Two small molecular
inhibitors, 4-nitrophenyl diethylphosphate (paraoxon) and 4-nitrophenyl 2-propyl
methylphosphonate (MPNP), covalently bond to the active-site Ser to form a mimic of the
tetrahedral intermediate found in thrombin-catalyzed reactions. The pH dependence of their
inhibition of human α-thrombin at 25.0 + 0.1oC was determined. The pKa1 and pKa2 for
paraoxon are 7.8 ± 0.1 and 9.3 ± 0.2 respectively, and for MPNP are 8.0 ± 0.1 and 8.6 ± 0.2
respectively. The pKas may be attributed to the role of His57 and Leu16 respectively in catalysis.
The maximal second order rate constant, ki/Ki, for the inhibition of human α-thrombin was
determined to be 0.47 ± 0.05 M-1s-1 with paraoxon and 6.2 ± 0.1 M-1s-1 with MPNP.
Hirudin, found naturally in Hirudo medicinalis, is a slow and tight binding inhibitor of
thrombin, interacting noncovalently over a large area. This study focused on the dependence of
this interaction on the presence of Na+ and Cl- ions at an ionic strength () of 0.3 M. Kinetic
measurements were conducted spectrophotometrically in the presence of the chromophoric
substrate, H-D-Phe-Pip-Arg-4-nitroanilide. The dissociation constant and second-order rate
constant, when fitted, for the inhibition of human -thrombin with r-hirudin at pH ~ 8.1 and 25.0
+ 0.1 oC are: (0.47 + 0.15) pM and (4.8 ± 0.1) x 107 M-1s-1 in NaCl; (2.8 ±0.1) pM and (3.49 +
0.02) x 107 M-1s-1 in Na acetate; (13.8 ± 0.2) pM and (8.2 ± 0.4) x 106 M-1 s-1 in choline Cl; (12 ±
3) pM in choline acetate. The solvent isotope effect, KH/KD, for Ki is 0.26 + 0.15 in NaCl; 0.72 +
0.02 in Na acetate; 2.1 + 0.5 in choline acetate; and 2.59 + 0.03 in choline chloride. This
suggests that the association of hirudin with thrombin is accompanied with changes in hydrogen
bonding as a function of Na+ and Cl- ions.
2
Introduction.
Physiological Role of Thrombin.
Thrombin is a serine protease in the trypsin family which cleaves scissile bonds adjacent to
positively charged residues.1 Its natural substrates contain an arginine in the S1 subsite, a proline
in the S2 subsite, and a hydrophobic residue in the S3 subsite. This high specificity is utilized by
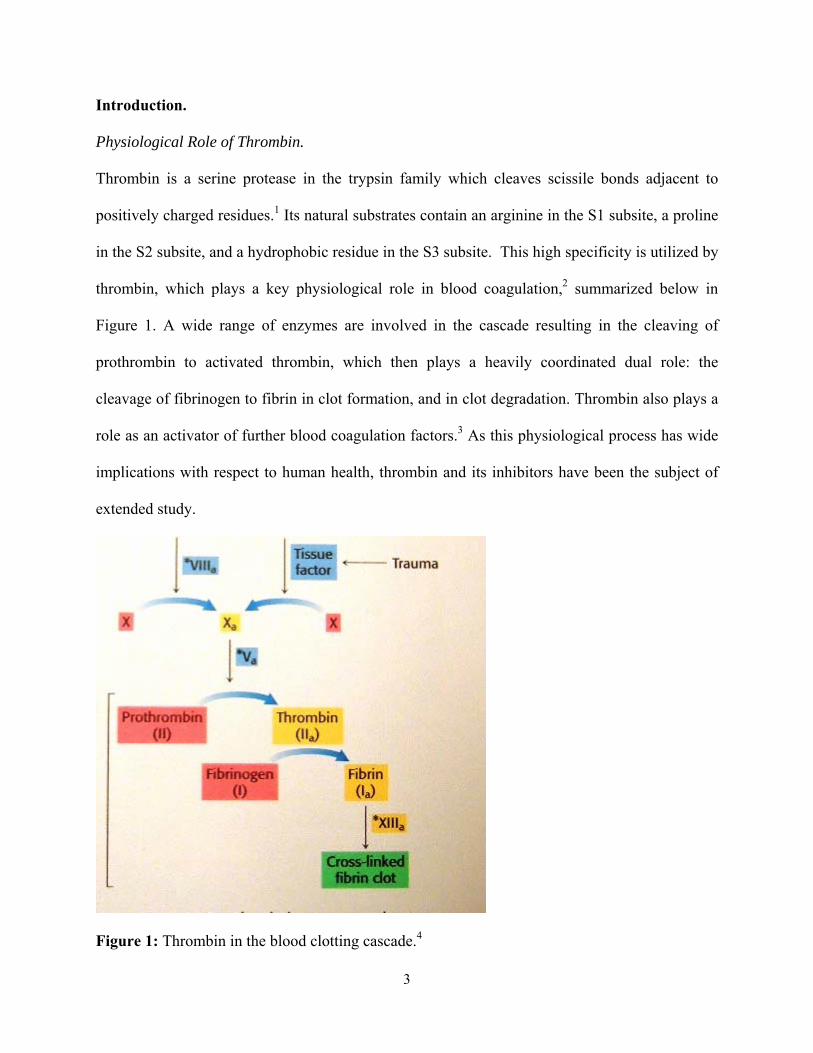
thrombin, which plays a key physiological role in blood coagulation,2 summarized below in
Figure 1. A wide range of enzymes are involved in the cascade resulting in the cleaving of
prothrombin to activated thrombin, which then plays a heavily coordinated dual role: the
cleavage of fibrinogen to fibrin in clot formation, and in clot degradation. Thrombin also plays a
role as an activator of further blood coagulation factors.3 As this physiological process has wide
implications with respect to human health, thrombin and its inhibitors have been the subject of
extended study.
Figure 1: Thrombin in the blood clotting cascade.4
3
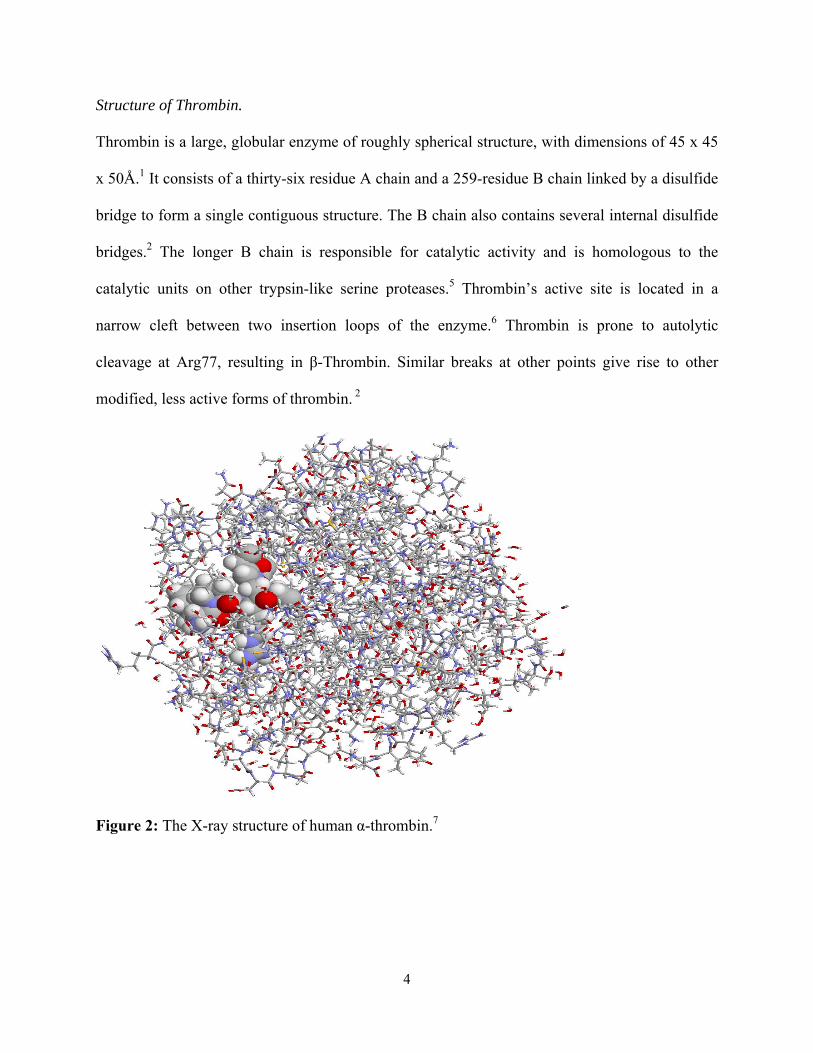
Structure of Thrombin.
Thrombin is a large, globular enzyme of roughly spherical structure, with dimensions of 45 x 45
x 50Å.1 It consists of a thirty-six residue A chain and a 259-residue B chain linked by a disulfide
bridge to form a single contiguous structure. The B chain also contains several internal disulfide
bridges.2 The longer B chain is responsible for catalytic activity and is homologous to the
catalytic units on other trypsin-like serine proteases.5 Thrombin’s active site is located in a
narrow cleft between two insertion loops of the enzyme.6 Thrombin is prone to autolytic
cleavage at Arg77, resulting in β-Thrombin. Similar breaks at other points give rise to other
modified, less active forms of thrombin. 2
Figure 2: The X-ray structure of human α-thrombin.7
4
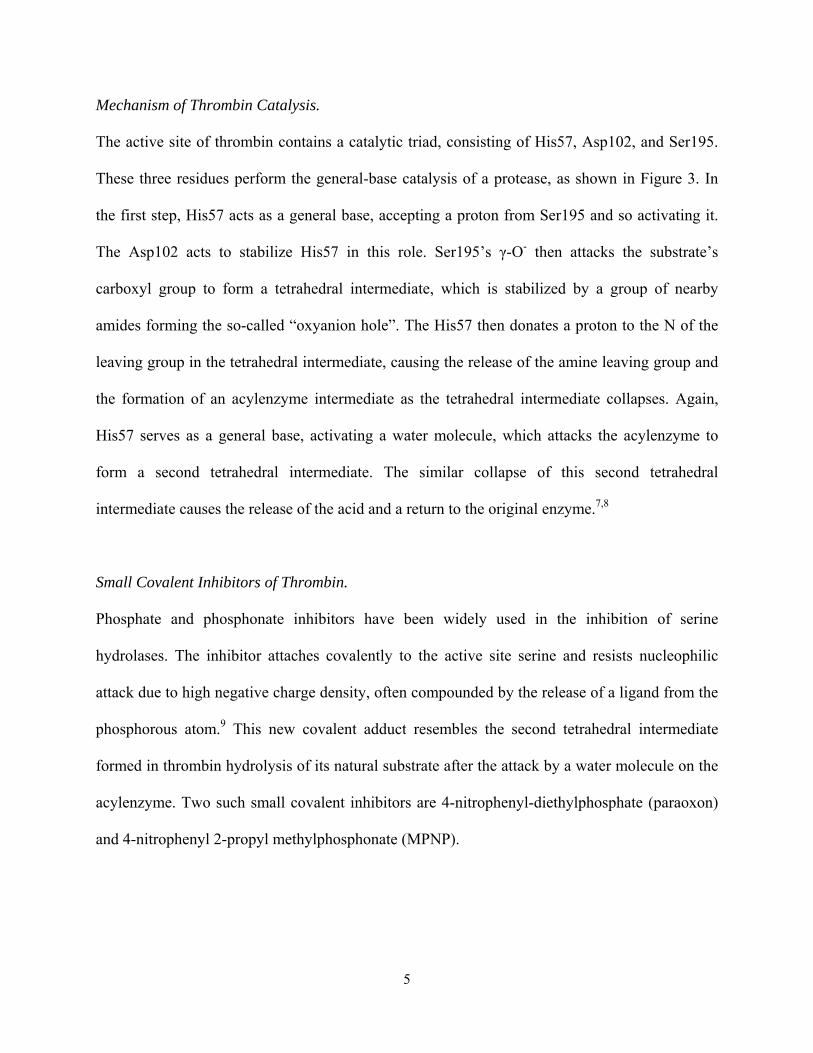
Mechanism of Thrombin Catalysis.
The active site of thrombin contains a catalytic triad, consisting of His57, Asp102, and Ser195.
These three residues perform the general-base catalysis of a protease, as shown in Figure 3. In
the first step, His57 acts as a general base, accepting a proton from Ser195 and so activating it.
The Asp102 acts to stabilize His57 in this role. Ser195’s γ-O- then attacks the substrate’s
carboxyl group to form a tetrahedral intermediate, which is stabilized by a group of nearby
amides forming the so-called “oxyanion hole”. The His57 then donates a proton to the N of the
leaving group in the tetrahedral intermediate, causing the release of the amine leaving group and
the formation of an acylenzyme intermediate as the tetrahedral intermediate collapses. Again,
His57 serves as a general base, activating a water molecule, which attacks the acylenzyme to
form a second tetrahedral intermediate. The similar collapse of this second tetrahedral
intermediate causes the release of the acid and a return to the original enzyme.7,8
Small Covalent Inhibitors of Thrombin.
Phosphate and phosphonate inhibitors have been widely used in the inhibition of serine
hydrolases. The inhibitor attaches covalently to the active site serine and resists nucleophilic
attack due to high negative charge density, often compounded by the release of a ligand from the
phosphorous atom.9 This new covalent adduct resembles the second tetrahedral intermediate
formed in thrombin hydrolysis of its natural substrate after the attack by a water molecule on the
acylenzyme. Two such small covalent inhibitors are 4-nitrophenyl-diethylphosphate (paraoxon)
and 4-nitrophenyl 2-propyl methylphosphonate (MPNP).
5
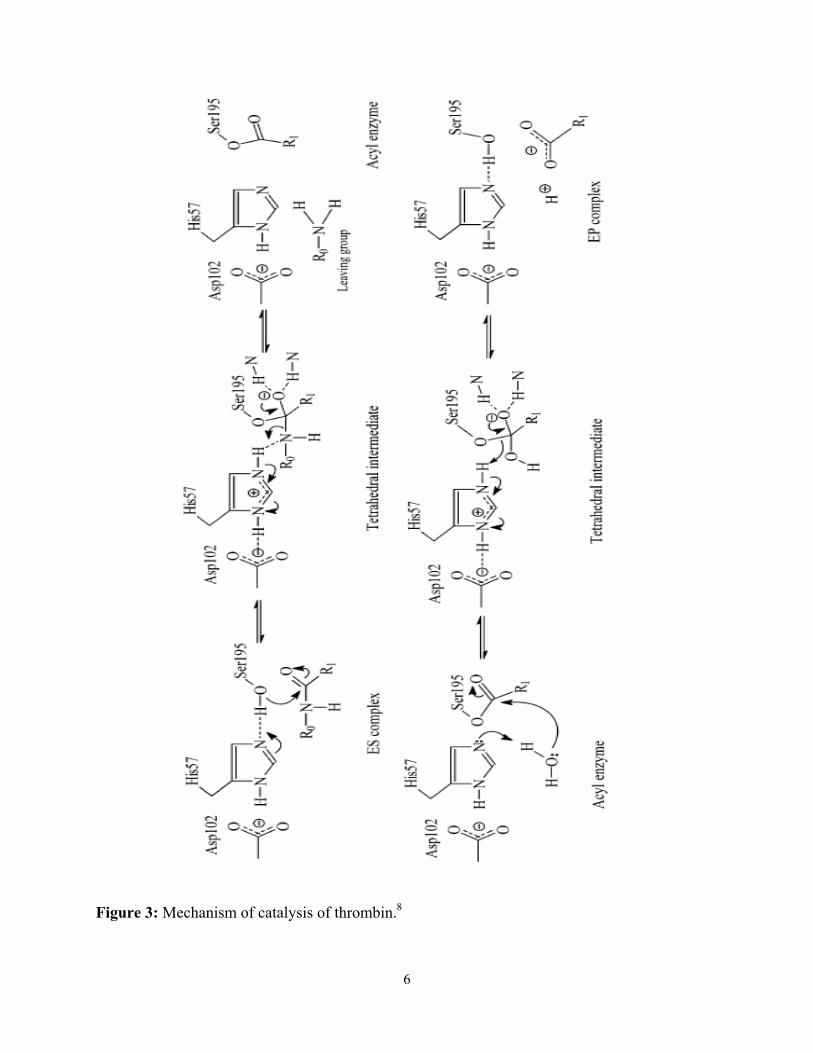
Figure 3: Mechanism of catalysis of thrombin.8
6
Figure 4: 4-nitrophenyl-diethylphosphate (left) and 4-nitrophenyl 2-propyl methylphosphonate
(right).
Hirudin Structure and Inhibition.
Hirudin, derived from Hirudo medicinalis, is the most potent known naturally occurring inhibitor
of thrombin. It is a single sixty-five residue amino acid chain, with a C-terminal glutamine and
an N-terminal isoleucine.2 Its primary structure is displayed in Figure 5. Hirudin has two
dominant regions: a compact “head” at the N terminus, and a long flexible C-terminal tail. The
“head” region contains three disulfide bridges, between cysteine residues at the six and
fourteenth, sixteenth and twenty-eighth, and twenty-second and thirty-ninth positions, the latter
two of which form the characteristic “double loop”. 2 The “tail” region runs from fortieth to
sixty-fifth residues and, in contrast to the head, is unbound and flexible.
7
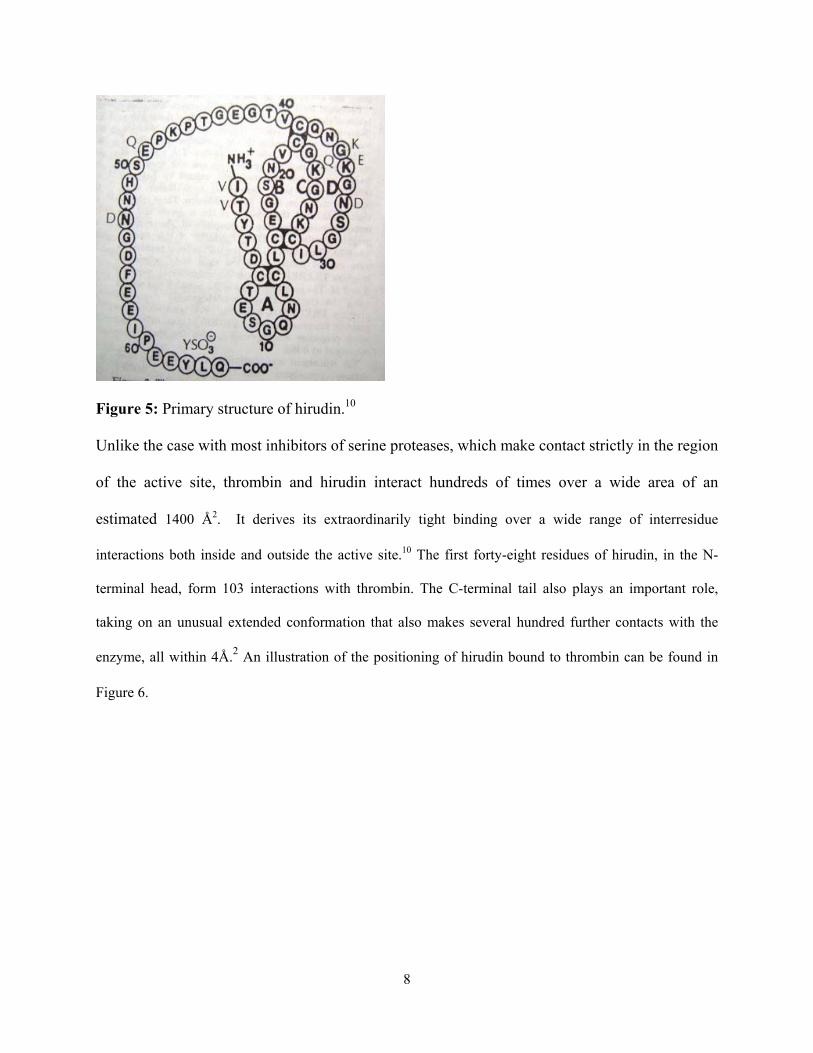
Figure 5: Primary structure of hirudin.10
Unlike the case with most inhibitors of serine proteases, which make contact strictly in the region
of the active site, thrombin and hirudin interact hundreds of times over a wide area of an
estimated 1400 Å2. It derives its extraordinarily tight binding over a wide range of interresidue
interactions both inside and outside the active site.10 The first forty-eight residues of hirudin, in the N-
terminal head, form 103 interactions with thrombin. The C-terminal tail also plays an important role,
taking on an unusual extended conformation that also makes several hundred further contacts with the
enzyme, all within 4Å.2 An illustration of the positioning of hirudin bound to thrombin can be found in
Figure 6.
8
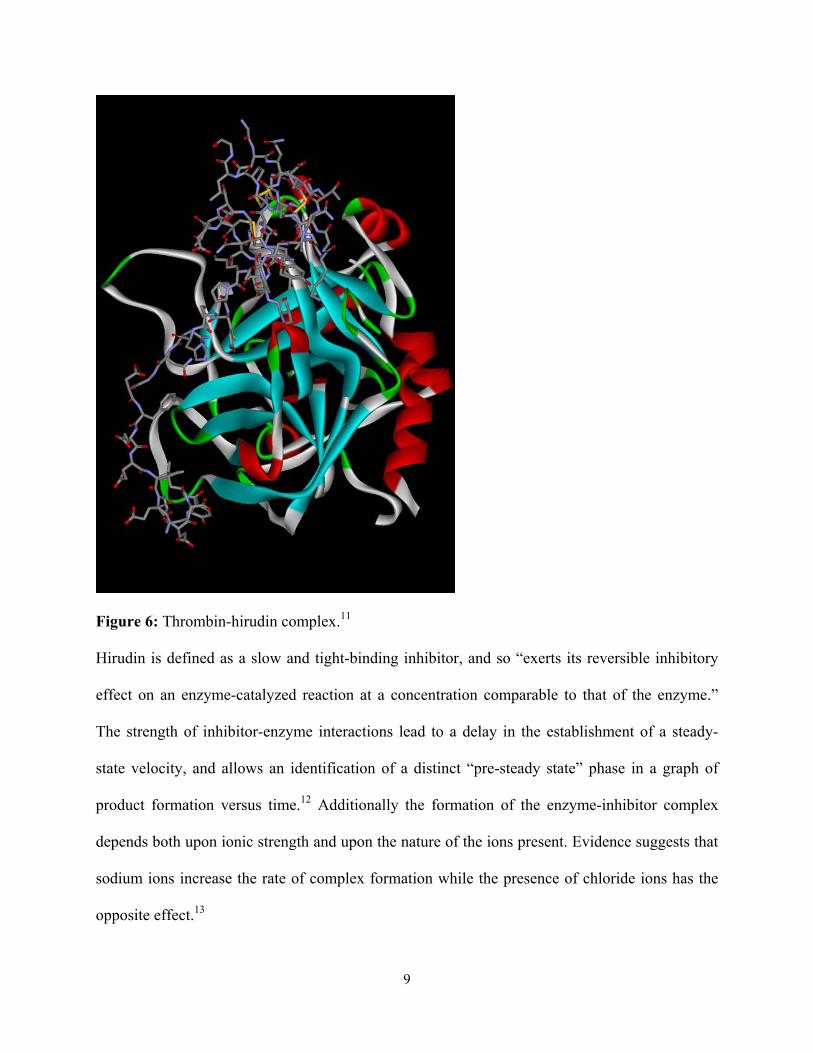
Figure 6: Thrombin-hirudin complex.11
Hirudin is defined as a slow and tight-binding inhibitor, and so “exerts its reversible inhibitory
effect on an enzyme-catalyzed reaction at a concentration comparable to that of the enzyme.”
The strength of inhibitor-enzyme interactions lead to a delay in the establishment of a steady-
state velocity, and allows an identification of a distinct “pre-steady state” phase in a graph of
product formation versus time.12 Additionally the formation of the enzyme-inhibitor complex
depends both upon ionic strength and upon the nature of the ions present. Evidence suggests that
sodium ions increase the rate of complex formation while the presence of chloride ions has the
opposite effect.13
9
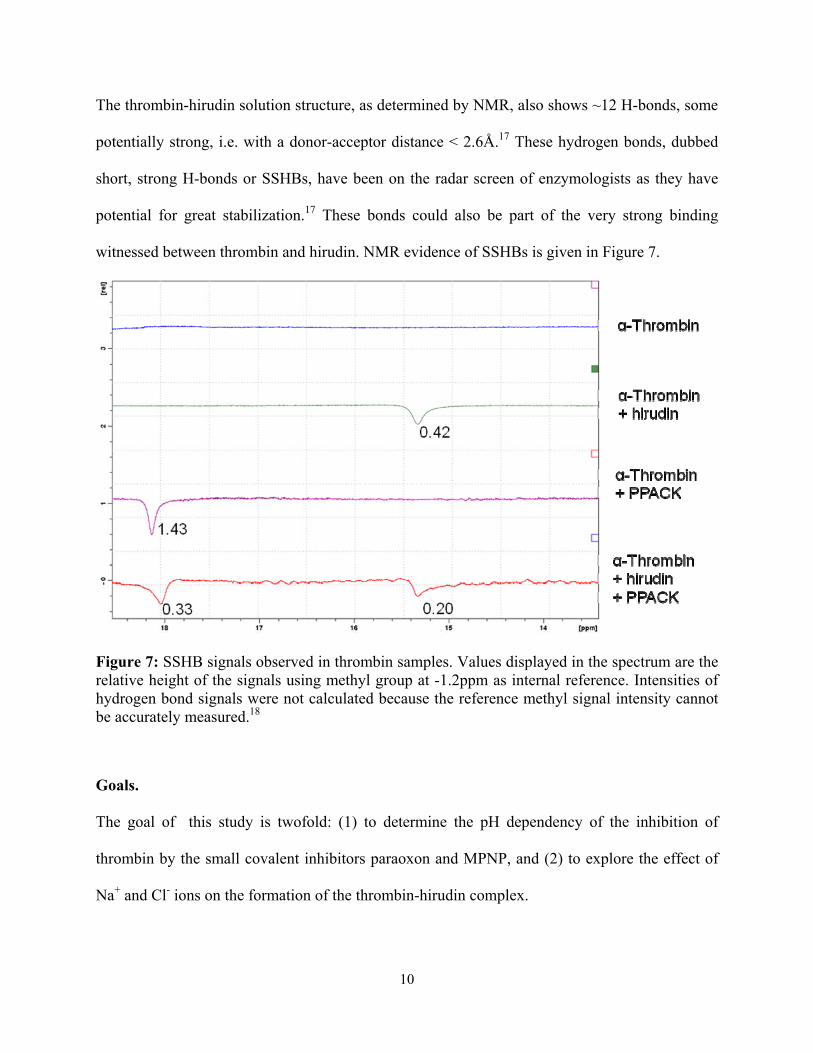
The thrombin-hirudin solution structure, as determined by NMR, also shows ~12 H-bonds, some
potentially strong, i.e. with a donor-acceptor distance < 2.6Å.17 These hydrogen bonds, dubbed
short, strong H-bonds or SSHBs, have been on the radar screen of enzymologists as they have
potential for great stabilization.17 These bonds could also be part of the very strong binding
witnessed between thrombin and hirudin. NMR evidence of SSHBs is given in Figure 7.
Figure 7: SSHB signals observed in thrombin samples. Values displayed in the spectrum are the relative height of the signals using methyl group at -1.2ppm as internal reference. Intensities of hydrogen bond signals were not calculated because the reference methyl signal intensity cannot be accurately measured.18
Goals.
The goal of this study is twofold: (1) to determine the pH dependency of the inhibition of
thrombin by the small covalent inhibitors paraoxon and MPNP, and (2) to explore the effect of
Na+ and Cl- ions on the formation of the thrombin-hirudin complex.
10
Materials and Methods.
Materials.
Anhydrous dimethyl sulfoxide (DMSO), heavy water with 99.9 % deuterium content and
anhydrous methanol, were purchased from Aldrich Chemical Co. All buffer salts were reagent
grade and were purchased from either Aldrich, Fisher, or Sigma Chemical Co. H-D-Phe-Pip-
Arg-4-nitroanilide.HCl (pNA) (S-2238) 99% (TLC) was purchased from Diapharma Group Inc.
4-Nitrophenyl diethylphosphate (paraoxon) was from Aldrich Chemical Co. and 4-nitrophenyl-2-
propyl methylphosphonate (MPNP) was synthesized in this lab previously. Human -thrombin,
MM 36,500 d, 3010 NIH u/mg activity in pH 6.5, 0.05 M sodium citrate buffer, 0.2 M NaCl,
0.1% PEG-8000 was purchased from Enzyme Research Laboratories. R-hirudin was purchased
from Pentapharm, Lot 40907401/126-05 and Lot 405383/126-05.
Solutions.
Buffer solutions were prepared from the appropriate analytical grade salts using double distilled
deionized water. Buffers were prepared by weight from Tris-base and Tris-HCl at 0.02 M, 0.3 M
NaCl, 0.1% PEG4000 at pH 8.0. Buffers for pH profile studies were 0.05 M of the respective
buffer salt and 0.15 M of NaCl with 0.1% PEG-4000 added. Calculated amounts of HCl or
NaOH were used to adjust the buffer pH as necessary. Buffers for pH-dependence studies were
made in 0.05 M concentration as follows; phosphate for pH 6.03 - 7.47, citrate for pH 6.52,
HEPES for pH 7.49 - 7.79 and barbital for pH 8.07 and 8.54, while 0.02 M Tris was used for pH
8.28. Buffers for the study of hirudin-thrombin interaction were prepared at 0.02 M Tris, ionic
strength µ = 0.3 M, 0.1% PEG-4000 at pH ~8.1. The salts used were NaCl, Choline Cl, Na
Acetate, and Choline Acetate. D2O buffers were prepared by weight using the same protocol as
11
their respective H2O counterparts. All measurements of pH were taken with a Delta electronic
pH meter.
Instrumentation.
Spectrophotometric measurements were performed with a Perkin-Elmer Lambda 6 UV-Vis
Spectrophotometer interfaced to a PC. Temperature was monitored via a temperature probe and
linked digital readout. Temperature control was maintained using a Neslab RTE-4 or a Lauda 20
circulating water bath. All studies were performed at 25.0 + 0.1oC.
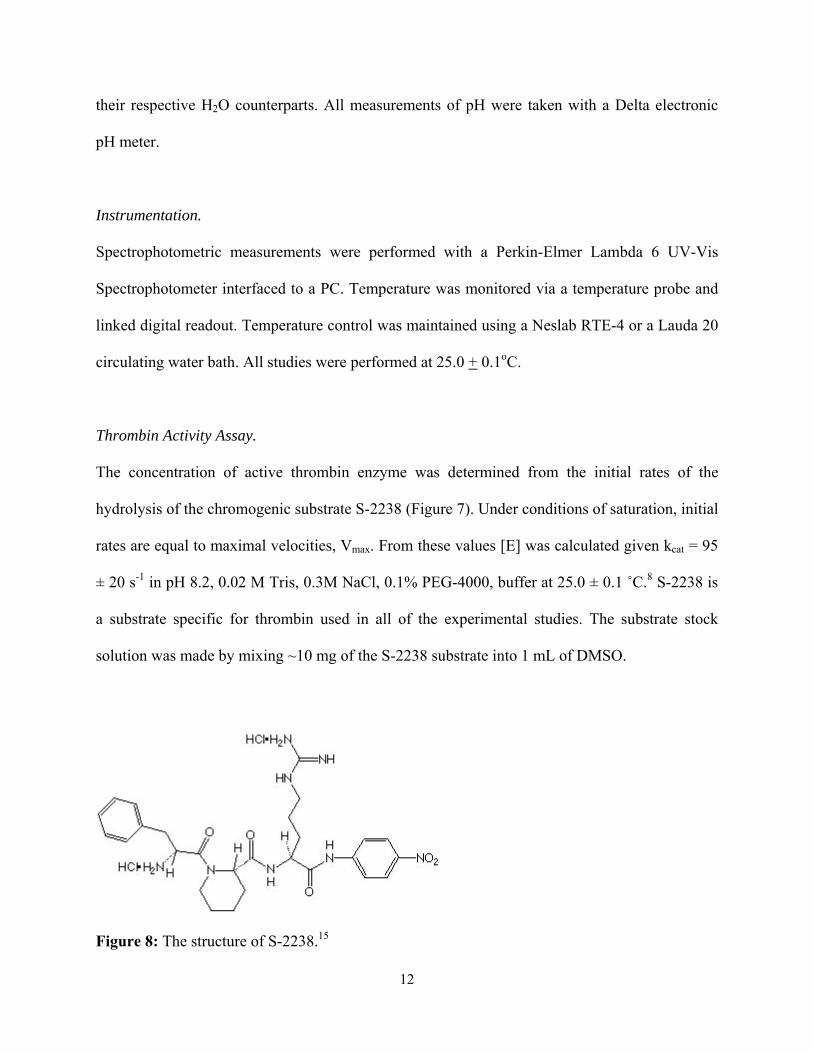
Thrombin Activity Assay.
The concentration of active thrombin enzyme was determined from the initial rates of the
hydrolysis of the chromogenic substrate S-2238 (Figure 7). Under conditions of saturation, initial
rates are equal to maximal velocities, Vmax. From these values [E] was calculated given kcat = 95
± 20 s-1 in pH 8.2, 0.02 M Tris, 0.3M NaCl, 0.1% PEG-4000, buffer at 25.0 ± 0.1 ˚C.8 S-2238 is
a substrate specific for thrombin used in all of the experimental studies. The substrate stock
solution was made by mixing ~10 mg of the S-2238 substrate into 1 mL of DMSO.
Figure 8: The structure of S-2238.15
12
Kinetic Procedure: Inhibition by Paraoxon, MPNP.
In a typical spectrophotometric run, 190 μL of thrombin at the desired pH was drawn and 10 μL
of 0.14 M inhibitor solution added. This reaction mixture was incubated under temperature
control. At each indicated time interval, 10 μL aliquots were drawn, and the reaction was
quenched by dilution into a cuvette containing 980 μL pH 8.00, 0.05M barbital buffer. Ten μL S-
2238 was added and the cell inverted several times to initiate the reaction. Kinetic runs were
followed by monitoring the absorbance of the released 4-nitroanaline at 400 nm. Pseudo-first-
order rate constants for inhibition were calculated from the 5s slopes for declining activities for 4
half-lives. The second-order rate constants were calculated from kobs divided by the
concentration of inhibitor.
Kinetic Procedure: Inhibition by Hirudin.
Each individual set of kinetic data was collected in a single contiguous session under strict
temperature control. Glass cuvettes were incubated in the cell compartment for ten minutes prior
to their use in a run in order to allow the temperature to equilibrate prior to the addition of
reagents. During this time the instrument was “zeroed” so that all measured absorbance would be
a product of the released 4-nitroaniline, measured at 400 nm. The enzyme and inhibitor, once
diluted to the desired concentration, was aliquoted and frozen separately in order to preserve
enzyme activity during the course of a given session. The order of addition to the glass cuvette
involved the appropriate amount of buffer, 10 µL substrate, 5-15 µL inhibitor, and finally 10 µL
enzyme, to a total volume of 1 mL. The lapse in seconds between this addition of enzyme and
the commencement of the kinetic run was recorded. Change in absorbance was followed for ~
1200 seconds.
13
The concentration of active hirudin in the stock solution was independently determined. 5-10 µL
5.67 x 10⁻⁸ M hirudin (this concentration was determined as a result of this process) and 50 µL
2.48 x 10⁻⁸ M thrombin were combined in a single glass cuvette such that the thrombin was in
significant excess over hirudin, and allowed to incubate until full inhibition was reached. The
activity of the remaining (uninhibited) thrombin was assayed by the addition of 10 µL substrate
and 965-970 µL buffer. The difference between the remaining activity and that of the original
thrombin stock was taken as the concentration of hirudin in the stock solution. These
independently determined values were compared with the hirudin activity value, x, calculated
during data analysis of hirudin-thrombin inhibition. In most cases the activity value x fell within
a range from 0.7-0.9, signifying 70%-90% activity of the calculated value, which was verified by
the independent determination.
Data Analysis.
Mechanism Scheme: Inhibition by Paraoxon, MPNP.
The irreversible inhibition of thrombin by covalent inhibitors, such as paraoxon and MPNP, can
be modeled as:
Ki-1 ki
E + I EI EI* Equation 116
Here Ki is an equilibrium constant, koff/kon. The rate constant of the association of enzyme and
inhibitor, by which the enzyme-inhibitor complex (EI) is formed, is kon; the rate constant of the
disassociation of this complex is koff. The first-order rate constant for the formation of the bond
resulting in the covalently modified thrombin (EI*) is ki. Observed rate constants were
determined by an exponential decay fit of the initial rates of each aliquot from the reaction
14
mixture. The pKas were determined by a double-bell curve fit of these pseudo-first-order rate
constants using the equation:
kobs = L/(1 + 10(pK1 – pH) + 10(pH – pK2)) Equation 2
at NaCl 0.15 M and 25.0 ± 0.1oC. This fitting was performed using GraFit 5.
Mechanism Scheme: Inhibition by Hirudin.
The reaction scheme which describes this inhibition takes into account the reversible inhibition
of thrombin in the presence of a substrate and is described by two steps: enzyme-substrate
complex formation, and the formation of product and free enzyme.
Km ko
Equation 3 E + S ES E + P
k -1
I
k1
EI
+
The formation of product vs. time is described by the equation
P= vst + (vs-vo)(1-d)/(dk)*log((1-de-kt)/(1-d)) Equation 412,13
where vs is the steady state reaction velocity, vo is the reaction velocity in the absence of
inhibitor, t is time, P is the amount of product formed, and d is a function equivalent to (Ki+Et+It-
((Ki+Et+It)2-4EtIt)
1/2)/(Ki+Et+It+((Ki+Et+It)2-4EtIt)
1/2). Here, Ki is the dissociation constant, Et is
the concentration of all enzyme present in solution, It is the concentration of all inhibitor present
in the solution, and k is a pseudo first-order rate constant, which is equivalent to
15
k1((Ki+Et+It)2-4EtIt)
1/2/(1+[S]/Km). Here, k1 is the forward second-order kinetic constant for
inhibition and [S] is the concentration of substrate.
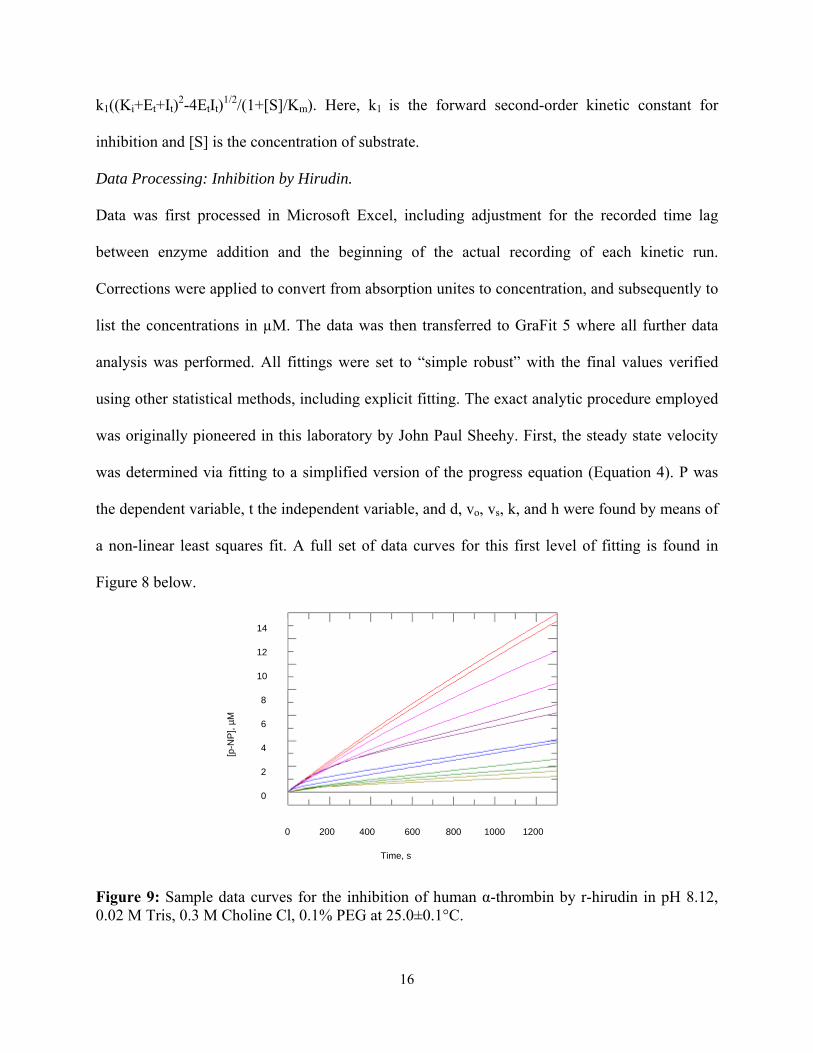
Data Processing: Inhibition by Hirudin.
Data was first processed in Microsoft Excel, including adjustment for the recorded time lag
between enzyme addition and the beginning of the actual recording of each kinetic run.
Corrections were applied to convert from absorption unites to concentration, and subsequently to
list the concentrations in µM. The data was then transferred to GraFit 5 where all further data
analysis was performed. All fittings were set to “simple robust” with the final values verified
using other statistical methods, including explicit fitting. The exact analytic procedure employed
was originally pioneered in this laboratory by John Paul Sheehy. First, the steady state velocity
was determined via fitting to a simplified version of the progress equation (Equation 4). P was
the dependent variable, t the independent variable, and d, vo, vs, k, and h were found by means of
a non-linear least squares fit. A full set of data curves for this first level of fitting is found in
Figure 8 below.
4
14
12
10
8
6
[p-N
P],
µM
2
400 600 800 1200 1000
Time, s
200 0
0
Figure 9: Sample data curves for the inhibition of human α-thrombin by r-hirudin in pH 8.12, 0.02 M Tris, 0.3 M Choline Cl, 0.1% PEG at 25.0±0.1°C.
16
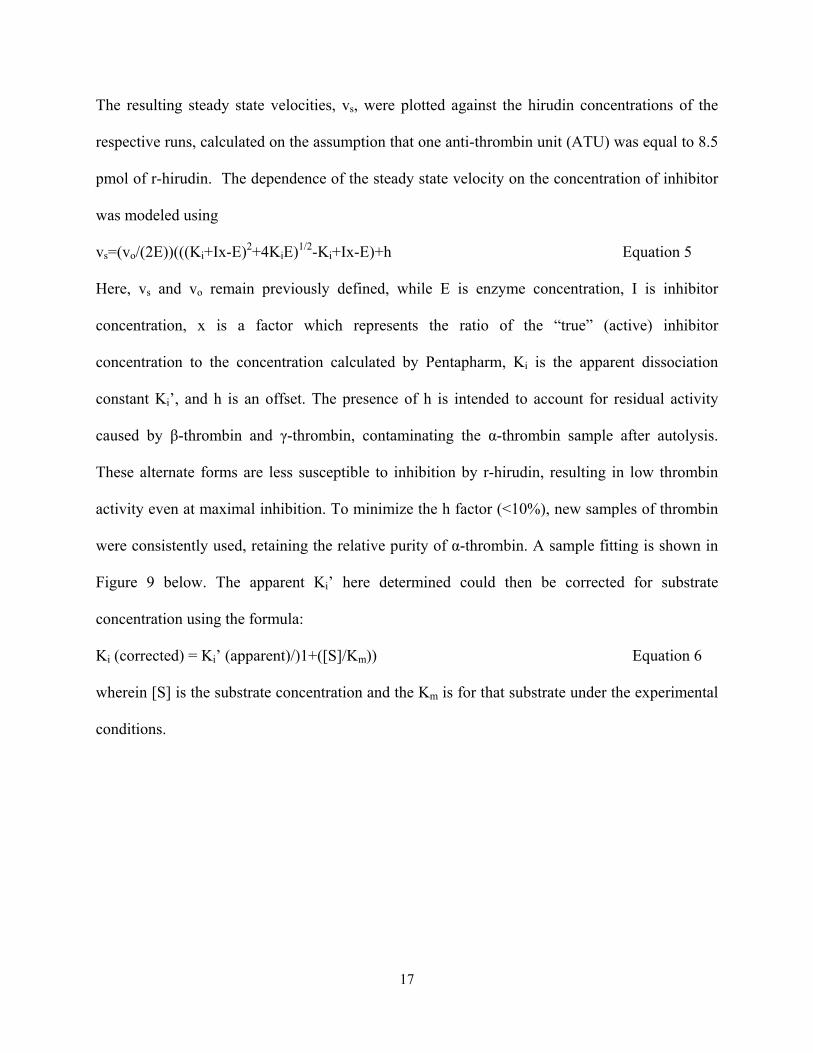
The resulting steady state velocities, vs, were plotted against the hirudin concentrations of the
respective runs, calculated on the assumption that one anti-thrombin unit (ATU) was equal to 8.5
pmol of r-hirudin. The dependence of the steady state velocity on the concentration of inhibitor
was modeled using
vs=(vo/(2E))(((Ki+Ix-E)2+4KiE)1/2-Ki+Ix-E)+h Equation 5
Here, vs and vo remain previously defined, while E is enzyme concentration, I is inhibitor
concentration, x is a factor which represents the ratio of the “true” (active) inhibitor
concentration to the concentration calculated by Pentapharm, Ki is the apparent dissociation
constant Ki’, and h is an offset. The presence of h is intended to account for residual activity
caused by β-thrombin and γ-thrombin, contaminating the α-thrombin sample after autolysis.
These alternate forms are less susceptible to inhibition by r-hirudin, resulting in low thrombin
activity even at maximal inhibition. To minimize the h factor (<10%), new samples of thrombin
were consistently used, retaining the relative purity of α-thrombin. A sample fitting is shown in
Figure 9 below. The apparent Ki’ here determined could then be corrected for substrate
concentration using the formula:
Ki (corrected) = Ki’ (apparent)/)1+([S]/Km)) Equation 6
wherein [S] is the substrate concentration and the Km is for that substrate under the experimental
conditions.
17
109 [Hir], M
0 2000 4000 6000
10
3 v
s
0.40.60.8
11.21.41.61.8
22.22.42.62.8
33.2
Figure 10: Sample Ki determination curve for the inhibition of human α-thrombin by r-hirudin in pH 8.12, 0.02 M Tris, 0.3 M Choline Cl, 0.1% PEG at 25.0±0.1°C.
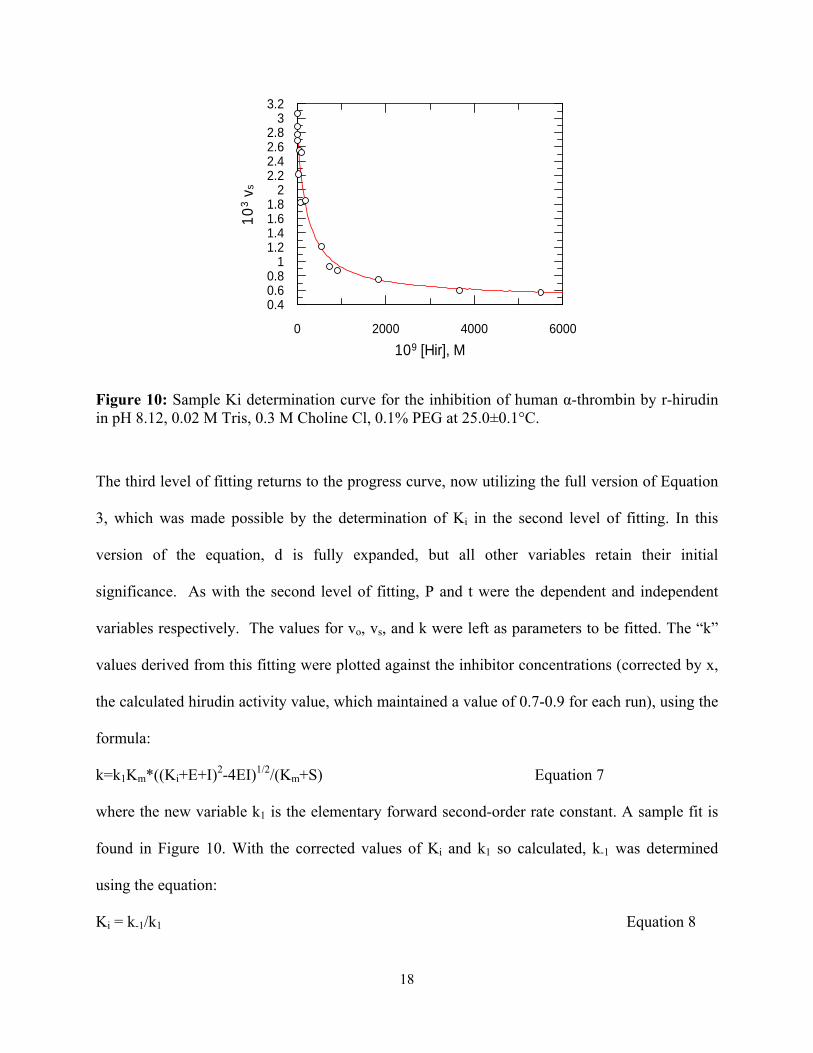
The third level of fitting returns to the progress curve, now utilizing the full version of Equation
3, which was made possible by the determination of Ki in the second level of fitting. In this
version of the equation, d is fully expanded, but all other variables retain their initial
significance. As with the second level of fitting, P and t were the dependent and independent
variables respectively. The values for vo, vs, and k were left as parameters to be fitted. The “k”
values derived from this fitting were plotted against the inhibitor concentrations (corrected by x,
the calculated hirudin activity value, which maintained a value of 0.7-0.9 for each run), using the
formula:
k=k1Km*((Ki+E+I)2-4EI)1/2/(Km+S) Equation 7
where the new variable k1 is the elementary forward second-order rate constant. A sample fit is
found in Figure 10. With the corrected values of Ki and k1 so calculated, k-1 was determined
using the equation:
Ki = k-1/k1 Equation 8
18
109 [Hir], M
0 2 4 6 8 10
k, s
-1
0
0.2
0.4
Figure 11: Sample second order rate constant determination for the inhibition of human α-thrombin by r-hirudin in pH 8.12, 0.02 M Tris, 0.3 M Choline Cl, 0.1% PEG at 25.0±0.1°C.
Results and Discussion.
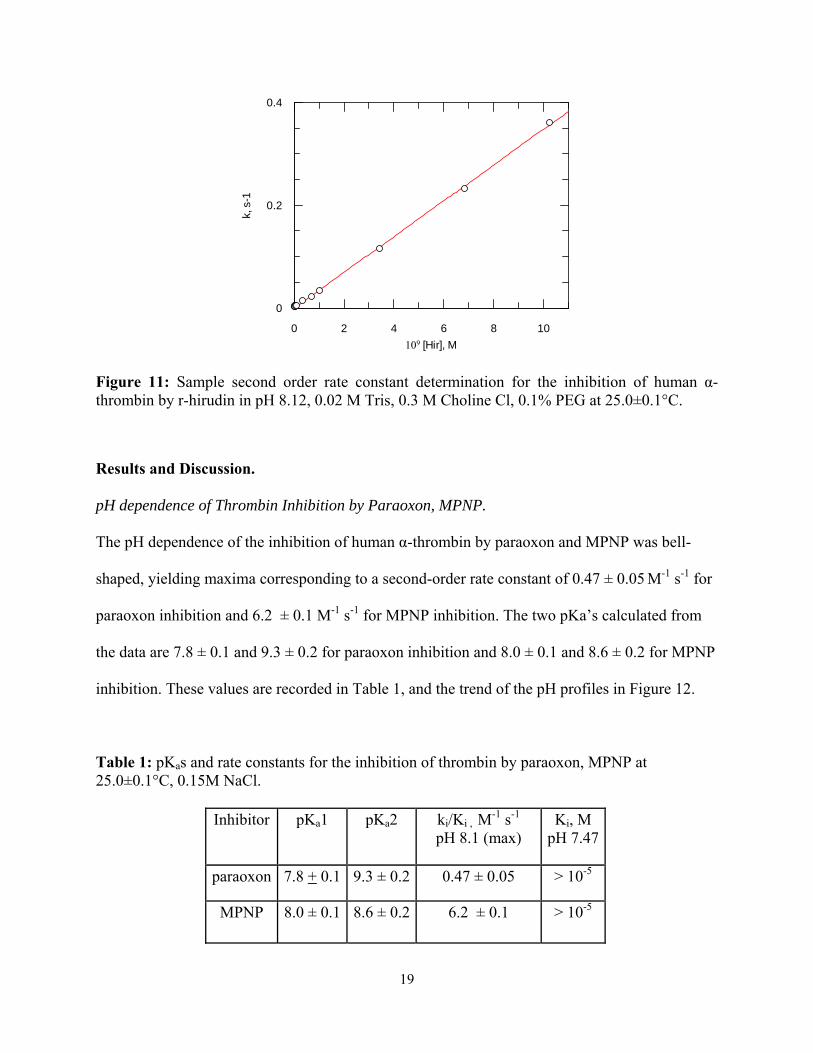
pH dependence of Thrombin Inhibition by Paraoxon, MPNP.
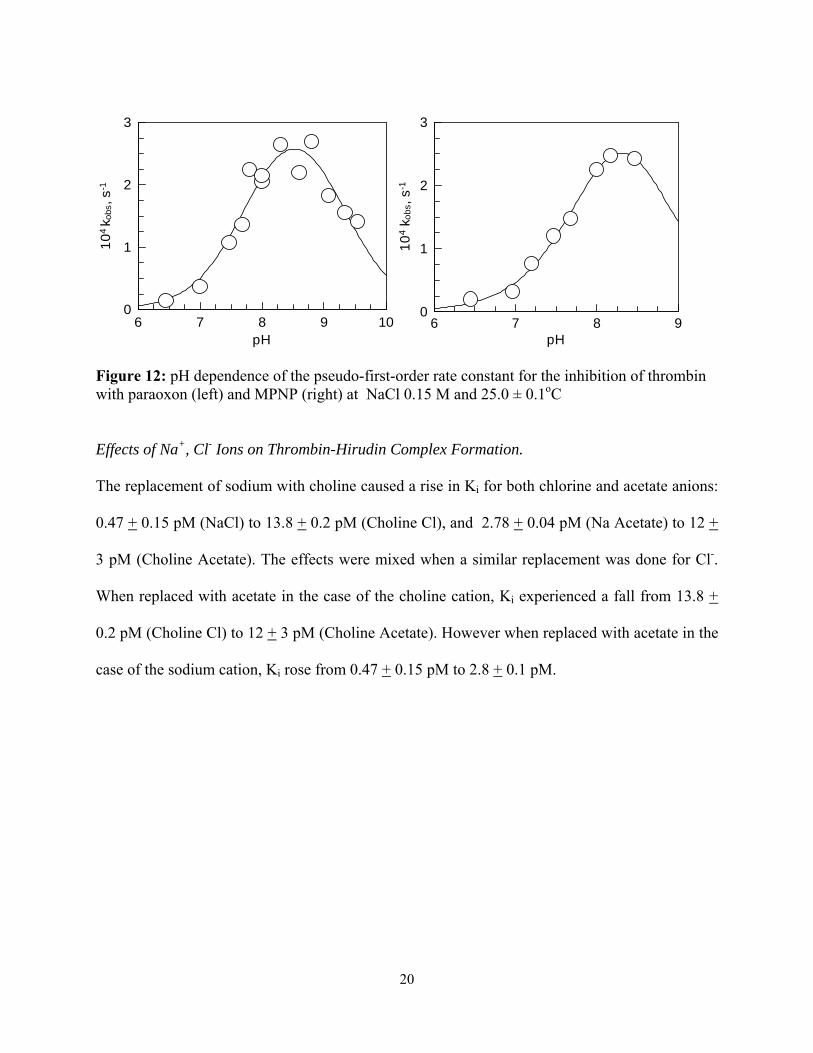
The pH dependence of the inhibition of human α-thrombin by paraoxon and MPNP was bell-
shaped, yielding maxima corresponding to a second-order rate constant of 0.47 ± 0.05 M-1 s-1 for
paraoxon inhibition and 6.2 ± 0.1 M-1 s-1 for MPNP inhibition. The two pKa’s calculated from
the data are 7.8 ± 0.1 and 9.3 ± 0.2 for paraoxon inhibition and 8.0 ± 0.1 and 8.6 ± 0.2 for MPNP
inhibition. These values are recorded in Table 1, and the trend of the pH profiles in Figure 12.
Table 1: pKas and rate constants for the inhibition of thrombin by paraoxon, MPNP at 25.0±0.1°C, 0.15M NaCl.
Inhibitor pKa1 pKa2 ki/Ki , M-1 s-1
pH 8.1 (max) Ki, M
pH 7.47
paraoxon 7.8 + 0.1 9.3 ± 0.2 0.47 ± 0.05 > 10-5
MPNP 8.0 ± 0.1 8.6 ± 0.2 6.2 ± 0.1 > 10-5
19
pH 6 7 8 9 10
10
4 k
obs, s
-1
0
1
2
3
pH6 7 8 9
10
4 k
ob
s, s
-1
0
1
2
3
Figure 12: pH dependence of the pseudo-first-order rate constant for the inhibition of thrombin with paraoxon (left) and MPNP (right) at NaCl 0.15 M and 25.0 ± 0.1oC Effects of Na+, Cl- Ions on Thrombin-Hirudin Complex Formation.
The replacement of sodium with choline caused a rise in Ki for both chlorine and acetate anions:
0.47 + 0.15 pM (NaCl) to 13.8 + 0.2 pM (Choline Cl), and 2.78 + 0.04 pM (Na Acetate) to 12 +
3 pM (Choline Acetate). The effects were mixed when a similar replacement was done for Cl-.
When replaced with acetate in the case of the choline cation, Ki experienced a fall from 13.8 +
0.2 pM (Choline Cl) to 12 + 3 pM (Choline Acetate). However when replaced with acetate in the
case of the sodium cation, Ki rose from 0.47 + 0.15 pM to 2.8 + 0.1 pM.
20
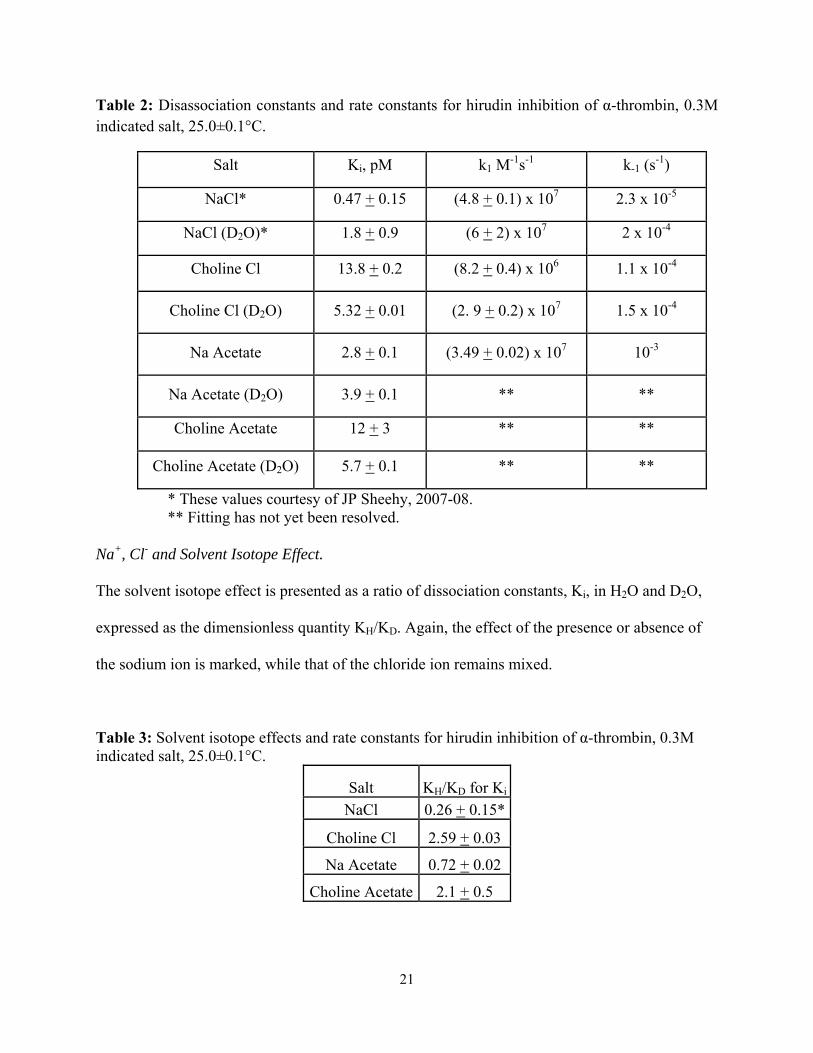
Table 2: Disassociation constants and rate constants for hirudin inhibition of α-thrombin, 0.3M indicated salt, 25.0±0.1°C.
Salt Ki, pM k1 M-1s-1 k-1 (s
-1)
NaCl* 0.47 + 0.15 (4.8 + 0.1) x 107 2.3 x 10⁻⁵
NaCl (D2O)* 1.8 + 0.9 (6 + 2) x 107 2 x 10⁻⁴
Choline Cl 13.8 + 0.2 (8.2 + 0.4) x 106 1.1 x 10⁻⁴
Choline Cl (D2O) 5.32 + 0.01 (2. 9 + 0.2) x 107 1.5 x 10⁻⁴
Na Acetate 2.8 + 0.1 (3.49 + 0.02) x 107 10-3
Na Acetate (D2O) 3.9 + 0.1 ** **
Choline Acetate 12 + 3 ** **
Choline Acetate (D2O) 5.7 + 0.1 ** **
* These values courtesy of JP Sheehy, 2007-08. ** Fitting has not yet been resolved.
Na+, Cl- and Solvent Isotope Effect.
The solvent isotope effect is presented as a ratio of dissociation constants, Ki, in H2O and D2O,
expressed as the dimensionless quantity KH/KD. Again, the effect of the presence or absence of
the sodium ion is marked, while that of the chloride ion remains mixed.
Table 3: Solvent isotope effects and rate constants for hirudin inhibition of α-thrombin, 0.3M indicated salt, 25.0±0.1°C.
Salt KH/KD for Ki
NaCl 0.26 + 0.15*
Choline Cl 2.59 + 0.03
Na Acetate 0.72 + 0.02
Choline Acetate 2.1 + 0.5
21
Conclusions.
pH profiles of Paraoxon and IMN.
The rate of inhibition of thrombin by paraoxon and MPNP is too slow to be of great medical use.
However the pH dependence for the inhibition of human α-thrombin by paraoxon and MPNP
could be elucidated, and proved to be bell-shaped, with maxima at pH values approximating 8.3.
The two determined pKas corresponded with the classically accepted values for His57 and Ile16
on the thrombin enzyme.
Hirudin-Thrombin Ki Dependency on Na+,Cl- Ions.
The dependency of thrombin-hirudin complex formation on ionic strength, as the result of a
decrease in k1, is well documented.13,14 The role of sodium in this interaction has also been
noted, and explored in this study. Replacing sodium in the typical thrombin buffer salt NaCl with
choline cation, Ki experienced a significant 30-fold rise. This change was mirrored when the
chloride was replaced with the anion acetate, though on a smaller scale, with a four-fold rise in
Ki upon substitution of choline for sodium. This suggests that the Na+ ion specifically plays a
significant role in thrombin-hirudin complex formation. There is only mixed evidence, however,
that Cl- plays a lesser, inhibitory, role. These effects did not appear to be mirrored in the
calculated values of k1, given in Table 2. Of additional note is the small magnitude of all
measured values of Ki.
Hirudin-Thrombin SIE Dependency on Na+,Cl- Ions.
A significant difference between the solvent isotope effects in solutions containing the Na+ ion
and those replacing it with choline is evident on the order of magnitude scale. As with the
22
dissociation constant, the effect of the presence or absence of the Cl- ion is mixed, causing a
threefold increase in the presence of the Na+ ion and a marginal decrease when sodium is
replaced by choline.
23
24
References. [1] Bode, W.; Turk, D.; Karshikov, A., Protein Sci. 1992, 1, 426-471 [2] Rydel, T.; Tulinsky, A.; Wolfram, B.; Huber, R. J. Mol. Biol 1991, 221, 583-601. 2000. [3] Berg, J. M.; Tymoczko, J. L.; Stryer, L., Biochemistry. Sixth. 2007. United States, W.H. Freeman and Company [4] Berg, J.M.; Tymoczko, J.L.; Stryer, L. Biochemistry; 6th ed. W.H. Freeman and Company: New York, NY, 2007; p. 293. [5] Berliner, J. L. editor, Thrombin Structure and Function, Plenum Press, New York and London [6] Huntington, J. A., J. Thromb. Haemostasis 2005, 3, 1861-1872 [7] Pineda, A. O.; Carrell, C. J.; Bush, L. A.; Prasad, S.; Caccia, S.; Chen, Z. W.; Mathews, F. S.; Di Cera, E., J. Biol. Chem. 2004, 279, 318-42. [8] Kovach, I. M.; Enyedy, E. J., J. Am. Chem. Soc. 2004, 126, 6017-6024 [9] Kovach, I. M. (2004) J. Phys. Org. Chem. 17, 602-614. [10] Grutter, M.; Priestle, J.; Rahuel, J.; Grossenbacher, H.; Bode, W.; Hofsteenge, J.; Stone, S. The EMBO Journal 1990, 9, 2361-2365. [11] T.J. Rydel et al., Science, 1990, 249, 277 [12] Williams, J.; Morrison, J. Methods of Enzymology 1979, 63, 437-467. [13] Stone, S.R.; Hofsteenge, J. Biochemistry, 1986, 25, 4622-4628. [14] Stone, S. R.; Dennis, S.; Hofsteenge, J. Biochem., 1989, 28, 6857-6863. [15] S-2238; MSDS No. S820324 [Online]; DiaPharma: Columbus, OH, Sep 2004. [16] Kitz, R.; Wilson, I. B. J. Biol. Chem. 1962, 237, 3245-3249. [17] Mildvan, A,S.; Masssiah, M.A,; Harris, T.K.; Marks, G.T.; Harrison, D.H.T.; Viragh, C.; Reddy, P.M.; Kovach, I.M., J. Mol. Struct., 2002, 215, 163-175. [18] Kovach, I.M.; Zhang, D., unpublished results.


![High Redshift - Rijksuniversiteit Groningennobels/presentation_high-z_Nobels.pdf · Weak lensing surveys: Subaru [Hamana et al., 2009] BAO and ELG: BigBOSS [Schlegel et al., 2011]](https://static.fdocument.org/doc/165x107/5f825d5a20277a31dd595250/high-redshift-rijksuniversiteit-nobelspresentationhigh-znobelspdf-weak-lensing.jpg)


![HERMITE AND HERMITE–FEJER INTERPOLATION´ FOR … · 2018. 11. 16. · exhaustive surveys of Gautschi [7], Monegato [14, 15], Ehrich [4], Notaris [18], and Peherstorfer [23] for](https://static.fdocument.org/doc/165x107/61004149fe542029f4452c90/hermite-and-hermiteafejer-interpolation-for-2018-11-16-exhaustive-surveys.jpg)